
Nucleoside Transport and Nucleobase Uptake Null Mutants in Leishmania mexicana for the Routine Expression and Characterization of Purine and Pyrimidine Transporters

 , , , , , , and
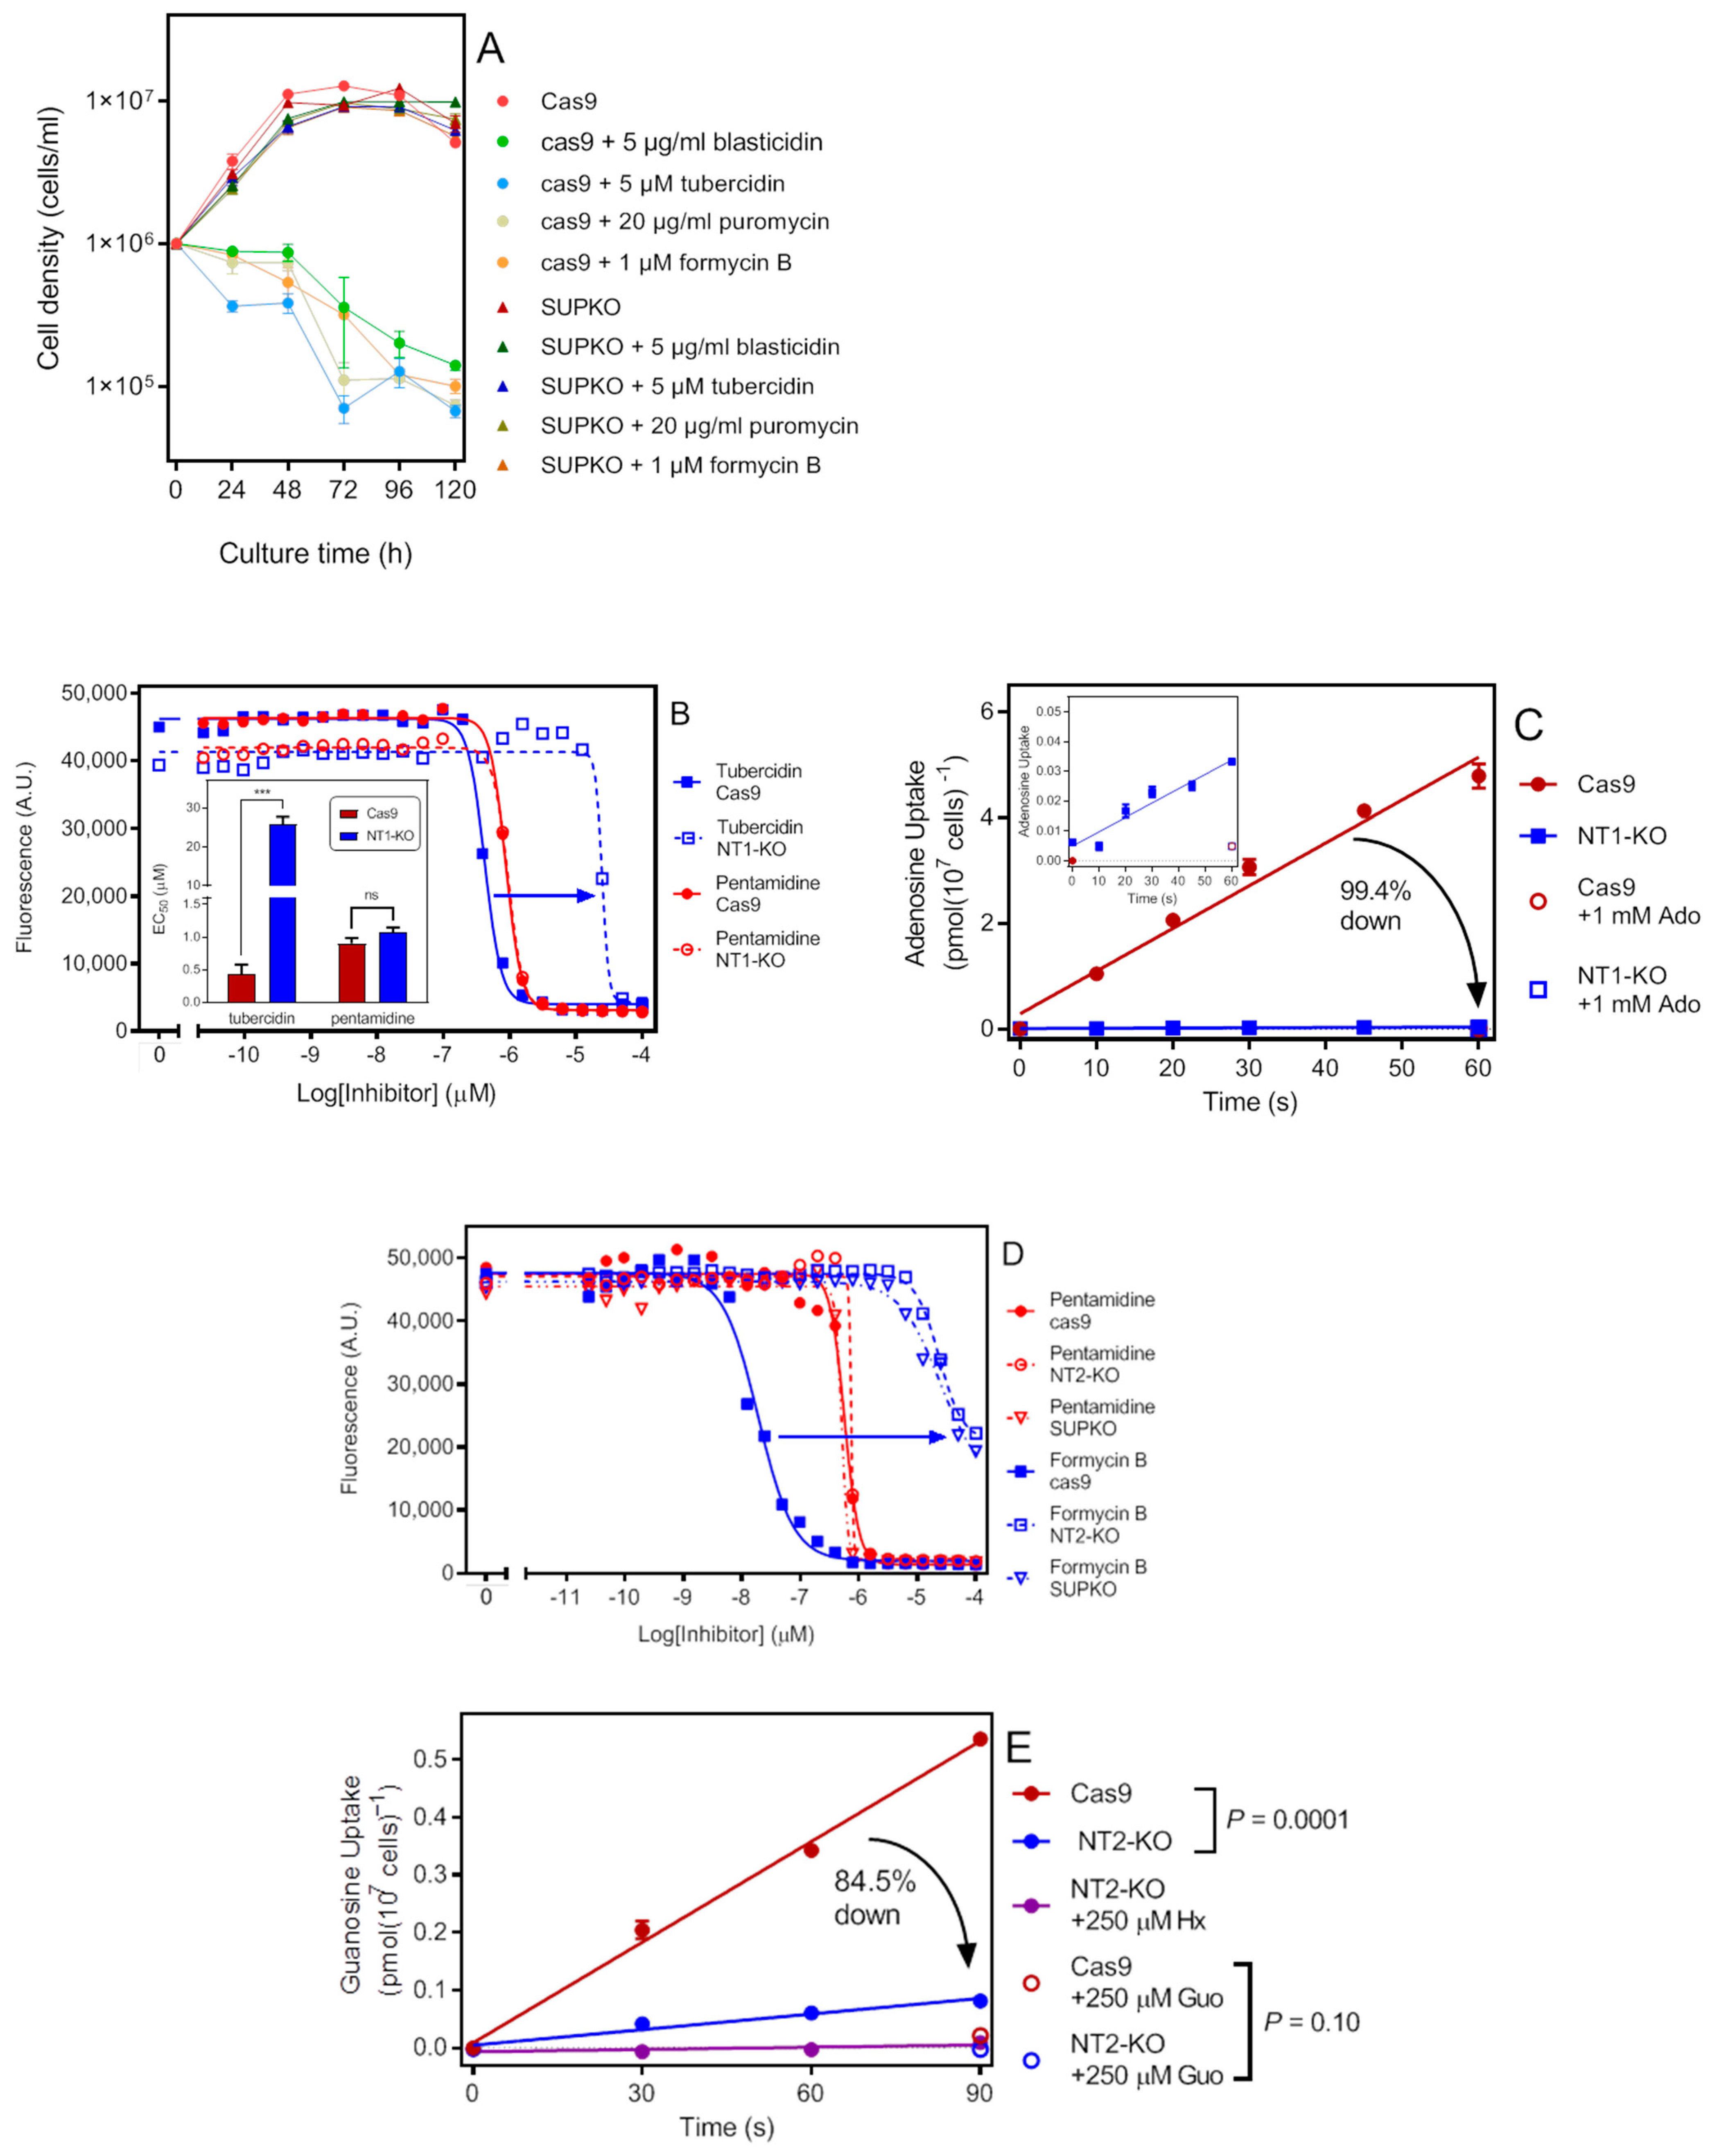
Abstract
:1. Introduction
2. Results
2.1. Construction and Verification of ΔNT1.1/Δ1.2 with a Single Transfection
2.2. Construction and Verification of ΔNT2 with a Single Transfection
2.3. Construction and Verification of Δ(NT1.1/NT1.2/NT2) (SUPKO)
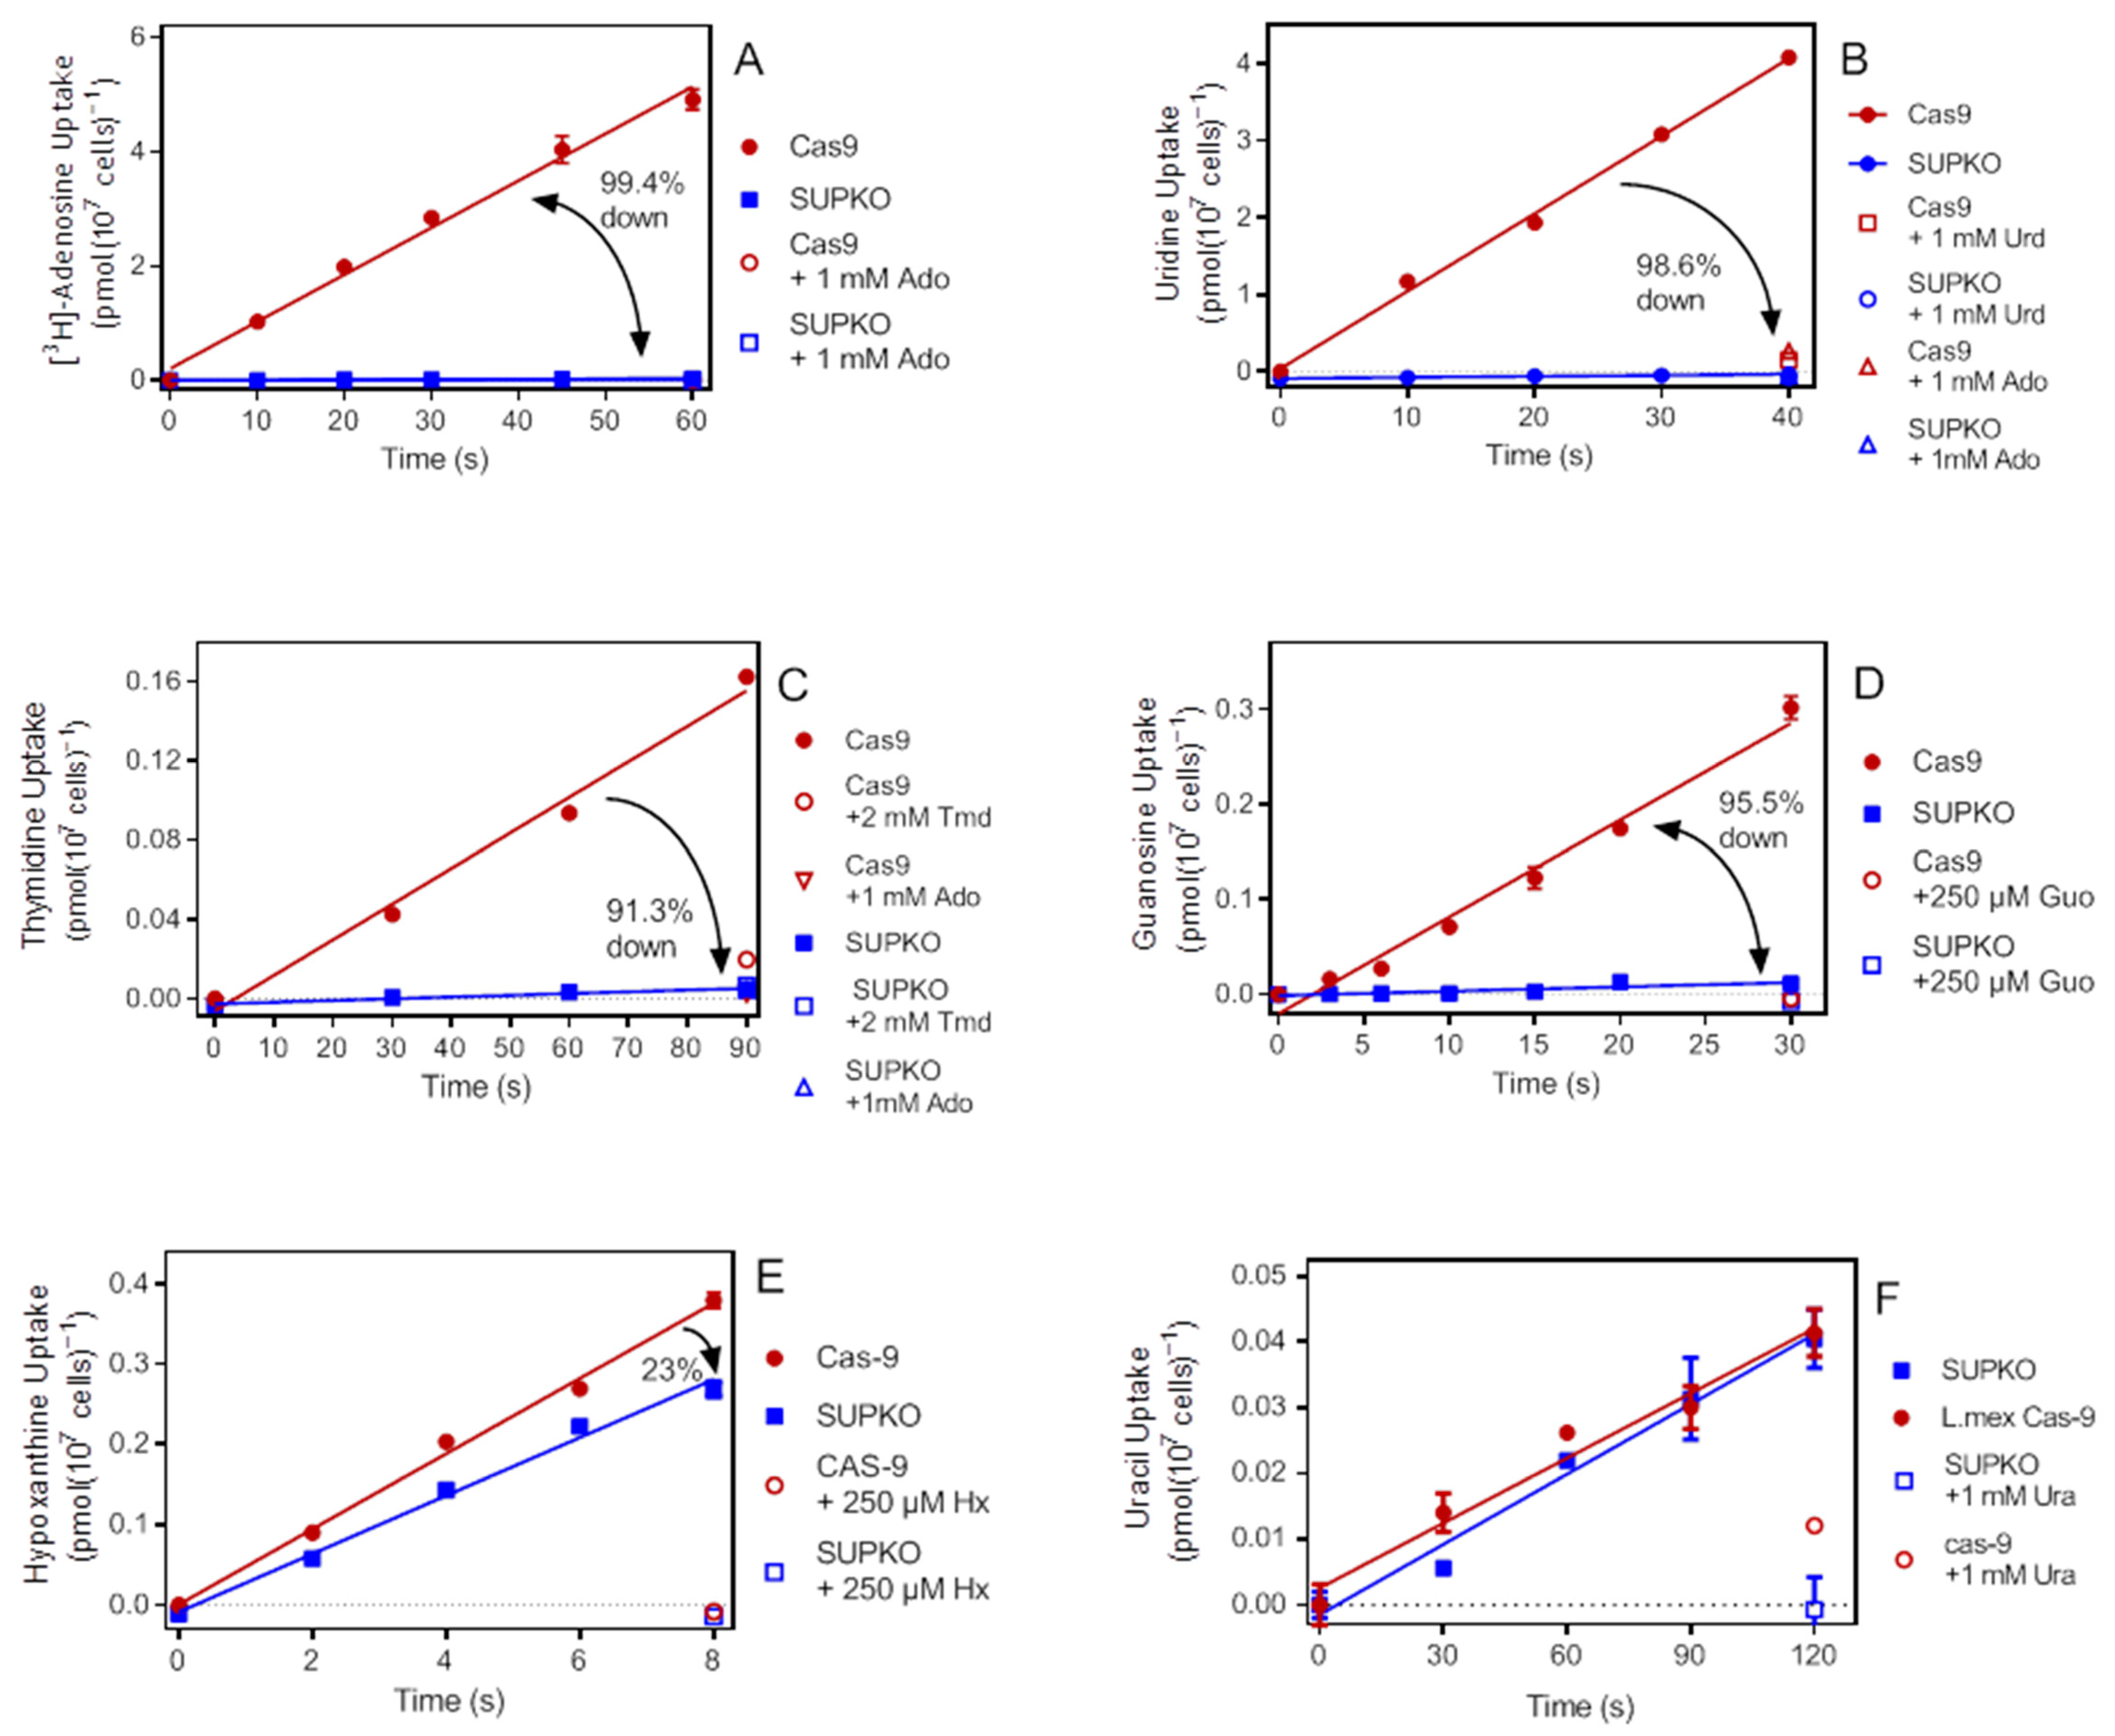
2.4. Characterization of Purine and Pyrimidine Transport in SUPKO
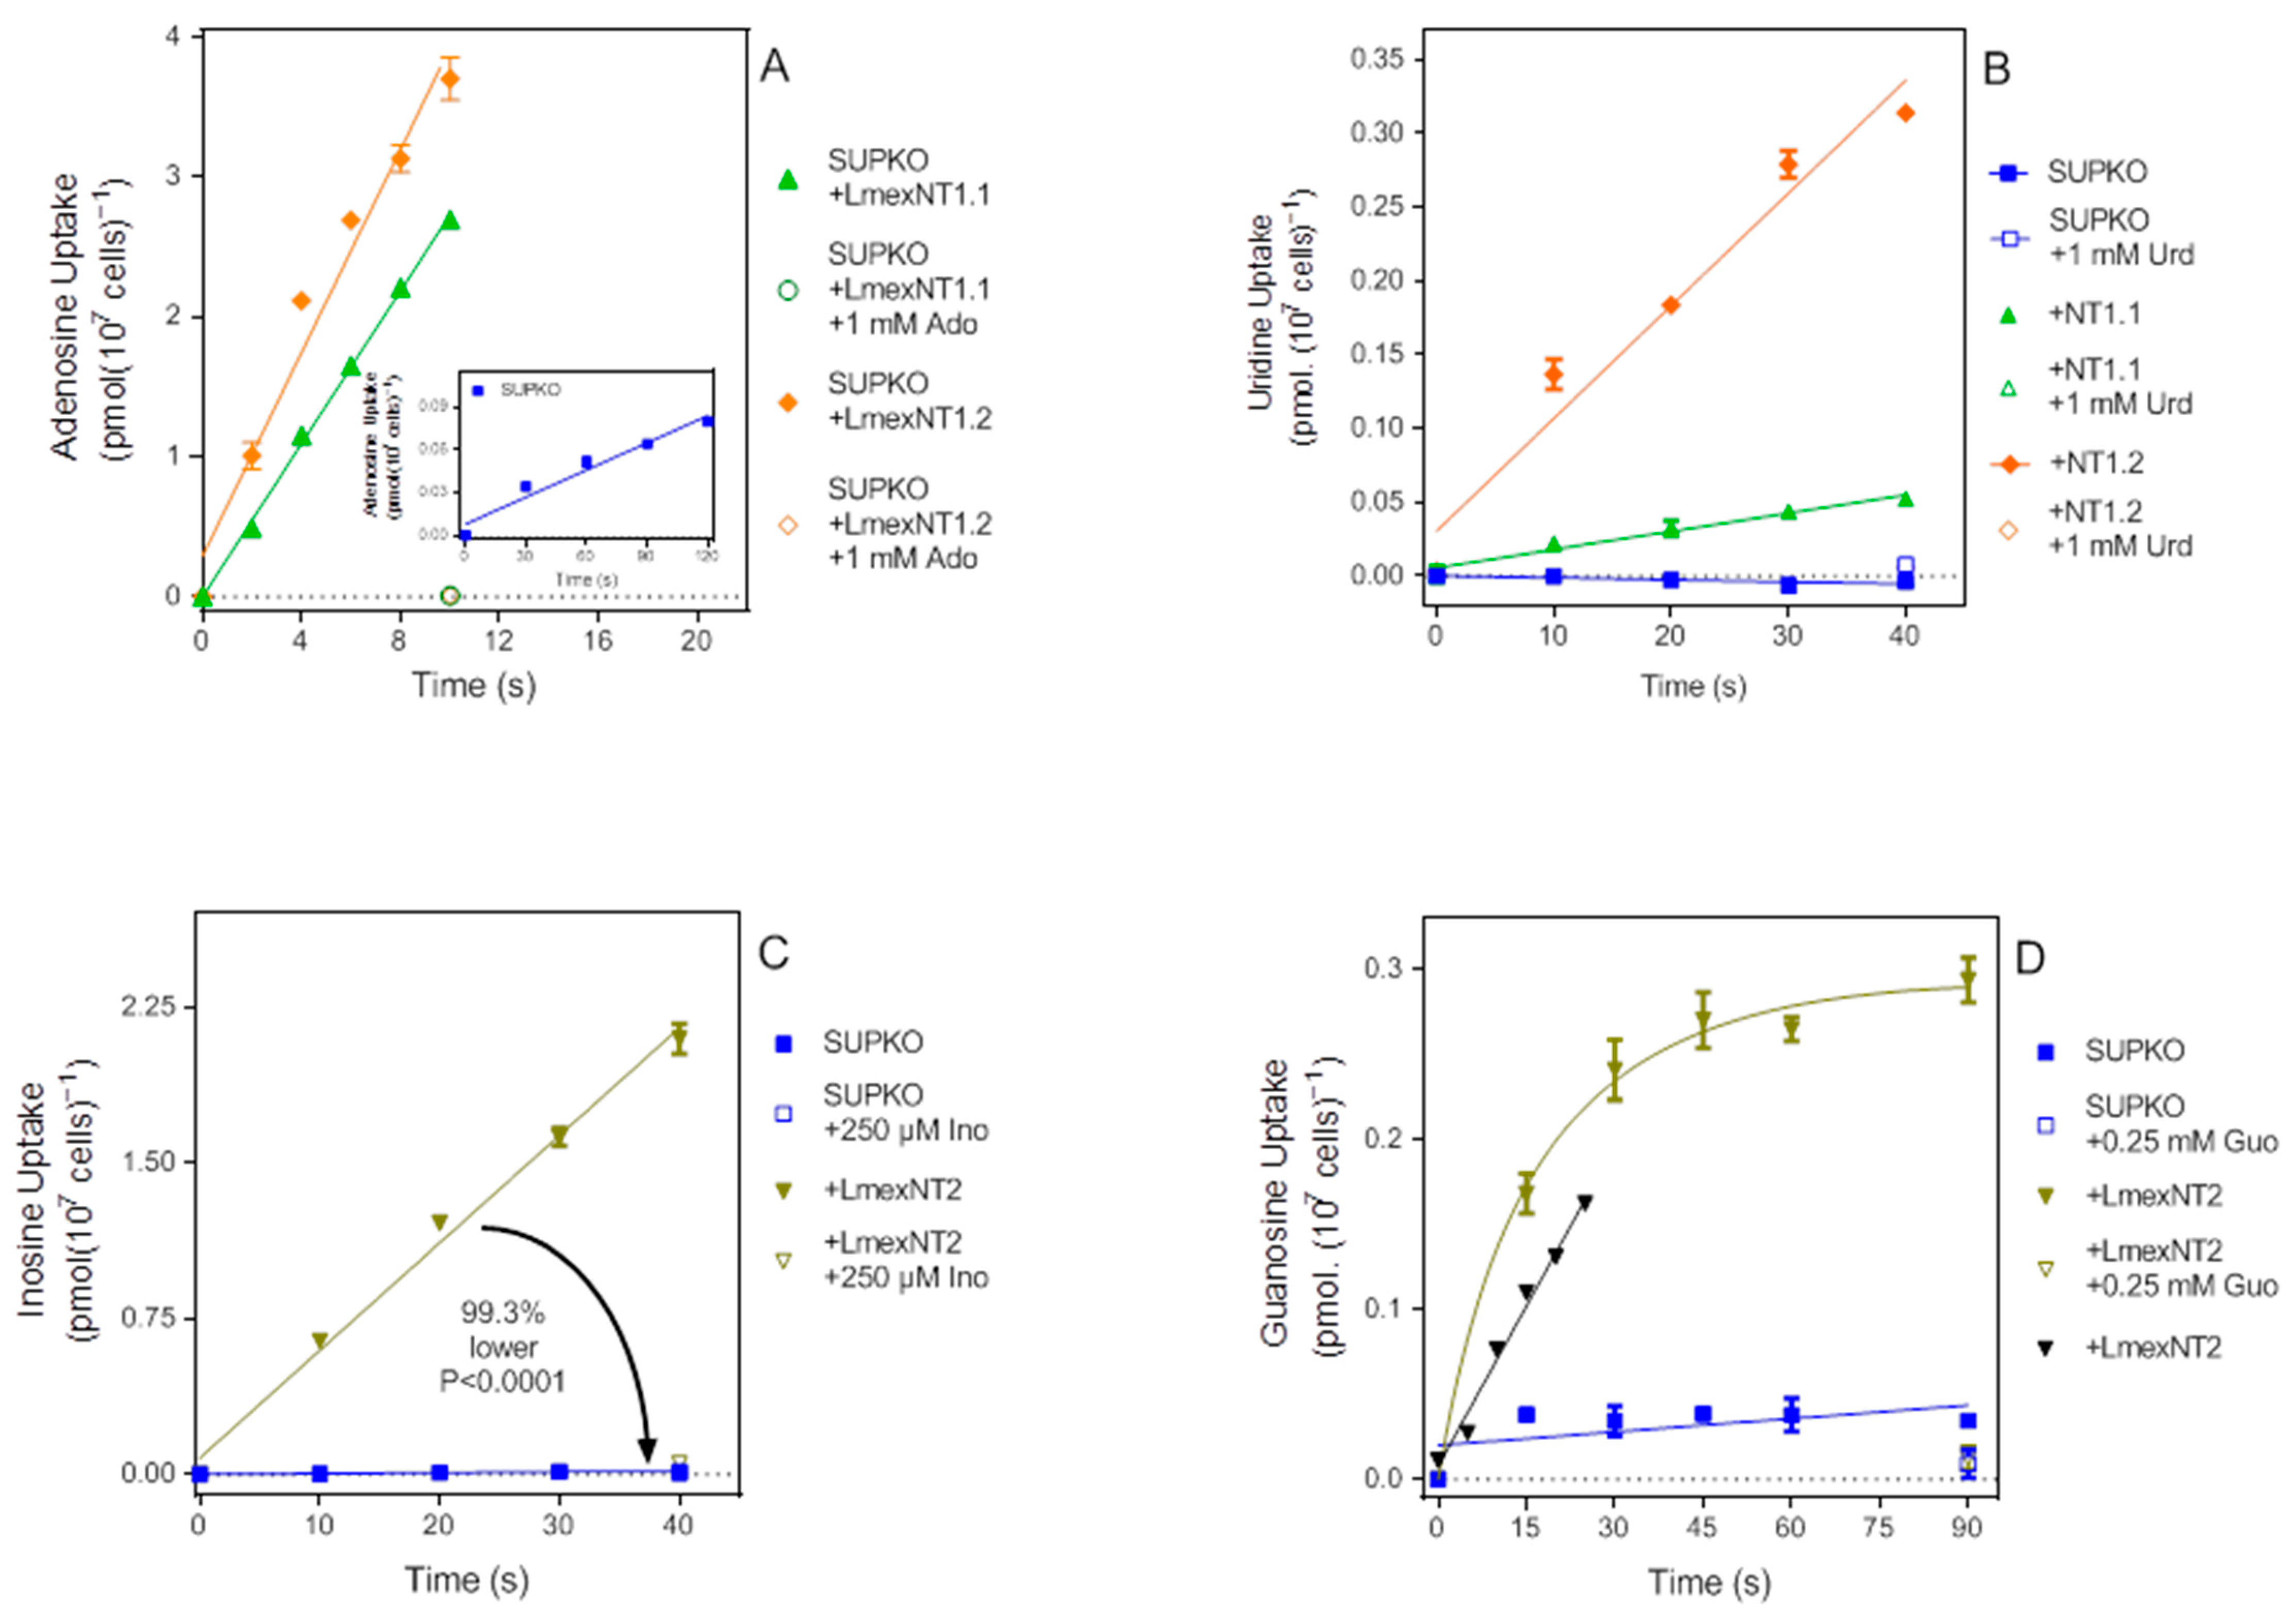
2.5. Re-Expression of Leishmania mexicana NT1.1, NT1.2, and NT2 in SUPKO
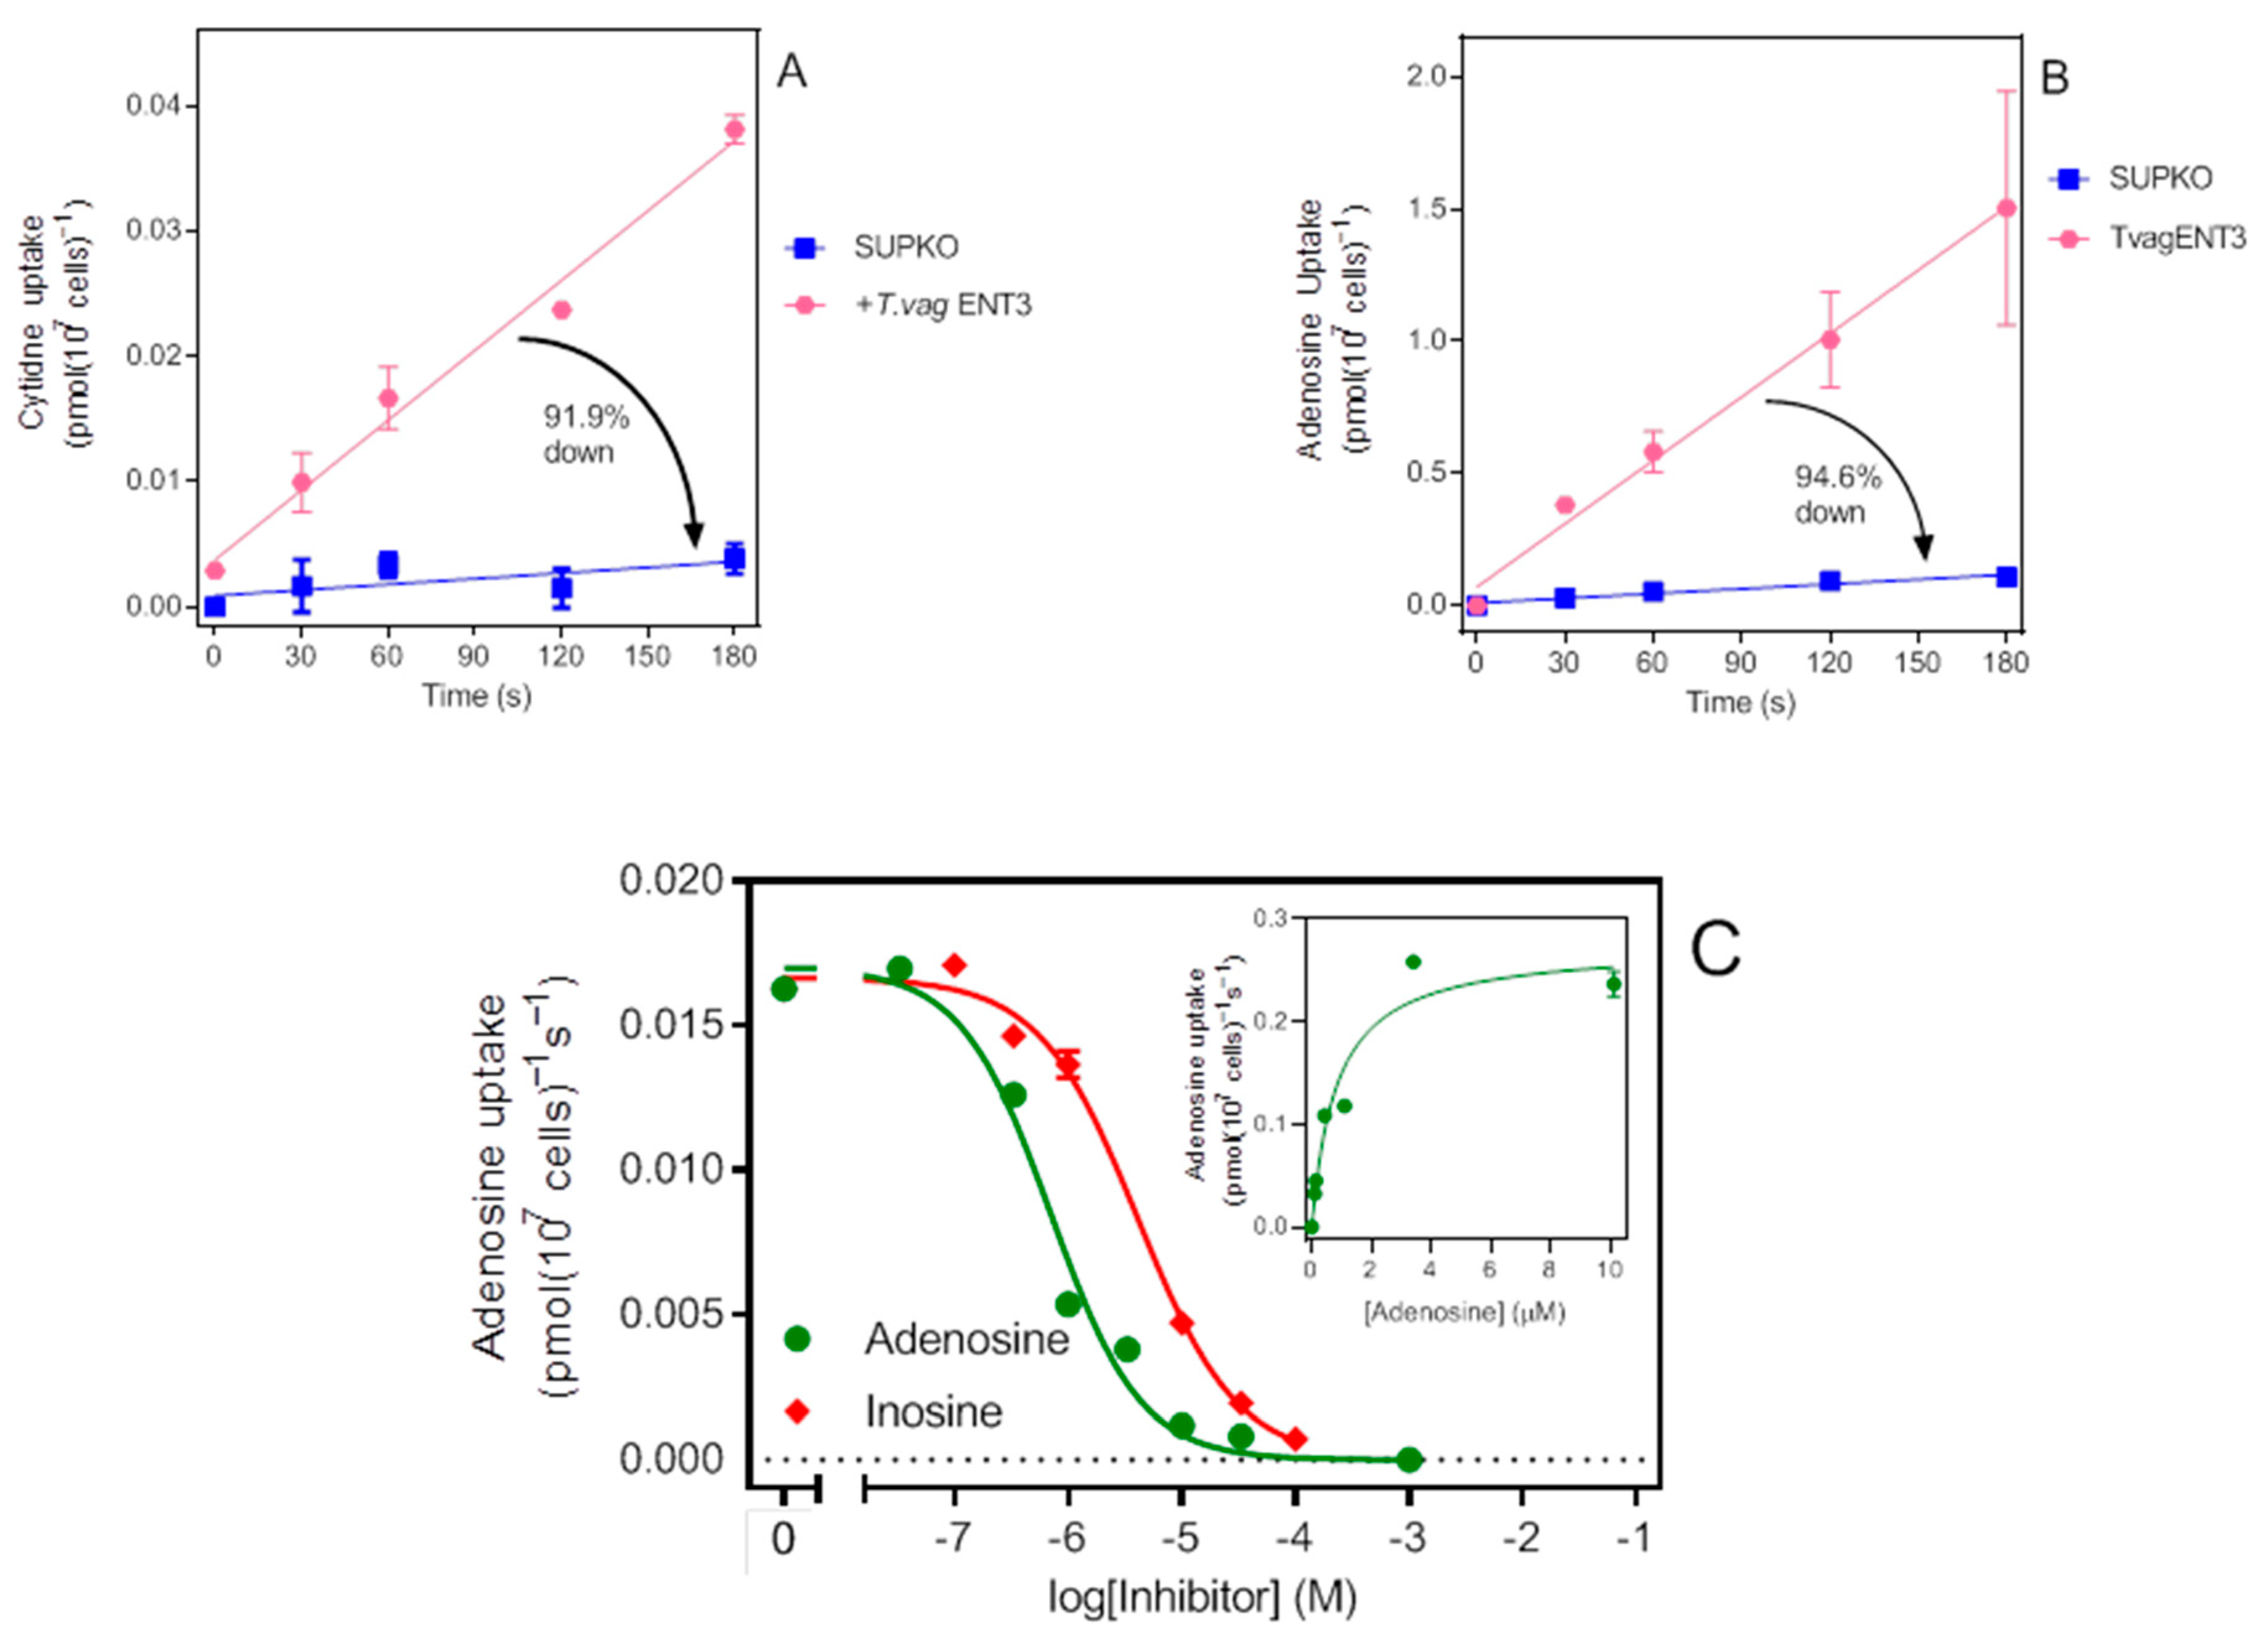
2.6. Expression of TvagENT3 in SUPKO Equals Expression in T. brucei
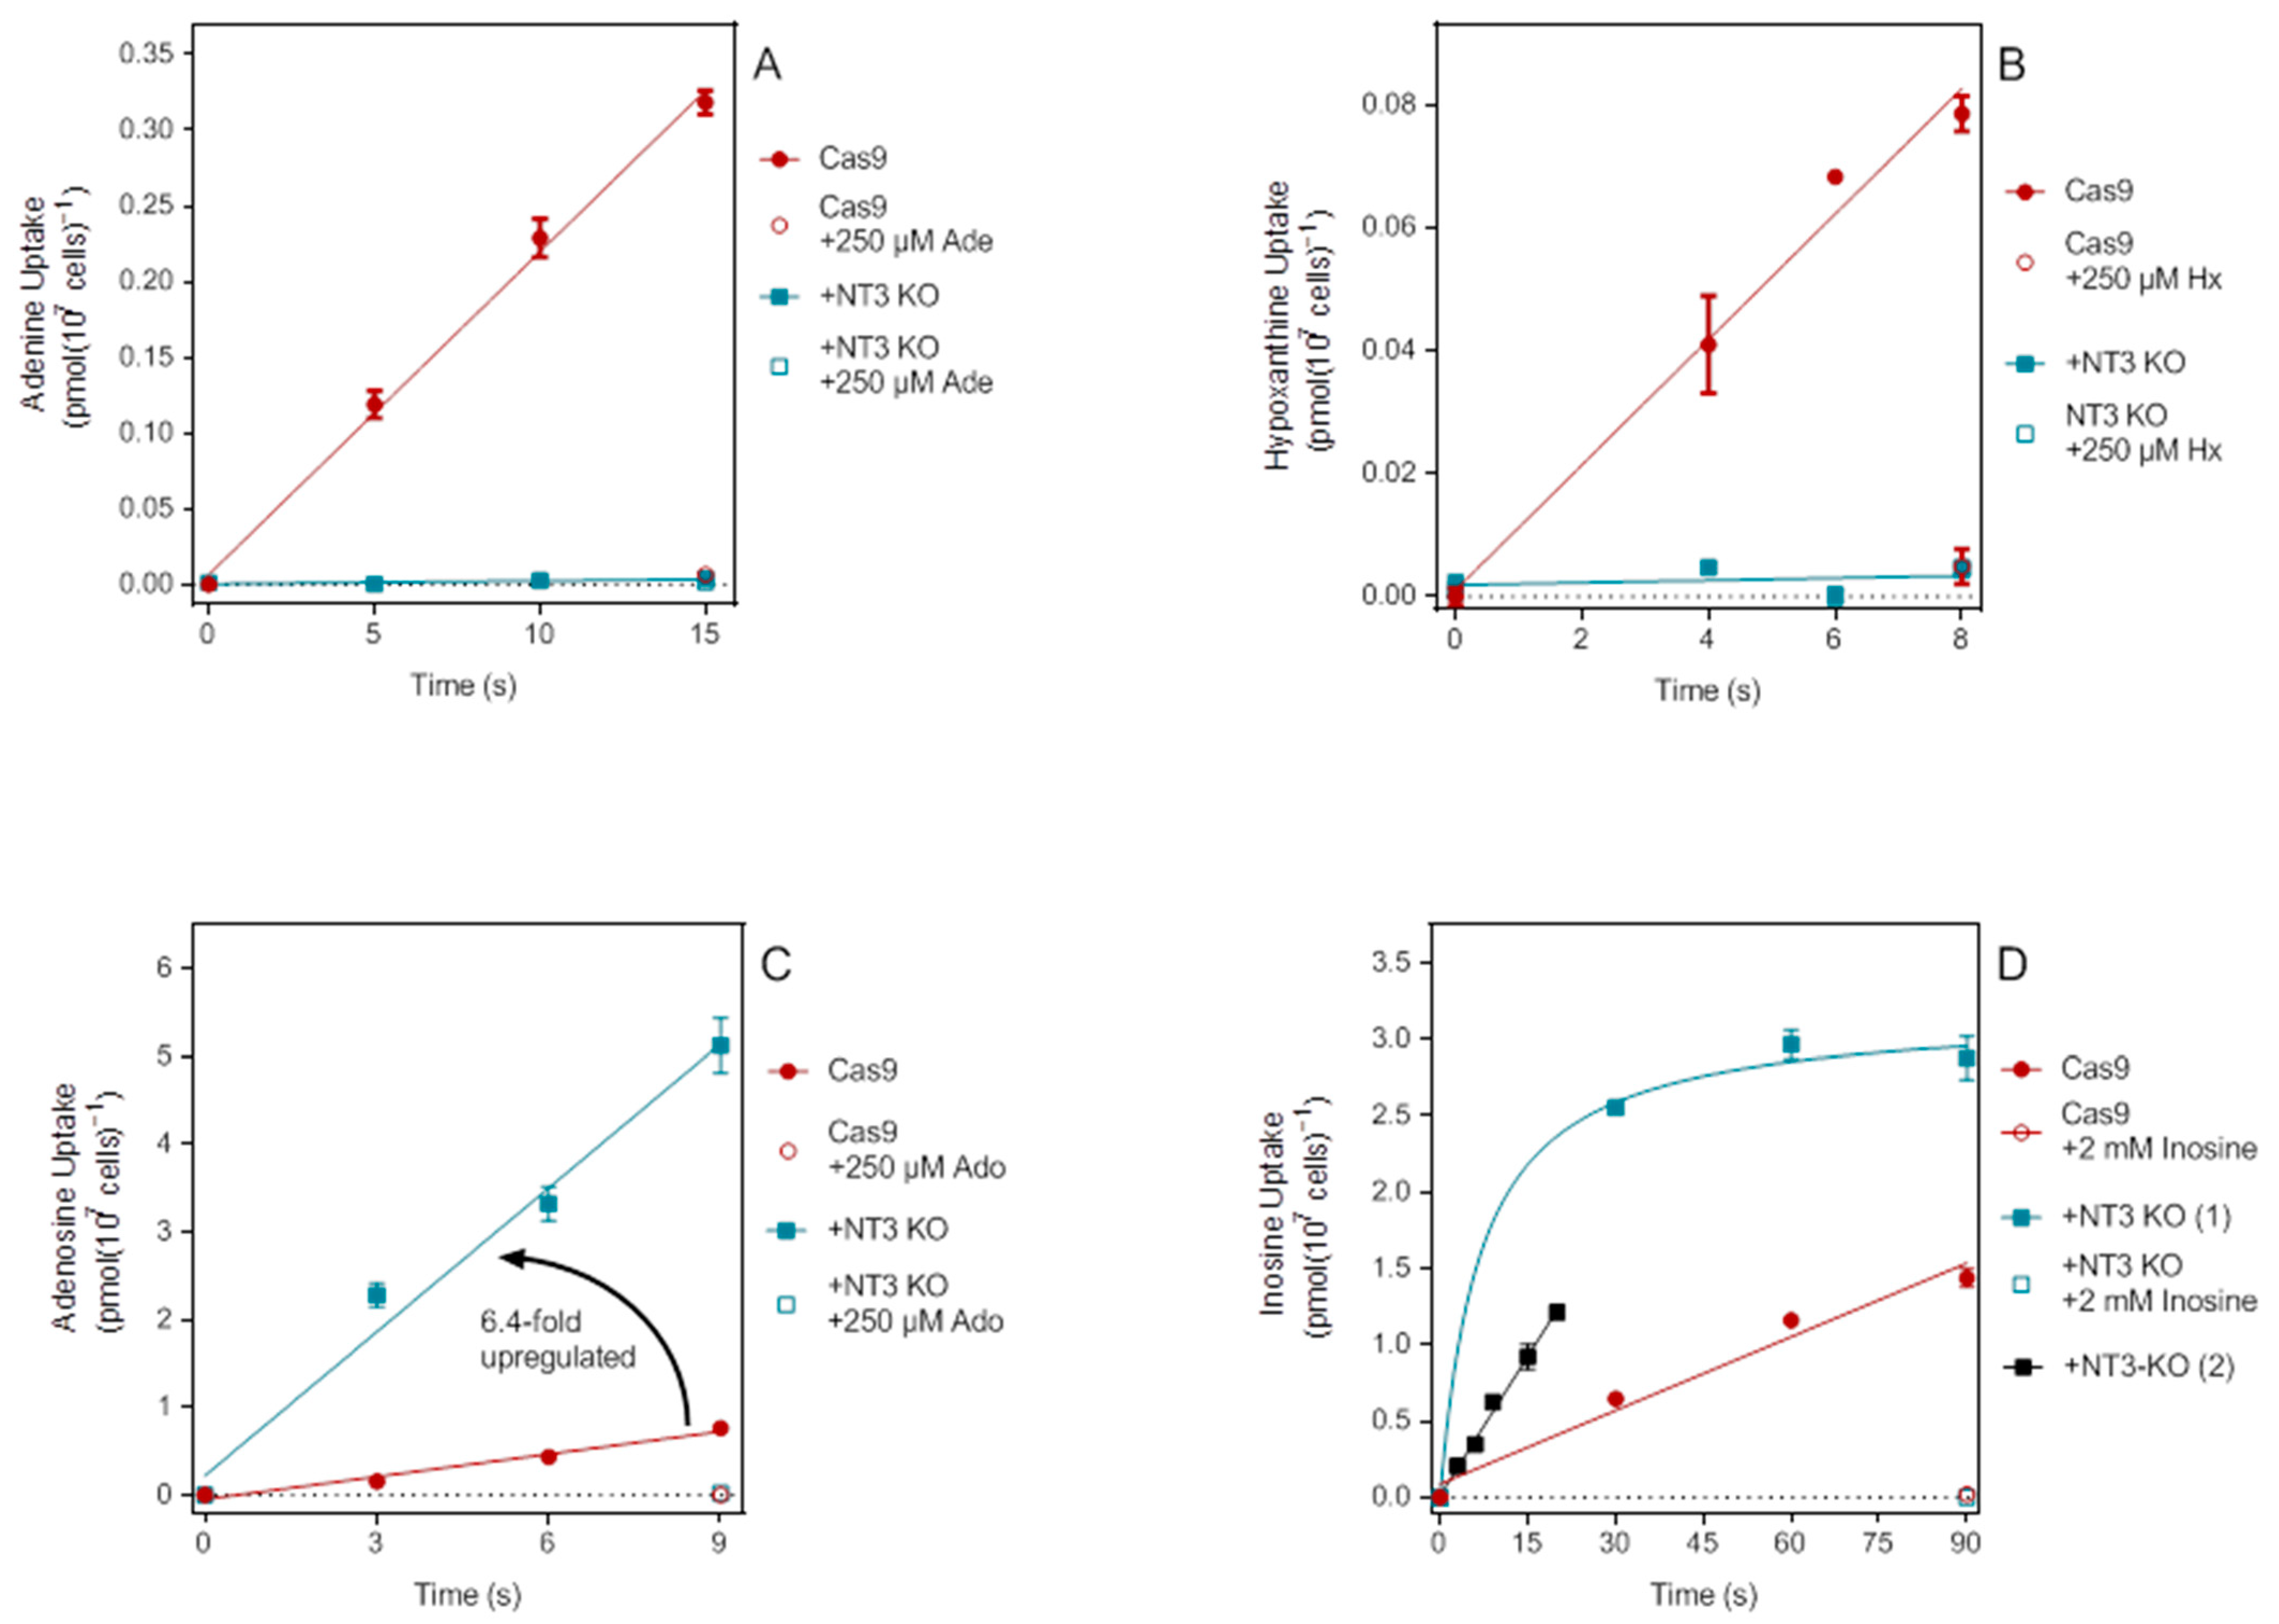
2.7. Nucleobase and Nucleoside Transport by NT3-KO Cells
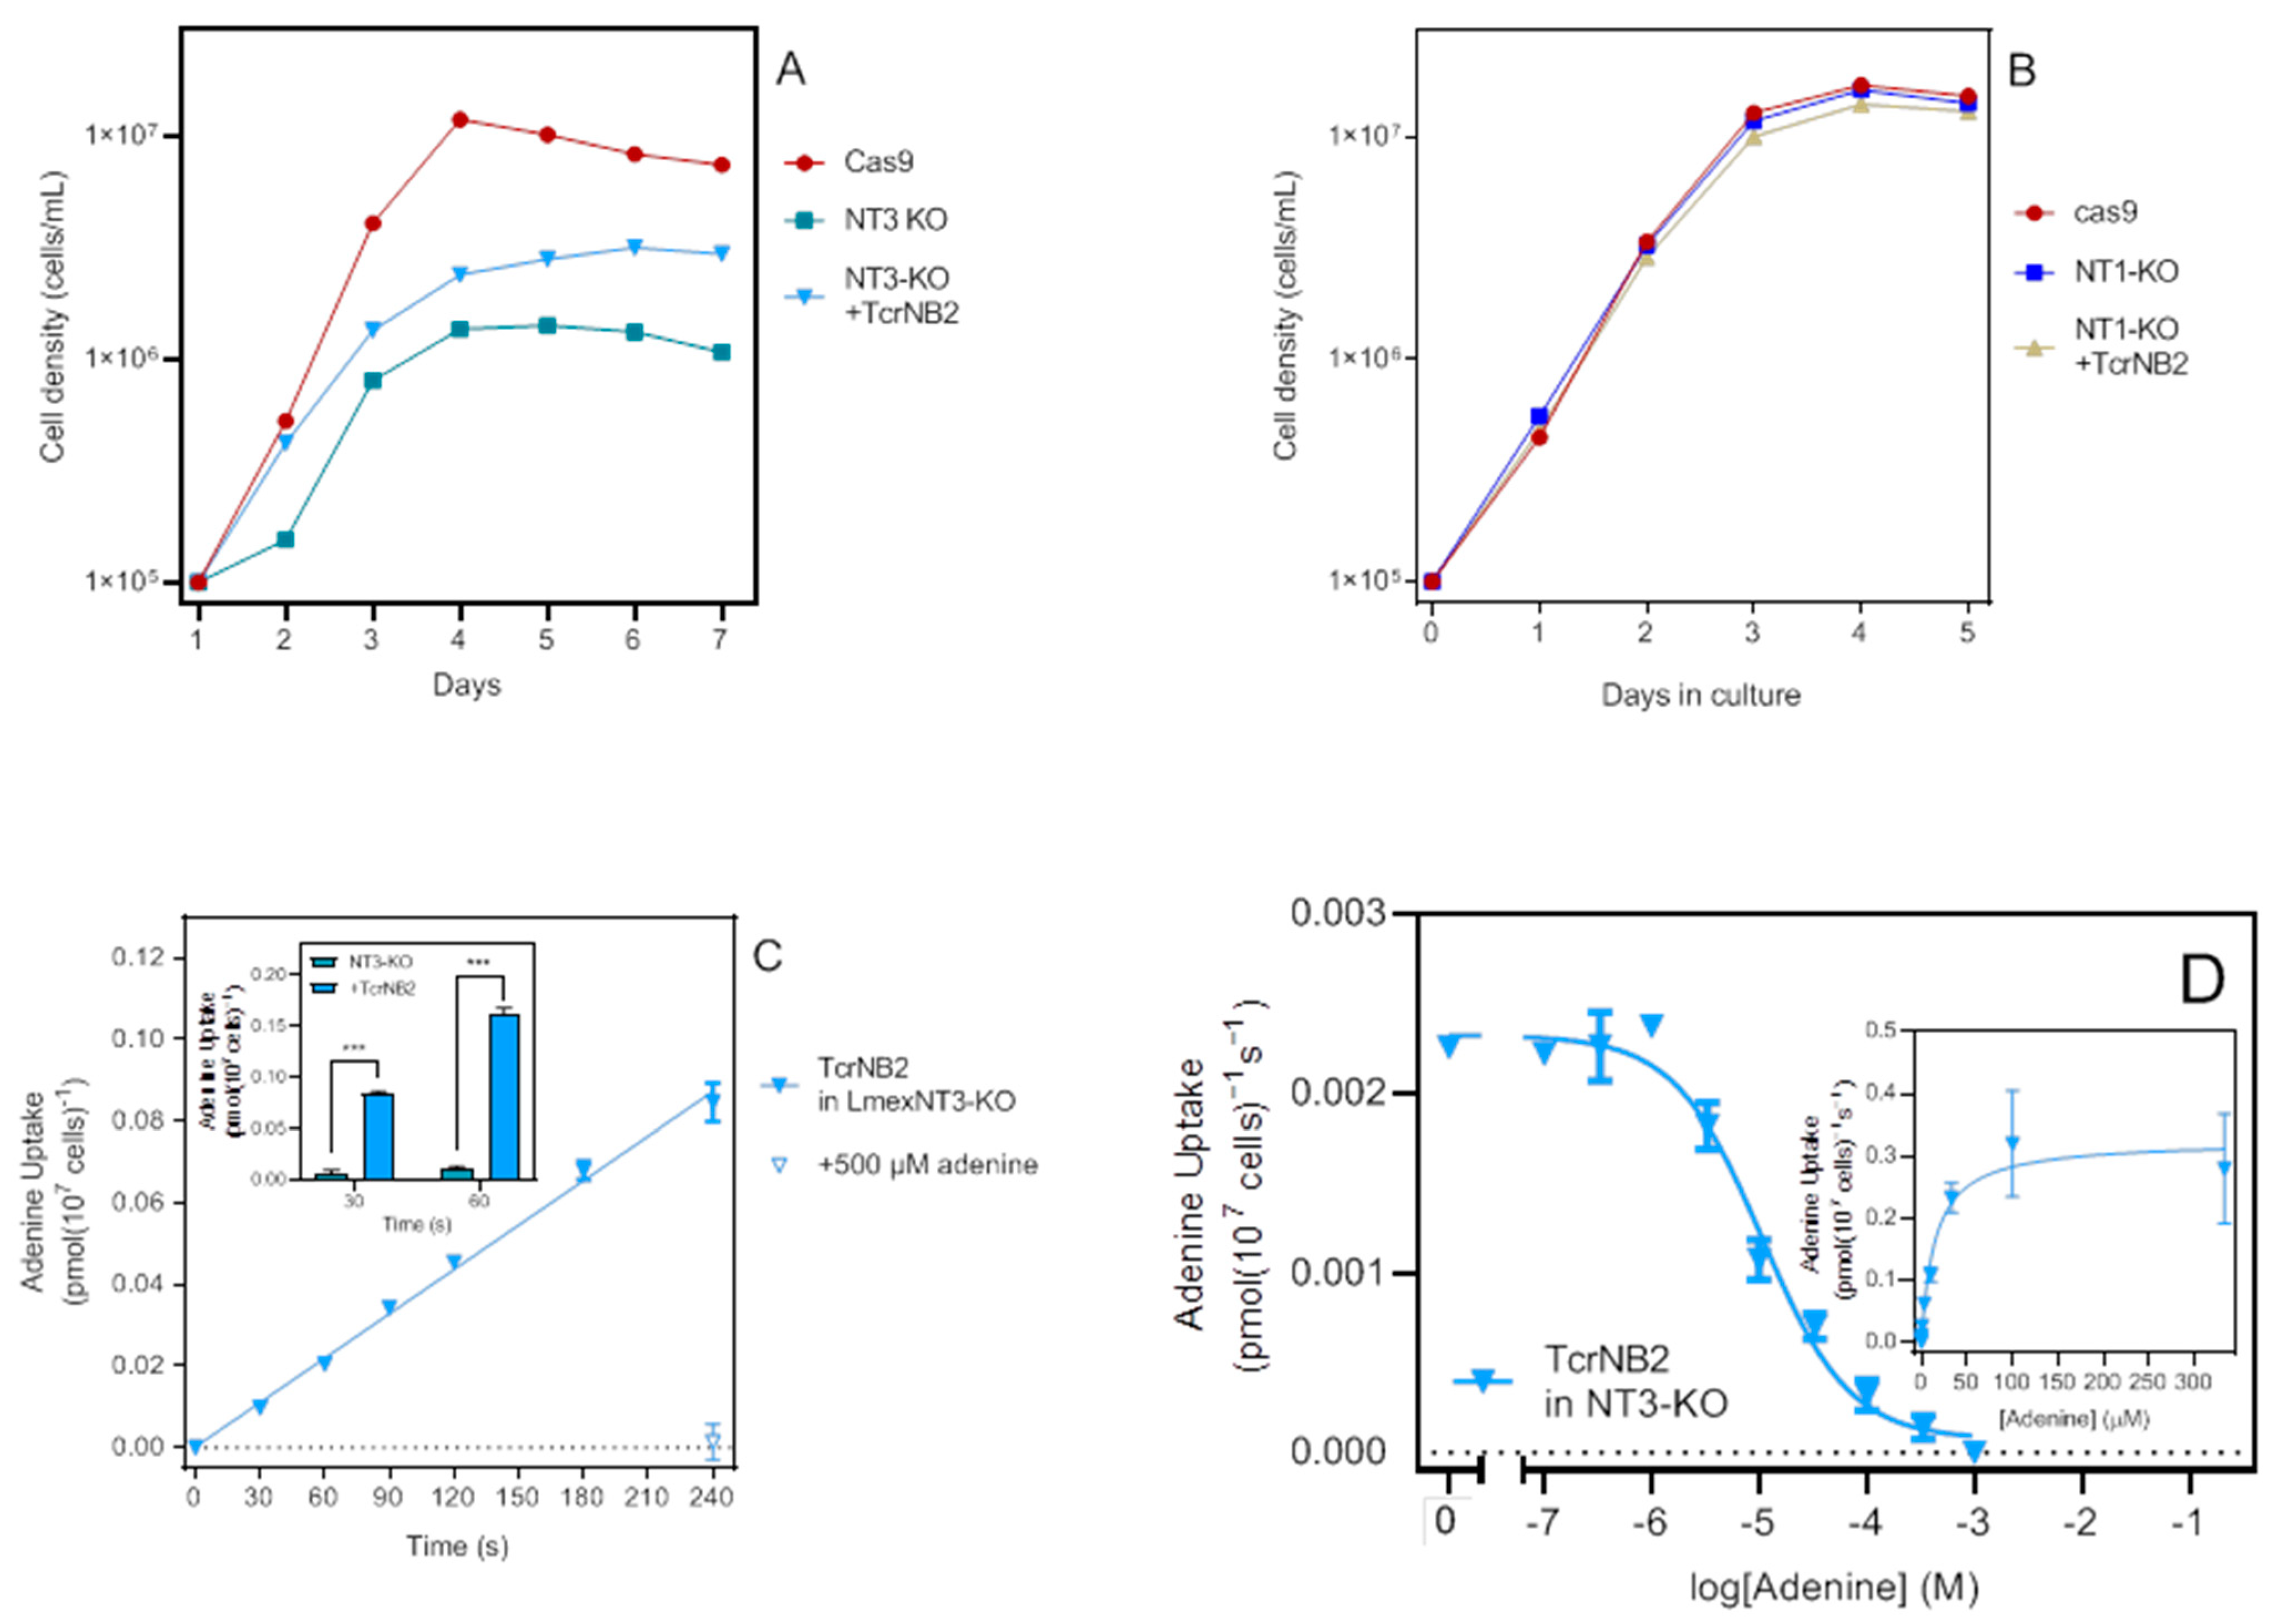
2.8. Expression of TcrNB2 in NT3-KO
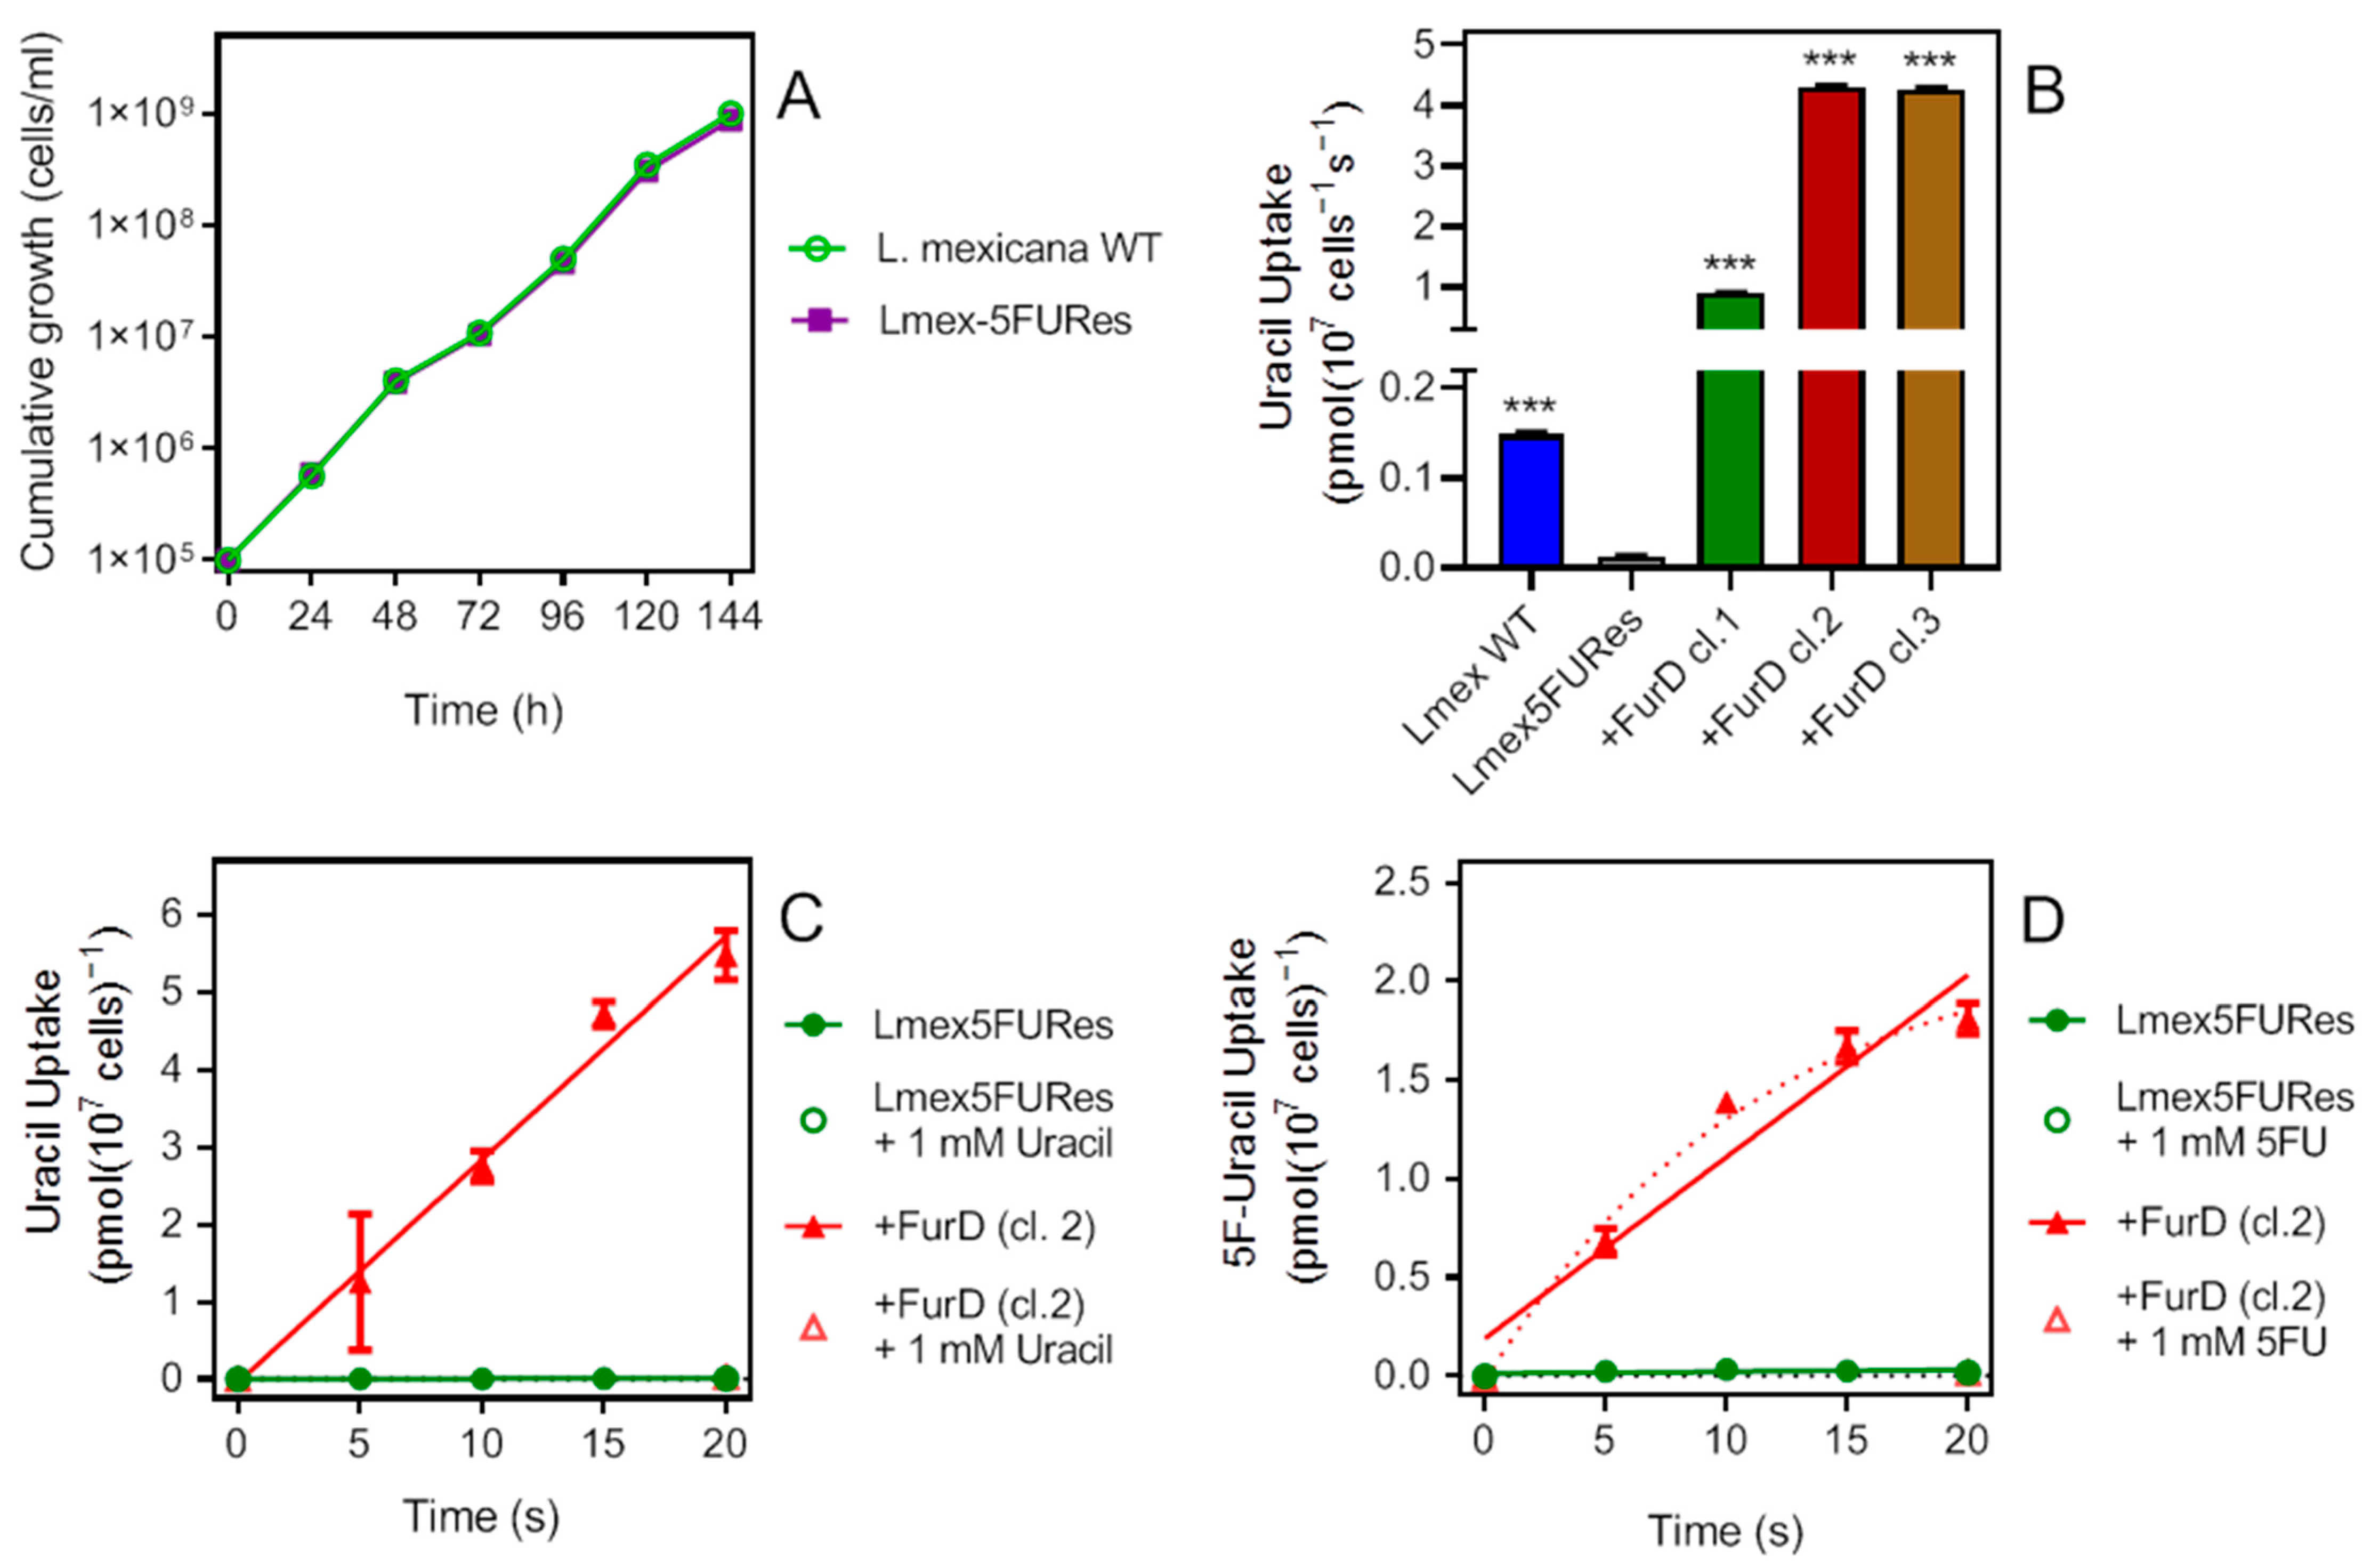
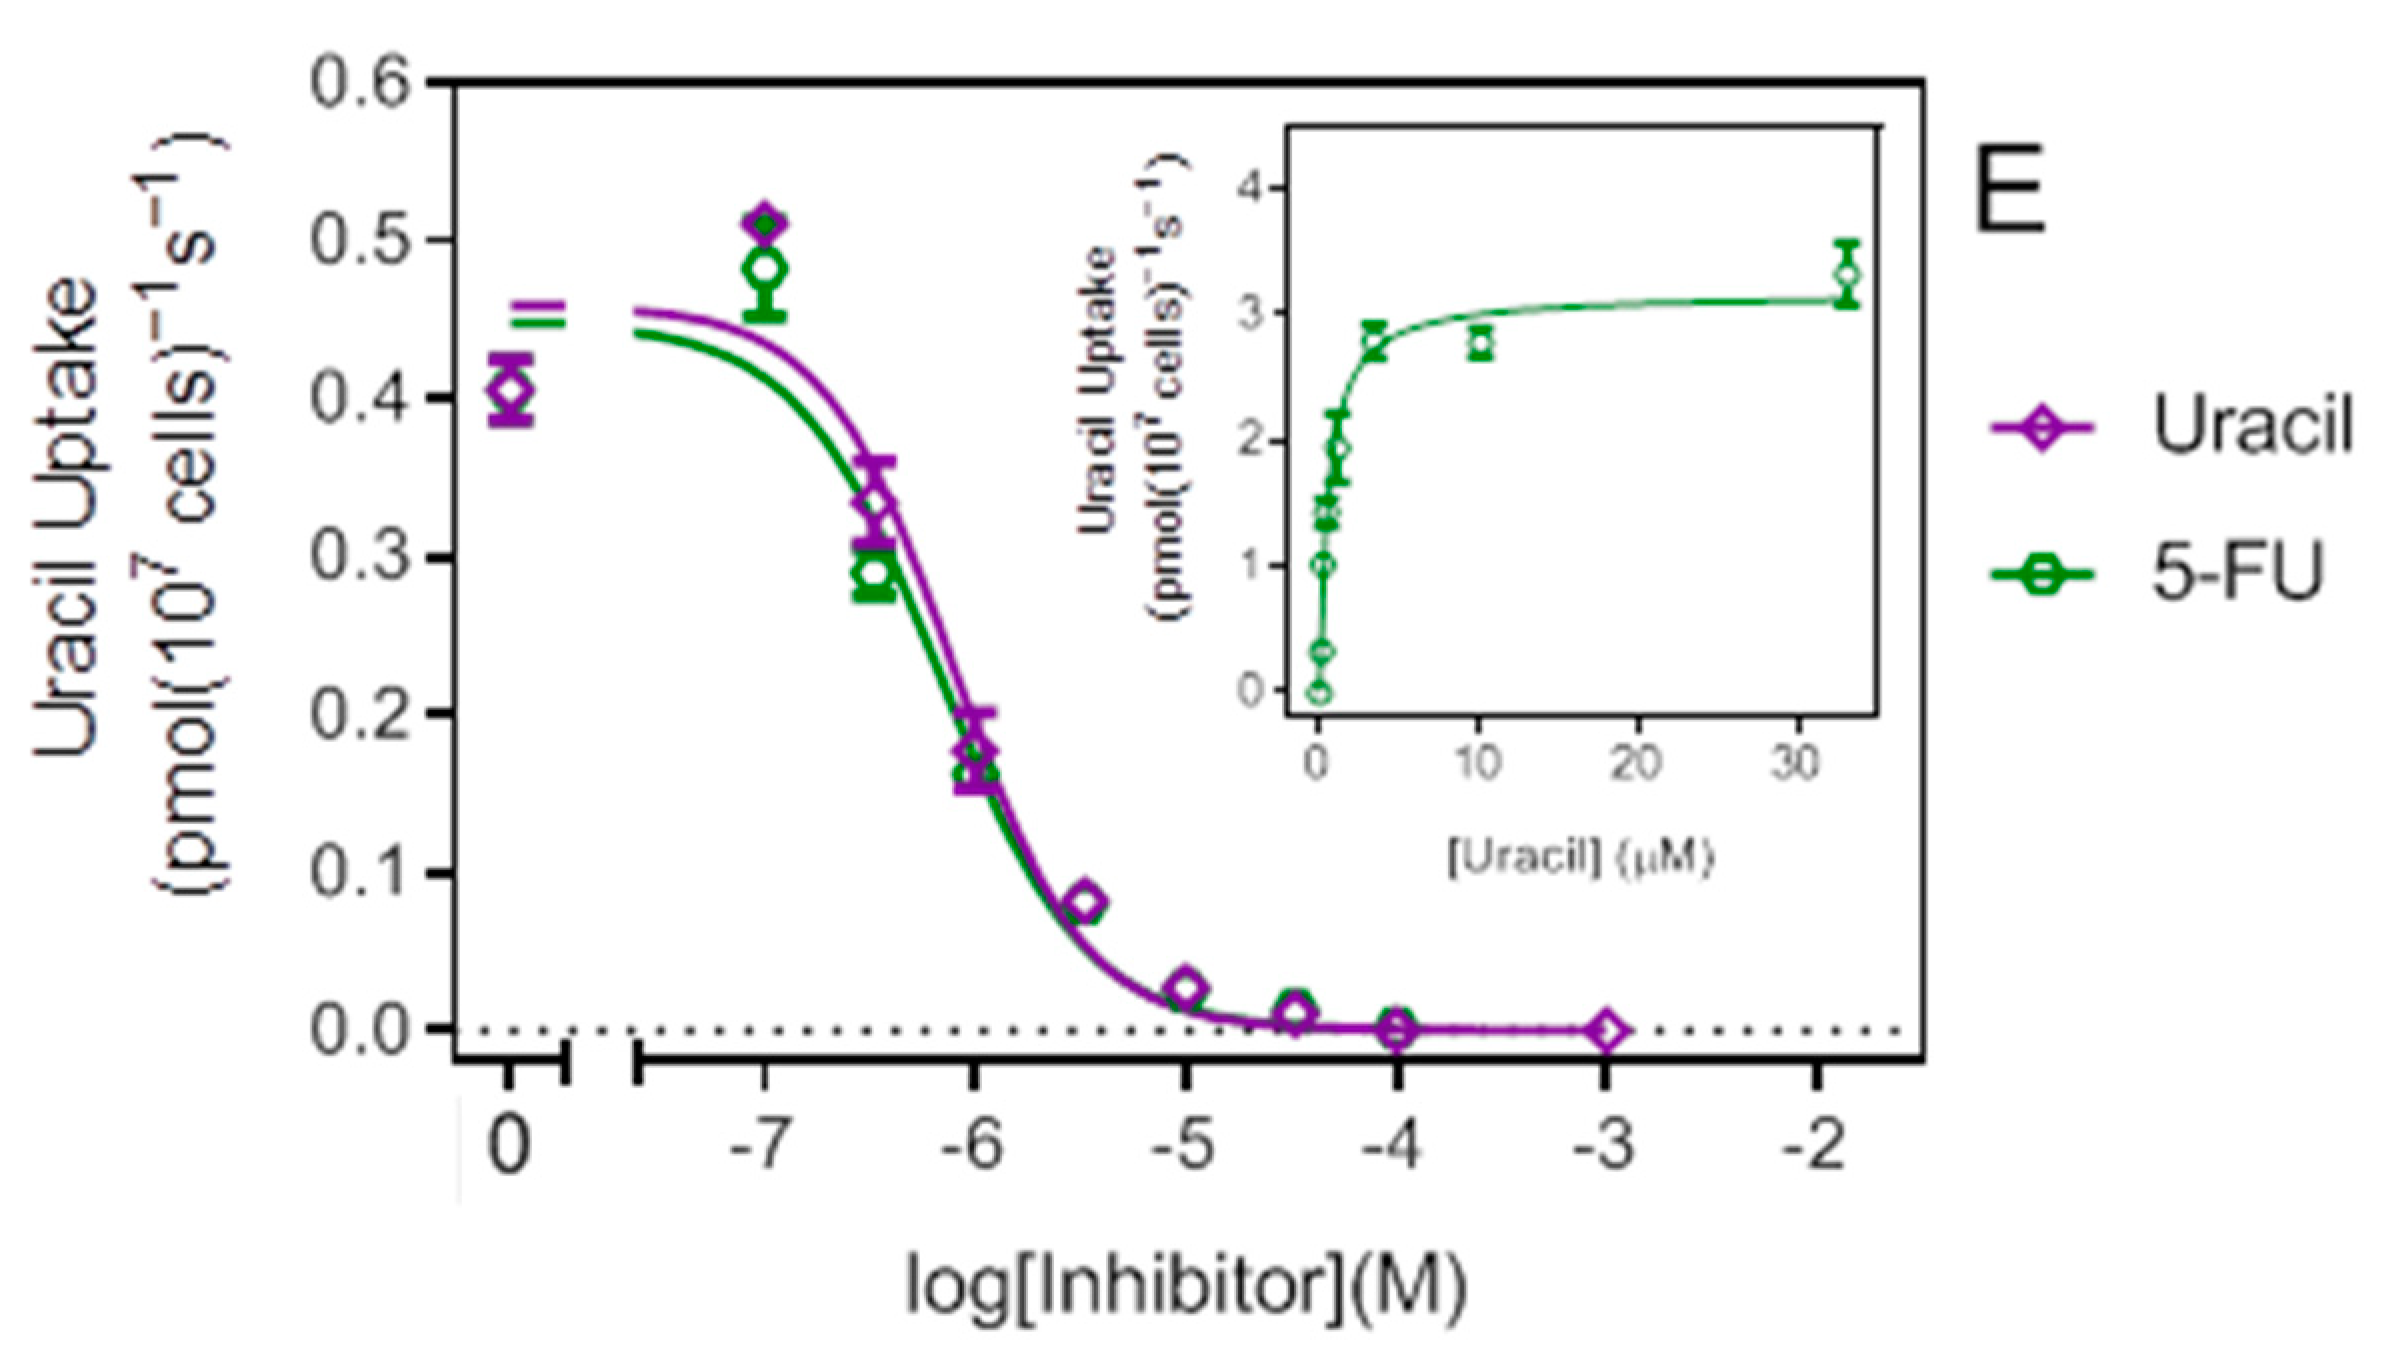
2.9. Expression of the Aspergillus nidulans FurD Transporter in the L. mexicana Cell Line 5FU-Res
3. Discussion
4. Materials and Methods
4.1. Strains and Cultures
4.2. Radiochemicals
4.3. Growth Curves
4.4. Molecular Cloning Techniques
4.5. Construction of Knockouts Using CRISPR/cas9
4.6. qRT-PCR of Heterologously Expressed Genes
4.7. Alamar Blue Assay for Cell Survival and Drug Sensitivity
4.8. Transport Assays
Supplementary Materials
Author Contributions
Funding
Institutional Review Board Statement
Informed Consent Statement
Data Availability Statement
Conflicts of Interest
References
- De Koning, H.P.; Bridges, D.J.; Burchmore, R. Purine and pyrimidine transport in protozoa: From biology to therapy. FEMS Microbiol. Rev. 2005, 29, 987–1020. [Google Scholar] [CrossRef] [Green Version]
- Wallace, L.J.M.; Candlish, D.; De Koning, H.P. Different substrate recognition motifs of human and trypanosome nucleobase transporters: Selective uptake of purine antimetabolites. J. Biol. Chem. 2002, 277, 26149–26156. [Google Scholar] [CrossRef] [PubMed] [Green Version]
- Carter, N.S.; Barrett, M.P.; De Koning, H.P. A drug resistance determinant from Trypanosoma brucei. Trends Microbiol. 1999, 7, 469–471. [Google Scholar] [CrossRef]
- Munday, J.C.; Settimo, L.; De Koning, H.P. Transport proteins determine drug sensitivity and resistance in a protozoan parasite, Trypanosoma brucei. Front. Pharmacol. 2015, 6, 32. [Google Scholar] [CrossRef] [PubMed]
- Carter, N.S.; Fairlamb, A.H. Arsenical-resistant trypanosomes lack an unusual adenosine transporter. Nature 1993, 361, 173–176. [Google Scholar] [CrossRef]
- Collar, C.J.; Al-Salabi, M.I.; Stewart, M.L.; Barrett, M.P.; Wilson, W.D.; De Koning, H.P. Predictive computational models of substrate binding by a nucleoside transporter. J. Biol. Chem. 2009, 284, 34028–34035. [Google Scholar] [CrossRef] [Green Version]
- Munday, J.C.; Tagoe, D.N.A.; Eze, A.A.; Krezdorn, J.A.; Rojas López, K.E.; Alkhaldi, A.A.M.; McDonald, F.; Still, J.; Alzahrani, K.J.; Settimo, L.; et al. Functional analysis of drug resistance-associated mutations in the Trypanosoma brucei adenosine transporter 1 (TbAT1) and the proposal of a structural model for the protein. Mol. Microbiol. 2015, 96, 887–900. [Google Scholar] [CrossRef]
- Hulpia, F.; Campagnaro, G.D.; Scortichini, M.; Van Hecke, K.; Maes, L.; De Koning, H.P.; Caljon, G.; Van Calenbergh, S. Revisiting tubercidin against kinetoplastid parasites: Aromatic substitutions at position 7 improve activity and reduce toxicity. Eur. J. Med. Chem. 2019, 164, 689–705. [Google Scholar] [CrossRef]
- Hulpia, F.; Mabille, D.; Campagnaro, G.D.; Schumann, G.; Maes, L.; Roditi, I.; Hofer, A.; De Koning, H.P.; Galjon, G.; Van Calenbergh, S. Combining tubercidin and cordycepin scaffolds results in highly active candidates to treat late-stage sleeping sickness. Nat. Commun. 2019, 10, 5564. [Google Scholar] [CrossRef] [Green Version]
- Vodnala, S.K.; Lundbäck, T.; Yeheskieli, E.; Sjöberg, B.; Gustavsson, A.L.; Svensson, R.; Olivera, G.C.; Eze, A.A.; De Koning, H.P.; Hammarström, L.G.J.; et al. Structure-activity relationships of synthetic cordycepin analogues as experimental therapeutics for Africa trypanosomiasis. J. Med. Chem. 2013, 56, 9861–9873. [Google Scholar] [CrossRef]
- Ranjbarian, F.; Vodnala, M.; Alzahrani, K.J.H.; Ebiloma, G.U.; De Koning, H.P.; Hofer, A. 9-(2-Deoxy-2-fluoro-ß-D-arabinofuranosyl) is a potent antitrypanosomal adenosine analogue that circumvents transport-related drug resistance. Antimicrob. Agents Chemother. 2017, 61, e0271-16. [Google Scholar] [CrossRef] [PubMed] [Green Version]
- Mabille, D.; Ilbeigi, K.; Hendrickx, S.; Ungogo, M.A.; Hulpia, F.; Lin, C.; Maes, L.; De Koning, H.P.; Van Calenbergh, S.; Caljon, G. Nucleoside analogues for the treatment of animal African trypanosomiasis. Int. J. Parasitol. Drugs Drug Resist. 2022, 19, 21–30. [Google Scholar] [CrossRef] [PubMed]
- Lin, C.; Ferreira de Almeida Fiuza, L.; Cardoso Santos, C.; Ferreira Nunes, D.; Cruz Moreira, O.; Bouton, J.; Karalic, I.; Maes, L.; Caljon, G.; Hulpia, F.; et al. 6-Methyl-7-Aryl-7-Deazapurine Nucleosides as Anti-Trypanosoma cruzi Agents: Structure-Activity Relationship and in vivo Efficacy. ChemMedChem 2021, 16, 2231–2253. [Google Scholar] [CrossRef]
- Natto, M.J.; Hulpia, F.; Kalkman, E.R.; Baillie, S.; Alhejeli, A.; Miyamoto, Y.; Eckmann, L.; Van Calenbergh, S.; De Koning, H.P. Deazapurine nucleoside analogues for the treatment of Trichomonas vaginalis. ACS Infect. Dis. 2021, 7, 1752–1764. [Google Scholar] [CrossRef] [PubMed]
- Lin, C.; Jaén Batista, D.D.G.; Mazzeti, A.L.; Donola Girão, R.; de Oliveira, G.M.; Karalic, I.; Hulpia, F.; Soeiro, M.N.C.; Maes, L.; Caljon, G.; et al. N6-modification of 7-Deazapurine nucleoside analogues as anti-Trypanosoma cruzi and anti-Leishmania agents: Structure-activity relationship exploration and in vivo evaluation. Eur. J. Med. Chem. 2022, 231, 114165. [Google Scholar] [CrossRef] [PubMed]
- Carter, N.S.; Drew, M.E.; Sanchez, M.; Vasudevan, G.; Landfear, S.M.; Ullman, B. Cloning of a novel inosine–guanosine transporter gene from Leishmania donovani by functional rescue of a transport-deficient mutant. J. Biol. Chem. 2000, 275, 20935–20941. [Google Scholar] [CrossRef] [PubMed] [Green Version]
- Iovannisci, D.M.; Kaur, K.; Young, L.; Ullman, B. Genetic analysis of nucleoside transport in Leishmania donovani. Mol. Cell. Biol. 1984, 4, 1013–1019. [Google Scholar] [PubMed] [Green Version]
- Chiang, C.W.; Carter, N.; Sullivan, W.J., Jr.; Donald, R.G.; Roos, D.S.; Naguib, F.N.; el Kouni, M.H.; Ullman, B.; Wilson, C.M. The adenosine transporter of Toxoplasma gondii. Identification by insertional mutagenesis, cloning, and recombinant expression. J. Biol. Chem. 1999, 274, 35255–35261. [Google Scholar] [CrossRef] [Green Version]
- Vasudevan, G.; Carter, N.S.; Drew, M.E.; Beverley, S.M.; Sanchez, M.A.; Seyfang, A.; Ullman, B.; Landfear, S.M. Cloning of Leishmania nucleoside transporter genes by rescue of a transport-deficient mutant. Proc. Natl. Acad. Sci. USA 1998, 95, 9873–9878. [Google Scholar] [CrossRef] [Green Version]
- Downie, M.J.; Saliba, K.J.; Bröer, S.; Howitt, S.M.; Kirk, K. Purine nucleobase transport in the intraerythrocytic malaria parasite. Int. J. Parasitol. 2008, 38, 203–209. [Google Scholar] [CrossRef] [PubMed]
- Parker, M.D.; Hyde, R.J.; Yao, S.Y.; McRobert, L.; Cass, C.E.; Young, J.D.; McConkey, G.A.; Baldwin, S.A. Identification of a nucleoside/nucleobase transporter from Plasmodium falciparum, a novel target for anti-malarial chemotherapy. Biochem. J. 2000, 349, 67–75. [Google Scholar] [CrossRef] [PubMed]
- Griffith, D.A.; Jarvis, S.M. Nucleoside and nucleobase transport systems of mammalian cells. Biochim. Biophys. Acta 1996, 1286, 153–181. [Google Scholar] [CrossRef]
- Mäser, P.; Sütterlin, C.; Kralli, A.; Kaminsky, R. A nucleoside transporter from Trypanosoma brucei involved in drug resistance. Science 1999, 285, 242–244. [Google Scholar] [CrossRef] [PubMed]
- Burchmore, R.; Wallace, L.J.M.; Candlish, D.; Al-Salabi, M.I.; Beal, P.; Barrett, M.P.; Baldwin, S.A.; De Koning, H.P. Cloning, heterologous expression, and in situ characterization of the first high affinity nucleobase transporter from a protozoan. J. Biol. Chem. 2003, 278, 23502–23507. [Google Scholar] [CrossRef] [Green Version]
- Munday, J.C.; Rojas López, K.E.; Eze, A.A.; Delespaux, V.; Van Den Abbeele, J.; Rowan, T.; Barrett, M.P.; Morrison, L.J.; De Koning, H.P. Functional expression of TcoAT1 reveals it to be a P1-type nucleoside transporter with no capacity for diminazene uptake. Int. J. Parasitol. Drugs Drug Resist. 2013, 3, 69–76. [Google Scholar] [CrossRef] [Green Version]
- Natto, M.J.; Miyamoto, Y.; Munday, J.C.; AlSiari, T.A.; Al-Salabi, M.I.; Quashie, N.B.; Eze, A.A.; Eckmann, L.; De Koning, H.P. Comprehensive characterization of purine and pyrimidine transport activities in Trichomonas vaginalis and functional cloning of a trichomonad nucleoside transporter. Mol. Microbiol. 2021, 116, 1489–1511. [Google Scholar] [CrossRef]
- Campagnaro, G.D.; de Freitas Nascimento, J.; Girard, R.B.M.; Silber, A.M.; De Koning, H.P. Cloning and characterisation of the Equilibrative Nucleoside Transporter family of Trypanosoma cruzi: Ultra-high affinity and selectivity to survive in the intracellular niche. Biochim. Biophys. Acta Gen. Subj. 2018, 1862, 2750–2763. [Google Scholar] [CrossRef] [Green Version]
- Campagnaro, G.D.; Elati, H.A.A.; Balaska, S.; Martin Abril, M.E.; Natto, M.J.; Hulpia, F.; Lee, K.; Sheiner, L.; Van Calenbergh, S.; De Koning, H.P. A Toxoplasma gondii oxopurine transporter binds nucleobases and nucleosides using different binding modes. Int. J. Mol. Sci. 2022, 23, 710. [Google Scholar] [CrossRef] [PubMed]
- Alzahrani, K.J.H.; Ali, J.A.M.; Eze, A.A.; Looi, W.L.; Tagoe, D.N.A.; Creek, D.J.; Barrett, M.P.; De Koning, H.P. Functional and genetic evidence that nucleoside transport is highly conserved in Leishmania species: Implications for pyrimidine-based chemotherapy. Int. J. Parasitol. Drugs Drug Resist. 2017, 7, 206–226. [Google Scholar] [CrossRef]
- Amillis, S.; Hamari, Z.; Roumelioti, K.; Scazzocchio, C.; Diallinas, G. Regulation of expression and kinetic modeling of substrate interactions of a uracil transporter in Aspergillus nidulans. Mol. Membr. Biol. 2007, 24, 206–214. [Google Scholar] [CrossRef]
- Beneke, T.; Madden, R.; Makin, L.; Valli, J.; Sunter, J.; Gluenz, E. A CRISPR Cas9 high-throughput genome editing toolkit for kinetoplastids. R. Soc. Open Sci. 2017, 4, 170095. [Google Scholar] [CrossRef] [PubMed] [Green Version]
- Liu, W.; Boitz, J.M.; Galazka, J.; Arendt, C.S.; Carter, N.S.; Ullman, B. Functional characterization of nucleoside transporter gene replacements in Leishmania donovani. Mol. Biochem. Parasitol. 2006, 150, 300–307. [Google Scholar] [CrossRef] [PubMed] [Green Version]
- De Koning, H.P.; Jarvis, S.M. Purine nucleobase transport in bloodstream forms of Trypanosoma brucei brucei is mediated by two novel transporters. Mol. Biochem. Parasitol. 1997, 89, 245–258. [Google Scholar] [CrossRef]
- Papageorgiou, I.G.; Yakob, L.; Al-Salabi, M.I.; Diallinas, G.; Soteriadou, K.; De Koning, H.P. Identification of the first pyrimidine nucleobase transporter in Leishmania: Similarities with the Trypanosoma brucei U1 transporter and antileishmanial activity of uracil analogues. Parasitology 2005, 130, 275–283. [Google Scholar] [CrossRef]
- Ortiz, D.; Sanchez, M.A.; Pierce, S.; Hermann, T.; Kimblin, N.; Bouwer, H.G.A.; Landfear, S.M. Molecular genetic analysis of purine nucleobase transport in Leishmania major. Mol. Microbiol. 2007, 64, 1228–1243. [Google Scholar] [CrossRef] [PubMed]
- De Koning, H.P.; Jarvis, S.M. A highly selective, high affinity transporter for uracil in Trypanosoma brucei brucei; evidence for proton-dependent transport. Biochem. Cell Biol. 1998, 76, 853–858. [Google Scholar] [CrossRef]
- De Koning, H.P. Pyrimidine transporters of protozoa—A class apart? Trends Parasitol. 2007, 23, 190. [Google Scholar] [CrossRef]
- Matovu, E.; Stewart, M.; Geiser, F.; Brun, R.; Mäser, P.; Wallace, L.J.M.; Burchmore, R.J.; Enyaru, C.K.; Barrett, M.P.; Kaminsky, R.; et al. Mechanisms of Arsenical and Diamidine Uptake and Resistance in Trypanosoma brucei. Eukaryot. Cell 2003, 2, 1003–1008. [Google Scholar] [CrossRef] [Green Version]
- De Koning, H.P.; Watson, C.J.; Jarvis, S.M. Characterisation of a nucleoside/proton symporter in procyclic Trypanosoma brucei brucei. J. Biol. Chem. 1998, 273, 9486–9494. [Google Scholar] [CrossRef] [Green Version]
- Sanchez, M.A.; Tryon, R.; Green, J.; Boor, I.; Landfear, S.M. Six related nucleoside/nucleobase transporters from Trypanosoma brucei exhibit distinct biochemical functions. J. Biol. Chem. 2002, 277, 21499–21504. [Google Scholar] [CrossRef] [Green Version]
- Al-Salabi, M.I.; Wallace, L.J.M.; Lüscher, A.; Mäser, P.; Candlish, D.; Rodenko, B.; Gould, M.K.; Jabeen, I.; Ajith, S.N.; De Koning, H.P. Molecular interactions underlying the unusually high adenosine affinity of a novel Trypanosoma brucei nucleoside transporter. Mol. Pharmacol. 2007, 71, 921–929. [Google Scholar] [CrossRef]
- Kabli, A.M.M. Polyomic Analyses for Rational Antileishmanial Vaccine Development: A Role for Membrane Transporters? Ph.D. Thesis, University of Glasgow, Glasgow, UK, 2020. [Google Scholar]
- Sanchez, M.A.; Tryon, R.; Pierce, S.; Vasudevan, G.; Landfear, S.M. Functional expression and characterization of a purine nucleobase transporter gene from Leishmania major. Mol. Membr. Biol. 2004, 21, 11–18. [Google Scholar] [CrossRef] [PubMed]
- Ortiz, D.; Sanchez, M.A.; Koch, H.P.; Larsson, H.P.; Landfear, S.M. An acid-activated nucleobase transporter from Leishmania major. J. Biol. Chem. 2009, 284, 16164–16169. [Google Scholar] [CrossRef] [PubMed] [Green Version]
- Campagnaro, G.D.; Alzahrani, K.J.H.; Munday, J.C.; De Koning, H.P. Trypanosoma brucei bloodstream forms express highly specific and separate transporters for adenine and hypoxanthine; evidence for a new protozoan purine transporter family? Mol. Biochem. Parasitol. 2018, 220, 46–56. [Google Scholar] [CrossRef] [PubMed]
- Krypotou, E.; Evangelidis, T.; Bobonis, J.; Pittis, A.A.; Gabaldón, T.; Scazzocchio, C.; Mikros, E.; Diallinas, G. Origin, diversification and substrate specificity in the family of NCS1/FUR transporters. Mol. Microbiol. 2015, 96, 927–950. [Google Scholar] [CrossRef] [PubMed]
- Patching, S.G. Recent developments in nucleobase cation symporter-1 (NCS1) family transport proteins from bacteria, archaea, fungi and plants. J. Biosci. 2018, 43, 797–815. [Google Scholar] [CrossRef] [PubMed]
- Campagnaro, G.D.; De Koning, H.P. Purine and pyrimidine transporters of pathogenic protozoa—Conduits for therapeutic agents. Med. Res. Rev. 2020, 40, 1679–1714. [Google Scholar] [CrossRef]
- Delespaux, V.; De Koning, H.P. Transporters in anti-parasitic drug development and resistance. In Trypanosomatid Diseases: Molecular Routes to Drug Discovery; Jäger, T., Koch, O., Flohe, L., Eds.; Wiley-Blackwell: Weinheim, Germany, 2013; pp. 335–349. [Google Scholar]
- Ungogo, M.A.; Campagnaro, G.D.; Alghamdi, A.H.; Natto, M.J.; De Koning, H.P. Differences in transporters rather than drug targets are the principal determinants of the different innate sensitivities of Trypanosoma congolense and Trypanozoon subgenus trypanosomes to diamidines and melaminophenyl arsenicals. Int. J. Mol. Sci. 2022, 23, 2844. [Google Scholar] [CrossRef] [PubMed]
- Gudin, S.; Quashie, N.B.; Candlish, D.; Al-Salabi, M.I.; Jarvis, S.M.; Ranford-Cartwright, L.C.; De Koning, H.P. Trypanosoma brucei: A survey of pyrimidine transport activities. Exp. Parasitol. 2006, 114, 103–108. [Google Scholar] [CrossRef]
- De Koning, H.P.; MacLeod, A.; Barrett, M.P.; Cover, B.; Jarvis, S.M. Further evidence for a link between melarsoprol resistance and P2 transporter function in African trypanosomes. Mol. Biochem. Parasitol. 2000, 106, 181–185. [Google Scholar] [CrossRef]
- De Koning, H.P.; Anderson, L.F.; Stewart, M.; Burchmore, R.J.S.; Wallace, L.J.M.; Barrett, M.P. The trypanocide diminazene aceturate is accumulated predominantly through the TbAT1 purine transporter; additional insights in diamidine resistance in African trypanosomes. Antimicrob. Agents Chemother. 2004, 48, 1515–1519. [Google Scholar] [CrossRef] [PubMed] [Green Version]
- Stewart, M.L.; Burchmore, R.J.S.; Clucas, C.; Hertz-Fowler, C.; Brook, K.; Tait, A.; McLeod, A.; Turner, C.M.R.; De Koning, H.P.; Wong, P.E.; et al. Multiple genetic mechanisms lead to the loss of functional TbAT1 expression in drug resistant trypanosomes. Eukaryot. Cell 2010, 9, 336–343. [Google Scholar] [CrossRef] [PubMed] [Green Version]
- Ward, C.P.; Wong, P.E.; Burchmore, R.J.; De Koning, H.P.; Barrett, M.P. Trypanocidal furamidine analogues: Influence of pyridine nitrogens on trypanocidal activity, transport kinetics and resistance patterns. Antimicrob. Agents Chemother. 2011, 55, 2352–2361. [Google Scholar] [CrossRef] [PubMed] [Green Version]
- Geiser, F.; Lüscher, A.; De Koning, H.P.; Seebeck, T.; Mäser, P. Molecular pharmacology of adenosine transport in Trypanosoma brucei: P1/P2 revisited. Mol. Pharmacol. 2005, 68, 589–595. [Google Scholar] [CrossRef] [PubMed] [Green Version]
- Hulpia, F.; Van Hecke, K.; França da Silva, C.; da Gama Jaen Batista, D.; Maes, L.; Caljon, G.; Correia Soeiro, M.N.; Van Calenbergh, S. Discovery of novel 7-aryl 7-deazapurine 3’-deoxy-ribofuranosyl nucleosides with potent activity against Trypanosoma cruzi. J. Med. Chem. 2018, 61, 9287–9300. [Google Scholar] [CrossRef] [PubMed]
- Hulpia, F.; Bouton, J.; Campagnaro, G.D.; Alfayez, I.A.; Mabille, D.; Maes, L.; De Koning, H.P.; Caljon, G.; Van Calenbergh, S. C6-O-Alkylated 7-deazainosine nucleoside analogues: Discovery of potent and selective anti-sleeping sickness agents. Eur. J. Med. Chem. 2020, 18, 112018. [Google Scholar] [CrossRef] [PubMed]
- Diallinas, G.; Martzoukou, O. Transporter membrane traffic and function: Lessons from a mould. FEBS J. 2019, 286, 4861–4875. [Google Scholar] [CrossRef] [Green Version]
- Dimou, S.; Diallinas, G. Life and death of fungal transporters under the challenge of polarity. Int. J. Mol. Sci. 2020, 21, 5376. [Google Scholar] [CrossRef]
- Al-Salabi, M.I.; Wallace, L.J.M.; De Koning, H.P. A Leishmania major nucleobase transporter responsible for allopurinol uptake is a functional homologue of the Trypanosoma brucei H2 transporter. Mol. Pharmacol. 2003, 63, 814–820. [Google Scholar] [CrossRef] [Green Version]
- Aslett, M.; Aurrecoechea, C.; Berriman, M.; Brestelli, J.; Brunk, B.P.; Carrington, M.; Depledge, D.P.; Fischer, S.; Gajria, B.; Gao, X.; et al. TriTrypDB: A functional genomic resource for the Trypanosomatidae. Nucleic Acids Res. 2010, 38, D457. [Google Scholar] [CrossRef] [Green Version]
- Tetaud, E.; Lecuix, I.; Sheldrake, T.; Baltz, T.; Fairlamb, A.H. A new expression vector for Crithidia fasciculata and Leishmania. Mol. Biochem. Parasitol. 2002, 120, 195–204. [Google Scholar] [CrossRef]
- Pfaffl, M.W. 2001. A new mathematical model for relative quantification in real-time RT-PCR. Nucl. Acids Res. 2001, 29, e45. [Google Scholar] [CrossRef] [PubMed]
- Kang, X.; Szallies, A.; Rawer, M.; Echner, H.; Duszenko, M. GPI anchor transamidase of Trypanosoma brucei: In vitro assay of the recombinant protein and VSG anchor exchange. J. Cell. Sci. 2002, 115, 2529–2539. [Google Scholar] [CrossRef] [PubMed]
- Gould, M.K.; Vu, X.L.; Seebeck, T.; De Koning, H.P. Propidium iodide-based methods for monitoring drug action in the kinetoplastidae: Comparison with the Alamar Blue assay. Anal. Biochem. 2008, 382, 87–93. [Google Scholar] [CrossRef] [PubMed]
- Anyam, J.V.; Daikwo, P.E.; Ungogo, M.A.; Nweze, N.E.; Igoli, N.P.; Gray, A.I.; De Koning, H.P.; Igoli, J.O. Two New Diterpenes from the roots of Acacia nilotica. Front. Chem. 2021, 9, 624741. [Google Scholar] [CrossRef] [PubMed]


Publisher’s Note: MDPI stays neutral with regard to jurisdictional claims in published maps and institutional affiliations. |
© 2022 by the authors. Licensee MDPI, Basel, Switzerland. This article is an open access article distributed under the terms and conditions of the Creative Commons Attribution (CC BY) license (https://creativecommons.org/licenses/by/4.0/).
Share and Cite
Aldfer, M.M.; AlSiari, T.A.; Elati, H.A.A.; Natto, M.J.; Alfayez, I.A.; Campagnaro, G.D.; Sani, B.; Burchmore, R.J.S.; Diallinas, G.; De Koning, H.P. Nucleoside Transport and Nucleobase Uptake Null Mutants in Leishmania mexicana for the Routine Expression and Characterization of Purine and Pyrimidine Transporters. Int. J. Mol. Sci. 2022, 23, 8139. https://0-doi-org.brum.beds.ac.uk/10.3390/ijms23158139
Aldfer MM, AlSiari TA, Elati HAA, Natto MJ, Alfayez IA, Campagnaro GD, Sani B, Burchmore RJS, Diallinas G, De Koning HP. Nucleoside Transport and Nucleobase Uptake Null Mutants in Leishmania mexicana for the Routine Expression and Characterization of Purine and Pyrimidine Transporters. International Journal of Molecular Sciences. 2022; 23(15):8139. https://0-doi-org.brum.beds.ac.uk/10.3390/ijms23158139
Chicago/Turabian StyleAldfer, Mustafa M., Tahani A. AlSiari, Hamza A. A. Elati, Manal J. Natto, Ibrahim A. Alfayez, Gustavo D. Campagnaro, Bashiru Sani, Richard J. S. Burchmore, George Diallinas, and Harry P. De Koning. 2022. "Nucleoside Transport and Nucleobase Uptake Null Mutants in Leishmania mexicana for the Routine Expression and Characterization of Purine and Pyrimidine Transporters" International Journal of Molecular Sciences 23, no. 15: 8139. https://0-doi-org.brum.beds.ac.uk/10.3390/ijms23158139