Article

Craniofacial Defects in Embryos with Homozygous Deletion of Eftud2 in Their Neural Crest Cells Are Not Rescued by Trp53 Deletion

by
Marie-Claude Beauchamp
1,
Alexia Boucher
2,
Yanchen Dong
3,
Rachel Aber
2 and
Loydie A. Jerome-Majewska
1,2,3,4,*
1
Research Institute, McGill University Health Centre, Glen Site, Montreal, QC H4A 3J1, Canada
2
Department of Anatomy and Cell Biology, McGill University, Montreal, QC H3A 2B2, Canada
3
Department of Human Genetics, McGill University, Montreal, QC H3A 0G1, Canada
4
Department of Pediatrics, McGill University, Montreal, QC H4A 3J1, Canada
*
Author to whom correspondence should be addressed.
Int. J. Mol. Sci. 2022, 23(16), 9033; https://0-doi-org.brum.beds.ac.uk/10.3390/ijms23169033
Submission received: 29 April 2022 / Revised: 27 July 2022 / Accepted: 29 July 2022 / Published: 12 August 2022
(This article belongs to the Special Issue Neural Crest Development in Health and Disease)

Abstract

:
Embryos with homozygous mutation of Eftud2 in their neural crest cells (Eftud2ncc−/−) have brain and craniofacial malformations, hyperactivation of the P53-pathway and die before birth. Treatment of Eftud2ncc−/− embryos with pifithrin-α, a P53-inhibitor, partly improved brain and craniofacial development. To uncover if craniofacial malformations and death were indeed due to P53 hyperactivation we generated embryos with homozygous loss of function mutations in both Eftud2 and Trp53 in the neural crest cells. We evaluated the molecular mechanism underlying craniofacial development in pifithrin-α-treated embryos and in Eftud2; Trp53 double homozygous (Eftud2ncc−/−; Trp53ncc−/−) mutant embryos. Eftud2ncc−/− embryos that were treated with pifithrin-α or homozygous mutant for Trp53 in their neural crest cells showed reduced apoptosis in their neural tube and reduced P53-target activity. Furthermore, although the number of SOX10 positive cranial neural crest cells was increased in embryonic day (E) 9.0 Eftud2ncc−/−; Trp53ncc−/− embryos compared to Eftud2ncc−/− mutants, brain and craniofacial development, and survival were not improved in double mutant embryos. Furthermore, mis-splicing of both P53-regulated transcripts, Mdm2 and Foxm1, and a P53-independent transcript, Synj2bp, was increased in the head of Eftud2ncc−/−; Trp53ncc−/− embryos. While levels of Zmat3, a P53- regulated splicing factor, was similar to those of wild-type. Altogether, our data indicate that both P53-regulated and P53-independent pathways contribute to craniofacial malformations and death of Eftud2ncc−/− embryos.

1. Introduction

Pathogenic variants in EFTUD2, which encodes a GTPase and a core component of the U5 subunit of the spliceosome [1], are responsible for the congenital syndrome Mandibulofacial Dysostosis with Microcephaly (MFDM) (OMIM#610536). MFDM patients have a range of craniofacial abnormalities that include micrognathia, small dysplastic pinnae, malar hypoplasia, hearing loss, microcephaly and developmental delay [2]. Mutant mice carrying a heterozygous loss-of-function mutation in Eftud2 are viable and fertile, and do not model MFDM [3]. On the other hand, embryos that are homozygous for the same loss of function mutation fail to implant and arrest at the blastocyst stage [3]. However, Eftud2ncc−/− embryos with Wnt1-Cre2 mediated deletion of exon 2 of Eftud2 have severe brain and craniofacial malformations, in the same precursor that is affected in MFDM patients, thereby modelling those head and face defects that are found in patients [4].
RNAseq analysis using heads of Eftud2ncc−/− embryos, prior to the onset of malformations, revealed increased skipping of exon 3 of Mdm2, a master regulator of Trp53 (P53). Additionally, the levels of nuclear P53 and P53-regulated genes, including Mdm2, were increased in Eftud2ncc−/− embryos and in O9-1 neural crest cells after siRNA mediated knockdown of Eftud2. Furthermore, levels of P53 target genes were reduced when full-length Mdm2 was overexpressed in O9-1 cells with Eftud2 knockdown, and treatment of pregnant females with pifithrin-α improved craniofacial development in Eftud2ncc−/− embryos [4]. Therefore, we proposed that craniofacial malformations that are found in Eftud2ncc−/− embryos was a consequence of the mis-splicing of Mdm2 leading to hyperactivation of the P53 pathway.
Herein, we show that P53 level and activity are reduced in Eftud2ncc−/− embryos that were treated with pifithrin-α. These embryos also had reduced apoptosis in their neural tube. We generated Eftud2ncc−/−; Trp53ncc−/− double mutant embryos and showed that they had reduced nuclear P53 and P53-activity, no changes in mitosis, and reduced apoptosis in their neural tube. Furthermore, although Eftud2ncc−/−; Trp53ncc−/− mutants have more SOX10 positive cranial neural crest cells, when compared to Eftud2ncc−/− (Eftud2ncc−/−; Trp53 +/+) embryos, they are morphologically abnormal from embryonic day (E)9.5 to E14.5 and they die before birth, similar to the Eftud2ncc−/− mutants. Additionally, Eftud2ncc−/−; Trp53ncc−/− embryos have a significant increase in exon-skipping in P53-regulated transcripts, including Mdm2 and FoxM1, and a non-significant increase in levels of the P53-independent transcript Synj2bp, when compared to controls or Eftud2ncc−/− mutants. Our data indicate that P53 hyperactivation contributes to apoptosis in the neural tube and suggests that P53 attenuates mis-splicing in Eftud2 mutant cells. Notably our study shows that craniofacial malformations and death of Eftud2ncc−/− mutant embryos are independent of P53-activation.

2. Results

2.1. Pifithrin-α Reduces Levels of Nuclear P53, P53-Target Genes and Apoptosis in the Neural Tubes of Eftud2ncc−/− Embryos

We previously showed that pifithrin-α treatment from E6.5 – E8.5 partially improves brain and craniofacial development in E9.5 Eftud2ncc−/− mutants [4]. To determine if reduced P53 is responsible for this rescue, we examined P53 accumulation and activity in these previously generated E9.5 embryos. The levels of the three P53-regulated genes Ccng1, Trp53inp1, and Phlda3 which were significantly upregulated in heads of E9.0 Eftud2ncc−/− embryos [4], were also increased in the E9.5 mutant embryos from vehicle-treated females when compared to their control littermates (Figure 1A–C), although this difference was only significant for Ccng1 and Trp53inp1 (Figure 1A,B). In contrast, the levels of these P53-target genes were comparable in the heads of pifithrin-α-treated controls and Eftud2ncc−/− embryos (Figure 1A–C). We examined nuclear P53 accumulation in the pifithrin-α-treated embryos and found a significant increase of P53 positive nuclei in the neural tube, anterior to rhombomere 4, of the vehicle-treated Eftud2ncc−/− embryos when compared to the controls (Figure 1D,E), but not in their first pharyngeal arch (Figure 1F,G). In contrast, the number of P53 positive cells in the neural tube or pharyngeal arches of pifithrin-α treated Eftud2ncc−/− embryos was comparable to those of the controls (Figure 1D–G). These findings show that pifithrin-α treatment abolished increased P53-accumulation and activity in the neural tube of Eftud2ncc−/− embryos.
The number of dying cells found in the head of E9.5 Eftud2ncc−/− embryos was significantly increased when compared to the controls [4]. To identify the cell population undergoing apoptosis and to determine if pifithrin-α treatment modulates this increase, we quantified the number of cleaved Caspase-3-positive (apoptotic cells) in the neural tube, anterior to rhombomere 4, and the first pharyngeal arch of vehicle and pifithrin-α treated E9.5 embryos (Figure 1H–K). At this stage, Eftud2ncc−/− embryos from vehicle treated females exhibited an increase in cleaved Caspase-3 positive cells in their neural tube and first pharyngeal arch, when compared to controls (Figure 1H,J). In contrast, although the proportion of apoptotic cells in both structures was increased in Eftud2ncc−/− embryos that were treated with pifithrin-α the difference was only significant in the pharyngeal arches (Figure 1H,J). In addition, pifithrin-α treatment did not impact proliferation in the head of Eftud2ncc−/− mutant embryos (Figure S1). These data indicate that pifithrin-α reduced apoptosis in the neural tube of Eftud2ncc−/− embryos, but not in the pharyngeal arch. Altogether, our data suggest that the improved craniofacial development found in pifithrin-α treated Eftud2ncc−/− embryos at E9.5 was due to reduced P53-activity and P53-associated apoptosis in the neural tube.

2.2. Removing Two Alleles of Trp53 Decreases P53-Activity and Apoptosis in E10.5 Mutant Embryos

We next used a previously described mutant mouse line carrying Trp53 conditional mutation [5] and Wnt1-Cre2 to remove Trp53 in the neural crest cells and confirm that its loss improves craniofacial development in Eftud2ncc−/− embryos. We used two different mating schemes to generate embryos with heterozygous or homozygous loss of Trp53 (Eftud2ncc−/−; Trp53ncc+/− or Eftud2ncc−/−; Trp53ncc−/− (see Section 4) (Table S1)) and compared them to Eftud2ncc−/− embryos that were generated in our previous study [4].
We postulated that craniofacial development would be improved in E10.5 Eftud2ncc−/−; Trp53ncc+/− or Eftud2ncc−/−; Trp53ncc−/− embryos with reduced P53-levels and activity. Therefore, we first examined the levels of the P53-target genes Ccng1, Trp53inp1, and Phlda3 which were significantly increased in E9.0 and E9.5 Eftud2ncc−/− embryos. At E10.5, the levels of these genes were reduced in Eftud2ncc−/−; Trp53ncc−/− when compared to Eftud2ncc−/−, and comparable to those of the controls, as expected (Figure 2A). Next, we evaluated if nuclear P53 accumulation was reduced in the neural tube, anterior to rhombomere 4, and the first pharyngeal arch of E10.5 embryos with genetic deletion of Trp53 (Figure 2B,C). We found a non-significant increase in P53 accumulation in the neural tubes of Eftud2ncc−/− and Eftud2ncc−/−; Trp53ncc+/− embryos that was reduced in Eftud2ncc−/−; Trp53ncc−/− mutants (Figure 2B). On the other hand, nuclear P53 accumulation in the first pharyngeal arch of Eftud2ncc−/− embryos was not affected by the Trp53 genotype (Figure 2C).
We next tested if the loss of P53 impacts apoptosis or proliferation in the head of double mutant embryos. Apoptosis, as detected by nuclear cleaved-Caspase 3, was increased in the neural tubes of Eftud2ncc−/− and Eftud2ncc−/−; Trp53ncc+/− mutant embryos, although the difference was only significant in Eftud2ncc−/−; Trp53ncc+/−, when compared to controls (Figure 2D). However, this increase was no longer observed in Eftud2ncc−/−; Trp53ncc−/− embryos (Figure 2D). At E10.5, apoptosis was not significantly increased in the first pharyngeal arch of embryos with any of the three mutant genotypes (Figure 2E). Additionally, no significant changes were observed in proliferation in the head of E10.5 mutant embryos with mutations in both Eftud2 and Trp53 (Figure S2). Taken together, these data indicate that deletion of a single allele of Trp53 was not sufficient to reduce P53 accumulation or apoptosis in the neural tube. However, homozygous deletion of both Eftud2 and Trp53 did abolish the increase of nuclear P53 and the increase in apoptosis found in the neural tube of Eftud2ncc−/− embryos. Thus, we conclude that increased P53 activity mediates apoptosis in the neural tube of Eftud2ncc−/− embryos.

2.3. SOX10 Expression in the Neural Crest Was Higher in Eftud2ncc−/−; Trp53ncc−/− Mutant Embryos Than in Eftud2ncc−/− Mutants

To determine if reduction of P53 activity and apoptosis in the neural tube results in an increase in the number of post-migratory cranial neural crest cells, we examined expression of SOX10, which is expressed in these cells, in E9.0 embryos. As shown in Figure 3A–C, SOX10-expression was reduced in the frontonasal mass and first pharyngeal arch of Eftud2ncc−/− mutant embryos (n = 4) (Figure 3B) when compared to controls (n = 4) (Figure 3A). However, SOX10 immunoreactivity in Eftud2ncc−/−; Trp53ncc−/− mutants (n = 4) (Figure 3C) was comparable to that of controls. Thus, we concluded that Eftud2ncc−/−; Trp53ncc−/− mutant embryos have more SOX10-positive post-migratory neural crest cells than Eftud2ncc−/− embryos.

2.4. Removing Both Alleles of Trp53 Does Not Improve Craniofacial Development in Eftud2ncc−/− Mutants

We next assessed if reduced apoptosis and the increase in SOX10 expression in the neural crest cells led to improved craniofacial development in Eftud2ncc−/− mutant embryos when two alleles of Trp53 was deleted. As shown in Figure 4, craniofacial defects similar to those previously described in Eftud2ncc−/− mutant embryos [4] were observed in Eftud2ncc−/−; Trp53ncc+/− and in Eftud2ncc−/−; Trp53ncc−/− mutants. Briefly, at E9.5 and E10.5, all mutants had hypoplasia of the midbrain, the frontonasal prominence, and the first and second pharyngeal arches (Figure 4A,B). To quantify changes in these structures, we measured the perimeter of the first pharyngeal arches, and the dorsal/midbrain expanse of the midbrain in E9.5 and E10.5 embryos. The perimeter of the first pharyngeal arch was significantly reduced in Eftud2ncc−/− mutants at both of these stages, regardless of Trp53 genotype (Figure 5A,C). Additionally, although the ventral/dorsal expanse of the midbrain of Eftud2ncc−/− mutant embryos was reduced at E9.5 and E10.5 regardless of Trp53 genotype, (Figure 5B,D); at E9.5, this difference was not significant when Eftud2ncc−/−; Trp53ncc−/− mutants were compared to controls (Figure 5B). At E11.5, the midbrain region was virtually absent, the frontonasal prominence was abnormally shaped, and the maxillary and the mandibular processes were smaller than in controls (Figure 4C). Also, the neural tube was open in Eftud2ncc−/− (n = 3/3), in Eftud2ncc−/−; Trp53ncc+/− (n = 5/5) and in Eftud2ncc−/−; Trp53ncc−/− (n = 5/6) mutant embryos (data not shown). In addition, the proportion of E11.5 Eftud2ncc−/−; Trp53ncc+/− and Eftud2ncc−/−; Trp53ncc−/− embryos that were found alive—with craniofacial abnormalities—or dead was not significantly different from what was found for Eftud2ncc−/− mutants (Figure 5E).
At E14.5, four of the sixteen Eftud2ncc−/−; Trp53ncc+/− embryos were alive, among which one was phenotypically normal (n = 7 litters). Alcian blue staining revealed no cartilage defects in the phenotypically normal Eftud2ncc−/−; Trp53ncc+/− mutant (Figure S3C). In contrast, no phenotypically normal Eftud2ncc−/−; Trp53ncc−/− embryo was recovered at this stage (n = 3 litters). In fact, only one phenotypically abnormal Eftud2ncc−/−; Trp53ncc−/− embryo was recovered alive at E14.5 (n = 3 litters) (Figure 4D and Figure 5F).
In phenotypically abnormal Eftud2ncc−/−; Trp53ncc+/− embryos (n = 3) and in the Eftud2ncc−/−; Trp53ncc−/− embryo, cartilage preparations with Alcian blue revealed severe craniofacial defects (Fig.S3). Meckel’s cartilage, which will form the lower jaw, was present and smaller in one Eftud2ncc−/−; Trp53ncc+/− embryo but absent in the remaining (n = 2/3). This cartilage was not found in the single Eftud2ncc−/−; Trp53ncc−/− embryo. The paranasal cartilage, nasal and basal portion of the trabecular plate and the orbital cartilage were missing in all the phenotypically abnormal mutants (n = 4/4). The frontal cartilage was abnormally shaped (2/4) or absent (2/4) in the mutant embryos. Similarly, the alas temporalis cartilage was absent in Eftud2ncc−/−; Trp53ncc+/− (2/3) and Eftud2ncc−/−; Trp53ncc−/− embryos and abnormally shaped in one Eftud2ncc−/−; Trp53ncc+/− embryo, while the basitrabecular process was absent in all the morphologically abnormal mutants (4/4). Similarly, cartilages of the chondocranium that are derived from head mesoderm, such as the hypochiasmatic cartilage (4/4) and the acrochordal cartilage were absent (3/4) or abnormal (1/4). In contrast, the occipital arch cartilage was present but abnormally shaped in phenotypically abnormal Eftud2ncc−/−; Trp53ncc+/− and Eftud2ncc−/−; Trp53ncc−/− embryos (Figure S3). Finally, the external ears did not form in any mutants regardless of Trp53 status. As such, although we recovered one morphologically normal Eftud2ncc−/−; Trp53ncc+/− embryo, our data indicate that removing one or both alleles of Trp53 was not sufficient to rescue craniofacial defects in most Eftud2ncc−/− embryos.

2.5. Homozygous Deletion of Trp53 Does Not Improve Survival of Eftud2ncc−/− Embryos

We next determined if the survival of Eftud2ncc−/−; Trp53ncc−/− mutants was prolonged when compared to Eftud2ncc−/− mutants. No Eftud2ncc−/−; Trp53ncc−/− mutants were found at E18.5 (n = 0/32, versus expected 8/32, χ2 P = 0.0429). In fact, only one resorption could be genotyped and confirmed as an Eftud2ncc−/−; Trp53ncc−/− mutant (n = 3 litters). Overall, these data indicate that removing two alleles of Trp53 in Eftud2ncc−/− mutant embryos did not significantly improve survival.

2.6. The Xbp-1-Associated ER-Stress Pathway Is Not Activated in Eftud2ncc−/− Embryos with Heterozygous or Homozygous Deletion of Trp53

Heterozygous mutation of EFTUD2 in human cells caused mis-splicing and/or mis-expression of key genes that are involved in ER-stress, including increased XBP1 splicing [6]. Therefore, we tested if Xbp1 splicing was increased in E9.5 Eftud2ncc−/− mutants and Eftud2ncc−/− mutants with a heterozygous or homozygous deletion of Trp53. However, no significant difference was found in the splicing of Xbp1 (Figure S4) when controls (n = 6), Eftud2ncc−/−; Trp53ncc+/− (n = 4) or Eftud2ncc−/−; Trp53ncc−/− (n = 5) mutant embryos were compared. This data indicates that the Xbp-1 associated ER stress pathway is unlikely to be a major contributor to craniofacial defects or death of Eftud2ncc−/− mutants, regardless of their Trp53 genotype.

2.7. FoxM1, a P53-Target, Is Abnormally Spliced in Eftud2ncc−/− Mutant Embryos

In our previous RNAseq analysis using the heads of morphologically normal E9.0 Eftud2ncc−/− embryos, we showed that mis-splicing of Mdm2 contributed to upregulation of P53 [4]. We postulated that mis-splicing of a P53-independent or dependent target contributes to these malformations. Therefore, we further analyzed our previously published RNAseq data and found a significant increase in the skipping of exon 7 (p = 8.63 × 10⁻⁶, FDR = 0.005) of FoxM1, which is negatively regulated by P53 [7], in Eftud2ncc−/− embryos. RT-PCR analysis revealed that a transcript with the predicted skipping of exon 7 was present and enriched in Eftud2ncc−/− mutants, and not found in controls (Figure S5A). Furthermore, at E9.5, mis-splicing of FoxM1 was significantly increased in Eftud2ncc−/−; Trp53ncc−/− embryos when compared to controls or Eftud2ncc−/− mutants with wild-type Trp53 (Figure 6A). However, although mis-splicing and expression levels of FoxM1 was increased at E10.5, the expression of its target Cdc25b was non-significantly reduced in the heads of E10.5 Eftud2ncc−/−; Trp53ncc−/− embryos (Figure S5B,C).
Thus, we conclude that increased mis-splicing of FoxM1 was unlikely to be a major contributor to craniofacial defects in Eftud2ncc−/−; Trp53ncc−/− embryos.

2.8. Mis-Splicing Is Increased in Eftud2ncc−/−; Trp53ncc−/− Embryos

Since we found an unexpected increase in mis-splicing of FoxM1 in Eftud2ncc−/−; Trp53ncc−/− mutant embryos, we next evaluated exon-skipping in two transcripts which were mis-spliced in Eftud2ncc−/− mutants wild-type for Trp53. RT-PCR analysis of the heads of mutant and control embryos revealed a significant increase in the proportion of Mdm2 transcripts missing exon 3 in Eftud2ncc−/−; Trp53ncc+/− and in Eftud2ncc−/−; Trp53ncc−/− embryos, when compared to controls or Eftud2ncc−/− that are wild-type for Trp53 (Figure 6B). To determine if P53-independent targets also showed increased mis-splicing, we next interrogated the list of genes that were alternatively spliced in our previous RNAseq analysis from both E9.0 and E9.5 head embryos [4]. Amongst the transcripts with a FDR < 0.01, an inclusion level difference >0.1 and with an average number of reads close to 100, we selected Synj2bp for further validation. We designed primers flanking the skipped exon and used RT-PCR to quantify the ratio of the Synj2bp full-length and short transcripts in our samples. Although not significant, we found a higher proportion of the shorter transcript without exon 2 of Synj2bp in Eftud2ncc−/−; Trp53ncc+/− and in Eftud2ncc−/−; Trp53ncc−/− mutant heads when compared to controls or Eftud2ncc−/− embryos wild-type for Trp53 (Figure 6C). Altogether these data indicate that the presence of wild-type Trp53 might attenuate mis-splicing in Eftud2ncc−/− mutant cells.

2.9. Zmat3 Is Not Upregulated in Eftud2ncc−/−; Trp53ncc−/− Embryos

ZMAT3 is a P53-regulated RNA splicing factor that regulates exon skipping in a number of transcripts, including exon 3 of Mdm2 [8,9]. Therefore, we examined the expression of this gene to determine if it is responsible for the increased mis-splicing that was found in Eftud2ncc−/− mutants with reduced P53 activity. At E9.5 and E10.5, Zmat3 expression was significantly increased in Eftud2ncc−/− mutants that are wild-type for Trp53, when compared to controls (Figure 6D,E). However, homozygous deletion of Trp53 attenuated this increase at E9.5 (Figure 6D). Additionally, although levels of Zmat3 were increased in E10.5 Eftud2ncc−/−; Trp53ncc−/− mutants (Figure 6E), this difference was not significant when compared to controls. Thus, we conclude that P53 reduces mis- splicing in Eftud2ncc−/− mutant cells in a ZMAT3-independent fashion.

3. Discussion

Herein, we investigated the contribution of the P53-pathway to craniofacial malformations in Eftud2ncc−/− mutant embryos. We show that we can reduce P53 levels and activity in the neural tube by treating Eftud2ncc−/− embryos with pifithrin-α or using Wnt1-Cre2 to delete both alleles of Trp53. Furthermore, although reducing P53-activity attenuated apoptosis in the neural tube of Eftud2ncc−/− embryos, it did not rescue craniofacial development. We also show that mis-splicing is increased in Eftud2ncc−/−; Trp53ncc−/− mutants and that this increase was not associated with a significant change in levels of the P53-regulated splicing factor, Zmat3. These data indicate that P53-independent pathways contribute to craniofacial defects in Eftud2ncc−/− mutants and reveal a previously unappreciated role for P53 in regulating mis-splicing.
The increased accumulation and activity of P53 secondary to mutations in genes that are involved in a diverse array of cellular processes, including splicing, contribute to malformations in animal models of developmental syndromes [10,11]. In a few cases, increased P53 activity was also found in clinical samples from patients with developmental syndromes [11]. More specifically, mouse models of neurocristopathies have overactivation of the P53 pathway and reducing the levels of P53 improve and in some cases rescue malformations in these models [12,13]. A similar partial rescue was found when Eftud2 was mutated in zebrafish [14,15]. Based on our previous findings that pifithrin-α improved neural tube and craniofacial development in Eftud2ncc−/− embryos we postulated that reducing P53 in mouse would lead to a similar outcome [4].
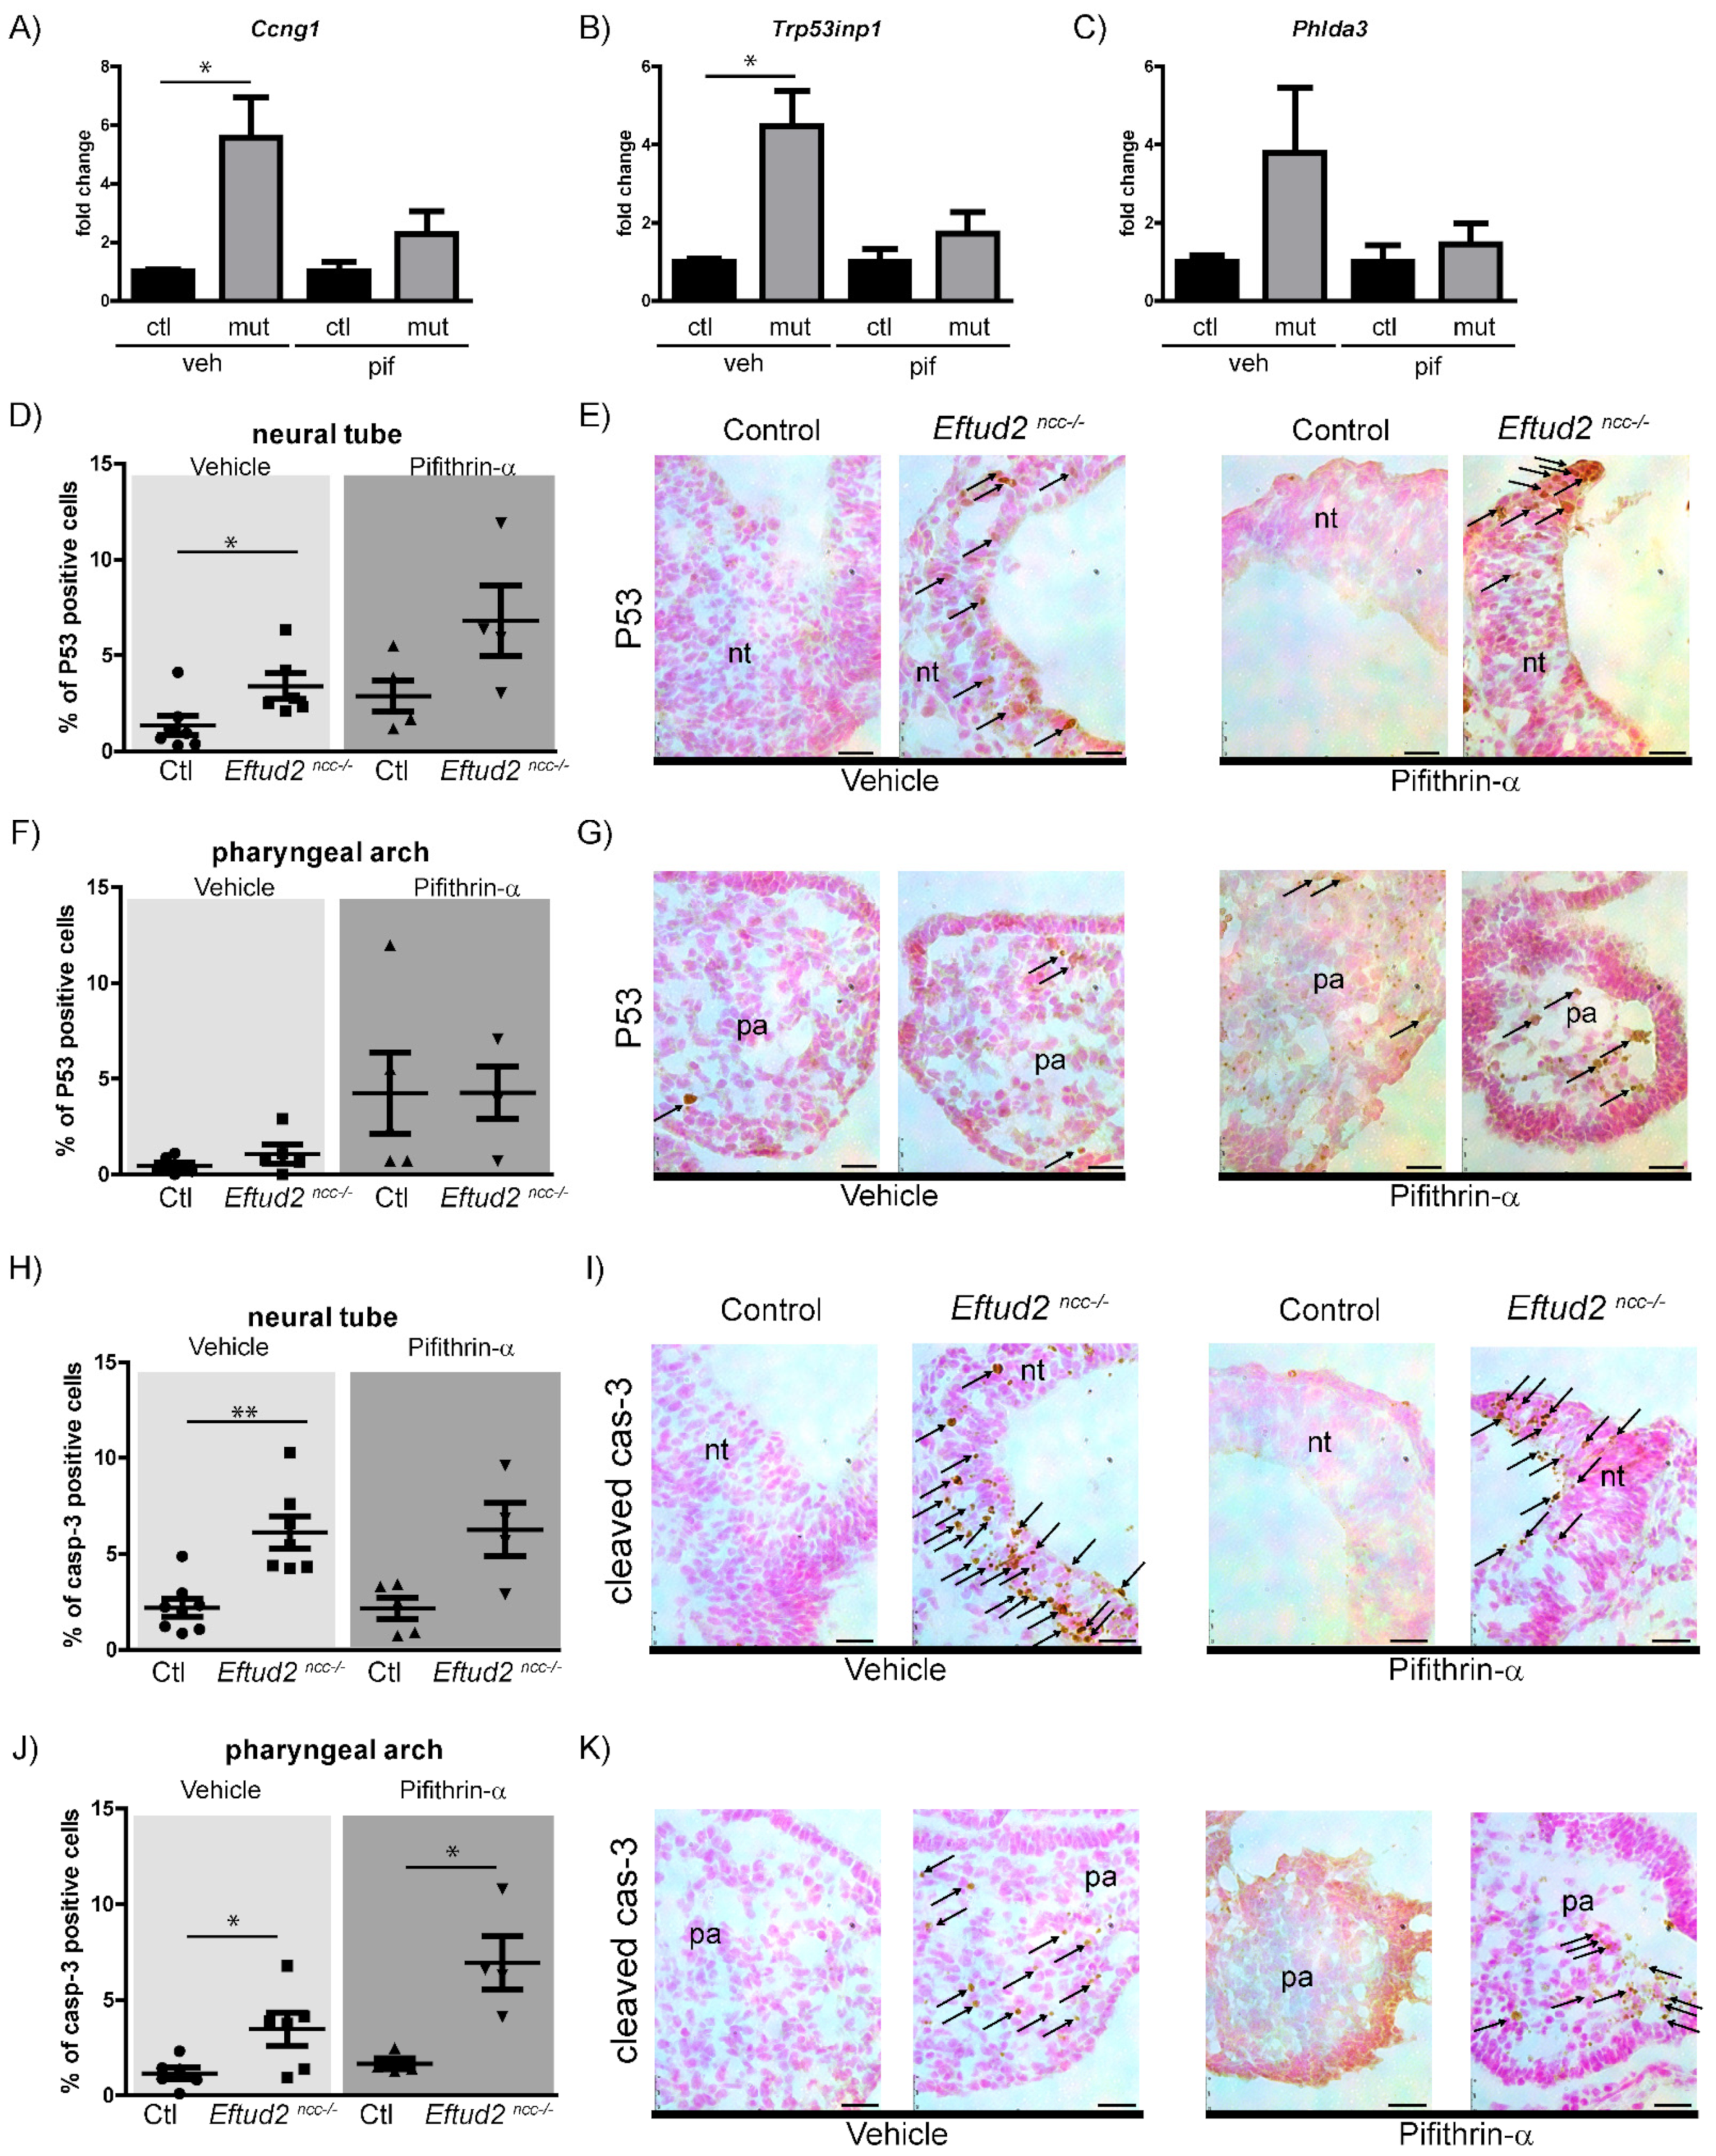
In the present study, we show that P53-activity was increased in the heads of E9.5 Eftud2ncc−/− embryos and that this increase was attenuated by pifithrin-α. More specifically, we show that Eftud2ncc−/− mutant embryos at this stage had increased nuclear P53 accumulation and apoptosis in the neural tube, but not the first pharyngeal arch. Therefore, and not surprisingly, treating these mutant embryos with pifithrin-α led to reduced apoptosis in the neural tube and not in the first pharyngeal arch. We previously showed that the perimeter of the first pharyngeal arch of pifithrin-α treated Eftud2ncc−/− embryos is larger than those of vehicle-treated mutants [4]. Therefore, it is surprising that we found a significant increase in apoptosis in pharyngeal arches of embryos that were exposed to pifithrin-α from E6.5 to E8.5. Although this data suggest that P53-independent activity leads to the death of Eftud2 mutant cells in the pharyngeal arches, further work is needed to decipher how a loss of Eftud2 results in abnormal development of the first arch and its derivatives, including Meckel’s cartilage. Although first identified as a P53 inhibitor, pifithrin-α can also have P53-independent activity [16]. In fact, its mechanism of action remains unclear and its specific effect on P53 may vary in different cell types. For instance, pifithrin-α was associated with cell-type specific phosphorylation of P53 and the differential expression of its target genes [16]. Moreover, it was reported to reduce intracellular reactive oxygen species (ROS) independently of P53 [16]. To rule out the contribution of a P53-independent mechanisms to the partial rescue of craniofacial development that were found in pifithrin-α-treated Eftud2ncc−/− embryos, we used a genetic approach and deleted Trp53 in Eftud2 mutant cells.
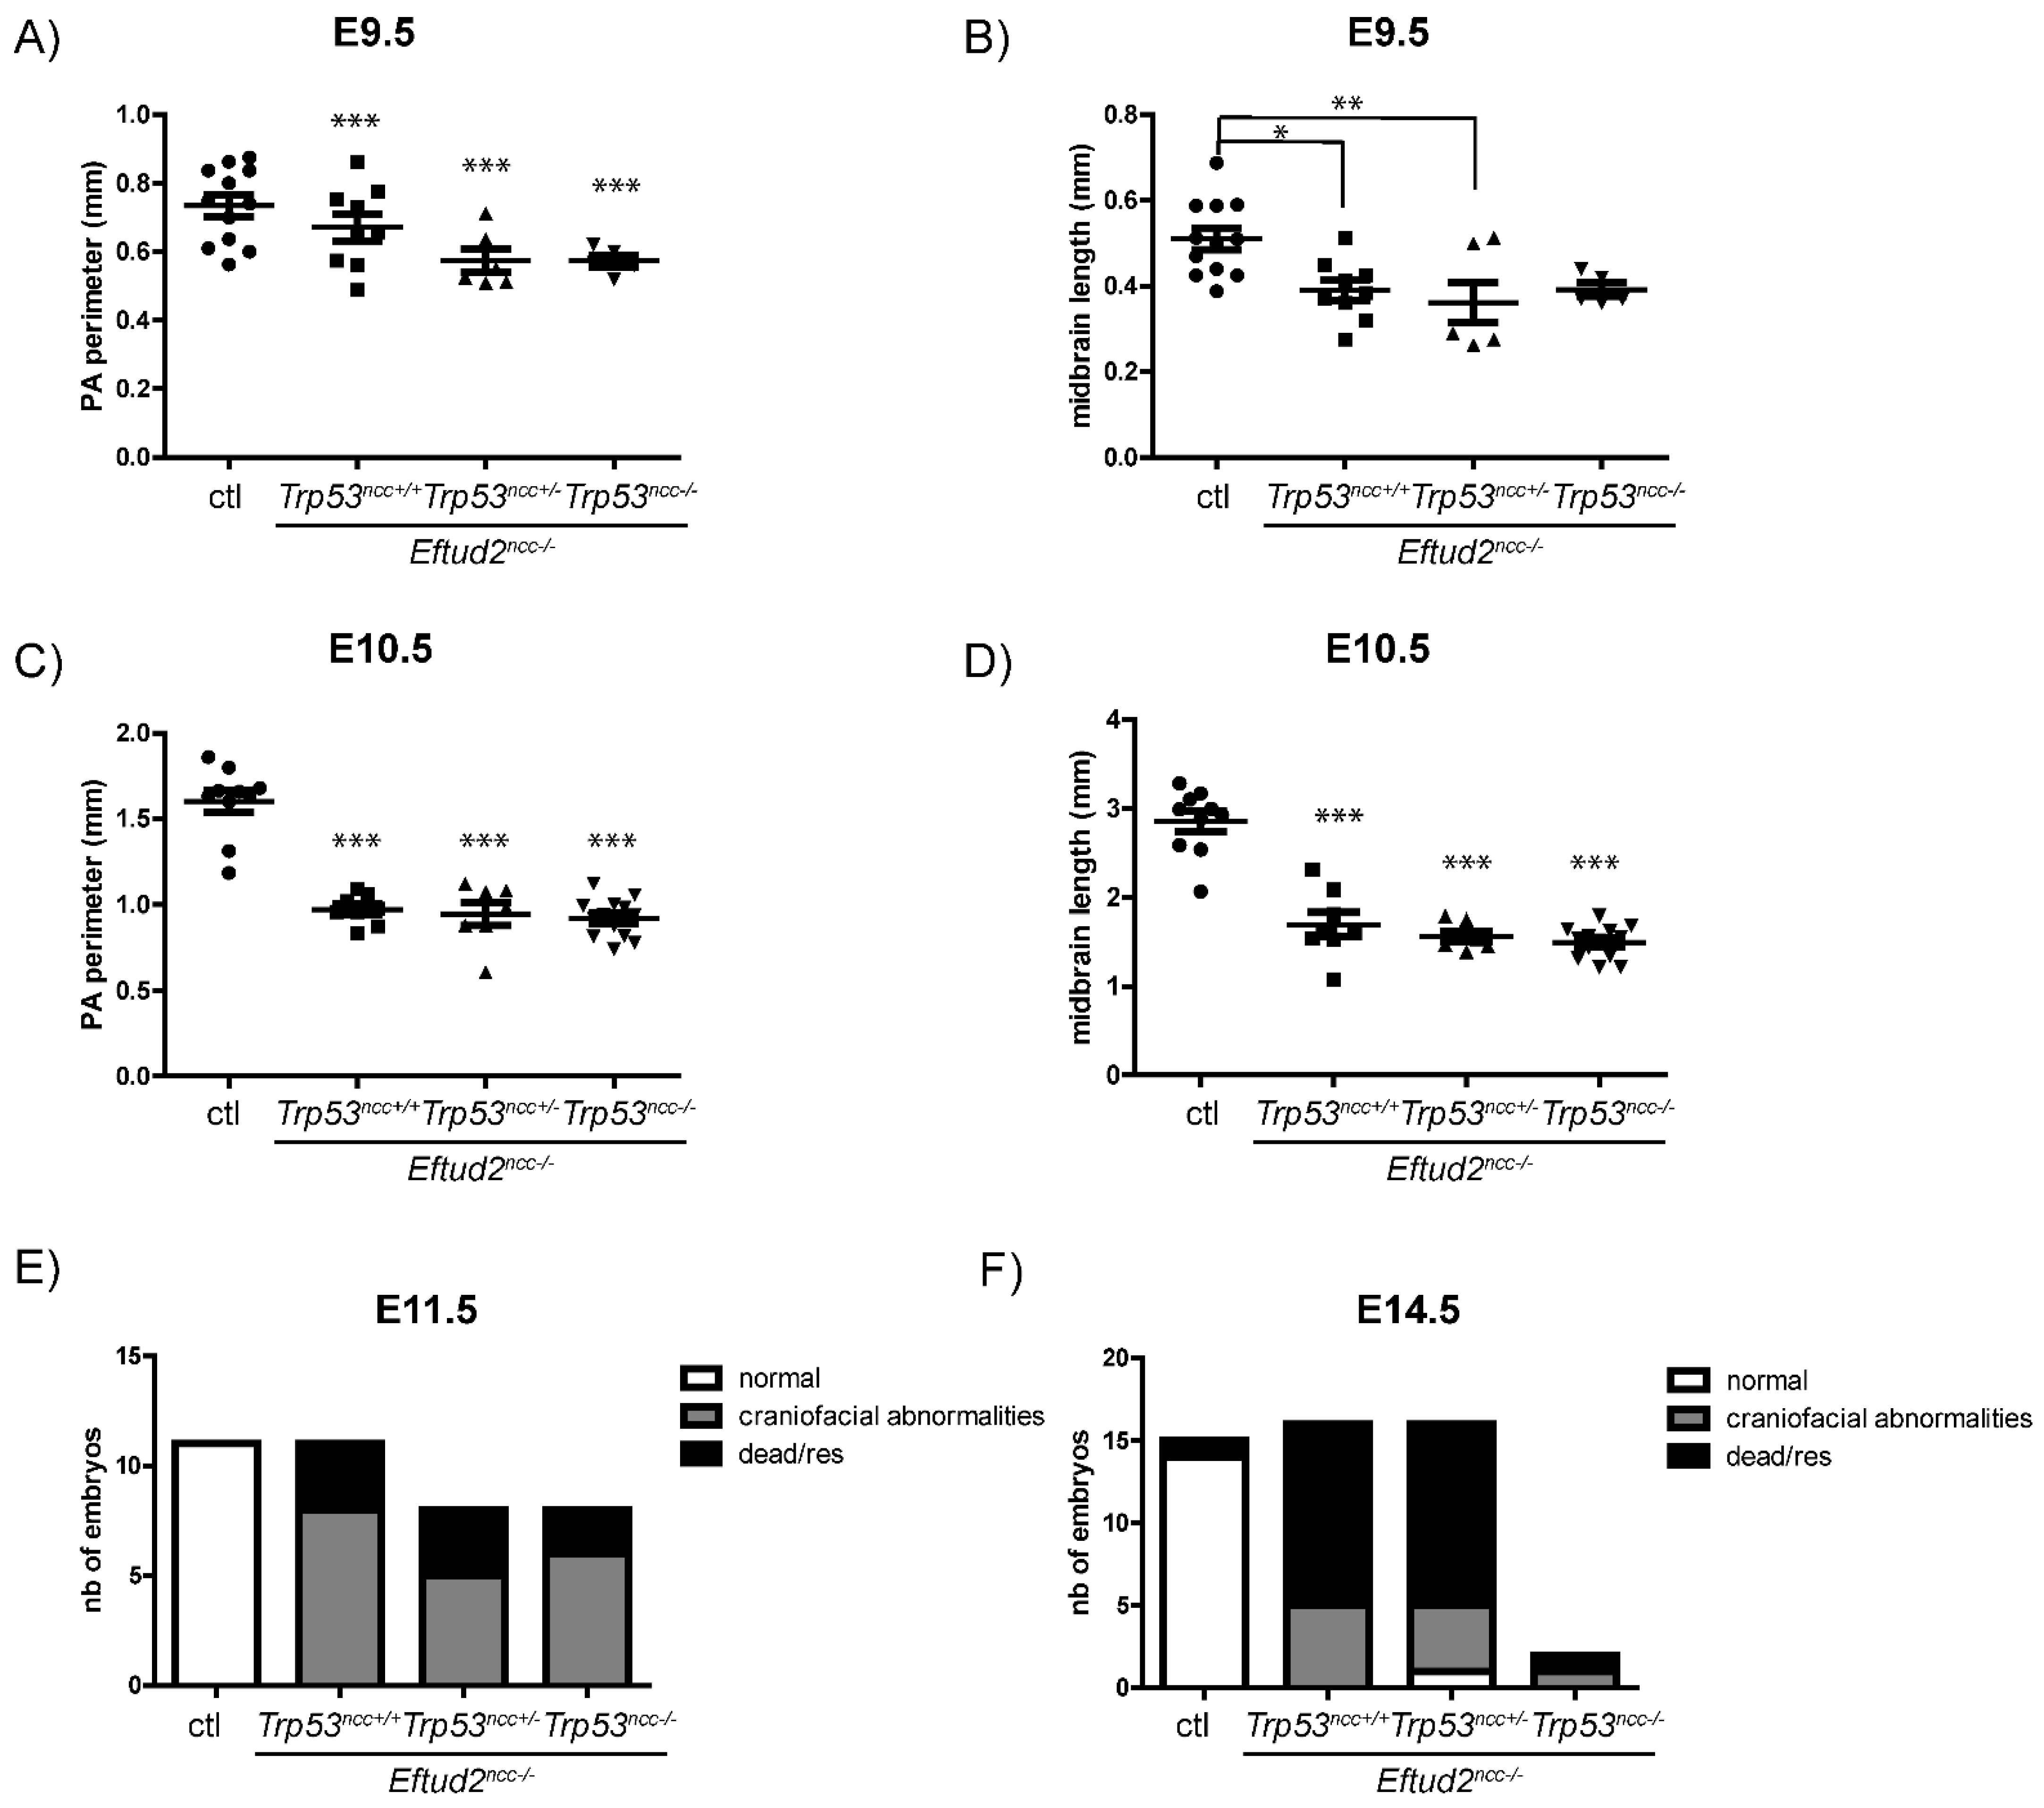
When we used the Wnt1-Cre2 transgenic mouse line to remove both alleles of Eftud2 and one allele of Trp53 (Eftud2ncc−/−; Trp53ncc+/− embryos), there was still an increase in nuclear P53 accumulation and in P53 activity. Additionally, most Eftud2ncc−/−; Trp53nc+/− embryos resembled Eftud2ncc−/− mutants, except for one morphologically normal embryo that was recovered at E14.5. Therefore, we cannot completely rule out the possibility that reducing the levels of P53 can prevent craniofacial defects in Eftud2ncc−/− mutants. However, this is likely to be a very rare event. In fact, when all stages were combined, no additional morphologically normal Eftud2ncc−/−; Trp53ncc+/− (n = 42) or Eftud2ncc−/−; Trp53ncc−/− (n = 35) embryos were found. Unfortunately, molecular studies could not be performed on this embryo as the litter was collected for cartilage preparations.
Since Eftud2 and Trp53 both map to chromosome 11 and are only 33cM apart, it was difficult to generate both Eftud2ncc−/− and Eftud2ncc−/−; Trp53ncc−/− embryos from the same cross. Therefore, we generated Eftud2ncc−/−; Trp53ncc+/− and Eftud2ncc−/−; Trp53ncc−/− embryos in separate crosses and compared the morphological and the molecular defects that were found to those that we previously described in Eftud2ncc−/− embryos. Our current studies show that P53 accumulation and activity were reduced in Eftud2ncc−/−; Trp53ncc−/− mutant embryos, suggesting that the P53-pathway was efficiently inhibited. Furthermore, as was found for pifithrin-α treated Eftud2ncc−/− mutants, apoptosis was significantly reduced in the neural tube of double homozygous mutant embryos. However, in double homozygous mutant embryos the onset of craniofacial malformations, and the size of the pharyngeal arches and the midbrain, were no different from Eftud2ncc−/− embryos wild type for Trp53. Nor did a loss of P53 extend the life of Eftud2ncc−/− embryos. Altogether, these data indicate that the malformations found in Eftud2ncc−/− embryos are predominantly P53-independent. In the future, we will identify the pathways that are responsible for these malformations.
Nonetheless, our study suggests that the reduced apoptosis in the neural tube most likely leads to an increase in the number of neural crest cells in Eftud2ncc−/−; Trp53ncc−/− embryos. Supporting this, we found reduced SOX10 expression in E9.0 Eftud2ncc−/− mutants that were morphologically similar to controls. Moreover, removing both copies of Trp53 resulted in an increase of SOX10 expression in the head of Eftud2ncc−/−; Trp53ncc−/− embryos. Using the ROSA26R reporter, we previously showed that the proportion of Cre-expressing cells was similar in control and E9.0 Eftud2ncc−/− mutant embryos, suggesting that these embryos have a similar number of neural crest cells [4]. Our results from this study indicate that at this stage, Eftud2ncc−/− mutant cranial neural crest cells have attenuated expression of SOX10, a marker of post-migratory neural crest cells. Thus, we propose that increased P53 activity in the cranial neural crest cells of E9.0 Eftud2ncc−/− mutants as they exit the neural tube leads to the abnormal expression of proteins such as SOX10, important for their survival and patterning in the pharyngeal arches. Since removing P53 increases expression of SOX10 in Eftud2ncc−/− mutant cells but does not rescue craniofacial development, we further postulate that SOX10 is not sufficient to protect Eftud2ncc−/− mutant neural crest cells in the first pharyngeal arch from undergoing cell death at E9.5. However, although we assumed that the number of surviving neural crest cells is insufficient to rescue brain and craniofacial development, we cannot rule out the possibility that surviving neural crest cells cannot differentiate and form the cartilage and bones of the head and face. Furthermore, although we did not see increased splicing of Xbp1 suggesting that the IRE1α pathway was not activated, we cannot exclude that one of the remaining two- arms of the ER-stress pathway is activated and contributes to Caspase-3 independent cell death of Eftud2ncc−/− mutant cells.
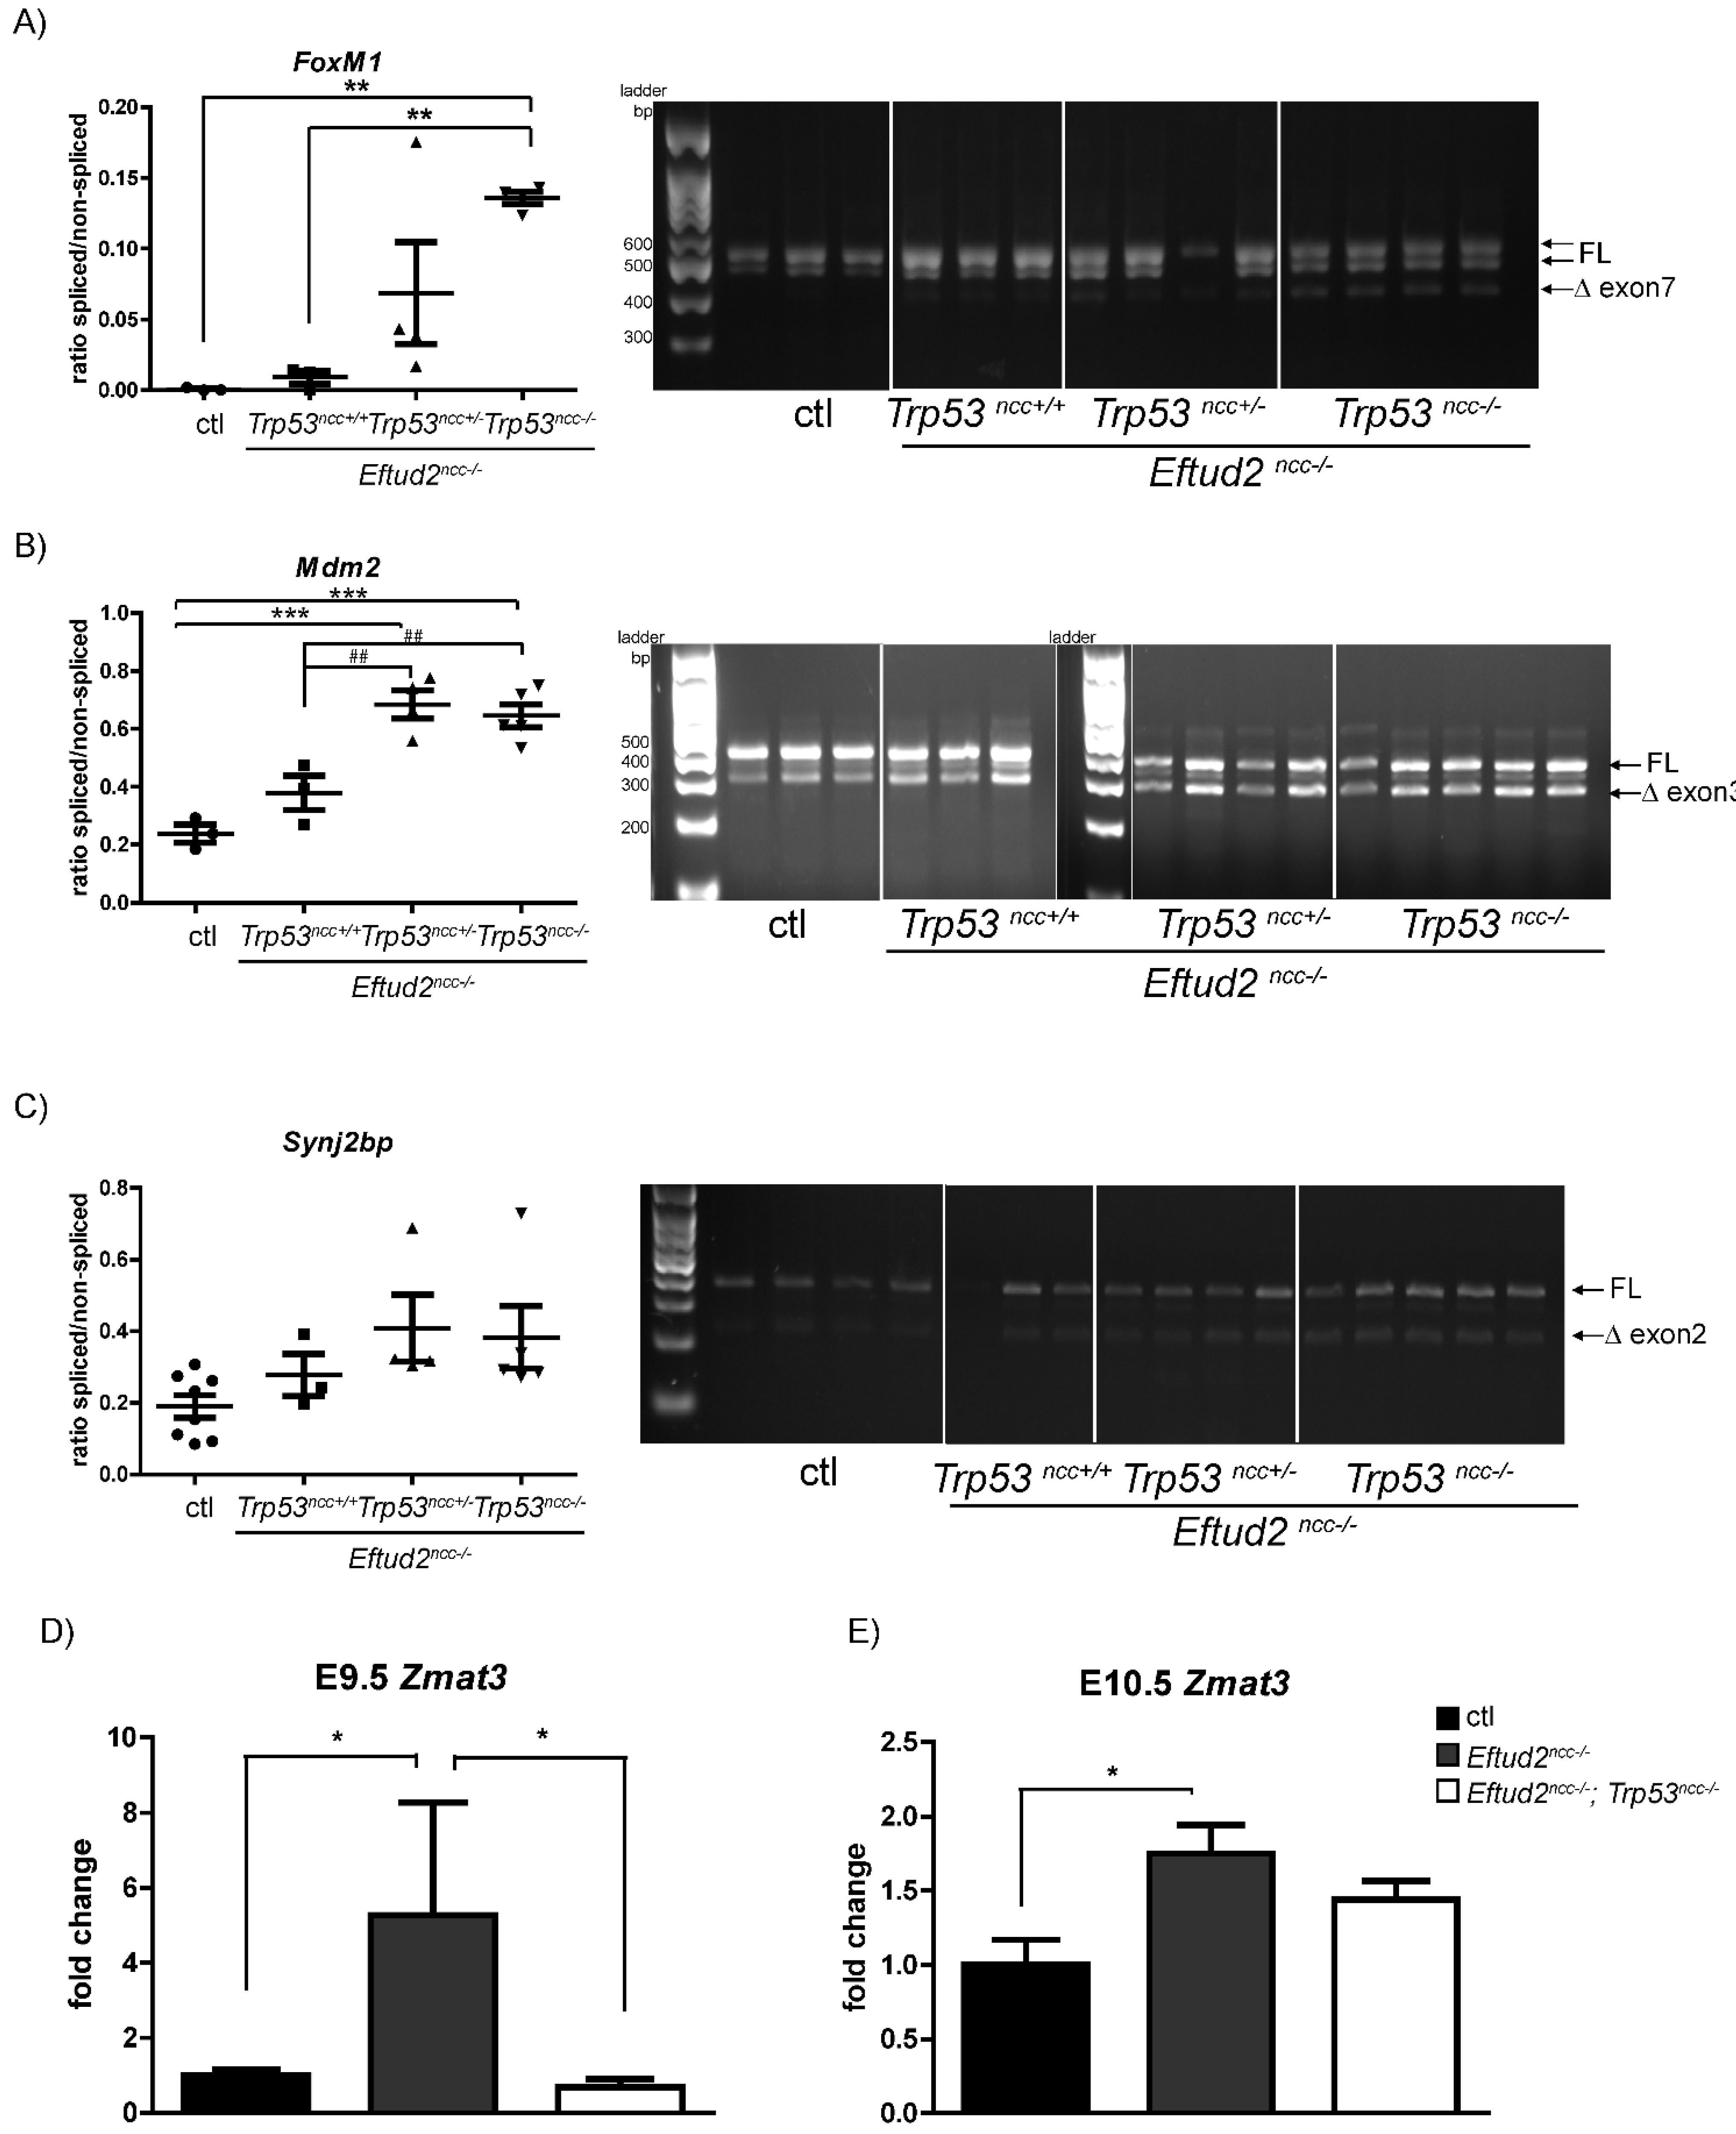
We next examined our RNAseq dataset for additional pathways/transcripts which may contribute to defects. We examined a role for FoxM1, a transcription factor which is essential for G2 progression into mitosis [17], that was mis-spliced in these mutants. FoxM1 is required for embryonic survival and normal craniofacial development [18], and is expressed in the head and the pharyngeal arches of E10.5 embryos [19]. However, its expression and that of its downstream target, Cdc25b, was not significantly changed in mutant embryos, ruling it out as a major contributor to craniofacial defects found in Eftud2ncc−/− embryos that were wild-type or mutant for Trp53.
Surprisingly, the mis-splicing of at least three-transcripts: Foxm1, Mdm2 and Snynj2b was increased in Eftud2ncc−/−; Trp53ncc−/− embryos, suggesting that wild-type P53 activity tampered mis-splicing. Therefore, we examined the expression of Zmat3 which encodes for an RNA binding protein that is regulated by P53 [9]. We hypothesized that the expression of this splicing factor would be further increased in Eftud2ncc−/−; Trp53ncc−/− embryos, thus explaining the increased exon skipping that was found. However, Zmat3 overexpression was completely abrogated when Trp53 was deleted, consistent with the observation that it is regulated by P53 [9]. We propose that one, or more, yet to be identified splicing factors are negatively regulated by P53 and are over expressed in Eftud2ncc−/−; Trp53ncc−/− embryos.
Identifying this gene(s) will be essential for determining how P53 attenuates splicing of Foxm1, Mdm2 and Snynj2b in Eftud2 mutant cells. Further RNAseq analysis using the heads of double mutant embryos will be needed to confirm a global increase in mis-splicing.

4. Materials and Methods

4.1. Mouse Lines

All the procedures and experiments were performed according to the guidelines of the Canadian Council on Animal Care and approved by the Animal Care Committee of the Montreal Children’s Hospital. Wild-type CD1 mice (strain code 022) were purchased from Charles Rivers (Laval, QC, Canada) and wild-type C57Bl/6 mice (stock #000664) were purchased from Jackson Laboratories (Augusta, ME, USA). Wnt1-Cre2 mice on the 129S4 genetic background were purchased from Jackson’s laboratory (stock# 022137). These Wnt1-Cre2 transgenic mice express Cre recombinase under the control of the mouse Wnt1, wingless-related MMTV integration site 1, promoter and enhancer [20]. The Trp53tm1brn mouse line on the C57BL/6 genetic background with loxP sites flanking exons 2–10 of the Trp53 gene was purchased from Jackson’s laboratory (Trp53loxP/+) (stock# 008462) [5]. The generation and the characterization of the conditional Eftud2em2Lajm (Eftud2loxp/+) line on the inbred C57BL/6 and mixed CD1 genetic backgrounds, and the Eftud2em1Lajm (Eftud2+/−) exon 2 deletion line on a mixed CD1 genetic background were described previously [3,4].

4.2. Pifithrin-α Treatment

Pregnant females from mating between Eftud2loxP/loxP and Eftud2+/−; Wnt1- Cre2tg/+ mice were injected with 2.2mg/kg pifithrin-α (Sigma-Aldrich, Saint-Louis, Missouri, USA) or 2% DMSO/PBS (vehicle) daily through intra-peritoneal injection, starting at E6.5 until E8.5. The embryos that were collected at E9.5 were previously generated [4,12].

4.3. Generation of Mutation in Eftud2 and Trp53 in Neural Crest Cell-Specific

Trp53 and Eftud2 both map to mouse chromosome 11 and are approximately 33cM apart. Since these two genes show non-mendelian segregation (Table S1), Eftud2ncc−/−; Trp53ncc+/− (Eftud2loxP/−; Trp53loxP/+; Wnt1-Cre2tg/+) embryos were generated by mating Eftud2loxP/+; Trp53loxp/loxp and Eftud2+/−; Wnt1-Cre2tg/+ mice. We generated double homozygous mutant embryos (Eftud2loxP/−; Trp53loxp/loxp; Wnt1-Cre2tg/+) by mating Eftud2loxP/loxP; Trp53loxp/loxp mice to Eftud2+/−; Trp53loxP/loxP; Wnt1-Cre2tg/+ mice. Eftud2ncc−/− (Eftud2loxP/−; Wnt1-Cre2 tg/+) mutant embryos that were generated as previously described were used for comparison [4]. From these matings, we used the embryos that did not carry the Wnt1-Cre2 transgene as controls.
Cre recombinase activity was reported in the male germline of Wnt1-Cre2 mice on the 129S4 background [21]. Since the embryos carrying homozygous mutation of Eftud2 in all cells arrest pre-implantation, [3] we did not recover Eftud2ncc−/− embryos with germline homozygous deletion of Eftud2. All embryos that were analyzed in this study were on a mixed genetic background following the multiple crosses that were needed to generate double homozygous mutants.

4.4. Collection of Embryos

For embryo collection, the day that a vaginal plug was seen was considered embryonic day 0.5 (E0.5). On the day of dissection, the embryos were removed from their extraembryonic membranes; for stages E8.5 to E10.5, the number of somites was counted under light microscope (Leica MZ6 Infinity1 stereomicroscope). The embryos were fixed in 1 or 4% paraformaldehyde at 4 °C overnight (unless otherwise stated), washed in PBS and kept at 4 °C. The yolk sacs were collected and used for genomic DNA extraction for genotyping.

4.5. Cartilage Preparation

To evaluate cartilage formation, embryos were stained with Alcian Blue as previously described [4]. BABB-cleared embryos were visualized under a light microscope (Leica MZ6 Infinity1 stereomicroscope).

4.6. Preparation of Embryos for Embedding and Histology

The dissected embryos were fixed in 1% paraformaldehyde overnight. For cryo-embedding, the fixed embryos were first cryoprotected in 30% sucrose overnight, embedded in cryomatrix and sectioned at 10 μm thickness for immunohistochemistry and immunofluorescence.

4.7. Immunohistochemistry (IHC) and Immunofluorescence (IF)

Cleaved Caspase-3 (1:250, cat#9661T, Cell Signaling, NEB, Whitby, Ontario, Canada), P53 (1:250, cat#2524, Cell Signaling, NEB, Whitby, ON, Canada), and Phosphohistone H3 (Ser10) (1:200, cat#06-570, Sigma-Aldrich, Saint-Louis, MO, USA) primary antibodies were used. For IHC, an avidin/biotin-peroxidase based system was used (VECTASTAIN® Elite ABC HRP Kit: PK-620000, Vector Laboratories, Newark, CA, USA) containing biotinylated universal (anti-mouse/rabbit IgG) secondary antibody and visualized with DAB (Vector Laboratories). After rinsing with water, the slides were counterstained with Nuclear Fast Red before mounting with an aqueous mounting medium. For quantification of colorimetric signal, particle analysis on Image J was used. 2 to 3 sections per embryo were imaged. To count the number of total cells, the sections after the ones that were used for IHC was mounted with DAPI and particle analysis on Image J was used to determine the total number of cells in the head. The percentage of positive cells were determined as follows: the number of P53 or cleaved Caspase-3-positive cells/number of DAPI-positive cells in the head X100, and plotted using GraphPad (Prism).
For wholemount immunofluorescence, embryos were fixed in 1%PFA overnight, washed with PBS and incubated with SOX10 antibody (1:100, cat#78330S, Cell Signaling, NEB, Whitby, ON, Canada) in blocking buffer (1% BSA, 5% serum, 0.3% TritonX100) overnight at 4 °C. After washing with PBS, embryos were incubated with goat anti-rabbit Alexa 568 (1:500, #A11011, ThermoFisher, Waltham, MA, USA) in blocking buffer overnight with DAPI (1 μg/mL). On the next day, the embryos were washed, and images were captured on Leica microsystem (model DM6000B) and Leica camera (model DFC 450). We thank Dr. Colin Dinsmore for the protocol.

4.8. RNA Isolation for RT-qPCR

RNA extraction and RT-qPCR analysis was performed as previously published [4]. The primers used are listed in Table 1.

4.9. Primers Used for Splicing Analysis

For Mdm2, FoxM1 and Synj2bp splicing analysis, cDNA was amplified with a RT-PCR program that included a hot start at 95 °C for 5 min, followed by 35 cycles of a denaturation step at 95 °C for 10 s, an annealing step at 55 °C for 30 s, an extension step at 72 °C for 45 s with a final extension step at 72 °C for 10 min. The products were visualized on a 2% agarose gel. The primers that were used are as follow: Mdm2 Forward (exon2-6/7): GATCACCGCGCTTCTCCTGC, Mdm2 Reverse (exon2-6/7): GATGTGCCAGAGTCTTGCTG [22]; FoxM1 forward: CTTTAAGCACATTGCCAAGC.
FoxM1 reverse: GGTTCTGTGGCAGGAAGC; Synjbp2 forward: CGGAGGAAGAGATCAACCTG, Synjbp2 reverse: TATCTCACGAAGGCCCAAAC.
The intensity of the bands was quantified using Image J and the ratios of spliced vs. non-spliced were plotted by GraphPad Prism.

4.10. ER Stress

To determine if the unfolded protein response pathway is activated in Eftud2ncc−/−; Trp53ncc+/− or Eftud2ncc−/−; Trp53ncc−/− embryos, we used primers that were previously designed to amplify a 350 bp portion of Xbp1 (Forward primer: GATCCTGACGAGGTTCCAGA and Reverse primer: GGTCCCCACTGACAGAGAAA), followed by digestion of the amplicon with Pst1 restriction enzyme, as previously described [23]. Since Pst1 does not cut the amplicon in the absence of ER stress, the presence of ER stress is indicated by the presence of a 240 bp and a 110 bp bands.

4.11. Statistical Analysis

Two-tailed non-parametric Mann-Whitney t-test analysis was performed using Excel and Prism Software. ANOVA test analysis followed by Tukey’s post-test to compare all pairs of columns and a Chi-square test were performed using Prism. Significant p-values are represented as * p < 0.05, ** p < 0.01 and *** p < 0.001. All unique/stable reagents that were generated in this study are available from the Lead Contact with a completed Materials Transfer Agreement.

Supplementary Materials

The following supporting information can be downloaded at: https://0-www-mdpi-com.brum.beds.ac.uk/article/10.3390/ijms23169033/s1.

Author Contributions

M.-C.B. carried out and analyzed all of the mouse experiments, drafted the manuscript and designed the figures. A.B. performed part of the IHC experiments and analysis. Y.D. analyzed part of the IHC experiments with Image J. R.A. performed part of the cartilage analysis. L.A.J.-M. devised the project, conceptualized and supervised all the mouse experiments, and wrote the manuscript. All authors provided critical feedback and helped shape the research, analysis and manuscript. All authors have read and agreed to the published version of the manuscript.

Funding

This work is funded in part by an Award by the Research Institute of the McGill University Health Center, and by an Award by the Azrieli Foundation to Loydie Jerome-Majewska. LJAM is a member of the Research Centre of the McGill University Health Centre which is supported in part by FQRS.

Institutional Review Board Statement

All procedures and experiments were performed according to the guidelines of the Canadian Council of Animal Care and approved by the Animal Care Committee of the MUHC Research Institute (protocol # MUHC-5112, approved 7 February 2022).

Conflicts of Interest

The authors declare no competing interest.

References

  1. Frazer, L.N.; Nancollis, V.; O’Keefe, R.T. The role of Snu114p during pre-mRNA splicing. Biochem. Soc. Trans. 2008, 36 Pt 3, 551–553. [Google Scholar] [CrossRef] [PubMed]
  2. Huang, D.W.; Sherman, B.T.; Tan, Q.; Collins, J.R.; Alvord, W.G.; Roayaei, J.; Stephens, R.; Baseler, M.W.; Lane, H.C.; Lempicki, R.A. The DAVID Gene Functional Classification Tool: A novel biological module-centric algorithm to functionally analyze large gene lists. Genome Biol. 2007, 8, R183. [Google Scholar] [CrossRef]
  3. Beauchamp, M.C.; Djedid, A.; Daupin, K.; Clokie, K.; Kumar, S.; Majewski, J.; Jerome-Majewska, L.A. Loss of function mutation of Eftud2, the gene responsible for mandibulofacial dysostosis with microcephaly (MFDM), leads to pre-implantation arrest in mouse. PLoS ONE 2019, 14, e0219280. [Google Scholar] [CrossRef] [PubMed]
  4. Beauchamp, M.C.; Djedid, A.; Bareke, E.; Merkuri, F.; Aber, R.; Tam, A.S.; Lines, M.A.; Boycott, K.M.; Stirling, P.C.; Fish, J.L.; et al. Mutation in Eftud2 causes craniofacial defects in mice via mis-splicing of Mdm2 and increased P53. Hum. Mol. Genet. 2021, 30, 739–757. [Google Scholar] [CrossRef]
  5. Marino, S.; Vooijs, M.; van Der Gulden, H.; Jonkers, J.; Berns, A. Induction of medulloblastomas in p53-null mutant mice by somatic inactivation of Rb in the external granular layer cells of the cerebellum. Genes Dev. 2000, 14, 994–1004. [Google Scholar] [CrossRef] [PubMed]
  6. Wood, K.A.; Rowlands, C.F.; Qureshi, W.M.S.; Thomas, H.B.; Buczek, W.A.; Briggs, T.A.; Hubbard, S.J.; Hentges, K.E.; Newman, W.G.; O’Keefe, R.T. Disease modeling of core pre-mRNA splicing factor haploinsufficiency. Hum. Mol. Genet. 2019, 28, 3704–3723. [Google Scholar] [CrossRef] [PubMed]
  7. Pandit, B.; Halasi, M.; Gartel, A.L. p53 negatively regulates expression of FoxM1. Cell Cycle 2009, 8, 3425–3427. [Google Scholar] [CrossRef] [PubMed]
  8. Bieging-Rolett, K.T.; Attardi, L.D. Zmat3 splices together p53-dependent tumor suppression. Mol. Cell. Oncol. 2021, 8, 1898523. [Google Scholar] [CrossRef]
  9. Muys, B.R.; Anastasakis, D.G.; Claypool, D.; Pongor, L.; Li, X.L.; Grammatikakis, I.; Liu, M.; Wang, X.; Prasanth, K.V.; Aladjem, M.I.; et al. The p53-induced RNA-binding protein ZMAT3 is a splicing regulator that inhibits the splicing of oncogenic CD44 variants in colorectal carcinoma. Genes Dev. 2021, 35, 102–116. [Google Scholar] [CrossRef]
  10. Beauchamp, M.C.; Alam, S.S.; Kumar, S.; Jerome-Majewska, L.A. Spliceosomopathies and neurocristopathies: Two sides of the same coin? Dev. Dyn. 2020, 249, 924–945. [Google Scholar] [CrossRef] [PubMed]
  11. Bowen, M.E.; McClendon, J.; Long, H.K.; Sorayya, A.; Van Nostrand, J.L.; Wysocka, J.; Attardi, L.D. The Spatiotemporal Pattern and Intensity of p53 Activation Dictates Phenotypic Diversity in p53-Driven Developmental Syndromes. Dev. Cell 2019, 50, 212–228.e6. [Google Scholar] [CrossRef]
  12. Jones, N.C.; Lynn, M.L.; Gaudenz, K.; Sakai, D.; Aoto, K.; Rey, J.P.; Glynn, E.F.; Ellington, L.; Du, C.; Dixon, J.; et al. Prevention of the neurocristopathy Treacher Collins syndrome through inhibition of p53 function. Nat. Med. 2008, 14, 125–133. [Google Scholar] [CrossRef]
  13. Sakai, D.; Trainor, P.A. Treacher Collins syndrome: Unmasking the role of Tcof1/treacle. Int. J. Biochem. Cell Biol. 2009, 41, 1229–1232. [Google Scholar] [CrossRef]
  14. Lei, L.; Yan, S.Y.; Yang, R.; Chen, J.Y.; Li, Y.; Bu, Y.; Chang, N.; Zhou, Q.; Zhu, X.; Li, C.Y.; et al. Spliceosomal protein eftud2 mutation leads to p53-dependent apoptosis in zebrafish neural progenitors. Nucleic Acids Res. 2017, 45, 3422–3436. [Google Scholar] [CrossRef] [PubMed]
  15. Wu, J.; Yang, Y.; He, Y.; Li, Q.; Wang, X.; Sun, C.; Wang, L.; An, Y.; Luo, F. EFTUD2 gene deficiency disrupts osteoblast maturation and inhibits chondrocyte differentiation via activation of the p53 signaling pathway. Hum. Genom. 2019, 13, 63. [Google Scholar] [CrossRef]
  16. Zhu, J.; Singh, M.; Selivanova, G.; Peuget, S. Pifithrin-α alters p53 post-translational modifications pattern and differentially inhibits p53 target genes. Sci. Rep. 2020, 10, 1049. [Google Scholar] [CrossRef]
  17. Ma, R.Y.; Tong, T.H.; Cheung, A.M.; Tsang, A.C.; Leung, W.Y.; Yao, K.M. Raf/MEK/MAPK signaling stimulates the nuclear translocation and transactivating activity of FOXM1c. J. Cell Sci. 2005, 118 Pt 4, 795–806. [Google Scholar] [CrossRef]
  18. Krupczak-Hollis, K.; Wang, X.; Kalinichenko, V.V.; Gusarova, G.A.; Wang, I.C.; Dennewitz, M.B.; Yoder, H.M.; Kiyokawa, H.; Kaestner, K.H.; Costa, R.H. The mouse Forkhead Box m1 transcription factor is essential for hepatoblast mitosis and development of intrahepatic bile ducts and vessels during liver morphogenesis. Dev. Biol. 2004, 276, 74–88. [Google Scholar] [CrossRef]
  19. Gray, P.A.; Fu, H.; Luo, P.; Zhao, Q.; Yu, J.; Ferrari, A.; Tenzen, T.; Yuk, D.I.; Tsung, E.F.; Cai, Z.; et al. Mouse brain organization revealed through direct genome-scale TF expression analysis. Science 2004, 306, 2255–2257. [Google Scholar] [CrossRef]
  20. Lewis, A.E.; Vasudevan, H.N.; O’Neill, A.K.; Soriano, P.; Bush, J.O. The widely used Wnt1-Cre transgene causes developmental phenotypes by ectopic activation of Wnt signaling. Dev. Biol. 2013, 379, 229–234. [Google Scholar] [CrossRef]
  21. Dinsmore, C.J.; Ke, C.Y.; Soriano, P. The Wnt1-Cre2 transgene is active in the male germline. Genesis 2022, 60, e23468. [Google Scholar] [CrossRef]
  22. Van Alstyne, M.; Simon, C.M.; Sardi, S.P.; Shihabuddin, L.S.; Mentis, G.Z.; Pellizzoni, L. Dysregulation of Mdm2 and Mdm4 alternative splicing underlies motor neuron death in spinal muscular atrophy. Genes Dev. 2018, 32, 1045–1059. [Google Scholar] [CrossRef]
  23. Jerome-Majewska, L.A.; Achkar, T.; Luo, L.; Lupu, F.; Lacy, E. The trafficking protein Tmed2/p24beta(1) is required for morphogenesis of the mouse embryo and placenta. Dev. Biol. 2010, 341, 154–166. [Google Scholar] [CrossRef]
Figure 1. Treatment of Eftud2ncc−/− embryos with pifithrin-α from E6.5–E8.5 reduces P53-activity, nuclear P53 accumulation, and apoptosis. (AC) RT-qPCR analysis revealed significant increases in the levels of (A) Ccng1 and (B) Trp53inp1, and a non-significant increase in the level of (C) Phlda3 in the heads of Eftud2ncc−/− embryos (mut, n = 3) treated with vehicle (veh), when compared to the controls (ctl, n = 3). In pifithrin-α (pif)-treated mutants (mut. n = 6), levels of these genes are similar to the controls (ctl, n = 4). The Y-axis indicates fold change over the control, the error bars represent SEM, * p < 0.05 by t-test. (D,F) Quantification of nuclear P53-positive cells in the neural tube (D) and first pharyngeal arch (F) of the vehicle and the pifithrin-α treated control (n = 7 veh, n = 5, pif) and Eftud2ncc−/− embryos (n = 6 veh, n = 4, pif). The percentage of P53-positive nuclei was significantly increased in the neural tube of the vehicle treated mutant embryos when compared to the controls. Each dot represents the average percentage of positive cells in a single embryo (* p < 0.01 by t-test). (E,G) Representative images of P53 nuclear staining in vehicle (left) or pifithrin-α (right)-treated embryos. Sections were counterstained with nuclear fast red (red), P53-staining is in brown. The arrows indicate P53 positive cells. (H) Quantification of cleaved caspase-3-positive cells showing significant increase in the percentage of apoptotic cells in the neural tube of vehicle-treated Eftud2ncc−/− embryos (n = 7) and (J) in the first pharyngeal arch of pifithrin-α-treated Eftud2ncc−/− embryos (n = 4), when compared to the control (n = 5, veh, n = 5, pif). Each dot represents the average percentage of positive cells in a single embryo (* p < 0.05, ** p < 0.01 by t-test). (I,K) Representative images of cleaved Caspase-3 staining of vehicle or pifithrin-α treated embryos. Arrows indicate cleaved Caspase-3 positive cells. (Genotypes of the control embryos included Eftud2loxp/− or Eftud2loxp/+). Scale bar = 25 µm. nt = neural tube, pa = pharyngeal arch.
Ijms 23 09033 g001
Figure 2. Eftud2ncc−/−; Trp53ncc−/− embryos have decreased P53 activity and apoptosis at E10.5. (A) RT-qPCR analysis showed that levels of Ccng1, Trp53inp1 and Phlda3 were significantly increased in the heads of Eftud2ncc−/− embryos when compared to controls or Eftud2ncc−/−; Trp53ncc−/− mutants. Controls (ctl; n = 4), Eftud2ncc−/− (n = 4) and Eftud2ncc−/−; Trp53ncc−/− (n = 6). The Errors bars represent SEM. (B) Quantification of the percentage of P53 positive cells showed an increase in the neural tube of Eftud2ncc−/− and Eftud2ncc−/−; Trp53ncc+/− mutant E10.5 embryos, compared to controls or Eftud2ncc−/−; Trp53ncc−/− mutants, (C) but not in the pharyngeal arch. Each dot represents average percentage of positive cells in an embryo. The right panels show representative images of P53 nuclear staining by immunohistochemistry. The sections were counterstained with nuclear fast red (red), P53-staining is in brown. (D) Quantification of the percentage of cleaved Caspase-3-positive cells revealed a significant increase in the neural tube of Eftud2ncc−/−; Trp53ncc+/− mutant embryos compared to controls, Eftud2ncc−/− or Eftud2ncc−/−; Trp53ncc−/− mutants, (E) but not in the pharyngeal arch. Each dot represents the average of the percentage of positive cells in an embryo. The right panels show representative images of cleaved Caspase-3-positive cells by immunohistochemistry. (ctl n = 4: genotypes of control embryos included Eftud2loxp/−; Trp53loxp/+ or Eftud2loxp/+; Trp53loxp/loxp), Eftud2ncc−/− n = 5, Eftud2ncc−/−; Trp53ncc+/− n = 4, Eftud2ncc−/−; Trp53ncc−/− n = 5). * p < 0.05, ** p < 0.01 by ANOVA. Scale bar = 25 µm. nt = neural tube, hm = head mesenchyme, pa = pharyngeal arch.
Ijms 23 09033 g002
Figure 3. SOX10 expression is higher in Eftud2ncc−/−; Trp53ncc−/− embryos than in Eftud2ncc−/− and similar to controls, at E9.0. Representative images of the head of embryos after wholemount immunofluorescence staining with an antibody to SOX10 (red) or with DAPI (blue) in (A) control (n = 4), (B) Eftud2ncc−/−; Trp53ncc+/+ (n = 4), and (C) Eftud2ncc−/−; Trp53ncc−/− embryos (n = 4). (Genotypes of control embryos included Eftud2loxp/−; Trp53loxp/+ or Eftud2loxp/+; Trp53loxp/loxp). (A) In the control embryos, SOX10 is present in post-migratory neural crest cells in and around the eye and in the pharyngeal arches. (B) Reduced SOX10 staining is seen in Eftud2ncc−/−; Trp53ncc+/+ embryos. (C) In Eftud2ncc−/−; Trp53ncc−/− embryos staining for SOX10 is similar to that seen in controls. Scale bar = 50 µm. e = eye, pa = pharyngeal arch.
Ijms 23 09033 g003
Figure 4. Removing Trp53 does not improve craniofacial development in Eftud2ncc−/− mutants. Representative images of control, Eftud2ncc−/−; Trp53ncc+/+, Eftud2ncc−/−; Trp53ncc+/− and Eftud2ncc−/−; Trp53ncc−/− embryos collected at (A) E9.5 and (B) E10.5 showing the reduced size of the midbrain and the pharyngeal arches. (C) The head of mutant embryos have an abnormal curvature; the mandible is reduced and the maxilla and the frontonasal process (stars) was missing in all E11.5 mutant embryos. (D) Representative images of E14.5 embryos (E) stained with Alcian blue for cartilage analysis showing a hypoplastic (Meckel’s cartilage) and absent cartilage structures in the head of mutants. Scale bar = 500 µm. ov = otic vesicle, mb = midbrain, pa = pharyngeal arch, e = eye, fb = forebrain, np = nasal process, mx = maxillary, md = mandible, l = limb, ea = ear, n = nose, M = Meckel’s cartilage, At = atlas, Ax = axis.
Ijms 23 09033 g004
Figure 5. Removing Trp53 does not improve midbrain and pharyngeal arch growth or improve survival of Eftud2ncc−/− mutant embryos. Graphs showing that the perimeter of the first pharyngeal arch (PA) was significantly reduced in Eftud2ncc−/−; Trp53ncc+/+ (n = 9, E9.5, n = 8, E10.5), Eftud2ncc−/−; Trp53ncc+/− (n = 6, E9.5, n = 7, E10.5) and Eftud2ncc−/−; Trp53ncc−/− (n = 5, E9.5, n = 13, E10.5) embryos at (A) E9.5 and (C) E10.5 when compared to controls (n = 12, E9.5, n = 10, E10.5). Graphs showing that the length of the midbrain was reduced in Eftud2ncc−/−; Trp53ncc+/+ and Eftud2ncc−/−; Trp53ncc+/− embryos compared to controls (B) at E9.5 (D) and also in Eftud2ncc−/−; Trp53ncc−/− embryos at E10.5 when compared to controls. * p < 0.05, ** p < 0.01, *** p < 0.001 vs. control by ANOVA. Contingency graphs showing a similar proportion of normal, abnormal and dead or resorbed (res) embryos at (E) E11.5 and (F) E14.5 within each of these groups: controls (n = 11, E11.5, n = 15, E14.5), Eftud2ncc−/−; Trp53ncc+/+ (n = 11, E11.5, n = 16, E14.5), Eftud2ncc−/−; Trp53ncc+/− (n = 8, E11.5, n = 16, E14.5), and Eftud2ncc−/−; Trp53ncc−/− (n = 8, E11.5, n = 2, E14.5).
Ijms 23 09033 g005
Figure 6. Mis-splicing is increased in Eftud2ncc−/−; Trp53ncc−/− embryos. Quantification of the ratio of the skipped-exon containing transcripts vs. the full-length transcripts (FL) (left) and the representative images of gels from RT-PCR analysis (right) showing increased transcripts without (A) exon7 of FoxM1 (controls (n = 3), Eftud2ncc−/−; Trp53ncc+/+ (n = 3), Eftud2ncc−/−; Trp53ncc+/− (n = 4) and Eftud2ncc−/−; Trp53ncc−/− (n = 4)), (B) exon3 of Mdm2; (controls (n = 3), Eftud2ncc−/−; Trp53ncc+/+ (n = 4), Eftud2ncc−/−; Trp53ncc+/− (n = 4) and Eftud2ncc−/−; Trp53ncc−/− (n = 5)) and (C) exon2 of Synj2bp (controls (n = 8), Eftud2ncc−/−; Trp53ncc+/+ (n = 3), Eftud2ncc−/−; Trp53ncc+/− (n = 4), and Eftud2ncc−/−; Trp53ncc−/− (n = 5)) in Eftud2ncc−/−; Trp53ncc+/− and Eftud2ncc−/−; Trp53ncc−/− E9.5 embryos compared to controls or Eftud2ncc−/−; Trp53ncc+/+. ** p < 0.01, *** p < 0.001 vs. control, ## p < 0.01 vs. Eftud2ncc−/− by ANOVA. (D) RT-qPCR analysis expressed as fold change over control levels showing increased expression of Zmat3 in the heads of Eftud2ncc−/−; Trp53ncc+/+ (n = 3) embryos compared to controls (n = 6) or Eftud2ncc−/−; Trp53ncc−/− (n = 5) mutants at E9.5 and (E) at E10.5. Controls (n = 4), Eftud2ncc−/−; Trp53ncc+/+ (n = 4), and Eftud2ncc−/−; Trp53ncc−/− (n = 6). (Genotypes of the control embryos at E9.5 included Eftud2loxp/−; Trp53loxp/loxp or Eftud2loxp/+, and at E10.5: Eftud2loxp/+). The errors bars represent SEM. * p < 0.05 by ANOVA.
Ijms 23 09033 g006
Table 1. Primers used for qRT-PCR.
GenesPrimers
Ccng1 forwardTTCCAAGATAAGTGGCCGAGA
Ccng1 reverseAGTGCGTCCAGACACAATCC
Trp53inp1 forwardAAGTGGTCCCAGAATGGAAGC
Trp53inp1 reverseCTGGGAAGGGCGAAAACTCT
Phlda3 forwardCATGTCAGCTTCTCTGTCCACTT
Phlda3 reverseCTGGTTGGCTCCTTCCATGAT
Mdm2 forwardTGGAGTCCCGAGTTTCTCTG
Mdm2 reverseGATGTGCCAGAGTCTTGCTG
Sdha forwardGCTGTGGCCCTGAGAAAGATC
Sdha reverseATCATGGCCGTCTCTGAAATTC
B2M forwardATGCTATCCAGAAAACCCCTCAA
B2M reverseGCGGGTGGAACTGTGTTACG
Gapdh forwardATGACATCAAGAAGGTCCTG
Gapdh reverseCATACCAGGAAATGAGCTTG
FoxM1 forwardCTGATTCTCAAAAGACGGAGGC
FoxM1 reverseTTGATAATCTTGATTCCGGCTGG
Cdc25b forwardTCCGATCCTTACCAGTGAGG
Cdc25b reverseGGGCAGAGCTGGAATGAGG
Zmat3 forwardTTCCTTTACCTAATCGGCCTTCA
Zmat3 reverseTTCCTGCCCAAAAGCCTTCTG
Publisher’s Note: MDPI stays neutral with regard to jurisdictional claims in published maps and institutional affiliations.

