Article

Expression of the Calcium-Binding Protein CALB1 Is Induced and Controls Intracellular Ca2+ Levels in Senescent Cells

1
Centre de Recherche en Cancérologie de Lyon, Inserm U1052, CNRS UMR 5286, Centre Léon Bérard, Université de Lyon, 69373 Lyon, France
2
CarMeN Laboratory, INSERM, INRA, INSA Lyon, Université Claude Bernard Lyon 1, 69500 Bron, France
*
Authors to whom correspondence should be addressed.
Int. J. Mol. Sci. 2022, 23(16), 9376; https://0-doi-org.brum.beds.ac.uk/10.3390/ijms23169376
Submission received: 1 July 2022 / Revised: 12 August 2022 / Accepted: 16 August 2022 / Published: 19 August 2022
(This article belongs to the Special Issue Calcium-Binding Proteins and Cell Signaling 3.0)

Abstract

:
In response to many stresses, such as oncogene activation or DNA damage, cells can enter cellular senescence, a state of proliferation arrest accompanied by a senescence-associated secretory phenotype (SASP). Cellular senescence plays a key role in many physiopathological contexts, including cancer, aging and aging-associated diseases, therefore, it is critical to understand how senescence is regulated. Calcium ions (Ca2+) recently emerged as pivotal regulators of cellular senescence. However, how Ca2+ levels are controlled during this process is barely known. Here, we report that intracellular Ca2+ contents increase in response to many senescence inducers in immortalized human mammary epithelial cells (HMECs) and that expression of calbindin 1 (CALB1), a Ca2+-binding protein, is upregulated in this context, through the Ca2+-dependent calcineurin/NFAT pathway. We further show that overexpression of CALB1 buffers the rise in intracellular Ca2+ levels observed in senescent cells. Finally, we suggest that increased expression of Ca2+-binding proteins calbindins is a frequent mark of senescent cells. This work thus supports that, together with Ca2+channels, Ca2+-binding proteins modulate Ca2+ levels and flux during cellular senescence. This opens potential avenues of research to better understand the role of Ca2+ and of Ca2+-binding proteins in regulating cellular senescence.

1. Introduction

Cellular senescence is a cell response to many stresses, such as oncogene activation, oxidative stress, telomere shortening, or DNA damage. This response is mainly characterized by a stable cell proliferation arrest and a senescence-associated secretory phenotype (SASP), consisting in the secretion of multiple factors, including, among others, pro-inflammatory cytokines and chemokines, metalloproteases and growth factors. The SASP can activate the immune system to eliminate senescent cells. Senescence is thus a critical barrier against abnormal cell proliferation and tumor formation. However, over time and upon chronic exposure to stresses, senescent cells accumulate and contribute to tumor progression through their SASP, by promoting stemness, epithelial-mesenchymal transition, and migration. Accumulation of senescent cells also critically promotes aging and aging-associated diseases. Even though some molecular pathways are already well known to regulate senescence, such as the p53/p21CIP1 or p16INK4a/Rb axis, which implement the cell cycle arrest or the NF-κB, Notch, and mTOR pathways which control the SASP, how senescence is regulated is not yet fully understood [1,2,3].
Calcium (Ca2+) is a powerful secondary messenger driving multiple cellular processes, ranging from cell proliferation and secretion to cell death. Ca2+ intracellular concentrations and fluxes need to be tightly controlled to achieve a fine-tune regulation of cellular responses. A pivotal role of Ca2+ in cellular senescence has recently emerged in the literature [4,5]. A rise in intracellular Ca2+ contents and activation of calcium-dependent signaling pathways, such as the calcineurin/nuclear factor of activated T cells (NFAT) pathway, have been reported in some senescence contexts. These increased contents and activity regulate senescence outcomes [6,7]. However, how intracellular Ca2+ levels evolve and are controlled in response to different senescence inducers, especially in epithelial cells, is barely known.
Many proteins such as channels, transporters, or pumps can regulate Ca2+ transfers and levels inside the cells. A few of them have been recently described as key regulators of cellular senescence. The inositol 1,4,5-trisphosphate receptor type 2 (ITPR2), which acts as an endoplasmic reticulum (ER) Ca2+ release channel, is shown to promote cellular senescence and organismal aging by fostering Ca2+ transfers from ER to mitochondria, through mitochondria-ER contacts (MERCs) [8,9,10]. Decreased expression of transient receptor potential cation channel subfamily C member 3 (TRPC3) was observed in response to many senescence inducers. TRPC3 re-expression promotes escape from oncogene-induced senescence by decreasing mitochondrial Ca2+ load by inhibiting ITPR3 activity [11]. Beyond these channels, cells also have a calcium-buffering system that shapes intracellular Ca2+ signals. Calcium-buffering proteins are calcium-binding proteins (CaBP) that tightly control intracellular free Ca2+ concentrations. Indeed, they sequester free Ca2+ by their EF-hand domains and thus fine-tune Ca2+ signaling [12]. Whether calcium-buffering proteins are involved in senescence remains unknown.
In this study, we discovered that the expression of calbindin 1 (CALB1, also called calbindin-D28K), a well-known calcium-binding protein, is upregulated in response to many senescence inducers in immortalized human mammary epithelial cells (HMECs) and that CALB1 buffers the rise of Ca2+ observed in senescent cells. During cellular senescence in non-epithelial cells, CALB1 is not induced, but CALB2 protein might take over this Ca2+-buffering role.

2. Results

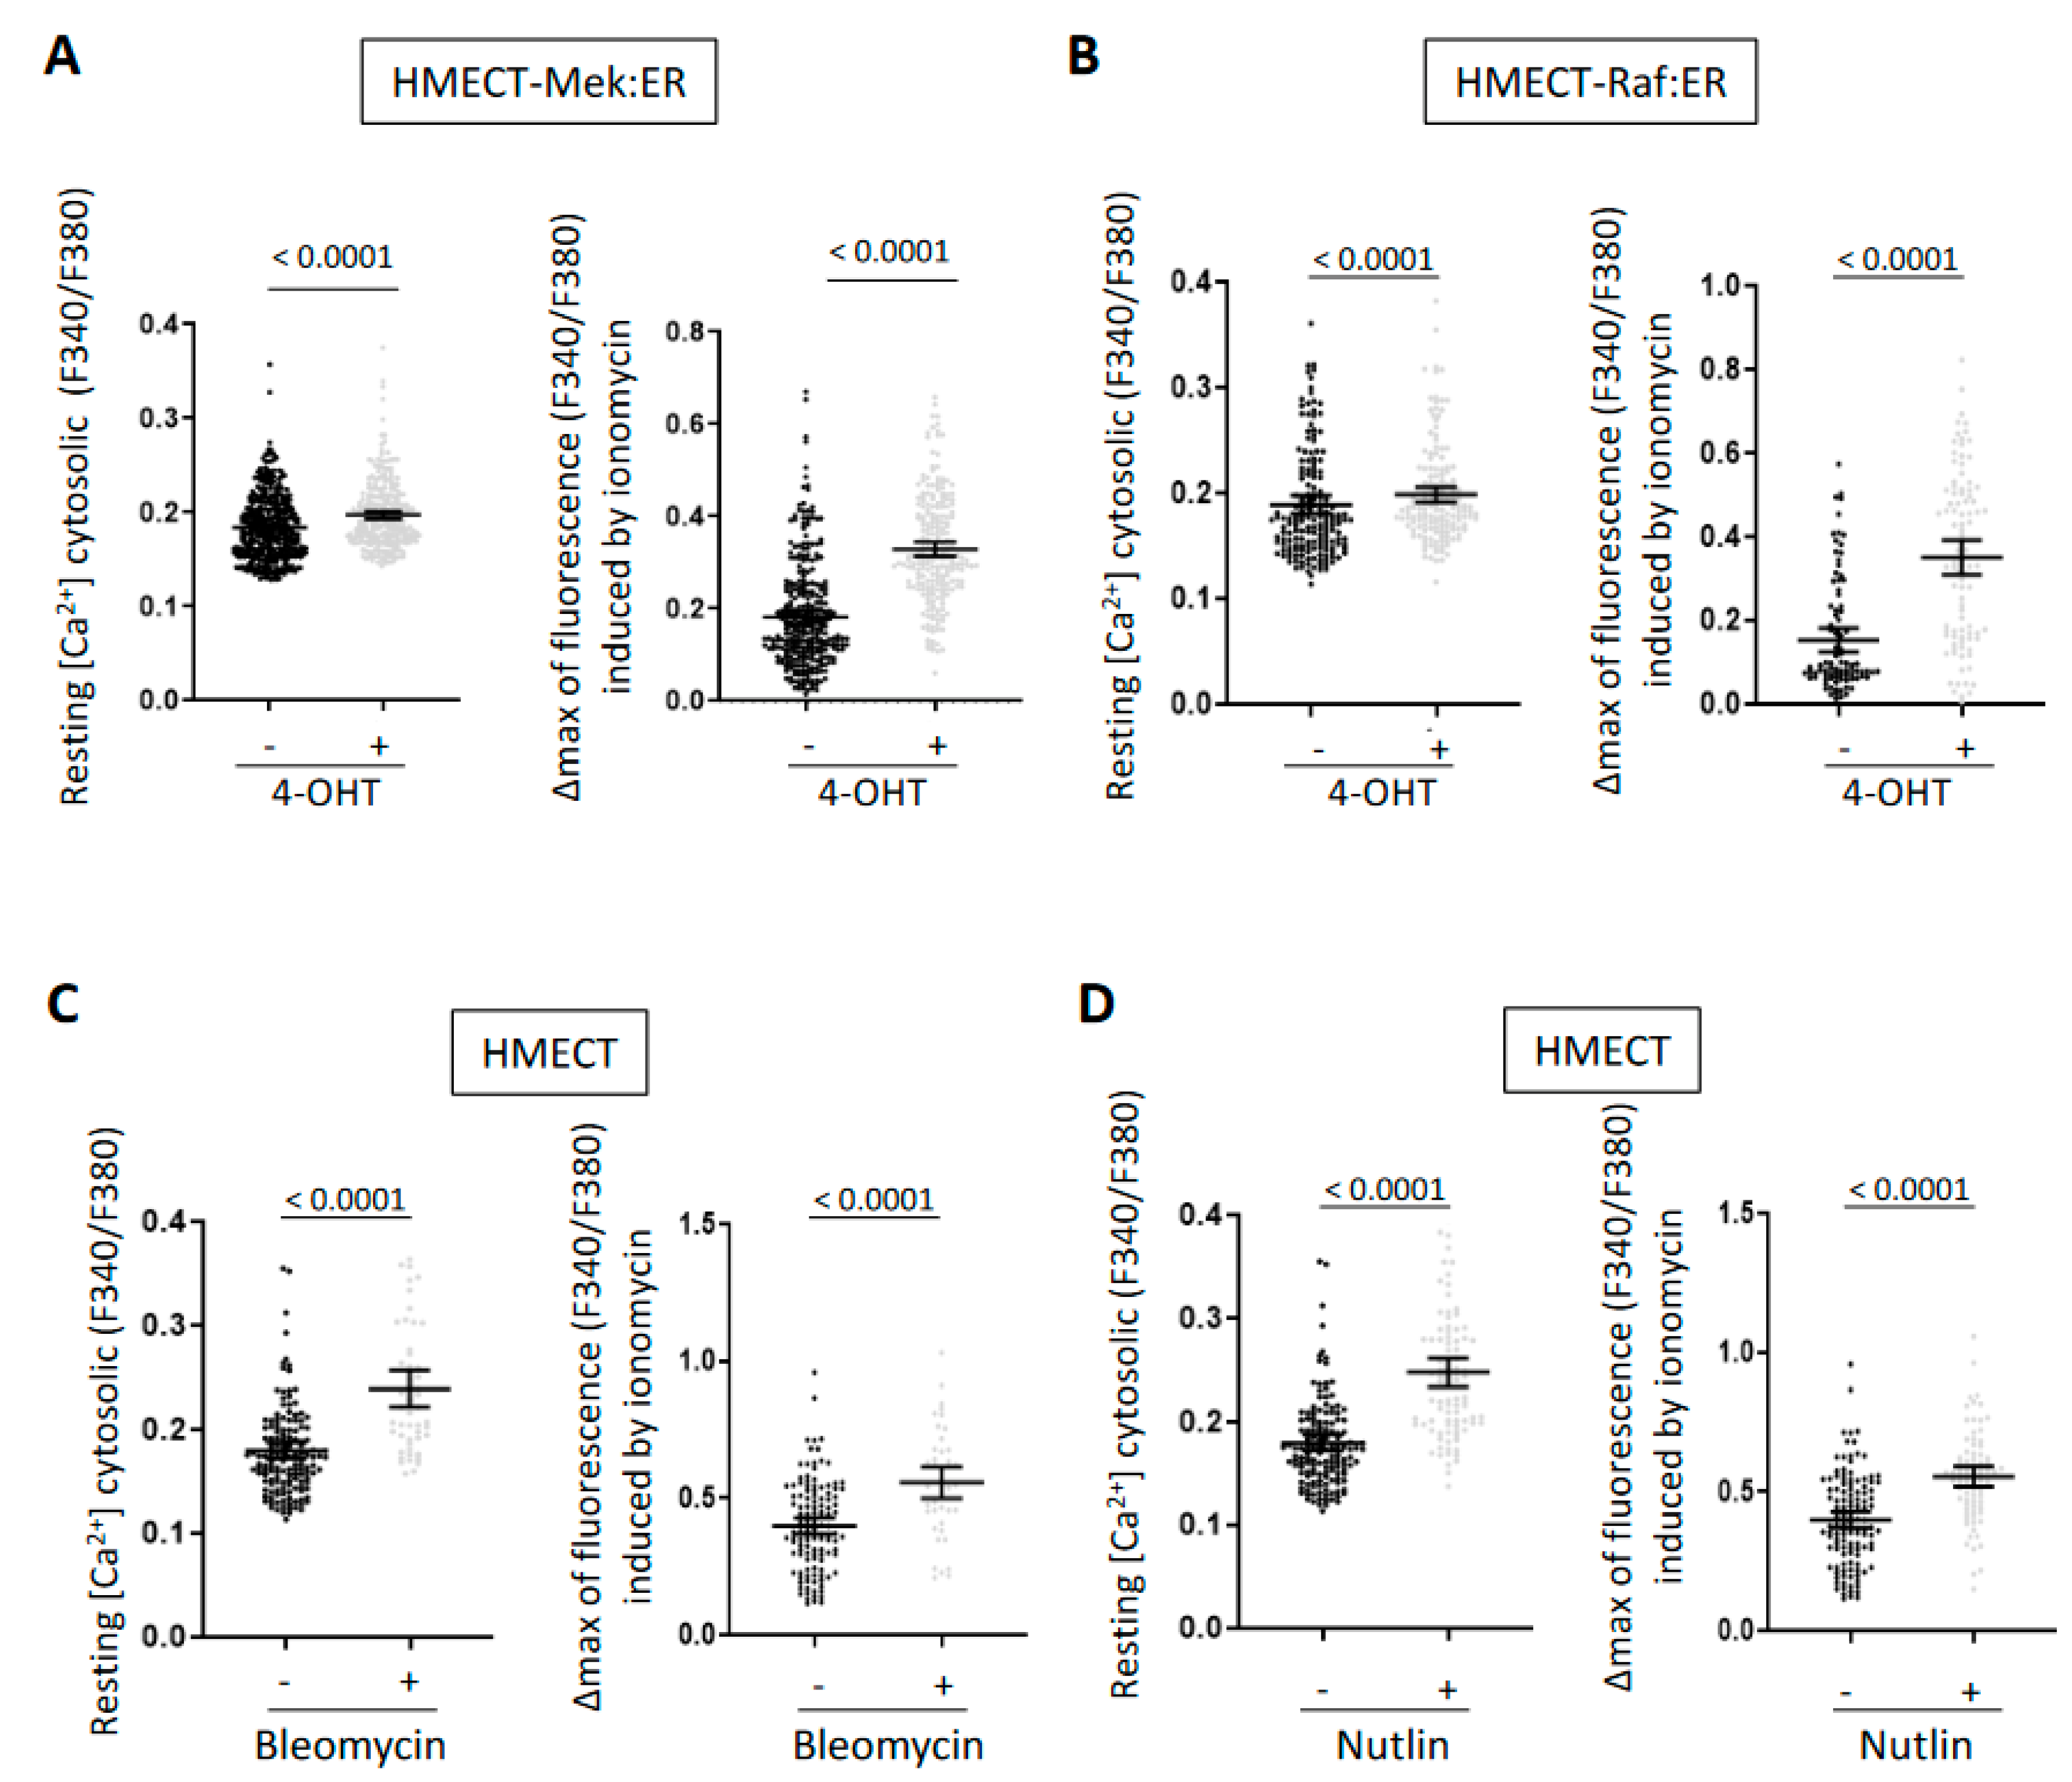
2.1. A Rise in Intracellular Calcium Content Is a Common Mark of Senescence in HMECT

Regulation of intracellular Ca2+ levels has been recently reported in some contexts of cellular senescence, and we and others have demonstrated that Ca2+ transfer from endoplasmic reticulum to mitochondria promotes cellular senescence [8,9,10,11]. To know whether Ca2+ level alterations are a classical mark of senescent cells, we measured Ca2+ levels in HMEC in proliferation versus senescence using different types of senescence inducers: oncogenes, the chemotherapeutic agent bleomycin, or the p53 stabilizer nutlin-3. For oncogene-induced senescence (OIS), telomerase-expressing HMEC (HMECT) were infected with retroviral vectors encoding Mek or Raf oncogenes in fusion with the ligand binding domain of estrogen receptor (ER) (HMECT-Mek:ER; HMECT-Raf:ER), inducible with 4-HydroxyTamoxifen (4-OHT). These HMECT expressing inducible oncogenes enter OIS upon oncogene activation by adding 4-OHT [9,13,14,15]. Senescence was otherwise induced by the genotoxic drug bleomycin through activation of a DNA damage response or by nutlin through stabilization of p53, one of the main effectors of senescence (data not shown). Using the cytosolic Ca2+ probe Fura2, we assessed Ca2+ contents both in the cytosol and in the intracellular stores (i.e., mainly Ca2+ stored in endoplasmic reticulum and mitochondria). The size of intracellular Ca2+ stores was appreciated as the Ca2+ increase in the cytosolic Ca2+ compartment due to the ionomycin-induced membrane permeabilization and the subsequent organelles’ depletion obtained in the absence of external Ca2+. All the senescence inducers provoked an increase in the resting cytosolic Ca2+ concentration and in the intra-organelle Ca2+ content (Figure 1). Therefore, this global Ca2+ increase appears to be a mark of cellular senescence in HMECT.

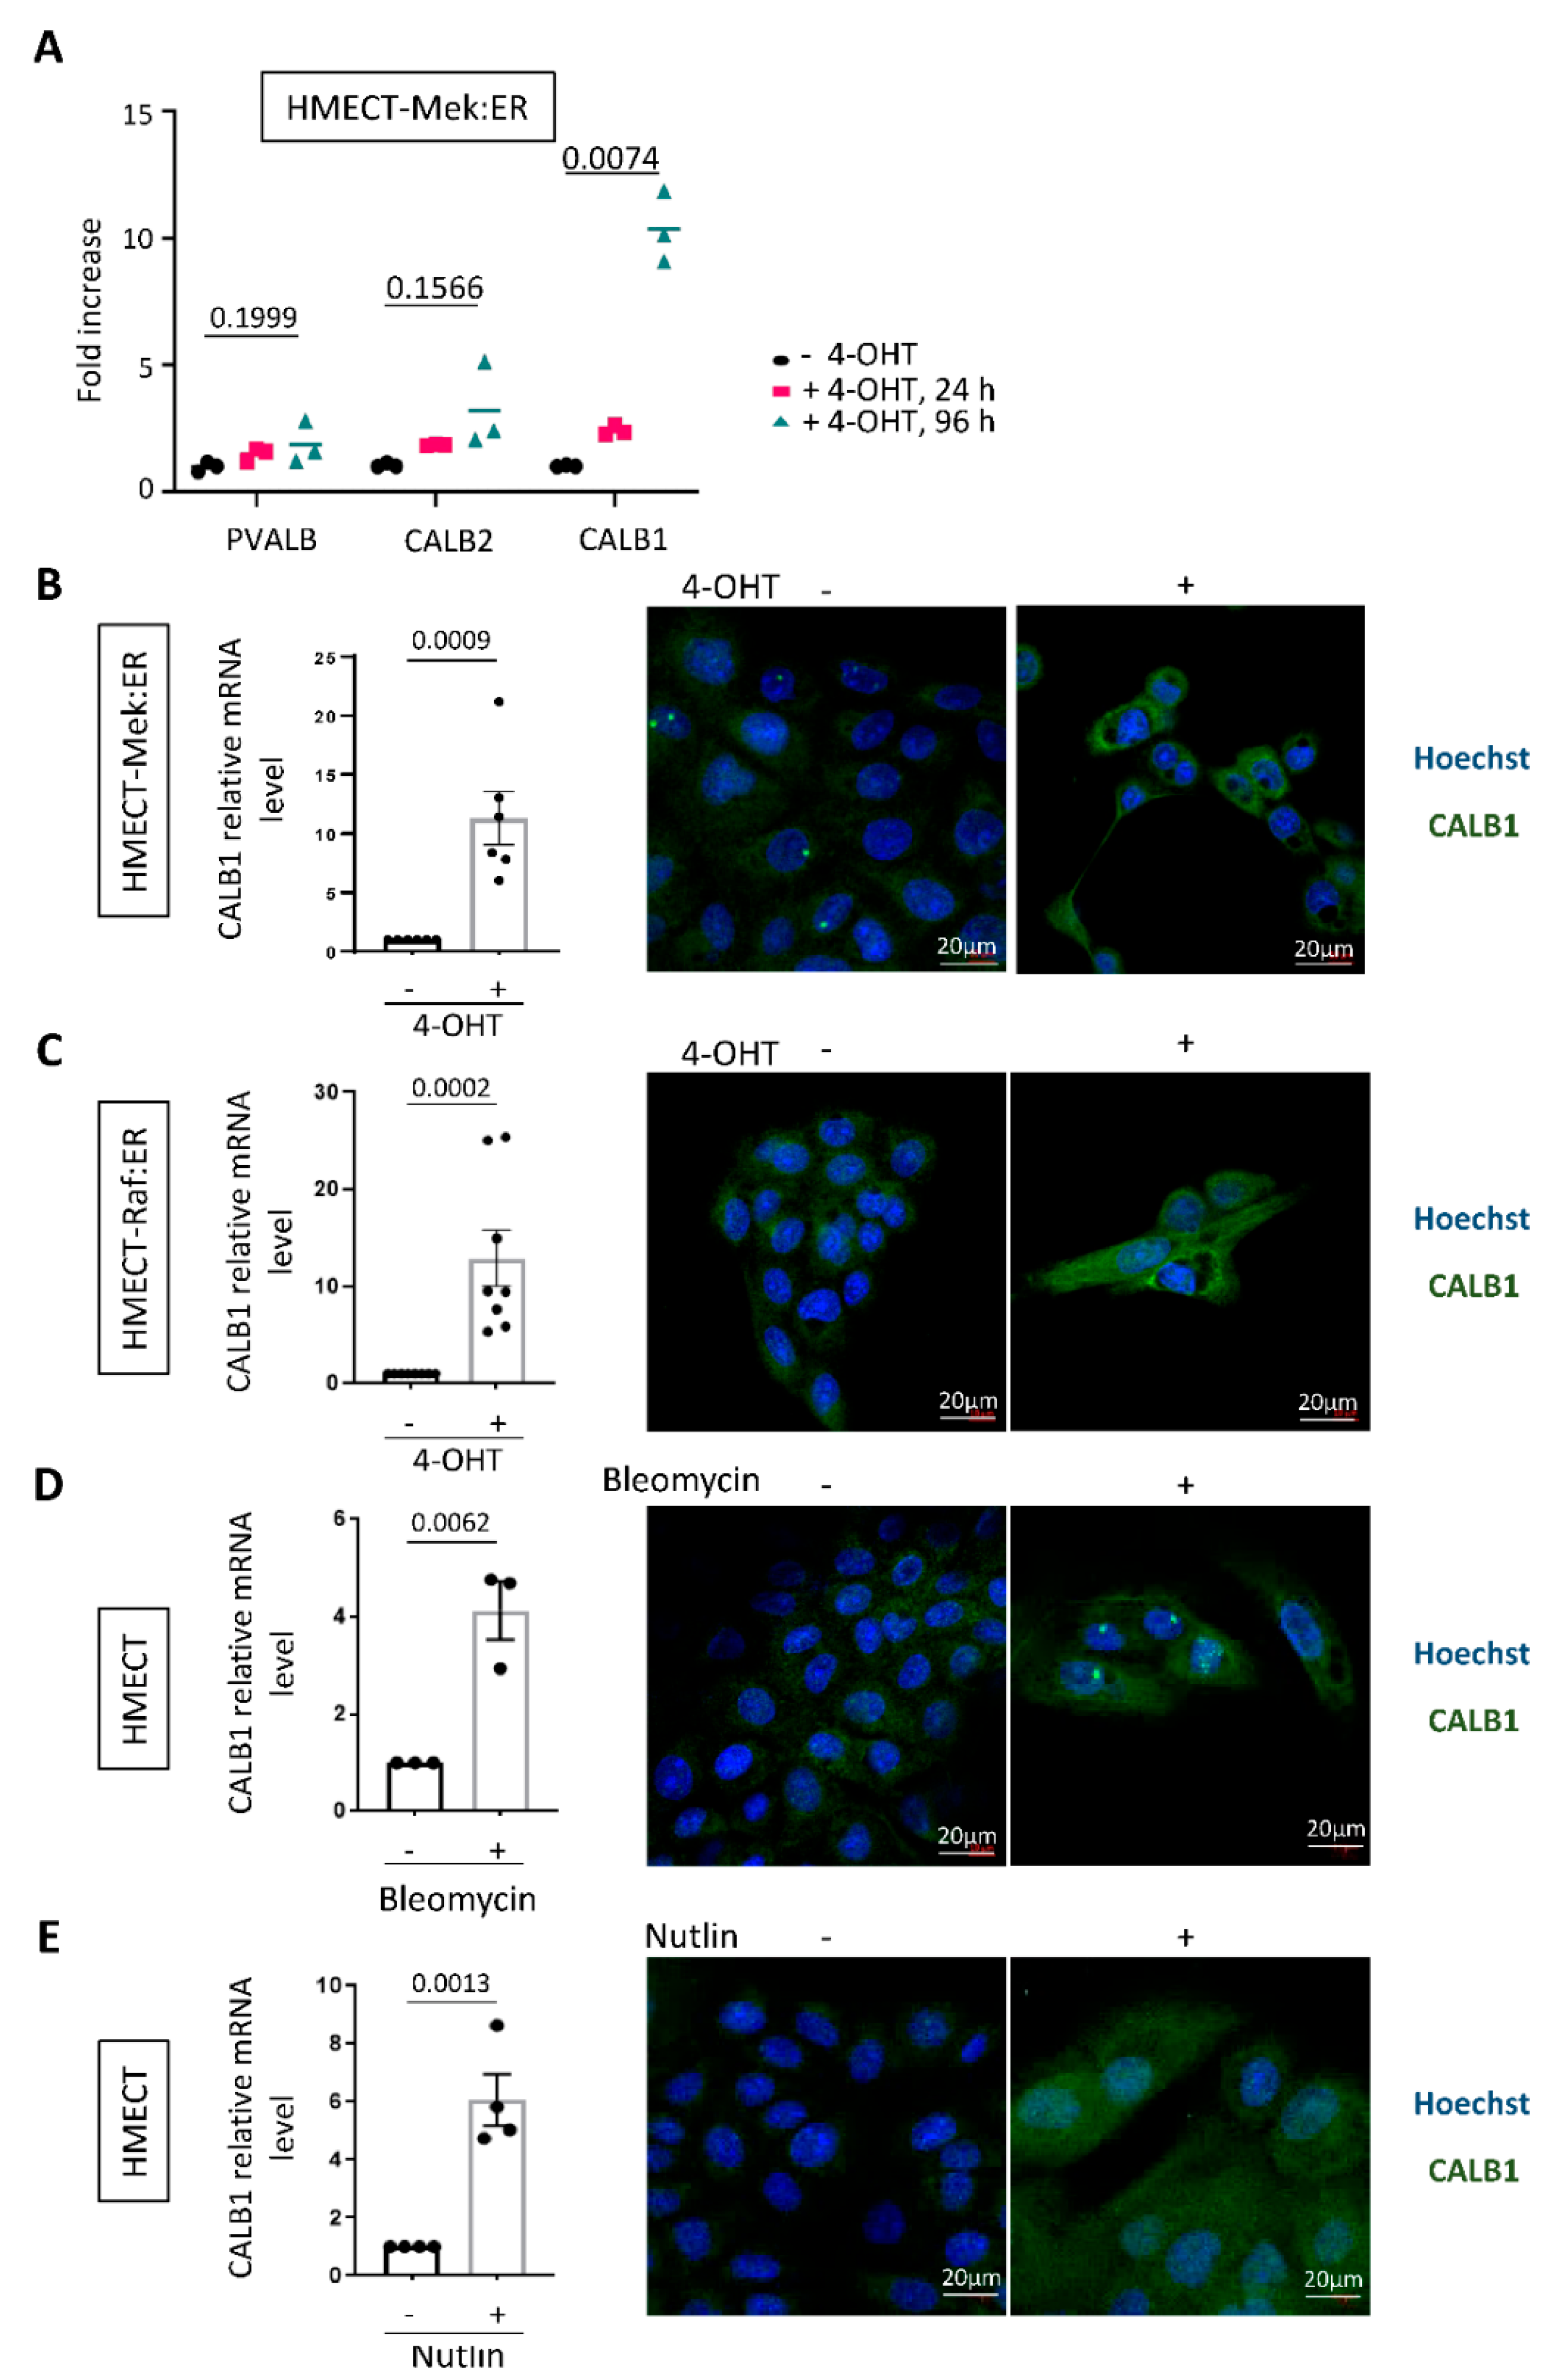
2.2. CALB1 Expression Is Induced in Senescent HMECT

Ca2+ homeostasis is crucial within the cell as a high Ca2+ concentration can lead to cell death, whereas a low Ca2+ concentration blocks some crucial cellular pathways because Ca2+ acts as a cofactor of multiple enzymes and pathways [16]. The fine-tuning of Ca2+ concentration in the different cellular compartments relies on various Ca2+ channels, pumps, transporters, or calcium-buffering proteins. To identify new Ca2+ regulators during oncogene-induced senescence, we explored whole genome transcriptome data that we recently obtained in HMECT-Mek:ER [17] and noticed an induced expression of CALB1 (calbindin 1, also called calbindin-D28K) after Mek activation with 4-OHT (Figure 2A). CALB1 is a calcium-binding protein well known to buffer cytosolic Ca2+ contents and thus participate in Ca2+ homeostasis [12]. mRNA levels of other Ca2+-buffering proteins such as CALB2 or PVALB were not significantly induced by Mek after four days of activation, and S100G mRNA was not detected in HMECT cells (Figure 2A). We then investigated the level and localization of CALB1 in HMECT in the different models of senescence described in Figure 1. We confirmed CALB1 induction by RT-qPCR and immunofluorescence upon Mek-induced senescence in HMECT (Figure 2B). Interestingly, in the other senescence contexts, an increase in CALB1 level was also observed by RT-qPCR and immunofluorescence (Figure 2C–E). CALB1 staining might indicate mainly cytosol localization, as expected, although we cannot rule out other localization (Figure 2B–E). Altogether these results support that senescent HMECT cells display increased Ca2+ contents together with increased expression of a calcium-buffering protein, CALB1.

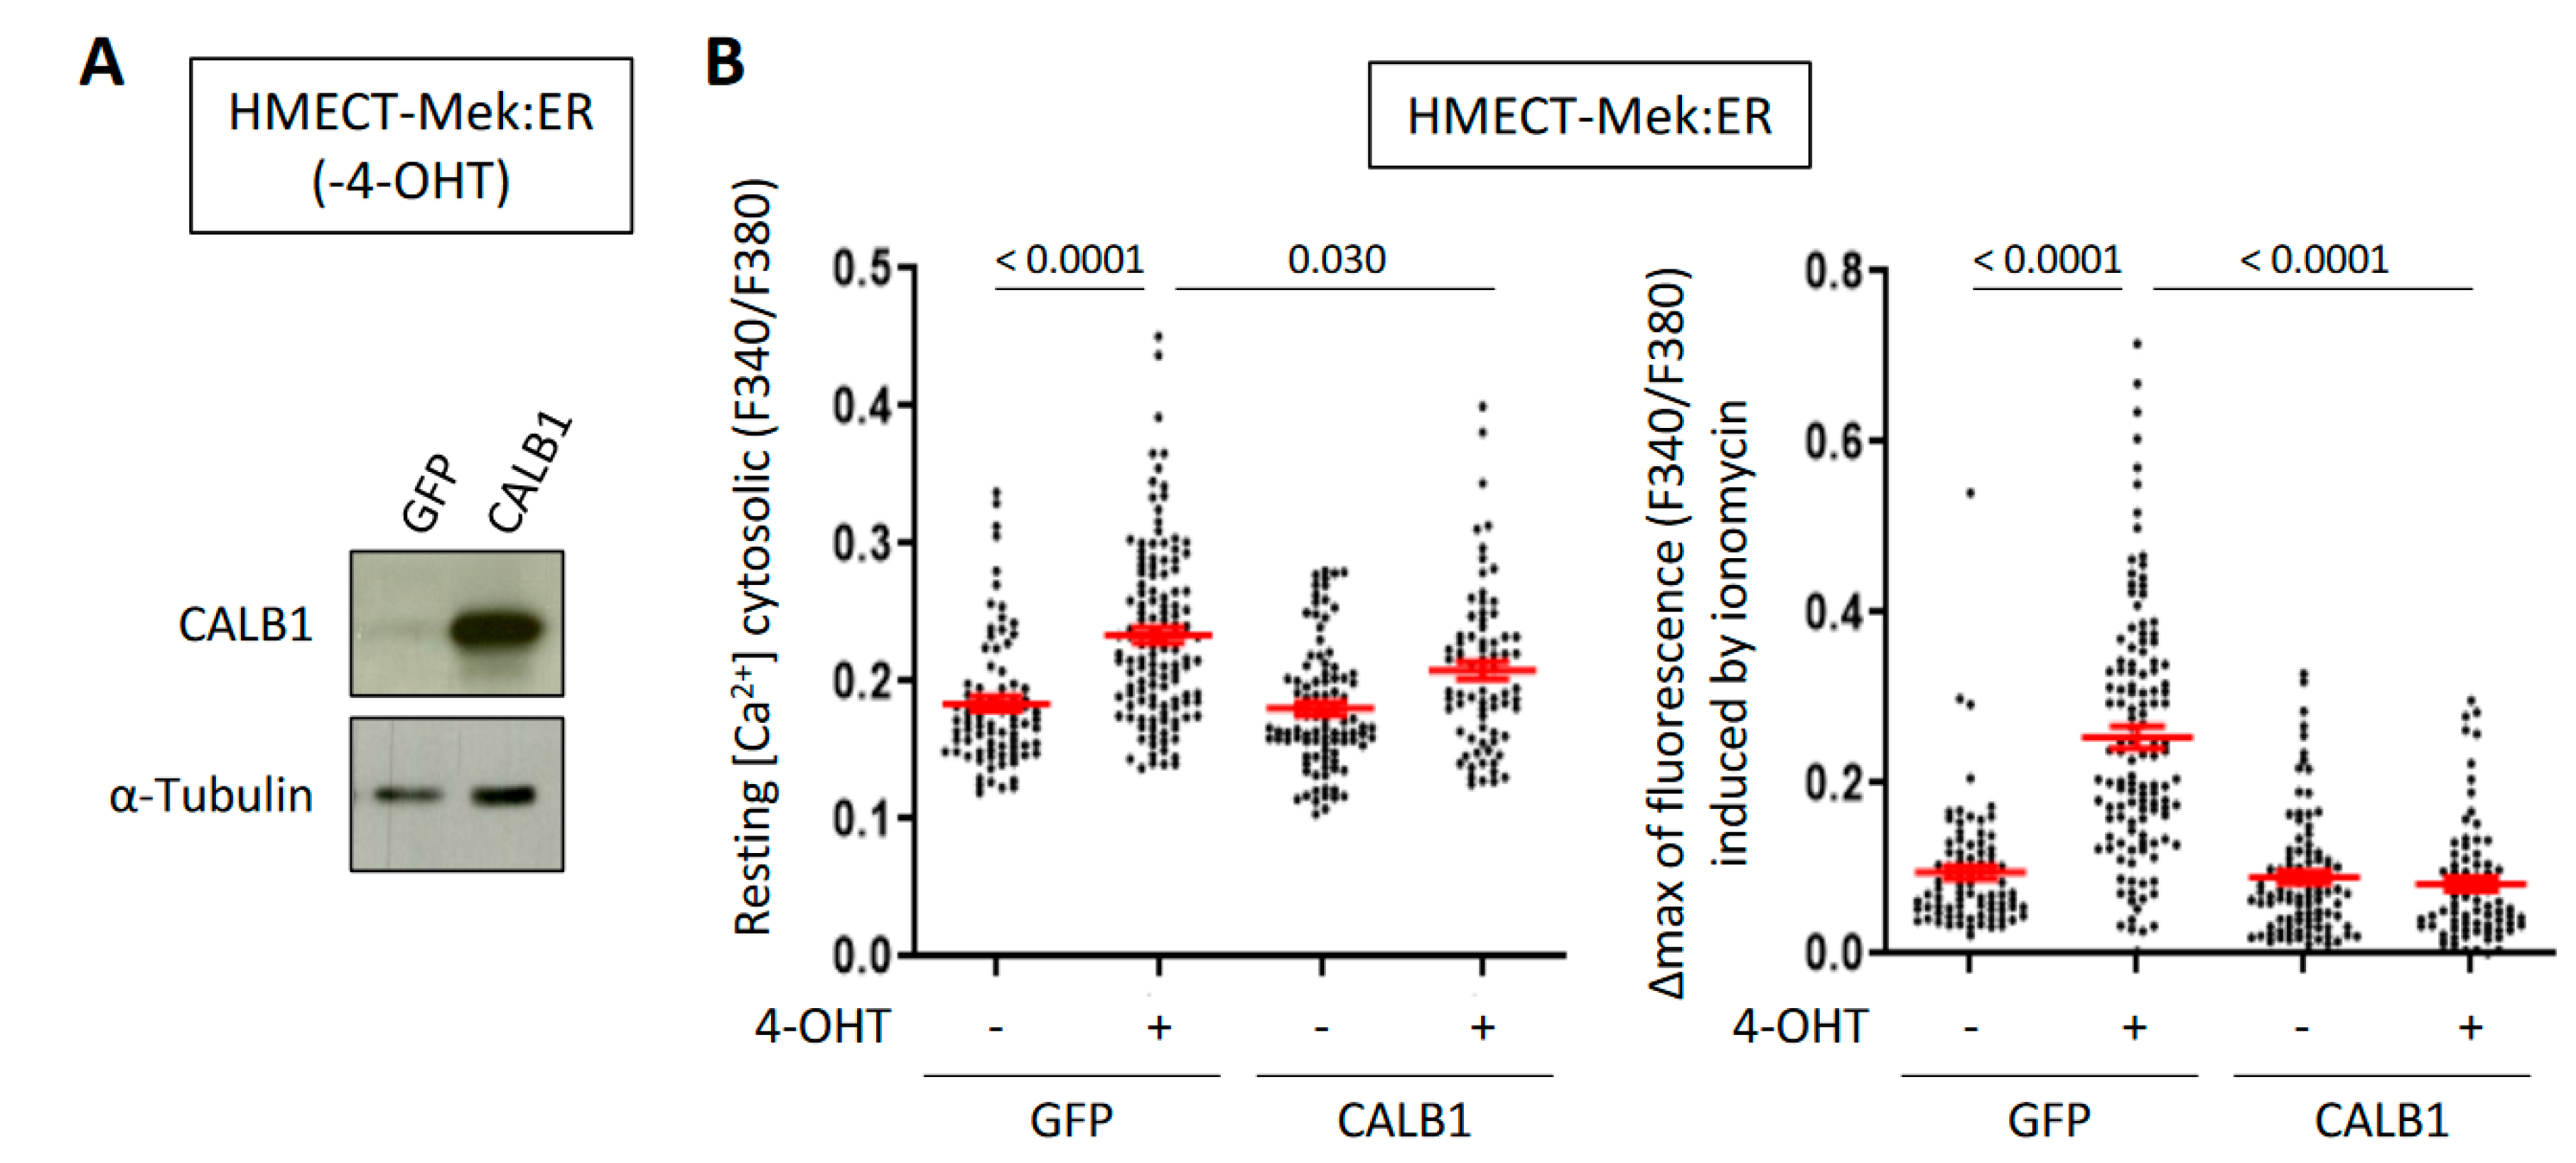
2.3. CALB1 Expression Is Induced by the Calcium-Dependent Calcineurin/NFAT Pathway and Its Constitutive Expression Limits Intracellular Ca2+ Accumulation upon OIS in HMECT

Ca2+ as a secondary messenger is known to activate different calcium-dependent signaling pathways. Notably, it binds to calmodulin, activating calcineurin which allows NFAT transcription factor translocation into the nucleus and activation. NFAT transcription factors have been described to directly induce CALB1 expression in pancreatic β cells [18]. Moreover, pharmacological inhibition of the calcineurin/NFAT pathway was reported to counteract p53-dependent cancer cell senescence [7]. We thus investigated whether the calcium-dependent calcineurin/NFAT pathway could impact CALB1 expression in OIS. First, we treated HMECT-Mek:ER cells with a commonly used chemical inhibitor of calcineurin, FK-506. FK-506 treatment impaired the induction of CALB1 expression upon Mek activation (Figure 3A), indicating the role of NFAT transcription factors in CALB1 induction. This inhibition was not complete, suggesting that other transcription factors than NFAT can contribute to CALB1 induction during OIS. Still, supporting a role of NAFTc1, its overexpression led to an increase in CALB1 mRNA level (Figure 3B). This suggests that upon OIS in HMECT, increased Ca2+ content could induce CALB1 expression through NFATc1 activation. As CALB1 is a potent calcium-buffering protein, we next investigated whether CALB1 overexpression could affect Ca2+ levels in OIS. We observed that, indeed, CALB1 overexpression (Figure 4A) impairs the increase in Ca2+ levels in the cytosol and intracellular stocks during OIS (Figure 4B). Thus, induction of CALB1 during OIS could limit the Ca2+ increase in senescent cells.

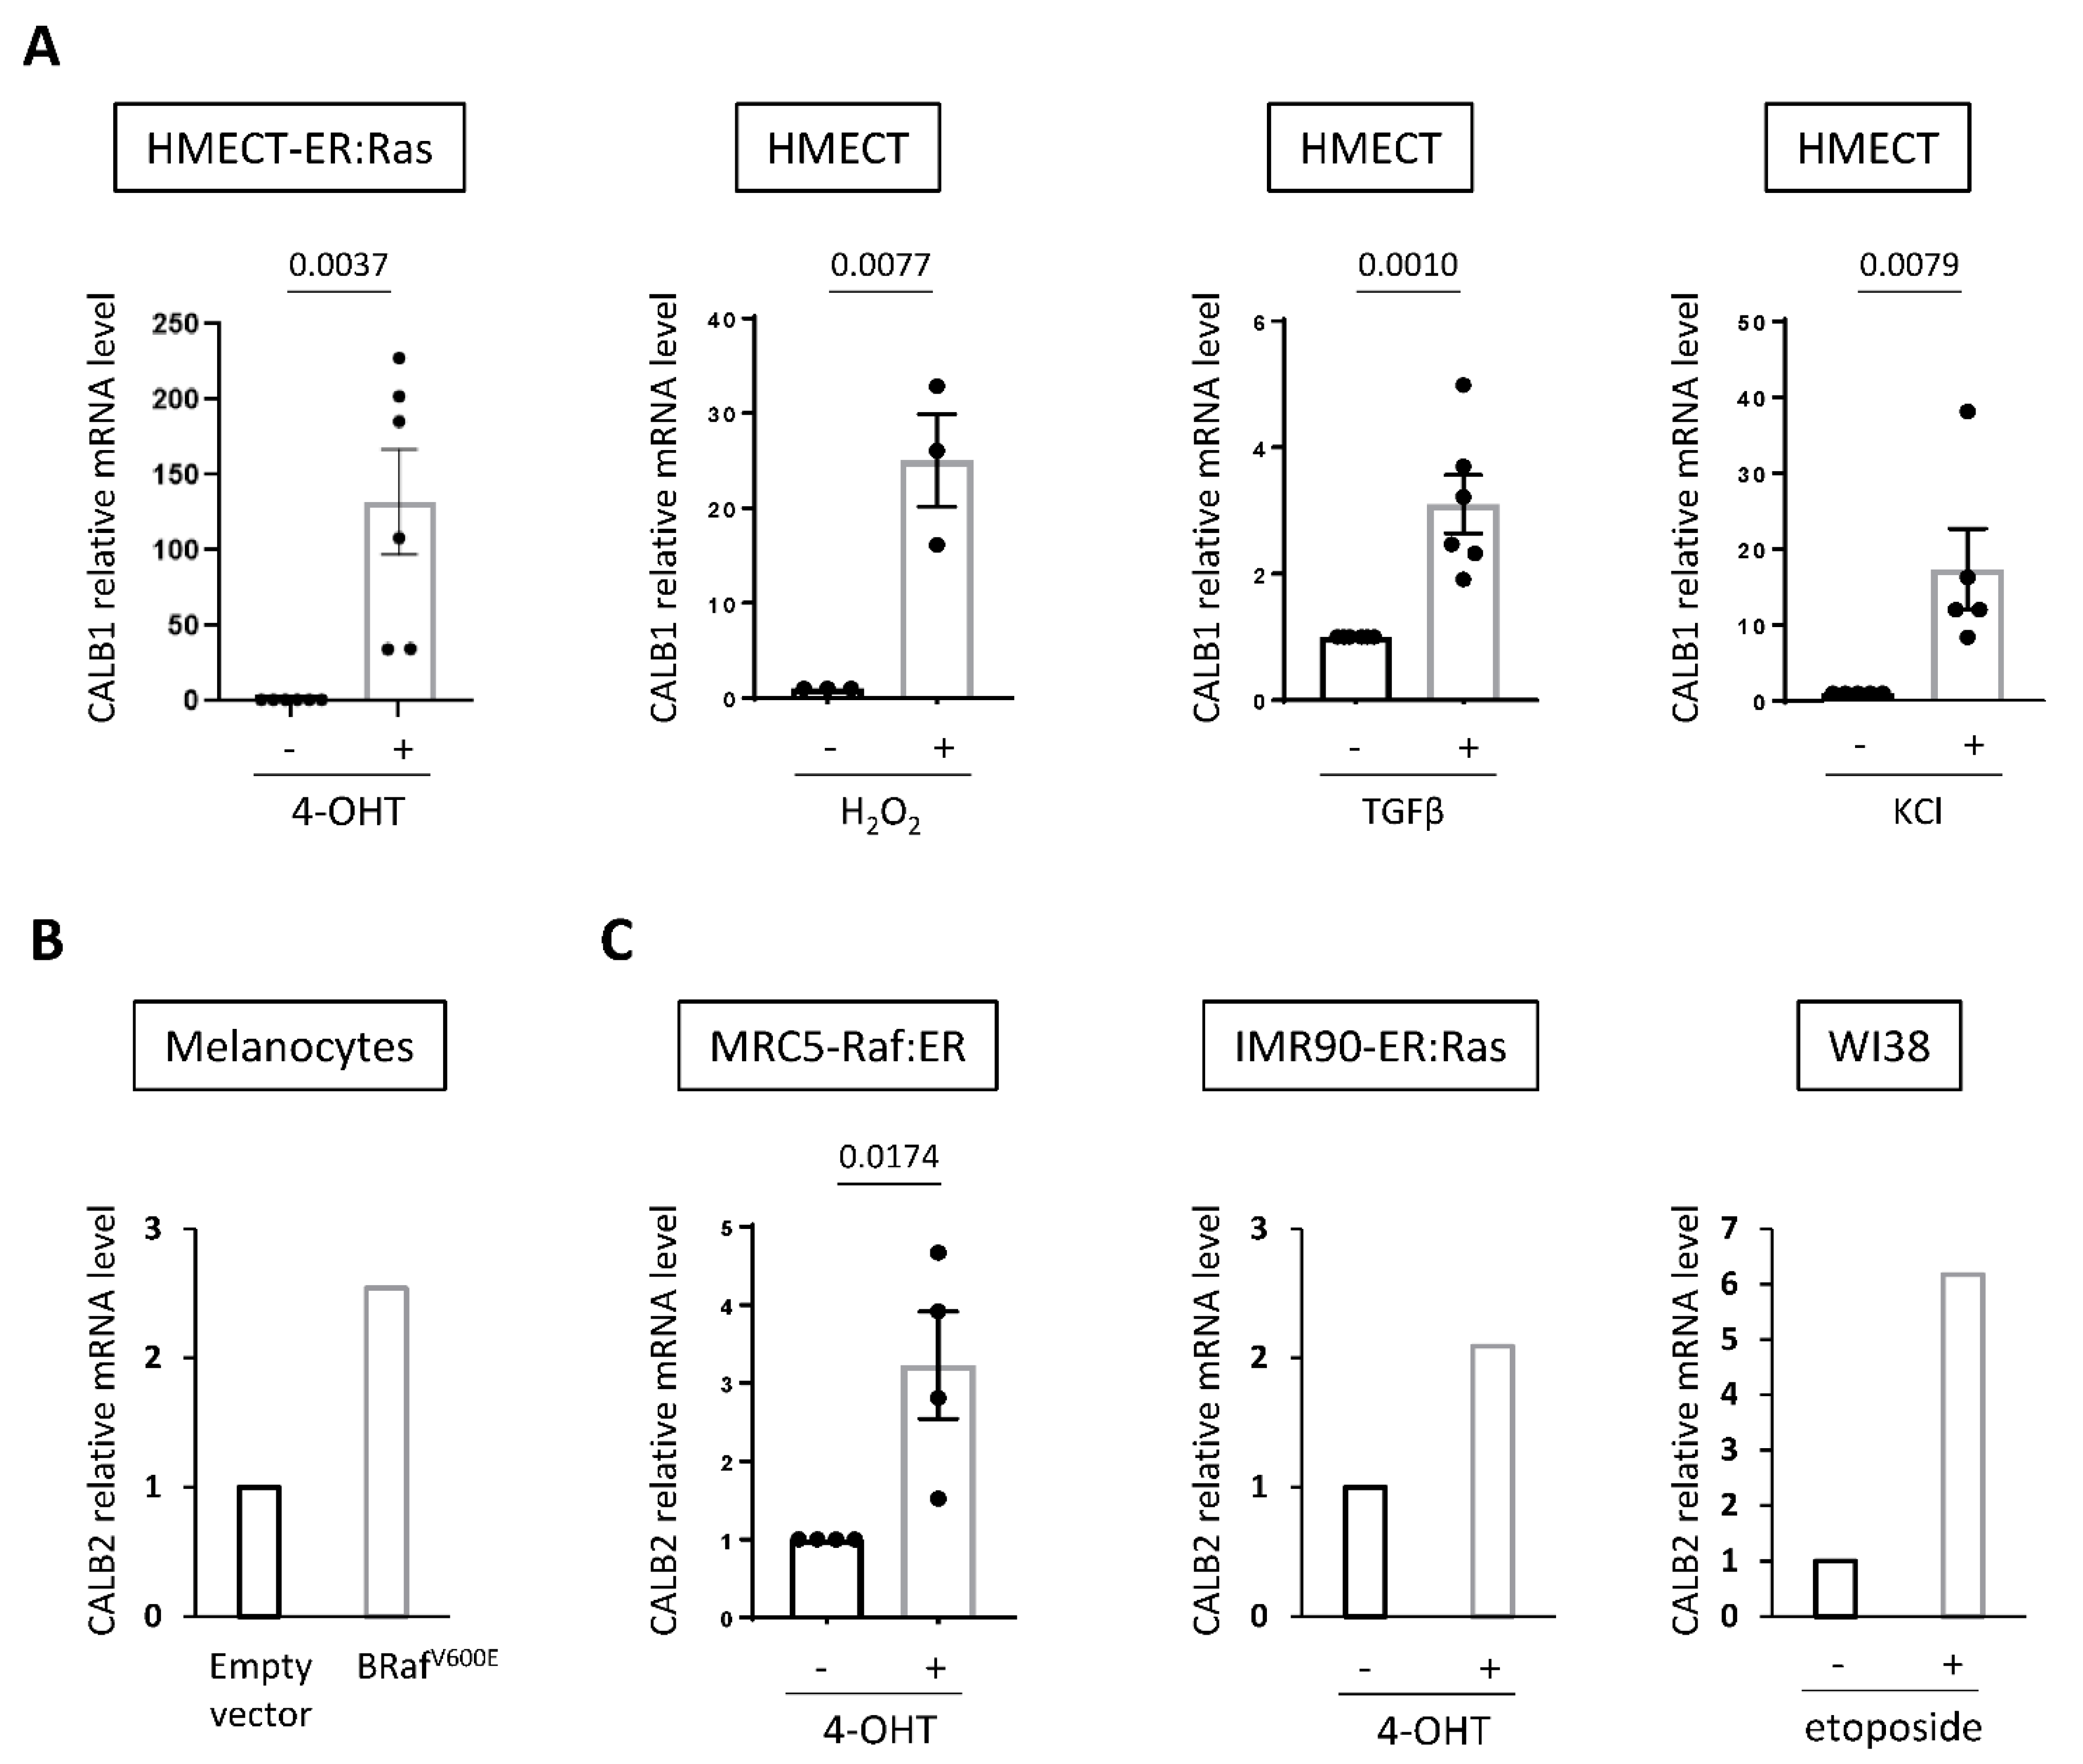
2.4. Increased Expression of Calbindins Is a Frequent Mark of Senescent Cells

Finally, as an increase in intracellular Ca2+ contents appears to be a common mark of senescence based on our data in epithelial cells (Figure 1) and on data in other cell types according to previous reports [6,7,11], we investigated whether induction of the expression of calcium-buffering calbindin-type proteins could also be a common mark of senescent cells. In addition to Raf and Mek oncogenes, bleomycin, and nutlin (Figure 1), other senescence inducers such as Ras oncogene activation, H2O2, TGFβ, or KCl, which are all known to induce senescence in HMECT [14,19,20,21], also triggered a rise in CALB1 expression in HMECT (Figure 5A). We then explored if an induced expression of some calbindins could also be observed upon senescence in other cell types by interrogating published transcriptome data as well as performing RT-qPCR. In melanocytes induced in senescence by B-RafV600E oncogene, no increase in CALB1 expression could be detected (data not shown), but induction of mRNA levels of CALB2 (calbindin 2, also called calbindin-D29K or calretinin), another well-known calcium-buffering protein (Figure 5B) [22]. CALB2 expression was also increased in normal human fibroblasts upon Raf activation, as well as in response to other senescence-inducing stresses such as Ras activation [23] or etoposide treatment [24] (Figure 5C). Expression of calbindins is thus induced in senescent cells, but induction of both CALB1 and CALB2 in the same senescence model was not observed, suggesting cell-type specificity in the calbindin induced during senescence.

3. Discussion

In this study, we showed that intracellular Ca2+ levels in the cytosol and in the intracellular stocks rise in HMECT in response to diverse senescence inducers. Moreover, we discovered that mRNA levels of a calcium-buffering protein, CALB1, are increased in these contexts. CALB1 expression is induced by the calcineurin/NFAT pathway, which is activated by Ca2+. We further showed that CALB1 overexpression in oncogene-induced senescence buffers the rise in Ca2+ levels. Finally, we observed that expression of other calcium-buffering calbindin-type proteins can be upregulated in senescence models where CALB1 is not induced, suggesting that senescent cells have developed strategies to tightly regulate the rise of Ca2+ during senescence.
Together with other works which reported increased Ca2+ levels in several senescence contexts [5,8,9,10,11], our observations suggest that a rise in intracellular Ca2+ contents could be a new hallmark of cellular senescence. Although some contributions of Ca2+ in senescence have already been identified, its precise role in this context is not fully understood yet [5,8,9,10,11]. In our study, we observed an increase in Ca2+ contents both in the cytosol and in intracellular stocks, which are mainly in the ER and in the mitochondria. Ca2+ contained in these two organelles plays important roles in diverse cellular processes such as ATP or reactive oxygen species (ROS) production and contributes to ER stress. We recently showed that during senescence, mitochondrial Ca2+ concentration increases notably due to Ca2+ transfer from the ER promoted by MERCs. Accumulation of Ca2+ in mitochondria induces ROS generation and DNA damage, which lead to cell entry into senescence [8,9,10]. A role of Ca2+ in the regulation of SASP has also been reported as the precursor of interleukin 1α (IL1α), a key upstream SASP pro-inflammatory cytokine inducing the expression of other SASP cytokines such as IL6 and IL8, is processed by the calcium-dependent calpain protease [25]. Ca2+ also activates mTOR and NLRP3 [26,27], which are instrumental for IL1α translation and processing. Consequently, a rise of Ca2+ in senescent cells might contribute to many features of senescent cells [5].
This rise of Ca2+ seems to result in the up-regulation of calcium-buffering protein, CALB1, in senescent HMECT. Indeed, according to our results, chemical inhibition of the calcium-dependent calcineurin/NFAT pathway largely inhibits the upregulation of CALB1 in senescent HMECT, whereas constitutive expression of NFATc1 transcription factor activates CALB1 expression in HMECT. In this latter condition, mRNA level of overexpressed NAFTc1 is very high compared to the level of induction of CALB1 messenger. This difference could be explained by a low level of transcriptionally active NFAT protein and/or CALB1 promoter saturation and/or limitation of cofactors. Our findings are in accordance with a previous report describing that NFAT pathway upregulates CALB1 in another context [18]. Importantly, this pathway also induces the expression of ITPR2 ER Ca2+ release channel by directly binding to its promoter [28], ITPR2 being a key regulator of cellular senescence [8,9,10]. The calcineurin/NFAT pathway could thus impact senescence by regulating Ca2+ signaling at several levels. Up to now, this pathway has been reported either to promote or suppress senescence depending on the cell type and context [7,29], and future studies will be required to better understand the role of the calcineurin/NFAT pathway in regulating Ca2+ signaling during cellular senescence.
The role of CALB1 in senescence remains to be explored. It was recently reported that a high level of CALB1 could inhibit senescence induction by promoting p53 degradation through HDM2 activation in cancer cells [30], but Ca2+ contribution was not investigated in this study. We showed that CALB1 overexpression in HMECT buffers the rise in intracellular Ca2+ contents in oncogene-induced senescence. However, we did not observe in our preliminary experiments any impact of this overexpression on cell proliferation arrest induced by Mek activation (data not shown). CALB1 was reported to protect cells from death by buffering Ca2+ [31]. Moreover, CALB1 does not only act as a calcium-buffering protein but also as a Ca2+ sensor, interacting in a calcium-dependent manner with other proteins. Notably, after Ca2+ fixation to its EF-hands, CALB1 interacts with and inhibits caspase 3, a key effector caspase in the apoptosis process [32]. This inhibition was shown to suppress apoptosis upon CALB1 overexpression in osteoblastic cells [33]. As a too high intracellular Ca2+ concentration triggers cell death, one interesting hypothesis would be that CALB1 expression is upregulated in response to senescence-inducing stresses in order to buffer the rise in intracellular Ca2+ levels and avoid its cytotoxic effects. This negative feedback loop would be established by the calcium-dependent calcineurin/NFAT pathway. The observation of an increased expression of calbindins in response to many senescence-inducing stresses in several cell types suggests that this could be a general mechanism in senescent cells. This idea will need to be explored by investigating the impact of downregulating the expression of calbindins on senescence.
Altogether, by identifying the induction of the expression of calbindins in senescent cells, our work points out a new feature of senescent cells and provides a better understanding of calcium-related processes in cellular senescence. Here, we focused our work on normal senescent cells, it will also be interesting to investigate whether these mechanisms are shared by senescent cancer cells, as some molecular features they express are different [34]. This work paves the way for future studies investigating new potential molecular basis underlying senescent cell resistance to cell death, which might be exploited for designing new senolytic approaches.

4. Materials and Methods

4.1. Cell Culture and Reagents

Human mammary epithelial cells (HMEC, CC-2551B, Lonza, Basel, Switzerland) were cultured in a mammary epithelial cell growth medium (C-21210, Promocell, Heidelberg, Germany) supplemented with 1% penicillin/streptomycin (Life Technologies, Carlsbad, CA, USA). Human fetal lung fibroblasts MRC5 (ATCC), 293 GP retrovirus-producing cells, and 293 T lentivirus-producing cells (Clontech, Mountain View, CA, USA) were cultured in Dulbecco’s modified Eagle’s medium (DMEM supplemented in GlutaMax, Life Technologies) with 10% fetal bovine serum (FBS, Sigma-Aldrich, St. Louis, MO, USA) and 1% penicillin/streptomycin (ThermoFisher Scientific, Waltham, MA, USA). All the cells were cultured at 37 °C with 5% CO2. (Z)-4-hydroxytamoxifen (4-OHT) (Sigma-Aldrich) was used at 100 nM, bleomycin (Merck, Kenilworth, NJ, USA) at 12 µg/mL, nutlin-3 (Sigma-Aldrich) at 1 µM, H2O2 (Sigma) at 250 µM, TGFβ (Peprotech, Rocky Hill, NJ, USA) at 0.5 ng/mL, KCl (Sigma-Aldrich) at 65 mM and FK-506 (MedChem Express, Monmouth Junction, NJ, USA) at 2 µM.

4.2. Vectors, Transfection, and Infection

HMEC were first infected with pWZL-Blast-Flag-HA-hTERT retroviral vector [35] (Addgene_22396) encoding the catalytic subunit of telomerase to generate immortalized HMEC (HMECT). HMECT or MRC5 were infected with pLNC-Mek:ER (ΔMEK1 (ΔN3,S218E, S222D):ER) [9], pBabe-Raf:ER (HA-∆Raf1(S642A):ER) [36] (Addgene_72572) or pLNCX-ER:Ras (ER1a H-RasG12V) [37] (Addgene_67844) retroviral vectors encoding Mek, Raf or Ras oncogenes respectively, fused to the ligand binding domain of estrogen receptor (ER). Upon 4-OHT treatment, these ER-fused oncogenes are stabilized and activated [9,36,37]. A retroviral vector encoding a constitutively active NFATc1 ([38], Addgene_11102) and a lentiviral vector encoding CALB1 (pLV-CALB1, VectorBuilder) were used, as well as the corresponding control vectors (empty or encoding the GFP). 293 GP retrovirus-producing cells and 293 T lentivirus-producing cells were transfected with GeneJuice transfection reagent (Merck Millipore) according to the manufacturer’s recommendations. Two days after transfection, the virus-containing supernatant was filtered, diluted with fresh mammary epithelial cell growth medium (for HMEC and HMECT) or with fresh DMEM (for MRC5) (1/2 dilution for 293 GP cells and 1/5 dilution for 293 T cells) and hexadimethrine bromide at 8 µg/mL (Sigma-Aldrich) and used to infect HMEC/HMECT or MRC5. On the following day, media were changed, and selection of infected cells was started using puromycin (500 ng/mL; Invivogen) or geneticin (100 μg/mL; Life technologies). HMEC and HMECT are estrogen-independent cells, and accordingly, they do not respond to 4-OHT at the concentration used. The generated HMECT expressing inducible oncogenes were used within the next 2–4 weeks to avoid selection of specific clones or problems of ploidy.

4.3. RNA Extraction, Reverse Transcription and Real-Time Quantitative PCR

Total RNAs were extracted using NucleoZOL (Macherey-Nagel) according to the manufacturer’s instructions. RNAs were reverse transcribed with First-Strand cDNA Synthesis Kit (GE Healthcare) following the manufacturer’s recommendations. TaqMan real-time quantitative PCR was then run with PCR mixture containing TaqMan mix (Roche), 200 nM of primers, Universal Probe Library probe (100 µM, ThermoFisher Scientific), and cDNA template. Reactions were performed in triplicate on a FX96 Thermocycler (Bio-Rad). The comparative Ct (ΔΔCT) method and normalization with GAPDH housekeeping gene were used to calculate the relative amount of mRNA. Sequences of primers are as follows: CALB1:Sens 5′-aagatccgttcggtacagctt-3′, Anti-sens 5′-ctgaaggatctgtgcgagaa-3′; CALB2:Sens 5′-tcatttcctttttgtttttctcg-3′, Anti-sens 5′-gcgatcttcacattttacgaca-3′; NFATc1: Sens 5′-ggtcagttttcgcttccatc-3′, Anti-sens 5′-ccaaggtcattttcgtggag-3′; GAPDH: Sens 5′-agccacatcgctcagacac-3′, Anti-sens 5′-gcccaatacgaccaaatcc-3′.

4.4. Western Blot

Cells were lysed in 6X Laemmli buffer (Tris 125 mM pH 6.8, 2% SDS, 10% glycerol) with 15% β-mercaptoethanol and boiled for 5 min at 100 °C. After measuring protein concentrations with Bio-Rad Protein Assay kit according to the manufacturer’s recommendations, total cell extracts were separated using 12% acrylamide gel by SDS-PAGE electrophoresis, and proteins were transferred to nitrocellulose membranes (Bio-Rad, Hercules, CA, USA). Membranes were blocked for 1 h in Tris buffer saline (TBS, pH 7.5), with 0.05% Tween-20 (TBS-T) and 5% milk and primary antibodies added and incubated overnight at 4 °C. An anti-CALB1 rabbit polyclonal antibody (sc28285, Santa Cruz, Santa Cruz, CA, USA) and anti-α-tubulin mouse monoclonal antibody (T6199, Sigma-Aldrich) were used. After washes in TBS-T, membranes were incubated for 1 h at room temperature with anti-rabbit (711-035-152, Interchim, Montluçon, France) or anti-mouse (715-035-150, Interchim) HRP-coupled secondary antibody (1/5000 dilution). Peroxidase activity was revealed using an enhanced chemiluminescence Western Blotting detection reagents (RPN2106V1/2, GE Healthcare, Chicago, IL, USA) and visualized by luminography.

4.5. Immunofluorescence Staining

Cells plated on Lab-Tek chamber slides (Thermo Fisher) were washed once with PBS and fixed with ice-cold methanol 10 min at −20 °C. Cells were then rinsed once in TBS-T and incubated in TBS-T-20% FBS for 30 min at room temperature. Cells were then incubated overnight at 4 °C with primary antibody against CALB1 (sc28285, Santa Cruz). The following day, cells were washed and incubated with anti-rabbit IgG coupled with Alexa Fluor 488 (A11008, Life Technologies) for 1 h at room temperature. Cells were then washed with PBS and counterstained with Hoechst (Sigma-Aldrich) for 10 min at room temperature. Pictures were taken with a Nikon fluorescence microscope (CRCL cellular imaging platform).

4.6. Calcium Imaging

Cytosolic Ca2+ experiments were achieved as previously described [39]. Briefly, plated cells were loaded with the Fura2-AM dye (2.5 µM; Molecular Probes) for 30 min at 37 °C in Ca2+-containing buffer (HBSS; Gibco). Live Ca2+ imaging was performed at room temperature and in the absence of external Ca2+ (Ca2+-free HBSS; Gibco). MetaFluor 6.3 (Universal Imaging) was used for image analysis. After 2 min at resting state, cells were stimulated with 1 µM ionomycin in order to deplete intracellular Ca2+ stores. Results are presented as a ratio of fluorescence intensity of 340/380 nm (F340/F380) as this ratio is strictly related to intracellular free calcium [40,41].

4.7. Statistical Analyses

Graphs show means and SEM obtained with several independent experiments (n indicated in figure legends) or show data extracted from transcriptome analyses as mentioned in figure legends. Statistical analyses were performed with GraphPad Prism 8 software and are specified in figure legends. Before proceeding to any analysis, the normality of the samples was evaluated. Unpaired t-test (for normal distribution) or Mann–Whitney test (for non-normal distribution) was used unless stated otherwise in the figure legends. p-values are indicated in figures.

Author Contributions

Conceptualization, C.R., N.M. and D.B.; methodology, C.R., N.T., A.H., M.W., J.-M.F., S.D. and N.M.; validation, C.R. and N.M.; formal analysis, C.R., N.T., J.-M.F., S.D. and N.M.; investigation, C.R., N.T., A.H., M.W., J.-M.F., S.D. and N.M.; data curation, C.R. and N.M.; writing—original draft preparation, N.M. and C.R.; writing—review and editing, N.M., C.R., S.D. and D.B.; visualisation, C.R., N.T., S.D. and N.M.; supervision, N.M. and D.B.; project administration, N.M., S.D., F.V.C. and D.B.; funding acquisition D.B. All authors have read and agreed to the published version of the manuscript.

Funding

This work was carried out with the support of the French National Cancer Institute INCA (grant PLBio No. 2018-144) to D.B. C.R. was supported by the Ligue Nationale Contre le Cancer and M.W. by the Fondation de France.

Institutional Review Board Statement

Not applicable.

Informed Consent Statement

Not applicable.

Data Availability Statement

The data supporting findings presented in this study are available from the corresponding author upon reasonable request.

Conflicts of Interest

The authors declare no conflict of interest.

References

  1. Gorgoulis, V.; Adams, P.D.; Alimonti, A.; Bennett, D.C.; Bischof, O.; Bishop, C.; Campisi, J.; Collado, M.; Evangelou, K.; Ferbeyre, G.; et al. Cellular Senescence: Defining a Path Forward. Cell 2019, 179, 813–827. [Google Scholar] [CrossRef] [PubMed]
  2. Hernandez-Segura, A.; Nehme, J.; Demaria, M. Hallmarks of Cellular Senescence. Trends Cell Biol. 2018, 28, 436–453. [Google Scholar] [CrossRef] [PubMed]
  3. Kumari, R.; Jat, P. Mechanisms of Cellular Senescence: Cell Cycle Arrest and Senescence Associated Secretory Phenotype. Front Cell Dev. Biol. 2021, 9, 645593. [Google Scholar] [CrossRef] [PubMed]
  4. Farfariello, V.; Iamshanova, O.; Germain, E.; Fliniaux, I.; Prevarskaya, N. Calcium homeostasis in cancer: A focus on senescence. Biochim. Biophys. Acta 2015, 1853, 1974–1979. [Google Scholar] [CrossRef] [PubMed]
  5. Martin, N.; Bernard, D. Calcium signaling and cellular senescence. Cell Calcium 2018, 70, 16–23. [Google Scholar] [CrossRef]
  6. Borodkina, A.V.; Shatrova, A.N.; Deryabin, P.I.; Griukova, A.A.; Abushik, P.A.; Antonov, S.M.; Nikolsky, N.N.; Burova, E.B. Calcium alterations signal either to senescence or to autophagy induction in stem cells upon oxidative stress. Aging (Albany NY) 2016, 8, 3400–3418. [Google Scholar] [CrossRef]
  7. Wu, X.; Nguyen, B.C.; Dziunycz, P.; Chang, S.; Brooks, Y.; Lefort, K.; Hofbauer, G.F.; Dotto, G.P. Opposing roles for calcineurin and ATF3 in squamous skin cancer. Nature 2010, 465, 368–372. [Google Scholar] [CrossRef]
  8. Ma, X.; Warnier, M.; Raynard, C.; Ferrand, M.; Kirsh, O.; Defossez, P.A.; Martin, N.; Bernard, D. The nuclear receptor RXRA controls cellular senescence by regulating calcium signaling. Aging Cell 2018, 17, e12831. [Google Scholar] [CrossRef]
  9. Wiel, C.; Lallet-Daher, H.; Gitenay, D.; Gras, B.; Le Calve, B.; Augert, A.; Ferrand, M.; Prevarskaya, N.; Simonnet, H.; Vindrieux, D.; et al. Endoplasmic reticulum calcium release through ITPR2 channels leads to mitochondrial calcium accumulation and senescence. Nat. Commun. 2014, 5, 3792. [Google Scholar] [CrossRef]
  10. Ziegler, D.V.; Vindrieux, D.; Goehrig, D.; Jaber, S.; Collin, G.; Griveau, A.; Wiel, C.; Bendridi, N.; Djebali, S.; Farfariello, V.; et al. Calcium channel ITPR2 and mitochondria-ER contacts promote cellular senescence and aging. Nat. Commun. 2021, 12, 720. [Google Scholar] [CrossRef]
  11. Farfariello, V.; Gordienko, D.V.; Mesilmany, L.; Touil, Y.; Germain, E.; Fliniaux, I.; Desruelles, E.; Gkika, D.; Roudbaraki, M.; Shapovalov, G.; et al. TRPC3 shapes the ER-mitochondria Ca(2+) transfer characterizing tumour-promoting senescence. Nat. Commun. 2022, 13, 956. [Google Scholar] [CrossRef] [PubMed]
  12. Schwaller, B. Cytosolic Ca2+ buffers. Cold Spring Harb. Perspect. Biol. 2010, 2, a004051. [Google Scholar] [CrossRef] [PubMed]
  13. Gitenay, D.; Wiel, C.; Lallet-Daher, H.; Vindrieux, D.; Aubert, S.; Payen, L.; Simonnet, H.; Bernard, D. Glucose metabolism and hexosamine pathway regulate oncogene-induced senescence. Cell Death. Dis. 2014, 5, e1089. [Google Scholar] [CrossRef] [PubMed]
  14. Lallet-Daher, H.; Wiel, C.; Gitenay, D.; Navaratnam, N.; Augert, A.; Le Calve, B.; Verbeke, S.; Carling, D.; Aubert, S.; Vindrieux, D.; et al. Potassium Channel KCNA1 Modulates Oncogene-Induced Senescence and Transformation. Cancer Res. 2013, 73, 5253–5265. [Google Scholar] [CrossRef]
  15. Wiel, C.; Augert, A.; Vincent, D.F.; Gitenay, D.; Vindrieux, D.; Le Calve, B.; Arfi, V.; Lallet-Daher, H.; Reynaud, C.; Treilleux, I.; et al. Lysyl oxidase activity regulates oncogenic stress response and tumorigenesis. Cell Death. Dis. 2013, 4, e855. [Google Scholar] [CrossRef]
  16. Giorgi, C.; Danese, A.; Missiroli, S.; Patergnani, S.; Pinton, P. Calcium Dynamics as a Machine for Decoding Signals. Trends Cell Biol. 2018, 28, 258–273. [Google Scholar] [CrossRef]
  17. Warnier, M.; Flaman, J.M.; Chouabe, C.; Wiel, C.; Gras, B.; Griveau, A.; Blanc, E.; Foy, J.P.; Mathot, P.; Saintigny, P.; et al. The SCN9A channel and plasma membrane depolarization promote cellular senescence through Rb pathway. Aging Cell 2018, 17, e12736. [Google Scholar] [CrossRef]
  18. Hajibeigi, A.; Dioum, E.M.; Guo, J.; Oz, O.K. Identification of novel regulatory NFAT and TFII-I binding elements in the calbindin-D28k promoter in response to serum deprivation. Biochem. Biophys. Res. Commun. 2015, 465, 414–420. [Google Scholar] [CrossRef]
  19. Cipriano, R.; Kan, C.E.; Graham, J.; Danielpour, D.; Stampfer, M.; Jackson, M.W. TGF-beta signaling engages an ATM-CHK2-p53-independent RAS-induced senescence and prevents malignant transformation in human mammary epithelial cells. Proc. Natl. Acad. Sci. USA 2011, 108, 8668–8673. [Google Scholar] [CrossRef]
  20. Dasari, A.; Bartholomew, J.N.; Volonte, D.; Galbiati, F. Oxidative stress induces premature senescence by stimulating caveolin-1 gene transcription through p38 mitogen-activated protein kinase/Sp1-mediated activation of two GC-rich promoter elements. Cancer Res. 2006, 66, 10805–10814. [Google Scholar] [CrossRef]
  21. Vindrieux, D.; Augert, A.; Girard, C.A.; Gitenay, D.; Lallet-Daher, H.; Wiel, C.; Le Calve, B.; Gras, B.; Ferrand, M.; Verbeke, S.; et al. PLA2R1 mediates tumor suppression by activating JAK2. Cancer Res. 2013, 73, 6334–6345. [Google Scholar] [CrossRef]
  22. Pawlikowski, J.S.; McBryan, T.; van, T.J.; Drotar, M.E.; Hewitt, R.N.; Maier, A.B.; King, A.; Blyth, K.; Wu, H.; Adams, P.D. Wnt signaling potentiates nevogenesis. Proc. Natl. Acad. Sci. USA 2013, 110, 16009–16014. [Google Scholar] [CrossRef] [PubMed]
  23. Acosta, J.C.; Banito, A.; Wuestefeld, T.; Georgilis, A.; Janich, P.; Morton, J.P.; Athineos, D.; Kang, T.W.; Lasitschka, F.; Andrulis, M.; et al. A complex secretory program orchestrated by the inflammasome controls paracrine senescence. Nat. Cell Biol. 2013, 15, 978–990. [Google Scholar] [CrossRef] [PubMed]
  24. Contrepois, K.; Coudereau, C.; Benayoun, B.A.; Schuler, N.; Roux, P.F.; Bischof, O.; Courbeyrette, R.; Carvalho, C.; Thuret, J.Y.; Ma, Z.; et al. Histone variant H2A.J accumulates in senescent cells and promotes inflammatory gene expression. Nat. Commun. 2017, 8, 14995. [Google Scholar] [CrossRef] [PubMed]
  25. McCarthy, D.A.; Clark, R.R.; Bartling, T.R.; Trebak, M.; Melendez, J.A. Redox control of the senescence regulator interleukin-1alpha and the secretory phenotype. J. Biol. Chem. 2013, 288, 32149–32159. [Google Scholar] [CrossRef]
  26. Ito, N.; Ruegg, U.T.; Takeda, S. ATP-Induced Increase in Intracellular Calcium Levels and Subsequent Activation of mTOR as Regulators of Skeletal Muscle Hypertrophy. Int. J. Mol. Sci. 2018, 19, 2804. [Google Scholar] [CrossRef]
  27. Murakami, T.; Ockinger, J.; Yu, J.; Byles, V.; McColl, A.; Hofer, A.M.; Horng, T. Critical role for calcium mobilization in activation of the NLRP3 inflammasome. Proc. Natl. Acad. Sci. USA 2012, 109, 11282–11287. [Google Scholar] [CrossRef]
  28. Sankar, N.; deTombe, P.P.; Mignery, G.A. Calcineurin-NFATc regulates type 2 inositol 1,4,5-trisphosphate receptor (InsP3R2) expression during cardiac remodeling. J. Biol. Chem. 2014, 289, 6188–6198. [Google Scholar] [CrossRef]
  29. Manda, K.R.; Tripathi, P.; Hsi, A.C.; Ning, J.; Ruzinova, M.B.; Liapis, H.; Bailey, M.; Zhang, H.; Maher, C.A.; Humphrey, P.A.; et al. NFATc1 promotes prostate tumorigenesis and overcomes PTEN loss-induced senescence. Oncogene 2016, 35, 3282–3292. [Google Scholar] [CrossRef]
  30. Cao, L.Q.; Wang, Y.N.; Liang, M.; Pan, M.Z. CALB1 enhances the interaction between p53 and MDM2, and inhibits the senescence of ovarian cancer cells. Mol. Med. Rep. 2019, 19, 5097–5104. [Google Scholar] [CrossRef]
  31. Guo, Q.; Christakos, S.; Robinson, N.; Mattson, M.P. Calbindin D28k blocks the proapoptotic actions of mutant presenilin 1: Reduced oxidative stress and preserved mitochondrial function. Proc. Natl. Acad. Sci. USA 1998, 95, 3227–3232. [Google Scholar] [CrossRef] [PubMed]
  32. Bobay, B.G.; Stewart, A.L.; Tucker, A.T.; Thompson, R.J.; Varney, K.M.; Cavanagh, J. Structural insights into the calcium-dependent interaction between calbindin-D28K and caspase-3. FEBS Lett. 2012, 586, 3582–3589. [Google Scholar] [CrossRef]
  33. Bellido, T.; Huening, M.; Raval-Pandya, M.; Manolagas, S.C.; Christakos, S. Calbindin-D28k is expressed in osteoblastic cells and suppresses their apoptosis by inhibiting caspase-3 activity. J. Biol. Chem. 2000, 275, 26328–26332. [Google Scholar] [CrossRef]
  34. Jochems, F.; Thijssen, B.; De Conti, G.; Jansen, R.; Pogacar, Z.; Groot, K.; Wang, L.; Schepers, A.; Wang, C.; Jin, H.; et al. The Cancer SENESCopedia: A delineation of cancer cell senescence. Cell Rep. 2021, 36, 109441. [Google Scholar] [CrossRef] [PubMed]
  35. Maida, Y.; Yasukawa, M.; Furuuchi, M.; Lassmann, T.; Possemato, R.; Okamoto, N.; Kasim, V.; Hayashizaki, Y.; Hahn, W.C.; Masutomi, K. An RNA-dependent RNA polymerase formed by TERT and the RMRP RNA. Nature 2009, 461, 230–235. [Google Scholar] [CrossRef] [PubMed]
  36. Jensen, K.J.; Moyer, C.B.; Janes, K.A. Network Architecture Predisposes an Enzyme to Either Pharmacologic or Genetic Targeting. Cell Syst. 2016, 2, 112–121. [Google Scholar] [CrossRef] [PubMed]
  37. Young, A.R.; Narita, M.; Ferreira, M.; Kirschner, K.; Sadaie, M.; Darot, J.F.; Tavare, S.; Arakawa, S.; Shimizu, S.; Watt, F.M.; et al. Autophagy mediates the mitotic senescence transition. Genes Dev. 2009, 23, 798–803. [Google Scholar] [CrossRef]
  38. Monticelli, S.; Rao, A. NFAT1 and NFAT2 are positive regulators of IL-4 gene transcription. Eur. J. Immunol. 2002, 32, 2971–2978. [Google Scholar] [CrossRef]
  39. Raynard, C.; Ma, X.; Huna, A.; Tessier, N.; Massemin, A.; Zhu, K.; Flaman, J.M.; Moulin, F.; Goehrig, D.; Medard, J.J.; et al. NF-kappaB-dependent secretome of senescent cells can trigger neuroendocrine transdifferentiation of breast cancer cells. Aging Cell 2022, 21, e13632. [Google Scholar] [CrossRef]
  40. Lim, D.; Mapelli, L.; Canonico, P.L.; Moccia, F.; Genazzani, A.A. Neuronal Activity-Dependent Activation of Astroglial Calcineurin in Mouse Primary Hippocampal Cultures. Int. J. Mol. Sci. 2018, 19, 2997. [Google Scholar] [CrossRef]
  41. Sanchez-Tecuatl, M.; Vargaz-Guadarrama, A.; Ramirez-Cortes, J.M..; Gomez-Gil, P.; Moccia, F.; Berra-Romani, R. Automated Intracellular Calcium Profiles Extraction from Endothelial Cells Using Digital Fluorescence Images. Int. J. Mol. Sci. 2018, 19, 3440. [Google Scholar]
Figure 1. Intracellular Ca2+ levels are increased in HMECT in response to diverse senescence inducers. Ca2+ levels were measured with the ratiometric probe Fura2-AM in HMECT either overexpressing 4-OHT-inducible oncogenes Mek:ER (A) or Raf:ER (B) or treated with bleomycin (C) or nutlin (D). Resting cytosolic Ca2+ concentration was evaluated as stable fluorescent ratio before stimulation (left panels) and the size of Ca2+ intracellular stocks was estimated as the Ca2+ peak amplitude obtained after ionomycin stimulation (right panels). Means +/− SEM of three independent experiments are presented. Mann–Whitney t-test was performed, and p-values are indicated. Mek:ER cells: Three days after 4-OHT treatment (−4-OHT n = 391, +4-OHT n = 271), Raf:ER cells: three days after 4-OHT treatment (−4-OHT n = 173, +4-OHT n = 154), bleomycin or nutlin-treated cells: four days after treatment (non-treated n = 231, bleomycin n = 94, nutlin n = 162).
Ijms 23 09376 g001
Figure 2. CALB1 expression is increased in HMECT in response to diverse senescence inducers. (A) Transcriptomics analysis in HMECT-Mek:ER reveals that CALB1 expression is induced after oncogene activation by 4-OHT. PVALB, CALB2, and CALB1 mean expression level from a biological triplicate is indicated at 0 (−4-OHT), 24 and 96 h after 4-OHT treatment. An unpaired t-test with Welch correction was used. (BE). CALB1 mRNA level (left panels) and protein level and subcellular localization (right panels) were assessed in HMECT either overexpressing 4-OHT-inducible oncogenes Mek:ER (B) or Raf:ER (C) or treated with bleomycin (D) or nutlin (E). CALB1 mRNA level was measured by RT-qPCR and mean +/- SEM of independent experiments are shown ((B), n = 6; (C), n = 8; (D), n = 3; (E), n = 4). Unpaired t-test (B,D,E) or Mann–Whitney test (C) were performed, and p-values are indicated. CALB1 protein level and localization were assessed six days after treatment by immunofluorescence with CALB1 antibody, nuclei were stained with Hoechst.
Ijms 23 09376 g002
Figure 3. The calcium-dependent calcineurin/NFAT pathway induces CALB1 expression upon oncogene activation in HMECT. (A) CALB1 mRNA level was measured by RT-qPCR in HMECT overexpressing 4-OHT-inducible Mek:ER and treated (+) or not (−) with FK-506, a calcineurin inhibitor (treated every day with 2 µM during six days), or/and with 4-OHT (100 nM). The first three days, cells were co-treated with 4-OHT and FK-506 (first treatment 4 h prior 4-OHT), and the three last days only with FK-506. Mean +/− SEM of four independent experiments are shown. An unpaired t-test was performed and p-value is indicated. (B) NFATc1 (left panel) and CALB1 (right panel) mRNA levels were measured by RT-qPCR in HMECT 24 h after infection with a vector encoding NFATc1 or control empty vector. Mean +/− SEM of six independent experiments are shown. Unpaired t-tests were performed, and p-values are indicated.
Ijms 23 09376 g003
Figure 4. CALB1 overexpression buffers increased Ca2+ levels induced by oncogene activation in HMECT. (A) CALB1 protein level was assessed by Western Blot in HMECT-Mek:ER (without 4-OHT) infected with a vector encoding CALB1 or the corresponding GFP control vector. α-Tubulin protein level was assessed as a loading control. (B) Ca2+ levels were measured with the ratiometric probe Fura2 in HMECT-Mek:ER inducible oncogene and CALB1 or the corresponding GFP control vector, with or without 4-OHT treatment. Resting cytosolic Ca2+ concentration was evaluated as a stable fluorescent ratio before stimulation (left panel), and the size of Ca2+ intracellular stocks was estimated as the Ca2+ peak amplitude obtained after ionomycin stimulation (right panel). Means +/− SEM of 3 independent experiments are presented. Kruskal–Wallis test was performed, and p-values are indicated. Three days after 4-OHT treatment, GFP- 4-OHT n = 85 or + 4-OHT n = 126, CALB1- 4-OHT n = 99 or + 4-OHT n = 77.
Ijms 23 09376 g004
Figure 5. Expression of calbindins is induced in many senescence contexts. (A) Additional contexts where CALB1 expression is upregulated in HMECT in response to senescence inducers. CALB1 mRNA level was measured by RT-qPCR in HMECT overexpressing 4-OHT-inducible ER:Ras oncogene (day 6 after 100 nM 4-OHT treatment, n = 6) or treated with H2O2 (at 250 µM for 1 h and RNA were collected six days later, n = 3), TGFβ (at 0.5 ng/mL for three days, n = 6) or KCl (at 65 mM for 24 h, n = 5). (B,C) CALB2 expression is increased in several senescence contexts. (B) CALB2 mRNA level measured in melanocytes overexpressing B-RAFV600E oncogene (transcriptome data [22]). (C) CALB2 mRNA level measured in normal human embryonic lung fibroblasts MRC5 overexpressing 4-OHT-inducible Raf:ER oncogene (RT-qPCR at day 3 after 100 nM 4-OHT treatment, n = 4), IMR90 overexpressing 4-OHT-inducible ER:Ras oncogene (transcriptome data [23]) or WI38 treated with etoposide (transcriptome data [24]). For RT-qPCR, mean +/− SEM of independent experiments are shown. Unpaired t-test (for HMECT-ER:Ras, HMEC H2O2, HMEC TGFβ, and MRC5-Raf:ER) or Mann–Whitney test (for HMECT KCl) were performed and p-values are indicated.
Ijms 23 09376 g005
Publisher’s Note: MDPI stays neutral with regard to jurisdictional claims in published maps and institutional affiliations.

