
Insights into the Cytochrome P450 Monooxygenase Superfamily in Osmanthus fragrans and the Role of OfCYP142 in Linalool Synthesis
 and
and 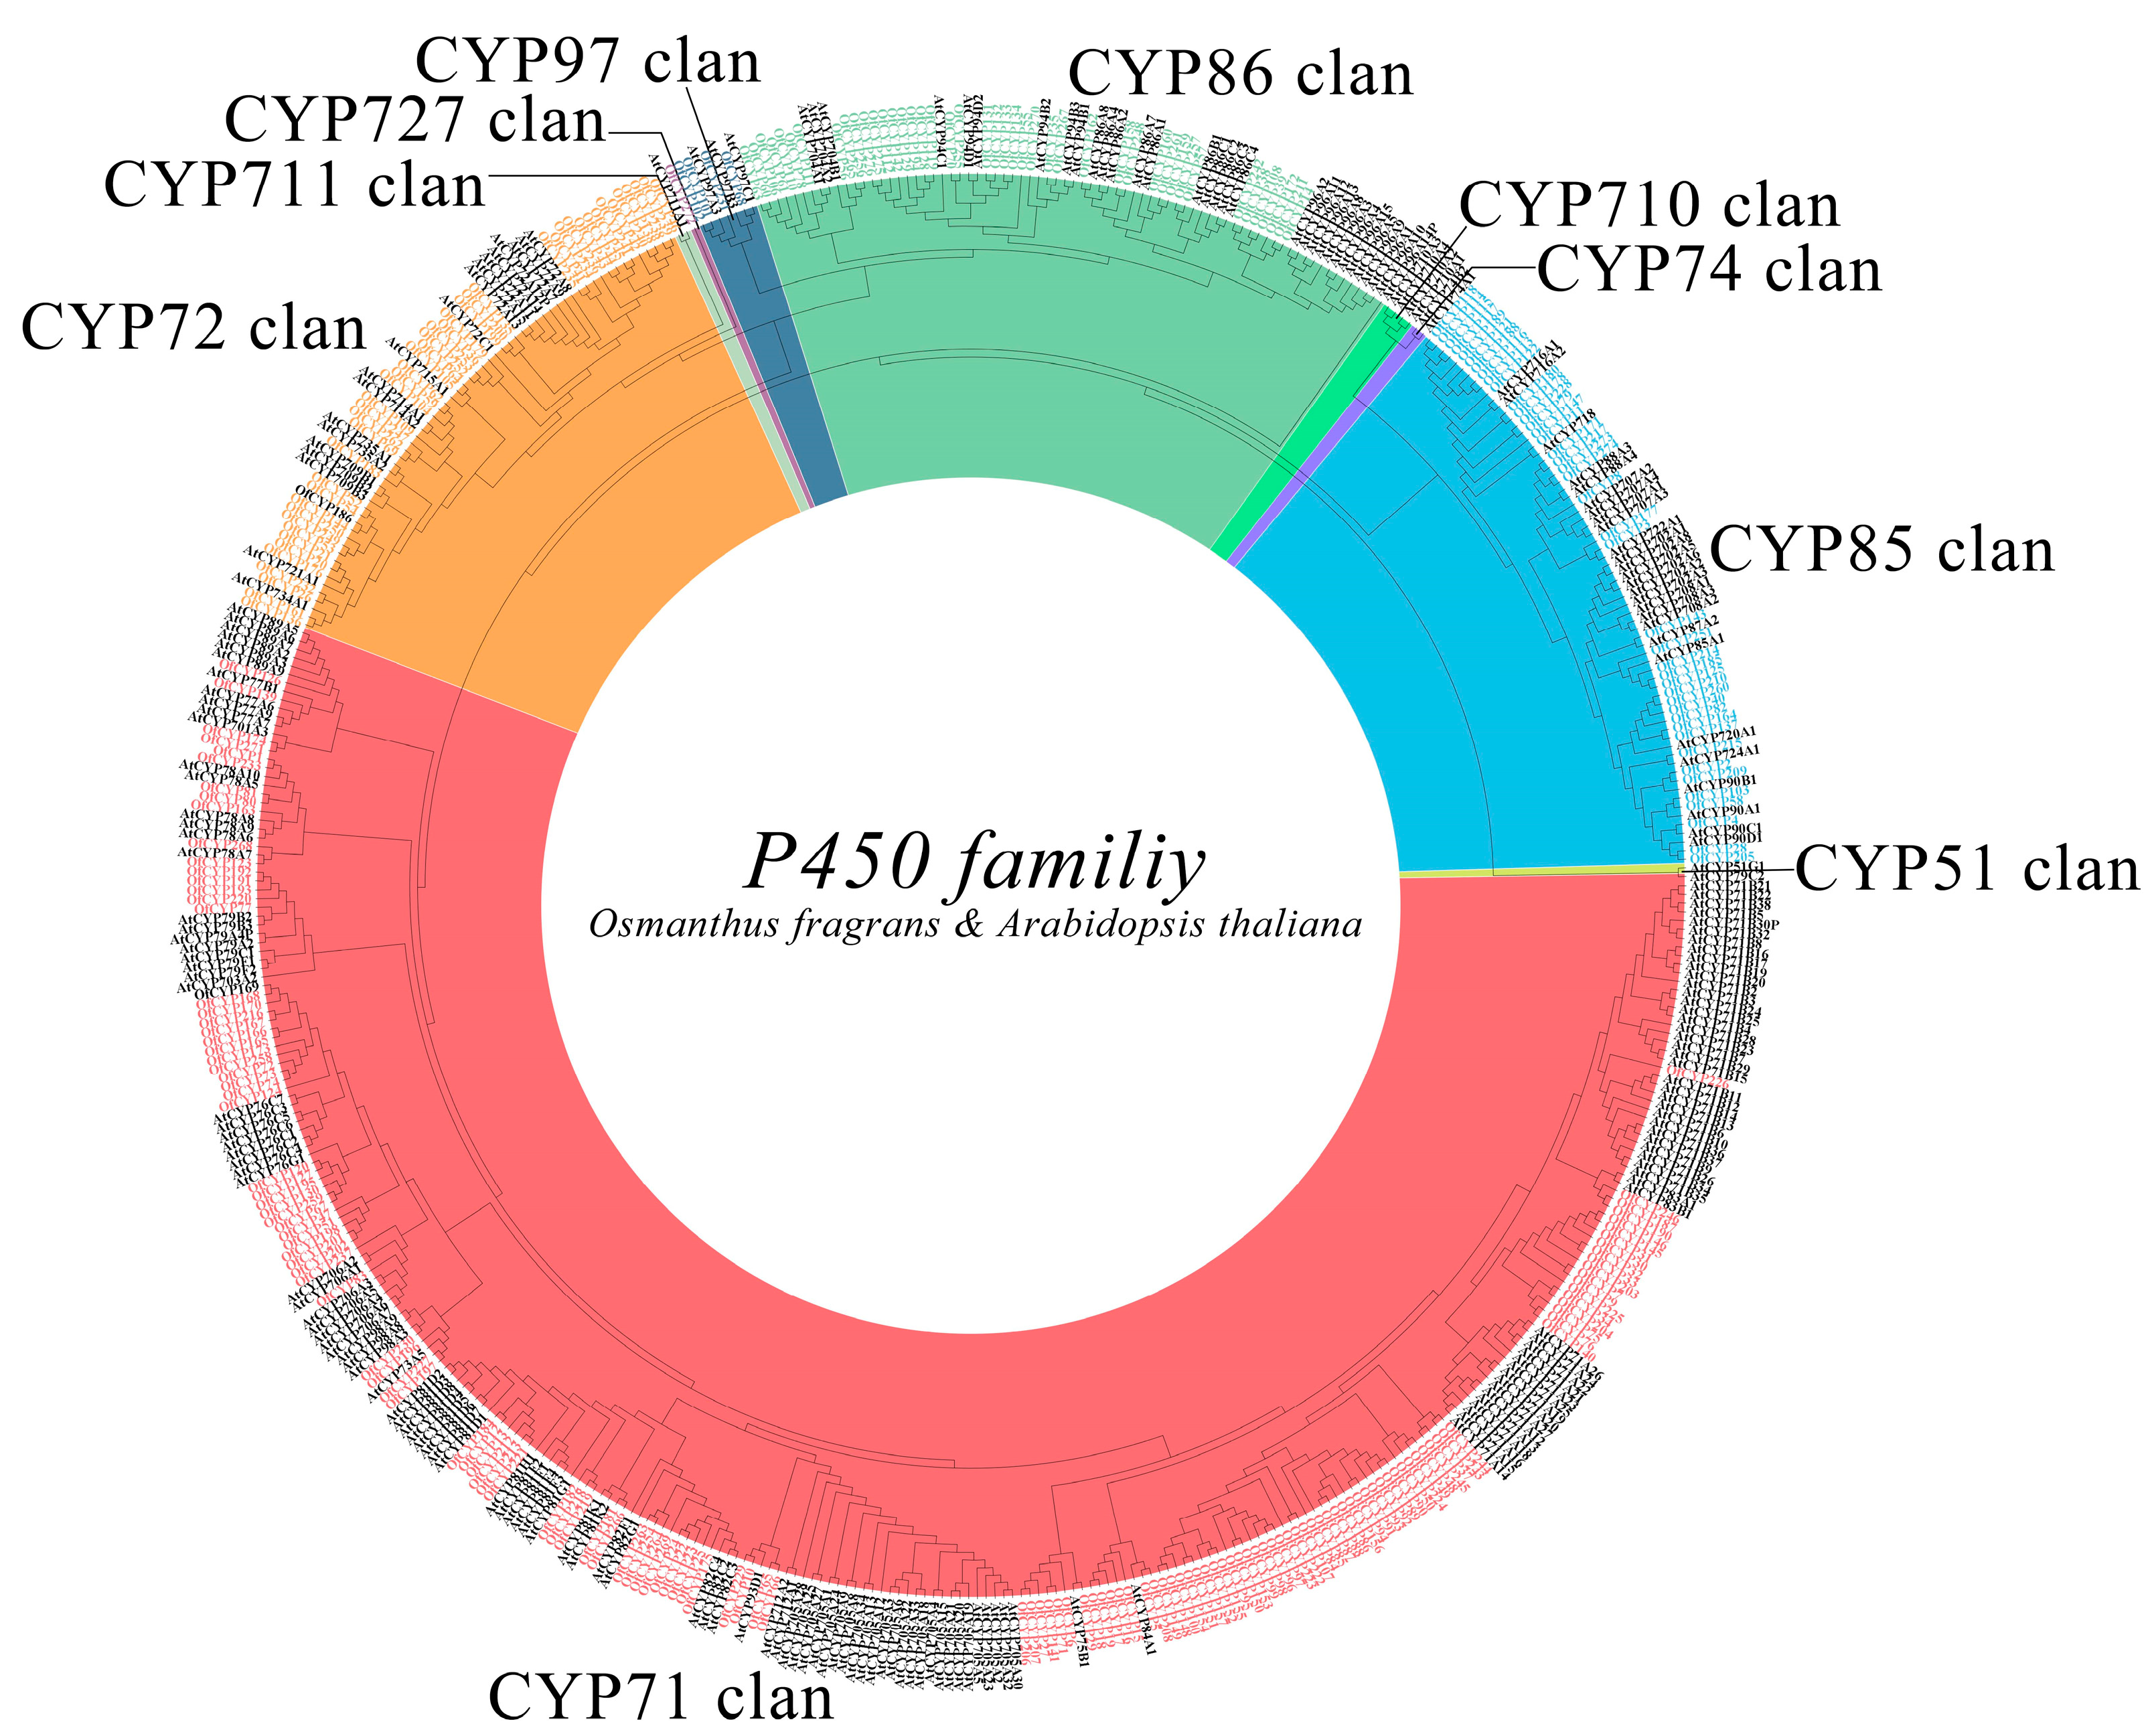
Abstract
:1. Introduction
2. Results
2.1. Identification of OfCYPs in O. fragrans
2.2. Phylogenetic Analysis of OfCYPs in O. fragrans
2.3. Gene Structure and Conserved Motif Analysis of OfCYPs
2.4. Chromosomal Distribution, Duplication Events, and Collinear Analysis of OfCYPs
2.5. Expression Patterns of OfCYPs in Different Tissues
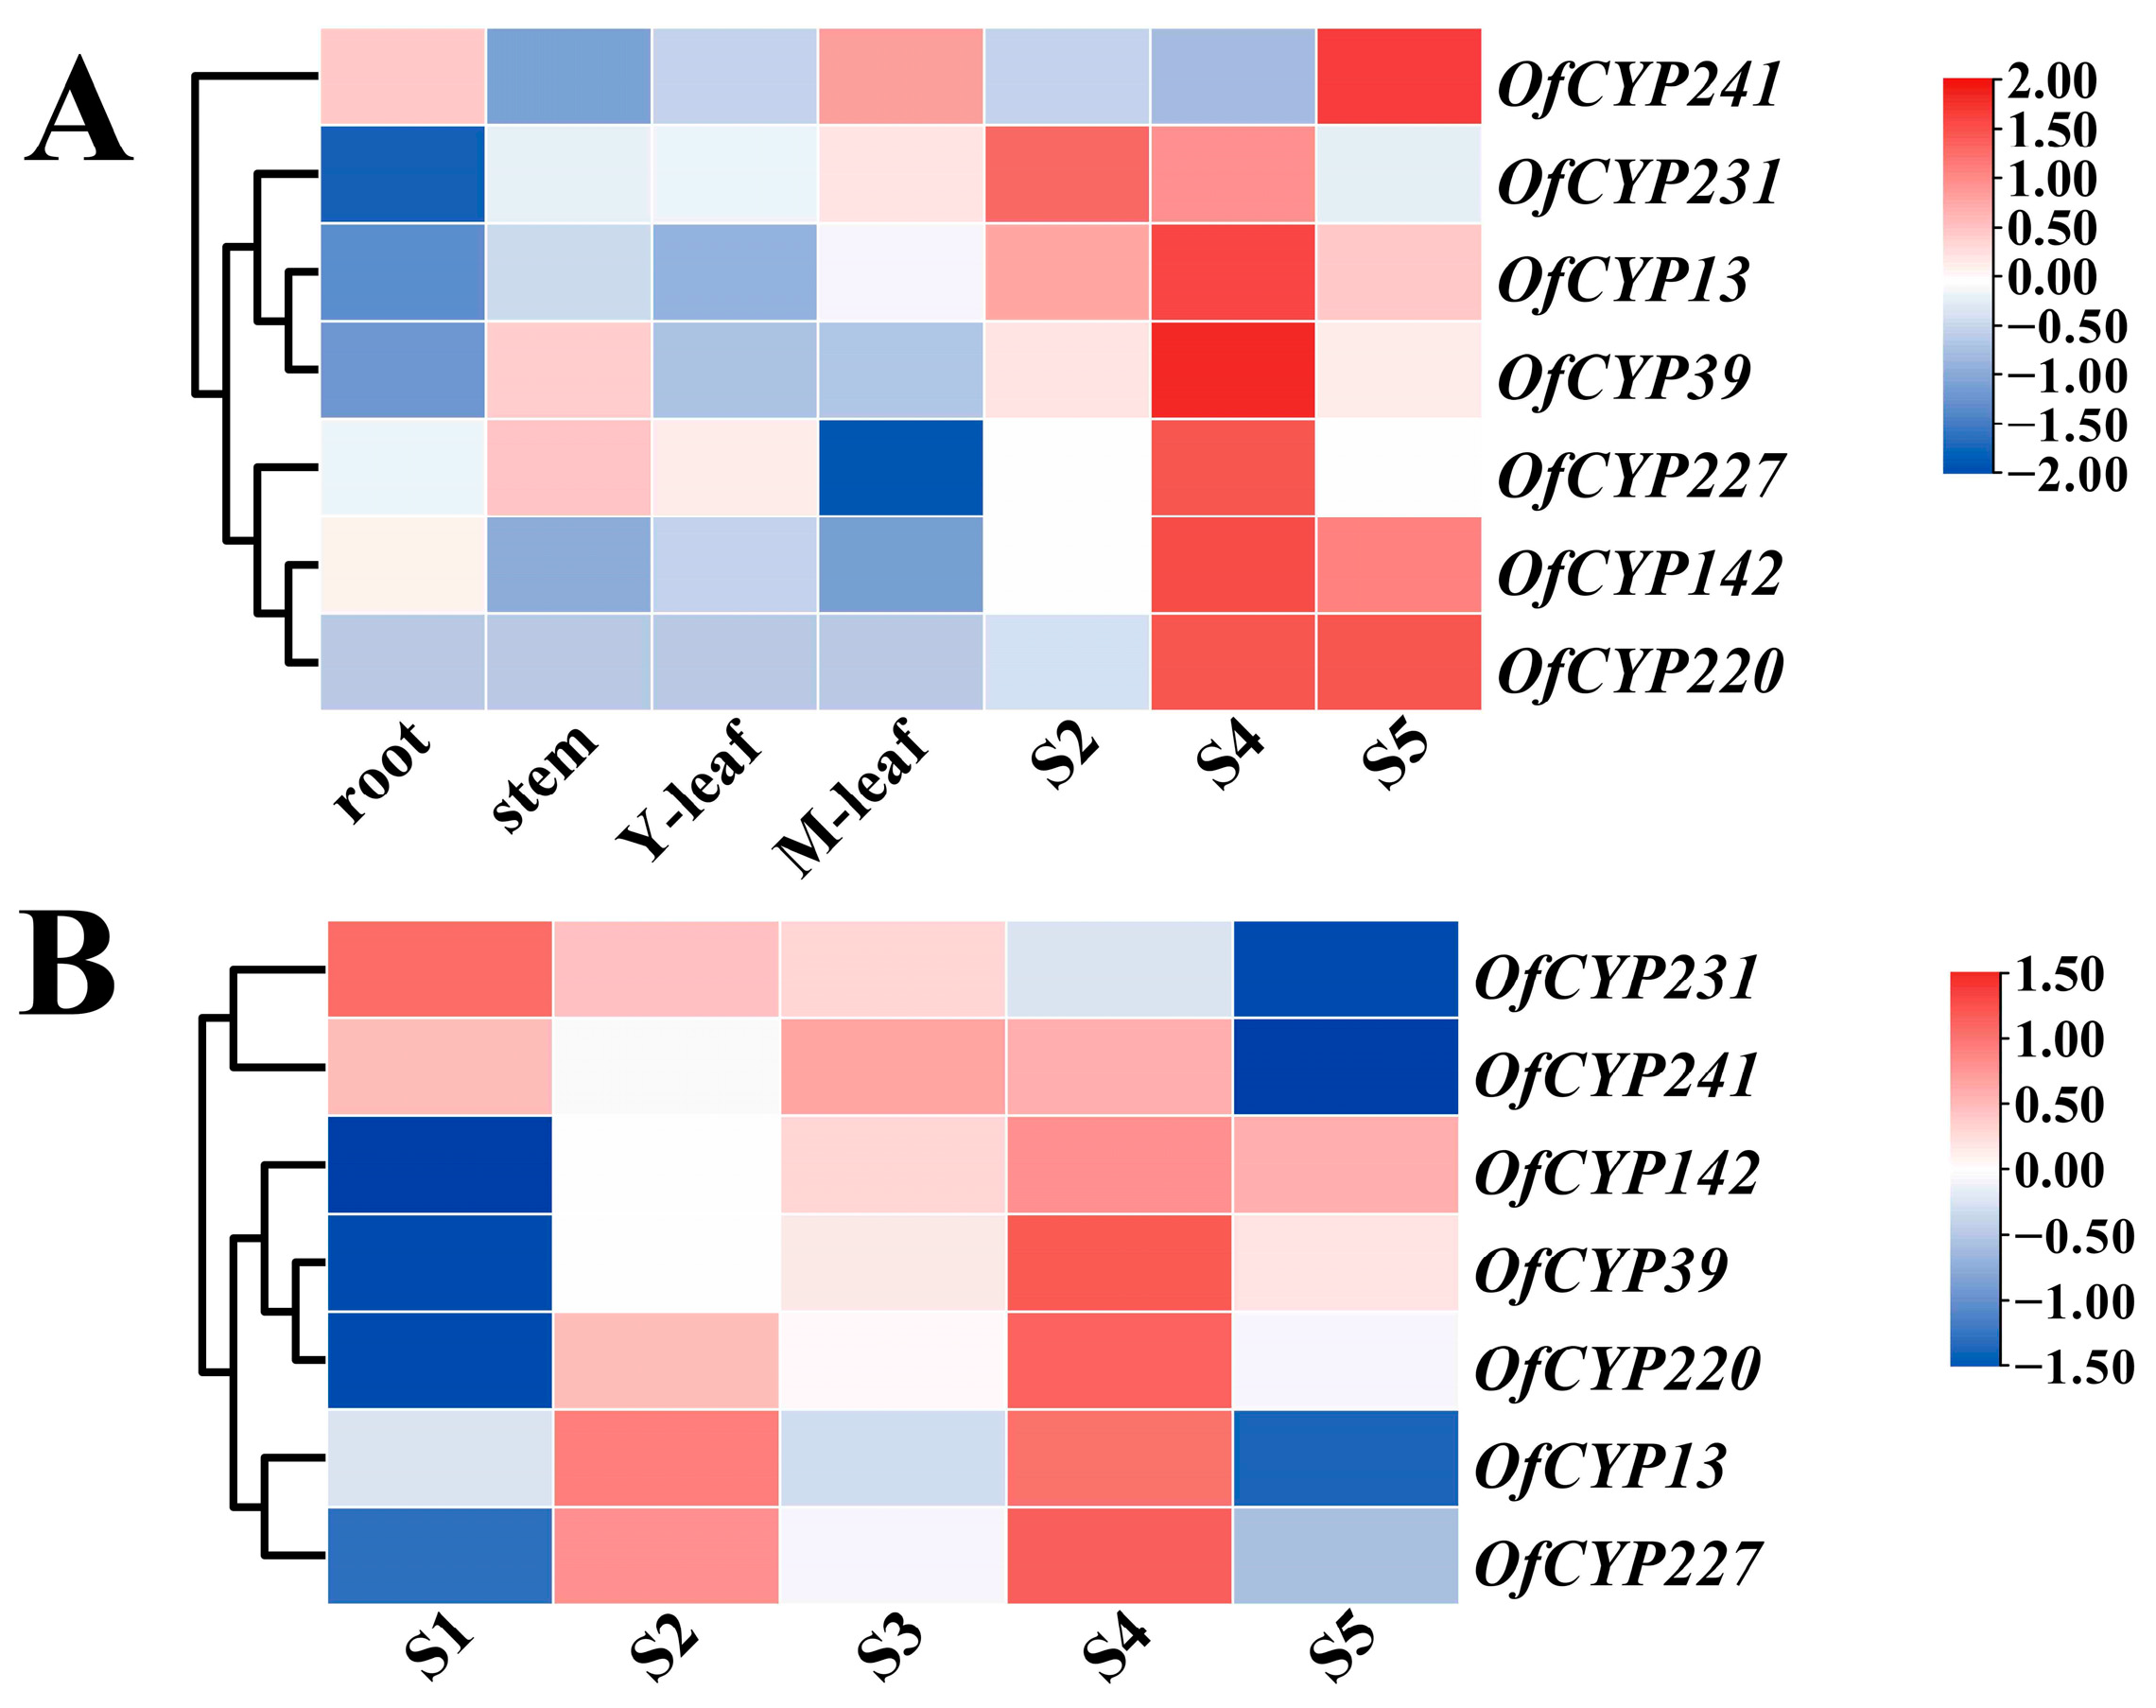
2.6. Expression Patterns Analysis of OfCYPs during Sweet Osmanthus Flower Development
2.7. Expression Patterns of OfCYPs under Abiotic Stress
2.8. Transient Expression of OfCYP142 in Flowers Altered Contents of VOCs
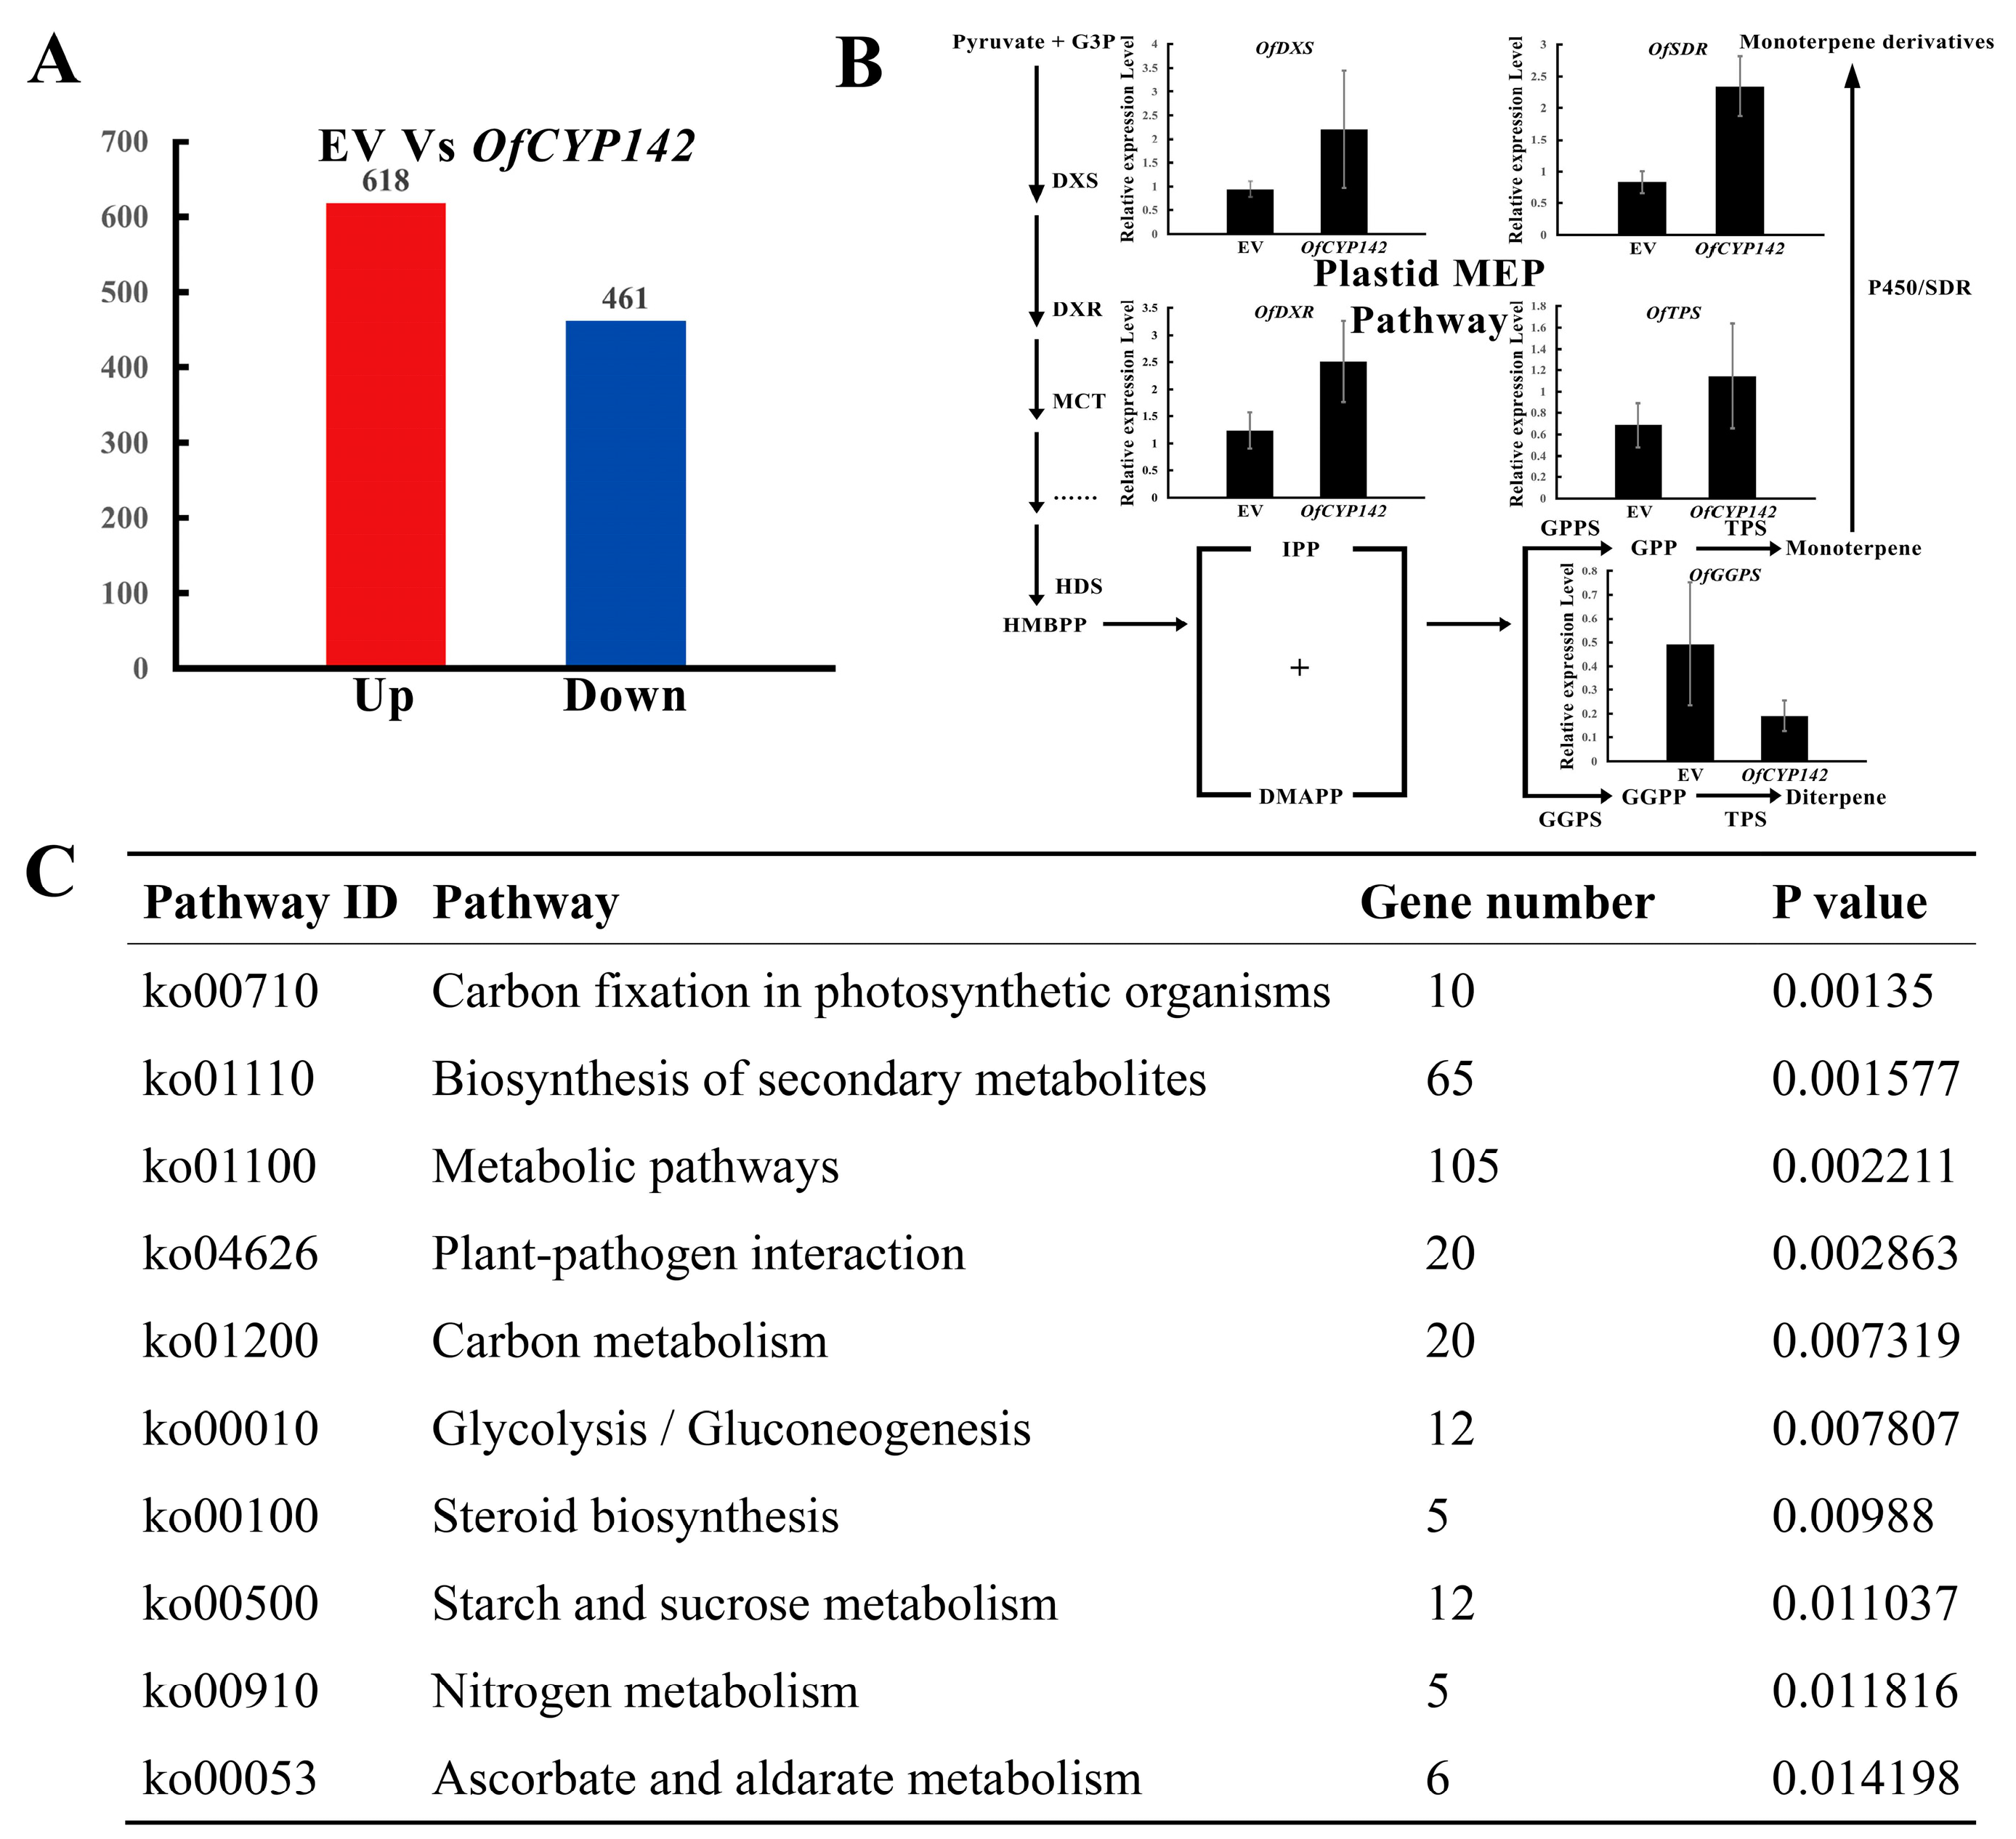
2.9. Identifying Differentially Expressed Genes (DEGs) in Plants with Transient Expression of OfCYP142
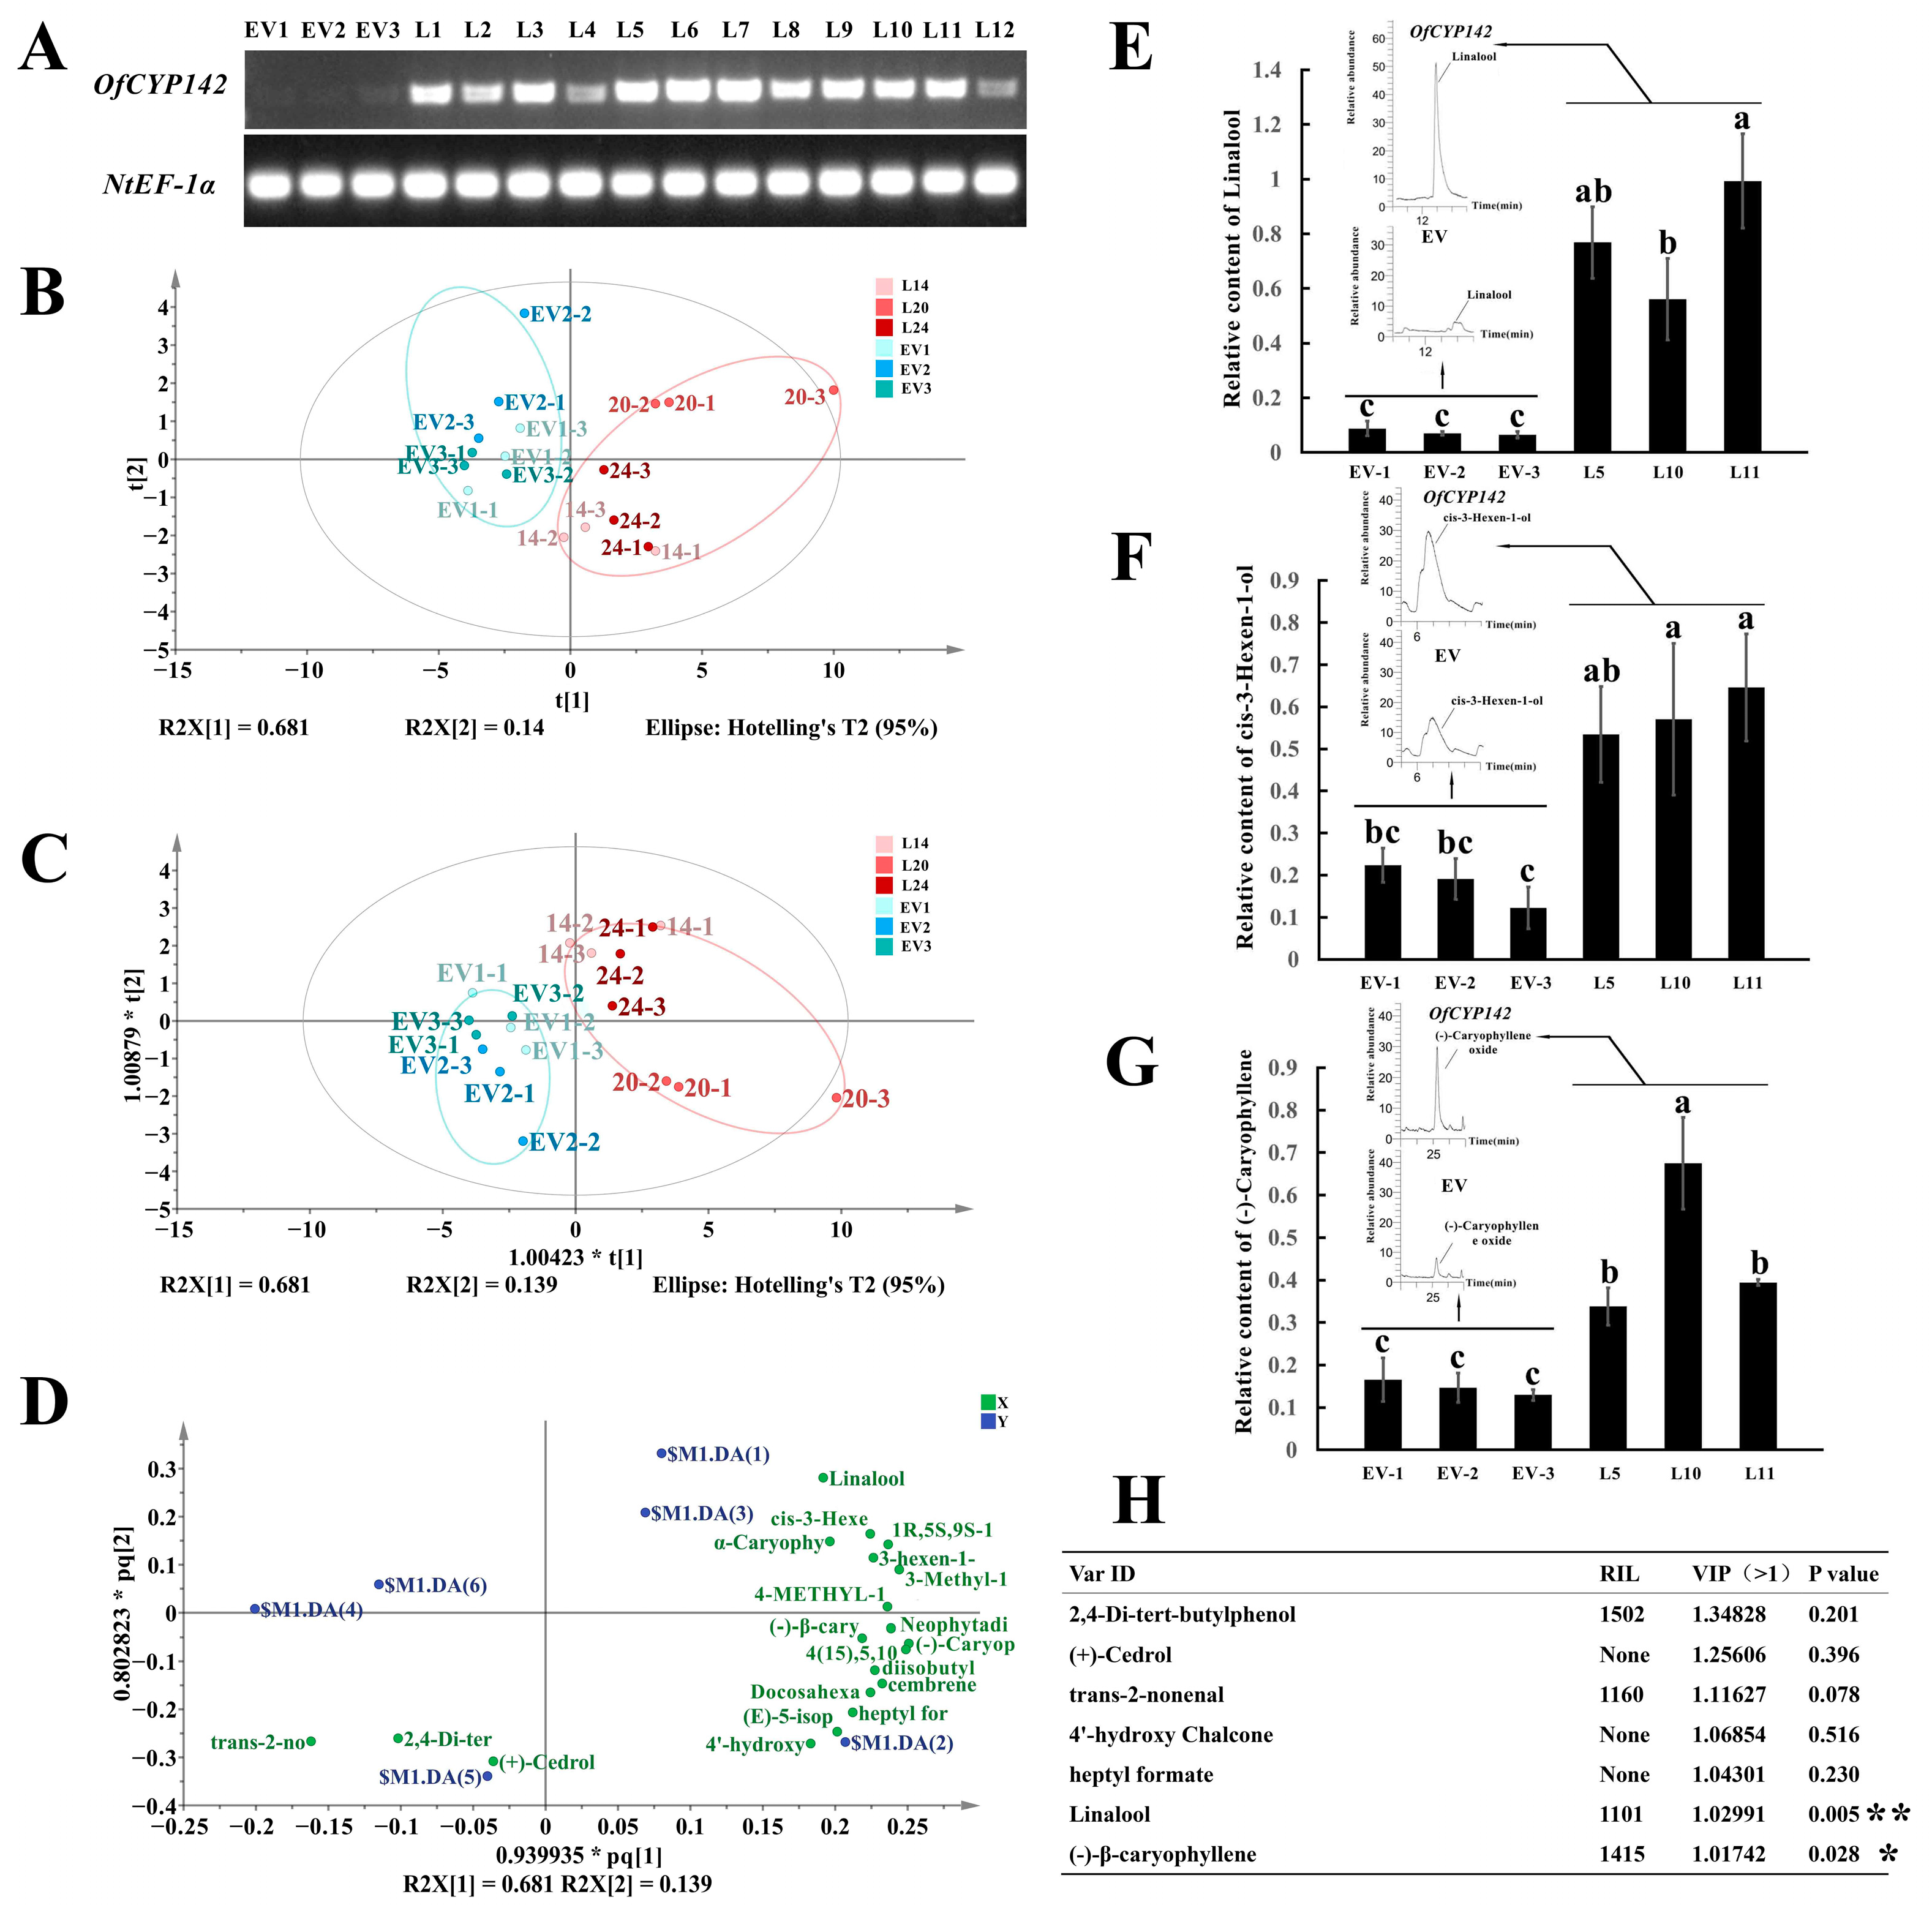
2.10. Overexpression of OfCYP142 Promoted VOC Accumulation in Transgenic Tobacco Petals
3. Discussion
4. Materials and Methods
4.1. Plant Materials
4.2. Bioinformatics Analysis of the P450 Family in O. fragrans
4.3. RNA Isolation and Quantitative Real-Time PCR (qRT-PCR) Analysis
4.4. Transient Overexpression of OfCYP142 in O. fragrans Petals
4.5. Transformation of OfCYP142 in Tobacco
4.6. Aroma Compound Analysis of Transgenic Plants
5. Conclusions
Supplementary Materials
Author Contributions
Funding
Institutional Review Board Statement
Informed Consent Statement
Data Availability Statement
Conflicts of Interest
References
- Nebert, D.W.; Nelson, D.R.; Adesnik, M.; Coon, M.J.; Estabrook, R.W.; Gonzalez, F.J.; Guengerich, F.P.; Gunsalus, I.C.; Johnson, E.F.; Kemper, B.; et al. The P450 Superfamily: Updated Listing of All Genes and Recommended Nomenclature for the Chromosomal Loci. DNA 1989, 8, 1–13. [Google Scholar] [CrossRef]
- Nelson, D.; Koymans, L.; Kamataki, T.; Stegeman, J.J.; Feyereisen, R.; Waxman, D.; Waterman, M.R.; Gotoh, O.; Coon, M.J.; Estabrook, R.W.; et al. P450 superfamily: Update on new sequences, gene mapping, accession numbers and nomenclature. Pharmacogenetics 1996, 6, 1–42. [Google Scholar] [CrossRef] [PubMed]
- Murphy, P.J.; West, C.A. The role of mixed function oxidases in kaurene metabolism in Echinocystis macrocarpa greene endosperm. Arch. Biochem. Biophys. 1969, 133, 395–407. [Google Scholar] [CrossRef]
- Lew, F.T.; West, C.A. (−)-Kaur-16-en-7β-ol-19-oic acid, an intermediate in Gibberellin biosynthesis. Phytochemistry 1971, 10, 2065–2076. [Google Scholar] [CrossRef]
- Madyastha, K.M.; Meehan, T.D.; Coscia, C.J. Characterization of a cytochrome P-450 dependent monoterpene hydroxylase from the higher plant Vinca rosea. Biochemistry 1976, 15, 1097–1102. [Google Scholar] [CrossRef]
- Hallahan, D.L.; Nugent, J.H.A.; Hallahan, B.J.; Dawson, G.W.; Smiley, D.W.; West, J.M.; Wallsgrove, R.M. Interactions of Avocado (Persea americana) Cytochrome P-450 with Monoterpenoids. Plant Physiol. 1992, 98, 1290–1297. [Google Scholar] [CrossRef] [Green Version]
- Paquette, S.M.; Bak, S.; Feyereisen, R. Intron–exon organization and phylogeny in a large superfamily, the paralogous cytochrome P450 genes of Arabidopsis thaliana. DNA Cell Biol. 2000, 19, 307–317. [Google Scholar] [CrossRef]
- Nelson, D.; Werck-Reichhart, D. A P450-centric view of plant evolution. Plant J. 2011, 66, 194–211. [Google Scholar] [CrossRef]
- Nelson, D.R.; Schuler, M.A.; Paquette, S.M.; Werck-Reichhart, D.; Bak, S. Comparative Genomics of Rice and Arabidopsis. Analysis of 727 Cytochrome P450 Genes and Pseudogenes from a Monocot and a Dicot. Plant Physiol. 2004, 135, 756–772. [Google Scholar] [CrossRef] [Green Version]
- Werck-Reichhart, D.; Feyereisen, R. Cytochromes P450: A success story. Genome Biol. 2000, 1, 1–9. [Google Scholar] [CrossRef]
- Cai, X.; Mai, R.-Z.; Zou, J.-J.; Zhang, H.-Y.; Zeng, X.-L.; Zheng, R.-R.; Wang, C.-Y. Analysis of aroma-active compounds in three sweet osmanthus (Osmanthus fragrans) cultivars by GC-olfactometry and GC-MS. J. Zhejiang Univ. Sci. B 2014, 15, 638–648. [Google Scholar] [CrossRef] [Green Version]
- Shi, T.; Yang, X.; Wang, L. Study on the aroma component emission pattern of Osmanthus fragrans ‘Boye Jingui’. J. Nanjing For. Univ. 2018, 42, 97–104. [Google Scholar]
- Dunlevy, J.D.; Kalua, C.M.; Keyzers, R.A.; Boss, P.K. The production of flavour & aroma compounds in grape berries. In Grapevine Molecular Physiology & Biotechnology; Springer: Dordrecht, The Netherlands, 2009; pp. 293–340. [Google Scholar] [CrossRef]
- Qiao, Z.; Hu, H.; Shi, S.; Yuan, X.; Yan, B.; Chen, L. An Update on the Function, Biosynthesis and Regulation of Floral Volatile Terpenoids. Horticulturae 2021, 7, 451. [Google Scholar] [CrossRef]
- Tholl, D.; Lee, S. Terpene specialized metabolism in Arabidopsis thaliana. Arab. Book/Am. Soc. Plant Biol. 2011, 9, e0143. [Google Scholar]
- Ginglinger, J.-F.; Boachon, B.; Höfer, R.; Paetz, C.; Köllner, T.G.; Miesch, L.; Lugan, R.; Baltenweck, R.; Mutterer, J.; Ullmann, P.; et al. Gene Coexpression Analysis Reveals Complex Metabolism of the Monoterpene Alcohol Linalool in Arabidopsis Flowers. Plant Cell 2013, 25, 4640–4657. [Google Scholar] [CrossRef] [PubMed] [Green Version]
- Boachon, B.; Junker, R.R.; Miesch, L.; Bassard, J.-E.; Höfer, R.; Caillieaudeaux, R.; Seidel, D.E.; Lesot, A.; Heinrich, C.; Ginglinger, J.-F.; et al. CYP76C1 (Cytochrome P450)-Mediated Linalool Metabolism and the Formation of Volatile and Soluble Linalool Oxides in Arabidopsis Flowers: A Strategy for Defense against Floral Antagonists. Plant Cell 2015, 27, 2972–2990. [Google Scholar] [CrossRef] [Green Version]
- Höfer, R.; Boachon, B.; Renault, H.; Gavira, C.; Miesch, L.; Iglesias, J.; Ginglinger, J.-F.; Allouche, L.; Miesch, M.; Grec, S.; et al. Dual Function of the Cytochrome P450 CYP76 Family from Arabidopsis thaliana in the Metabolism of Monoterpenols and Phenylurea Herbicides. Plant Physiol. 2014, 166, 1149–1161. [Google Scholar] [CrossRef] [PubMed] [Green Version]
- Junker, R.R.; Gershenzon, J.; Unsicker, S.B. Floral Odor Bouquet Loses its Ant Repellent Properties After Inhibition of Terpene Biosynthesis. J. Chem. Ecol. 2011, 37, 1323–1331. [Google Scholar] [CrossRef]
- McCallum, E.J.; Cunningham, J.P.; Lücker, J.; Zalucki, M.P.; De Voss, J.J.; Botella, J.R. Increased plant volatile production affects oviposition, but not larval development, in the moth Helicoverpa armigera. J. Exp. Biol. 2011, 214, 3672–3677. [Google Scholar] [CrossRef] [PubMed] [Green Version]
- Kurotani, K.-I.; Hayashi, K.; Hatanaka, S.; Toda, Y.; Ogawa, D.; Ichikawa, H.; Ishimaru, Y.; Tashita, R.; Suzuki, T.; Ueda, M.; et al. Elevated Levels of CYP94 Family Gene Expression Alleviate the Jasmonate Response and Enhance Salt Tolerance in Rice. Plant Cell Physiol. 2015, 56, 779–789. [Google Scholar] [CrossRef] [Green Version]
- Mao, G.; Seebeck, T.; Schrenker, D.; Yu, O. CYP709B3, a cytochrome P450 monooxygenase gene involved in salt tolerance in Arabidopsis thaliana. BMC Plant Biol. 2013, 13, 169. [Google Scholar] [CrossRef] [PubMed]
- Mikkelsen, M.D.; Hansen, C.H.; Wittstock, U.; Halkier, B.A. Cytochrome P450 CYP79B2 from Arabidopsis Catalyzes the Conversion of Tryptophan to Indole-3-acetaldoxime, a Precursor of Indole Glucosinolates and Indole-3-acetic Acid. J. Biol. Chem. 2000, 275, 33712–33717. [Google Scholar] [CrossRef] [Green Version]
- Wang, M.Y.; Liu, X.T.; Chen, Y.; Xu, X.J.; Yu, B.; Zhang, S.Q.; Li, Q.; He, Z.H. Arabidopsis Acetyl-Amido Synthetase GH3. 5 Involvement in Camalexin Biosynthesis through Conjugation of Indole-3-Carboxylic Acid and Cysteine and Upregulation of Camalexin Biosynthesis Genes F. J. Integr. Plant Biol. 2012, 54, 471–485. [Google Scholar] [CrossRef]
- Nafisi, M.; Goregaoker, S.; Botanga, C.J.; Glawischnig, E.; Olsen, C.E.; Halkier, B.A.; Glazebrook, J. Arabidopsis Cytochrome P450 Monooxygenase 71A13 Catalyzes the Conversion of Indole-3-Acetaldoxime in Camalexin Synthesis. Plant Cell 2007, 19, 2039–2052. [Google Scholar] [CrossRef] [PubMed] [Green Version]
- Böttcher, C.; Westphal, L.; Schmotz, C.; Prade, E.; Scheel, D.; Glawischnig, E. The Multifunctional Enzyme CYP71B15 (PHYTOALEXIN DEFICIENT3) Converts Cysteine-Indole-3-Acetonitrile to Camalexin in the Indole-3-Acetonitrile Metabolic Network of Arabidopsis thaliana. Plant Cell 2009, 21, 1830–1845. [Google Scholar] [CrossRef] [Green Version]
- Lee, S.; Badieyan, S.; Bevan, D.R.; Herde, M.; Gatz, C.; Tholl, D. Herbivore-induced and floral homoterpene volatiles are biosynthesized by a single P450 enzyme (CYP82G1) in Arabidopsis. Proc. Natl. Acad. Sci. USA 2010, 107, 21205–21210. [Google Scholar] [CrossRef] [Green Version]
- Yang, X.; Ding, W.; Yue, Y.; Xu, C.; Wang, X.; Wang, L. Cloning and expression analysis of three critical triterpenoid pathway genes in Osmanthus fragrans. Electron. J. Biotechnol. 2018, 36, 1–8. [Google Scholar] [CrossRef]
- Yang, X.-L.; Li, H.-Y.; Yue, Y.-Z.; Ding, W.-J.; Xu, C.; Shi, T.-T.; Chen, G.-W.; Wang, L.-G. Transcriptomic Analysis of the Candidate Genes Related to Aroma Formation in Osmanthus fragrans. Molecules 2018, 23, 1604. [Google Scholar] [CrossRef] [Green Version]
- An, Q.; Ren, J.-N.; Li, X.; Fan, G.; Qu, S.-S.; Song, Y.; Li, Y.; Pan, S.-Y. Recent updates on bioactive properties of linalool. Food Funct. 2021, 12, 10370–10389. [Google Scholar] [CrossRef]
- Shi, T.; Yang, X.; Zhao, L.; Wang, L. Influence of storage method on the fragrant components of essential oils of Osmanthus fragrans. J. Nanjing For. Univ. 2014, 38, 105–110. [Google Scholar]
- Yang, X.; Yue, Y.; Li, H.; Ding, W.; Chen, G.; Shi, T.; Chen, J.; Park, M.S.; Chen, F.; Wang, L. The chromosome-level quality genome provides insights into the evolution of the biosynthesis genes for aroma compounds of Osmanthus fragrans. Hortic. Res. 2018, 5, 72. [Google Scholar] [CrossRef] [Green Version]
- Nelson, D.R.; Ming, R.; Alam, M.; Schuler, M.A. Comparison of Cytochrome P450 Genes from Six Plant Genomes. Trop. Plant Biol. 2008, 1, 216–235. [Google Scholar] [CrossRef]
- Irmisch, S.; Clavijo McCormick, A.; Boeckler, G.A.; Schmidt, A.; Reichelt, M.; Schneider, B.; Block, K.; Schnitzler, J.-P.; Gershenzon, J.; Unsicker, S.B.; et al. Two Herbivore-Induced Cytochrome P450 Enzymes CYP79D6 and CYP79D7 Catalyze the Formation of Volatile Aldoximes Involved in Poplar Defense. Plant Cell 2013, 25, 4737–4754. [Google Scholar] [CrossRef] [PubMed] [Green Version]
- Unsicker, S.B.; Gershenzon, J.; Köllner, T.G. Beetle feeding induces a different volatile emission pattern from black poplar foliage than caterpillar herbivory. Plant Signal. Behav. 2015, 10, e987522. [Google Scholar] [CrossRef] [PubMed] [Green Version]
- Dhandapani, S.; Jin, J.; Sridhar, V.; Chua, N.-H.; Jang, I.-C. CYP79D73 Participates in Biosynthesis of Floral Scent Compound 2-Phenylethanol in Plumeria rubra. Plant Physiol. 2019, 180, 171–184. [Google Scholar] [CrossRef]
- Zhang, S.; Wu, Q.-R.; Zhang, H.-M.; Pei, Z.-M.; Gao, J.-W. Genome-wide identification and transcriptomic data exploring of the cytochrome P450 family in Chinese cabbage (Brassica rapa L. ssp. pekinensis). J. Plant Interact. 2021, 16, 136–155. [Google Scholar] [CrossRef]
- Lynch, M.; Conery, J.S. The Evolutionary Fate and Consequences of Duplicate Genes. Science 2000, 290, 1151–1155. [Google Scholar] [CrossRef] [Green Version]
- Li, L.; Cheng, H.; Gai, J.; Yu, D. Genome-wide identification and characterization of putative cytochrome P450 genes in the model legume Medicago truncatula. Planta 2007, 226, 109–123. [Google Scholar] [CrossRef]
- Sun, W.; Ma, Z.; Liu, M. Cytochrome P450 family: Genome-wide identification provides insights into the rutin synthesis pathway in Tartary buckwheat and the improvement of agricultural product quality. Int. J. Biol. Macromol. 2020, 164, 4032–4045. [Google Scholar] [CrossRef]
- Schilmiller, A.L.; Stout, J.; Weng, J.K.; Humphreys, J.; Ruegger, M.O.; Chapple, C. Mutations in the cinnamate 4-hydroxylase gene impact metabolism, growth and development in Arabidopsis. Plant J. 2009, 60, 771–782. [Google Scholar] [CrossRef]
- Jiang, Y.; Yang, B.; Deyholos, M.K. Functional characterization of the Arabidopsis bHLH92 transcription factor in abiotic stress. Mol. Genet. Genom. 2009, 282, 503–516. [Google Scholar] [CrossRef] [PubMed]
- Yazaki, K.; Arimura, G.-i.; Ohnishi, T. ‘Hidden’ terpenoids in plants: Their biosynthesis, localization and ecological roles. Plant Cell Physiol. 2017, 58, 1615–1621. [Google Scholar] [CrossRef]
- Zeng, X.; Liu, C.; Zheng, R.; Cai, X.; Luo, J.; Zou, J.; Wang, C. Emission and Accumulation of Monoterpene and the Key Terpene Synthase (TPS) Associated with Monoterpene Biosynthesis in Osmanthus fragrans Lour. Front. Plant Sci. 2016, 6. [Google Scholar] [CrossRef] [Green Version]
- Raguso, R.A.; Pichersky, E. A day in the life of a linalool molecule: Chemical communication in a plant-pollinator system. Part 1: Linalool biosynthesis in flowering plants. Plant Species Biol. 1999, 14, 95–120. [Google Scholar] [CrossRef] [Green Version]
- Wang, W.; Feng, J.; Wei, L.; Khalil-Ur-Rehman, M.; Nieuwenhuizen, N.J.; Yang, L.; Zheng, H.; Tao, J. Transcriptomics integrated with free and bound terpenoid aroma profiling during “shine muscat” (Vitis labrusca × V. vinifera) grape berry development reveals coordinate regulation of MEP pathway and terpene synthase gene expression. J. Agric. Food Chem. 2021, 69, 1413–1429. [Google Scholar] [CrossRef]
- Cordoba, E.; Salmi, M.; León, P. Unravelling the regulatory mechanisms that modulate the MEP pathway in higher plants. J. Exp. Bot. 2009, 60, 2933–2943. [Google Scholar] [CrossRef] [PubMed] [Green Version]
- Rétiveau, A.N.; Iv, E.C.; Milliken, G.A. Common and Specific Effects of Fine Fragrances on the Mood of Women. J. Sens. Stud. 2004, 19, 373–394. [Google Scholar] [CrossRef]
- Y Lillo, M.P.; Latrille, E.; Casaubon, G.; Agosin, E.; Bordeu, E.; Martin, N. Comparison between odour and aroma profiles of Chilean Pisco spirit. Food Qual. Prefer. 2005, 16, 59–70. [Google Scholar] [CrossRef]
- Mostafa, S.; Wang, Y.; Zeng, W.; Jin, B. Floral Scents and Fruit Aromas: Functions, Compositions, Biosynthesis, and Regulation. Front. Plant Sci. 2022, 13, 860157. [Google Scholar] [CrossRef]
- Gyrdymova, Y.V.; Rubtsova, S.A. Caryophyllene and caryophyllene oxide: A variety of chemical transformations and biological activities. Chem. Pap. 2021, 76, 1–39. [Google Scholar] [CrossRef]
- Weitzel, C.; Simonsen, H.T. Cytochrome P450-enzymes involved in the biosynthesis of mono- and sesquiterpenes. Phytochem. Rev. 2013, 14, 7–24. [Google Scholar] [CrossRef]
- Chen, C.; Chen, H.; Zhang, Y.; Thomas, H.R.; Frank, M.H.; He, Y.; Xia, R. TBtools: An Integrative Toolkit Developed for Interactive Analyses of Big Biological Data. Mol. Plant 2020, 13, 1194–1202. [Google Scholar] [CrossRef]
- Bailey, T.L.; Boden, M.; Buske, F.A.; Frith, M.; Grant, C.E.; Clementi, L.; Ren, J.; Li, W.W.; Noble, W.S. MEME SUITE: Tools for motif discovery and searching. Nucleic Acids Res. 2009, 37 (Suppl. 2), w202–w208. [Google Scholar] [CrossRef] [PubMed]
- Wang, Y.; Tang, H.; DeBarry, J.D.; Tan, X.; Li, J.; Wang, X.; Lee, T.-H.; Jin, H.; Marler, B.; Guo, H.; et al. MCScanX: A toolkit for detection and evolutionary analysis of gene synteny and collinearity. Nucleic Acids Res. 2012, 40, e49. [Google Scholar] [CrossRef] [PubMed] [Green Version]
- Han, Y.; Wu, M.; Cao, L.; Yuan, W.; Dong, M.; Wang, X.; Chen, W.; Shang, F. Characterization of OfWRKY3, a transcription factor that positively regulates the carotenoid cleavage dioxygenase gene OfCCD4 in Osmanthus fragrans. Plant Mol. Biol. 2016, 91, 485–496. [Google Scholar] [CrossRef]
- Renckens, S.; De Greve, H.; Van Montagu, M.; Hernalsteens, J.-P. Petunia plants escape from negative selection against a transgene by silencing the foreign DNA via methylation. Mol. Gen. Genet. MGG 1992, 233, 53–64. [Google Scholar] [CrossRef] [PubMed]
- Ji, X. Comparative investigation of volatile components and bioactive compounds in beers by multivariate analysis. Flavour Fragr. J. 2021, 36, 374–383. [Google Scholar] [CrossRef]
- Ma, B.; Luo, Y.; Jia, L.; Qi, X.; Zeng, Q.; Xiang, Z.; He, N. Genome-wide identification and expression analyses of cytochrome P450 genes in mulberry (Morus notabilis). J. Integr. Plant Biol. 2014, 56, 887–901. [Google Scholar] [CrossRef] [PubMed]
- Wei, K.; Chen, H. Global identification, structural analysis and expression characterization of cytochrome P450 monooxygenase superfamily in rice. BMC Genom. 2018, 19, 35. [Google Scholar] [CrossRef] [Green Version]
- Jiu, S.; Xu, Y.; Wang, J.; Wang, L.; Liu, X.; Sun, W.; Sabir, I.A.; Ma, C.; Xu, W.; Wang, S. The cytochrome P450 monooxygenase inventory of grapevine (Vitis vinifera L.): Genome-wide identification, evolutionary characterization and expression analysis. Front. Genet. 2020, 11, 44. [Google Scholar] [CrossRef] [Green Version]
- Ji, J.; Cao, W.; Yang, L.; Fang, Z.; Zhang, Y.; Zhuang, M.; Lv, H.; Wang, Y.; Liu, Y.; Li, Z. Genome-wide analysis of cabbage cytochrome P450 genes and characterization of BoCYP704B1, a gene responsible for cabbage anther development. Sci. Hortic. 2021, 283, 110096. [Google Scholar] [CrossRef]
- Suntichaikamolkul, N.; Sangpong, L.; Schaller, H.; Sirikantaramas, S. Genome-wide identification and expression profiling of durian CYPome related to fruit ripening. PLoS ONE 2021, 16, e0260665. [Google Scholar] [CrossRef]
- Li, P.; Wang, Y.; Chi, C.; Ding, G. Genome-wide identification and expression analysis of CYP450 gene family in Cucumis sativus L. 2021. Available online: https://europepmc.org/article/ppr/ppr437205 (accessed on 15 August 2020).
- Vasav, A.; Barvkar, V. Phylogenomic analysis of cytochrome P450 multigene family and their differential expression analysis in Solanum lycopersicum L. suggested tissue specific promoters. BMC Genom. 2019, 20, 116. [Google Scholar] [CrossRef] [PubMed] [Green Version]
- Yang, J.; Wang, G.; Ke, H.; Zhang, Y.; Ji, L.; Huang, L.; Zhang, C.; Wang, X.; Ma, Z. Genome-wide identification of cyclophilin genes in Gossypium hirsutum and functional characterization of a CYP with antifungal activity against Verticillium dahliae. BMC Plant Biol. 2019, 19, 272. [Google Scholar] [CrossRef] [PubMed]


Publisher’s Note: MDPI stays neutral with regard to jurisdictional claims in published maps and institutional affiliations. |
© 2022 by the authors. Licensee MDPI, Basel, Switzerland. This article is an open access article distributed under the terms and conditions of the Creative Commons Attribution (CC BY) license (https://creativecommons.org/licenses/by/4.0/).
Share and Cite
Liu, J.; Hu, H.; Shen, H.; Tian, Q.; Ding, W.; Yang, X.; Wang, L.; Yue, Y. Insights into the Cytochrome P450 Monooxygenase Superfamily in Osmanthus fragrans and the Role of OfCYP142 in Linalool Synthesis. Int. J. Mol. Sci. 2022, 23, 12150. https://0-doi-org.brum.beds.ac.uk/10.3390/ijms232012150
Liu J, Hu H, Shen H, Tian Q, Ding W, Yang X, Wang L, Yue Y. Insights into the Cytochrome P450 Monooxygenase Superfamily in Osmanthus fragrans and the Role of OfCYP142 in Linalool Synthesis. International Journal of Molecular Sciences. 2022; 23(20):12150. https://0-doi-org.brum.beds.ac.uk/10.3390/ijms232012150
Chicago/Turabian StyleLiu, Jiawei, Hongmin Hu, Huimin Shen, Qingyin Tian, Wenjie Ding, Xiulian Yang, Lianggui Wang, and Yuanzheng Yue. 2022. "Insights into the Cytochrome P450 Monooxygenase Superfamily in Osmanthus fragrans and the Role of OfCYP142 in Linalool Synthesis" International Journal of Molecular Sciences 23, no. 20: 12150. https://0-doi-org.brum.beds.ac.uk/10.3390/ijms232012150