
Nr1d1 Mediated Cell Senescence in Mouse Heart-Derived Sca-1+CD31− Cells
by
 ,
,
Shiming Pu
1,2,3,4,†,
Qian Wang
1,4,†,
Qin Liu
1,4,
Hongxia Zhao
1,2,4,5,
Zuping Zhou
1,2,3,4,* and
Qiong Wu
1,2,3,4,* 1
Guangxi Universities Key Laboratory of Stem Cell and Biopharmaceutical Technology, Guangxi Normal University, Guilin 541004, China
2
Research Center for Biomedical Sciences, Guangxi Normal University, Guilin 541004, China
3
Key Laboratory of Ecology of Rare and Endangered Species and Environmental Protection, Guangxi Normal University, Ministry of Education, Guilin 541004, China
4
School of Life Sciences, Guangxi Normal University, Guilin 541004, China
5
Faculty of Biological and Environmental Sciences, University of Helsinki, 00790 Helsinki, Finland
*
Authors to whom correspondence should be addressed.
†
These authors contributed equally to this work.
Int. J. Mol. Sci. 2022, 23(20), 12455; https://0-doi-org.brum.beds.ac.uk/10.3390/ijms232012455
Submission received: 27 August 2022
/
Revised: 14 October 2022
/
Accepted: 14 October 2022
/
Published: 18 October 2022
(This article belongs to the Special Issue Molecular Research on Heart Protection)
Abstract
:Aim: Sca-1+CD31− cells are resident cardiac progenitor cells, found in many mammalian tissues including the heart, and able to differentiate into cardiomyocytes in vitro and in vivo. Our previous work indicated that heart-derived Sca-1+CD31− cells increased the Nr1d1 mRNA level of Nr1d1 with aging. However, how Nr1d1 affects the senescence of Sca-1+CD31− cells. Methods: Overexpression and knockdown of Nr1d1 in Sca-1+CD31− cells and mouse cardiac myocyte (MCM) cell lines were performed by lentiviral transduction. The effects of Nr1d1 abundance on cell differentiation, proliferation, apoptosis, cell cycle, and transcriptomics were evaluated. Moreover, binding of Nr1d1 to the promoter region of Nr4a3 and Serpina3 was examined by a luciferase reporter assay. Results and Conclusions: Upregulation Nr1d1 in young Sca-1+CD31− cells inhibited cell proliferation and promoted apoptosis. However, depletion of Nr1d1 in aged Sca-1+CD31− cells promoted cell proliferation and inhibited apoptosis. Furthermore, Nr1d1 was negatively associated with cell proliferation, promoting apoptosis and senescence-associated beta-galactosidase production in MCMs. Our findings show that Nr1d1 stimulates Serpina3 expression through its interaction with Nr4a3. Nr1d1 may therefore act as a potent anti-aging receptor that can be a therapeutic target for aging-related diseases.
1. Introduction
NR1D1 (also known as Rev-erbα) encodes a nuclear heme receptor, belonging to the nuclear receptor superfamily of ligand responsive transcription factors [1], and is involved in circadian rhythm, metabolic, inflammatory, and cardiovascular processes [2,3]. NR1D1 exerts its control via interaction with DNA targets as a potent repressor of transcription [4]. Many researchers have found a wide variety of Nr1d1-regulated genes implicated in key cellular processes. Rev-erb, for example, directly suppresses the expression of the positive clock components Bmal1 and Clock [5,6] as well as Ucp1, ApoA1, and ApoCIII, which regulate body temperature cycles and cholesterol metabolism [4,7]; and PARP1, which is responsible for DNA repair of ROS-induced DNA damage in cancer cells [8]. Overexpression of Rev-erbα in C2C12 was shown to increase mitochondrial content and activity, responding to changes in energy availability [9].
The Sca-1+CD31− cells are shown to be resident cardiac progenitor cells, found in many mammalian tissues including the heart, and is able to differentiate into cardiomyocytes in vitro [10,11] and in vivo [12,13,14]. Sca-1+CD31− cells experience age-related changes, including decreased differentiation ability, proliferation capacity, and increased apoptosis. We have previously proved that the mRNA abundance of Nr1d1 increased with age, particularly in aged heart-derived Sca-1+CD31− cells [14]. The agonist of Nr1d1 is considered to be an effective anti-tumor and anti-inflammatory strategy [15,16]. However, the high expression of Nr1d1 in the hearts of elderly mice suggests that Nr1d1 plays an important role in heart aging. Currently, little is known about how NR1D1 contributes to the heart-derived Sca-1+CD31− cell plasticity during aging, and the regulatory mechanisms of Nr1d1 remain to be revealed.
2. Results
2.1. Nr1d1 mRNA Expression during Aging
Through the analysis of two independent datasets from the GEO database (GSE43556 and GSE7196), we found that the Nr1d1 mRNA level was significantly upregulated in the aged mouse heart tissue compared to the young tissue (p = 0.0011). To investigate the role of Nr1d1 in aging, we used qRT-PCR to detect Nr1d1 expression in the heart, liver, bone marrow, brain, and adipose tissues of different aged mice. The results showed a significantly increased expression of Nr1d1, especially in aged heart tissue when compared to heart tissue of young mice. Changes in Nr1d1 abundance in other tissue samples were not statistically significant across ages (Figure 1A). Our previous mRNA expression profiles of heart derived Sca-1+CD31− cells at 2 and 20 months showed that the mRNA level of Nr1d1 increased significantly (7.96 fold) in aged heart derived Sca-1+CD31 cells [14]. Notably, Nr1d1 was expressed predominantly in the aged heart-derived Sca-1+CD31 cells.
2.2. Nr1d1 Was Expressed Predominantly in the Aged Heart-Derived Sca-1+CD31− Cells
In order to assess the function of NR1D1, we performed gene knockdown and overexpression experiments using transductions of lentiviral particles containing Nr1d1-shRNA or Nr1d1-cDNA, respectively. The expression levels of Nr1d1 in heart-derived Sca-1+CD31− cells and MCM (Mouse Cardiac Myocytes) samples were detected using qRT-PCR and Western blotting. The results showed that the mRNA levels of Nr1d1 were reduced by 90.9% (O-Sca-1+CD31− cells, p < 0.0001) and 82.1% (MCM cells, p = 0.0007) in the Nr1d1 knockdown cells (Figure 1B,C). The protein level of NR1D1 in MCM cells was reduced by 35.0% when compared to the control cells (Figure 1D, p = 0.0011). Overexpression of Nr1d1 in Y-Sca-1+CD31− and MCM cells increased the mRNA abundance by 5.133-fold (p = 0.0003) and 2.45-fold (p < 0.0001), respectively (Figure 1B,C). The protein level of NR1D1 rose by 1.25-fold in MCM cells compared to the control (Figure 1D, p = 0.0042), while the protein level of NR1D1 in Sca-1+CD31− cells could not be detected because the cell number was not sufficient for Western blotting analysis.
2.3. Impact of Nr1d1 Knockdown on Cell Plasticity
In order to investigate the potential involvement of Nr1d1 in the plasticity and senescence of Sca-1+CD31− cells, we examined their abilities to differentiate into cardiomyocyte, smooth muscle, and endothelial lineages when Nr1d1 is depleted in O-Sca-1+CD31− cells transduced with lentivirus particles containing Nr1d1-shRNA. The results revealed that there were no significant differences in the numbers of differentiated cells expressing cTn (Figure 2A), α-SMA (Figure 2B), or VWF (Figure 2C) between the control and Nr1d1-shRNA-transfected cells, as evaluated by average fluorescence intensity on a single cell basis. These data indicate that downregulation of Nr1d1 does not affect the differentiation of O-Sca-1+CD31− cells.
2.4. The Effect of Nr1d1 Knockdown on Cell Senescence
Besides the Nr1d1 irrelevant role in the differentiation potential, we further assessed whether Nr1d1 participates in the proliferation potential of O- Sca-1+CD31− cells. The results showed that the cell proliferation rate was 26.4 ± 0.91% for the Nr1d1 knockdown O-Sca-1+CD31− cells and 21.93 ± 1.19% for the control samples (p = 0.0067, Figure 3A) suggesting that depletion of Nr1d1 increased cell proliferation. Moreover, Nr1d1 knockdown promoted cell proliferation of the MCM cells (p = 0.0001, Figure 3B), indicating that the function of Nr1d1 is related to cell proliferation. Meanwhile, the apoptosis rate was decreased to 25.27 ± 2.92% in Nr1d1 knockdown O-Sca-1+CD31− cells, compared to 31.38 ± 1.61% in the control cells (p = 0.0377, Figure 3C) suggesting that Nr1d1 knockdown also inhibited apoptosis (p = 0.0025, Figure 3D). These results indicate that downregulation of Nr1d1 promotes cell proliferation and inhibits apoptosis, which may be related to cellular aging.
Next, we assessed cell senescence after Nr1d1 knockdown. Senescence-associated beta-galactosidase (SA-b-gal) activity displayed significantly lower counts in the Nr1d1 knockdown group (p = 0.0382, Figure 3E). Furthermore, cell cycle inhibition seems to be associated with cellular senescence because the proportion of cells in the G0/G1 phase was 42.00 ± 1.16% in Nr1d1-knockdown O-Sca-1+CD31− cells and 62.44 ± 2.31% in the control samples (p < 0.0001). In Nr1d1-knockdown O-Sca-1+CD31 and control cells, cell proportions in the S phase were 47.103.07% and 32.611.40% (p 0.0001), and those in the G2/M phase were 10.891.91% and 4.942.46% (p = 0.0161, Figure 3F). These findings reveal that downregulation of Nr1d1 reverses aging in O-Sca-1+CD31- cells and promotes more cells escaping the G0/G1 phase, thereby increasing the S- and G2/M-phase fractions.
Interestingly, Nr1d1 knockdown in MCM cells promotes cell escape from the G0/G1 phase (Figure 3G). SR8278 is an antagonist of Nr1d1 and inhibits Nr1d1 expression (Supplementary Figure S1A, p = 0.0431). MCM cells treated with SR8278 exhibit similar effects, including increased cell proliferation (p < 0.0001), inhibition of apoptosis (p = 0.0012), more cells escaping the G0/G1 phase (p = 0.0006), and reversed cell aging (p = 0.0003) (Supplementary Figure S1).
2.5. The Effect of Nr1d1 Overexpression on Cell Plasticity and Senescence
The potential of Y- Sca-1+CD31− cells to differentiate into cardiomyocyte, smooth muscle, and endothelial lineages was assessed upon transduction with Nr1d1-cDNA or a control vector. There were no significant differences in the numbers of differentiated cells expressing cTn (Figure 4A), α-SMA (Figure 4B), and VWF (Figure 4C) between the control and Nr1d1-cDNA transfected cells, as evaluated by the average fluorescence intensity on a single cell basis.
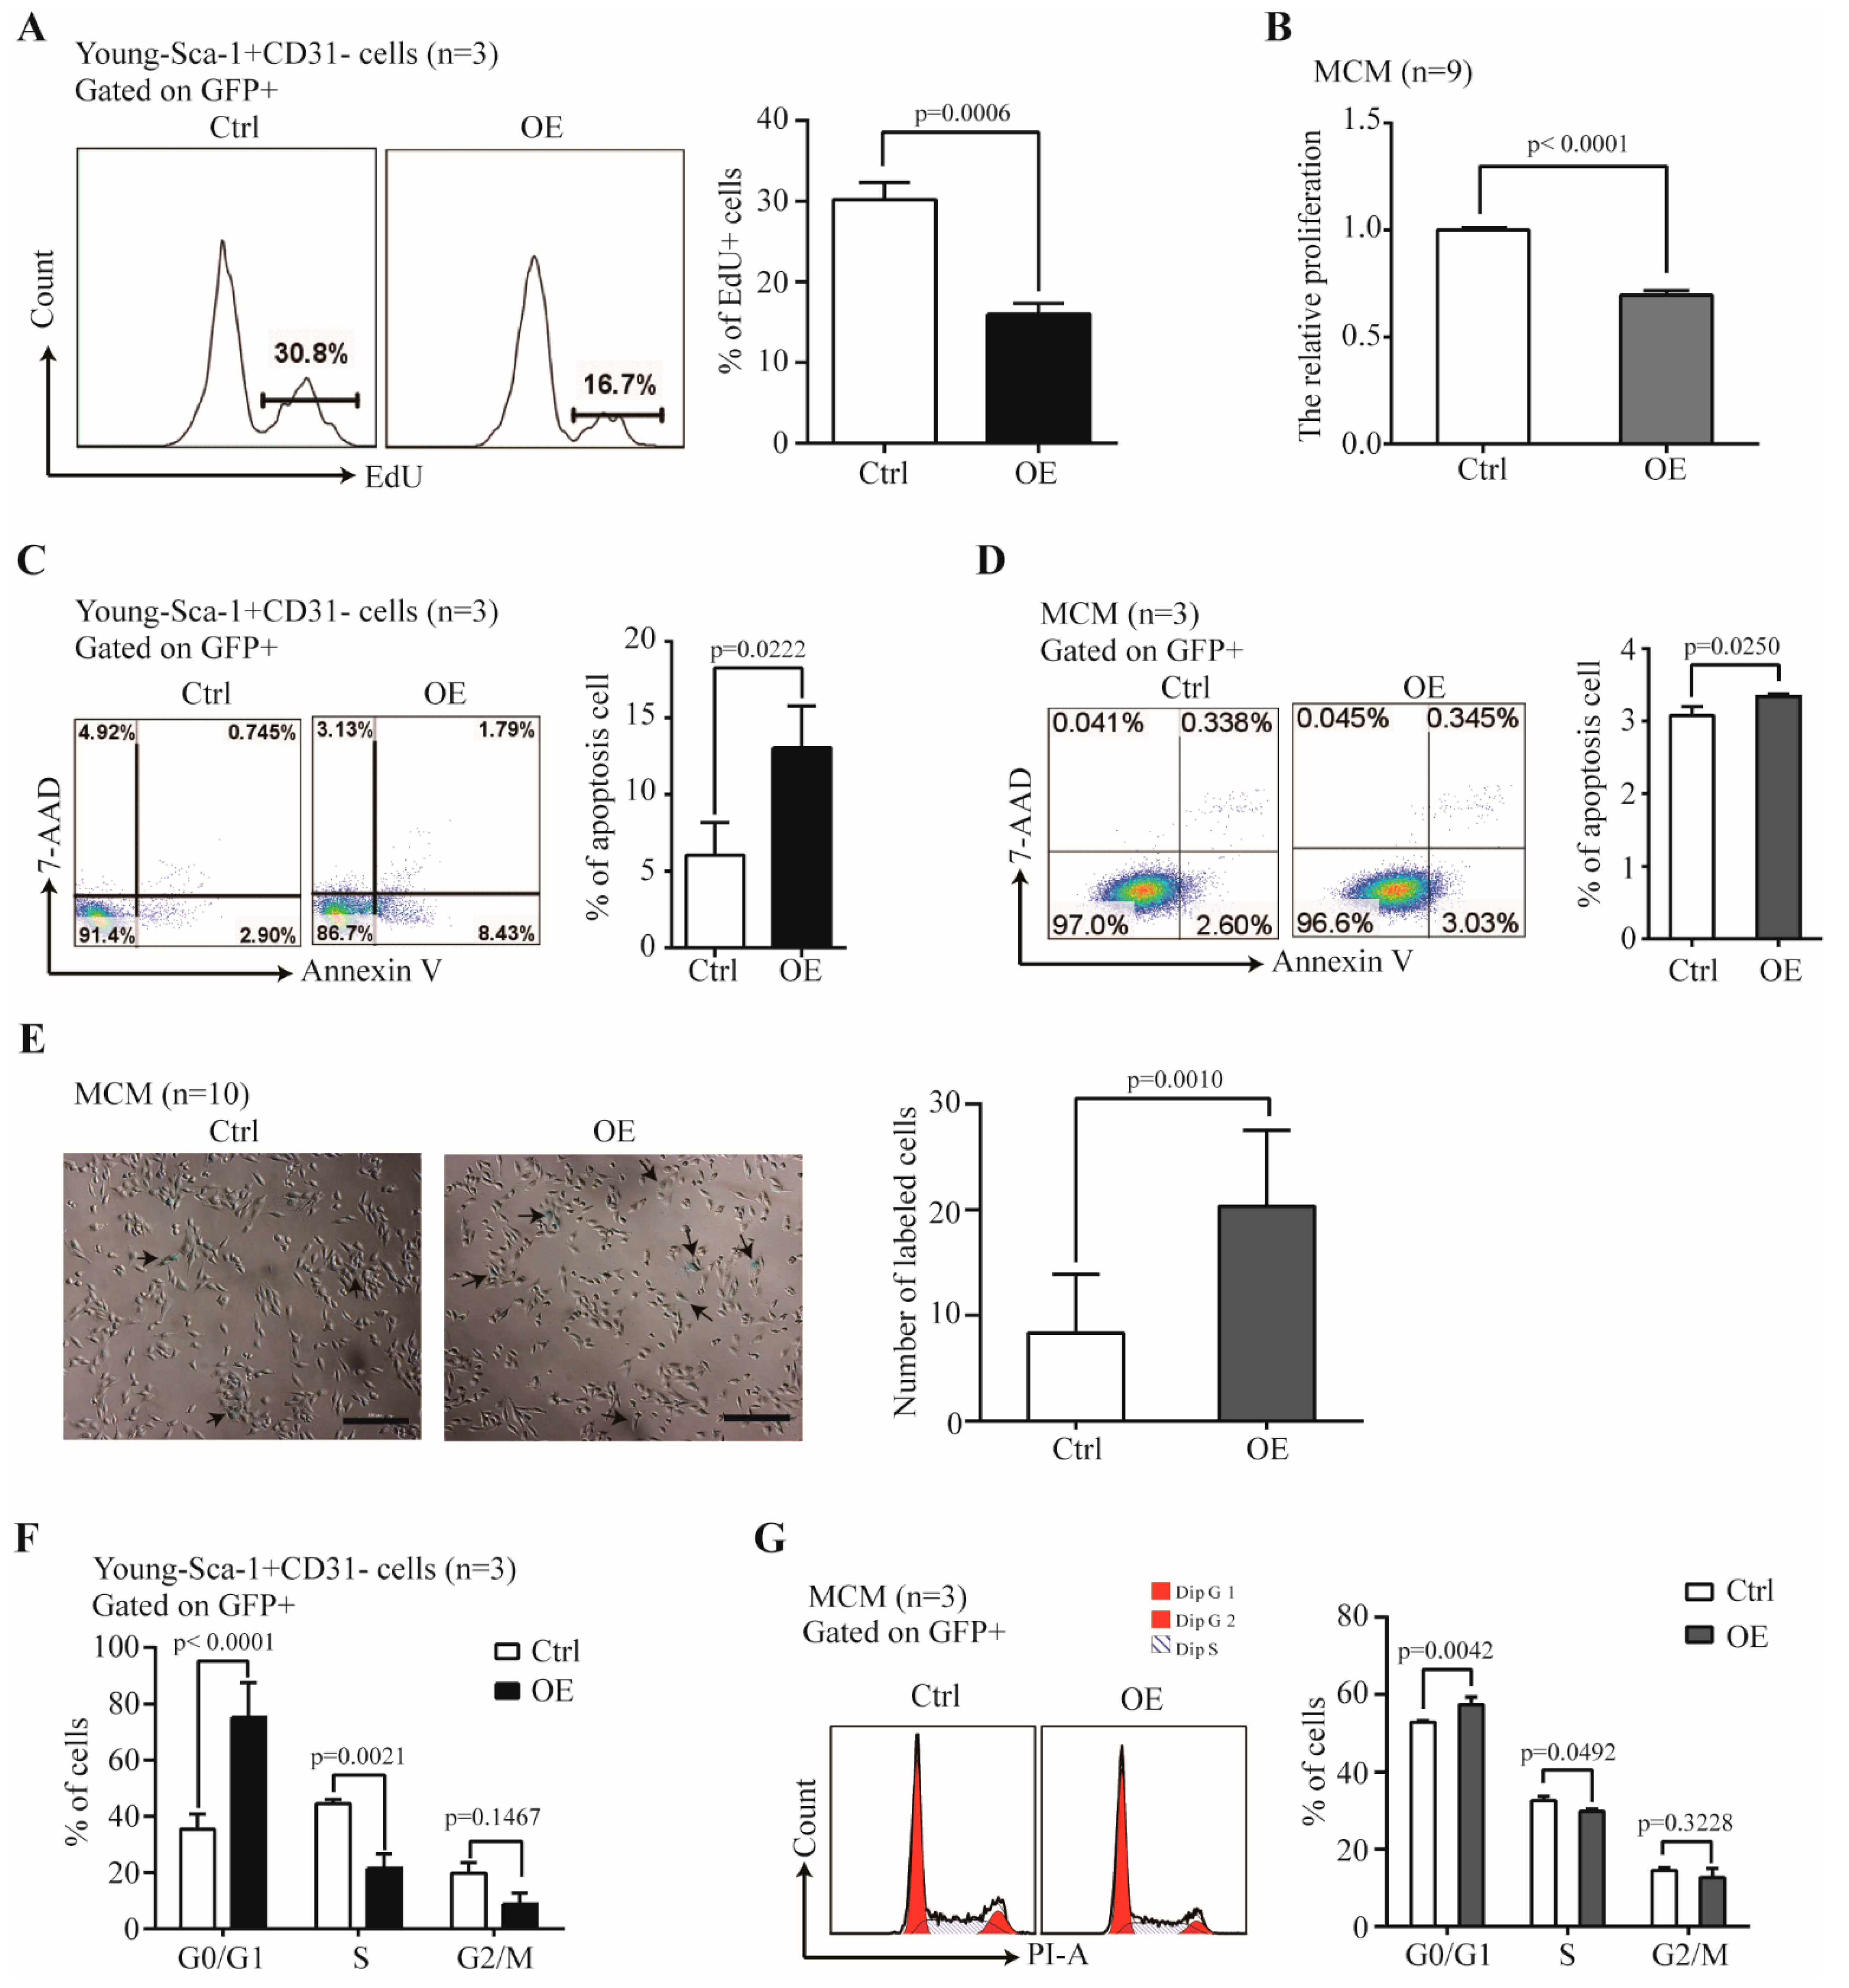
We further examined the effect of Nr1d1 overexpression on senescence-related factors. Cell proliferation rates were 16.03 ± 1.33% with Nr1d1 overexpression in Y-Sca-1+CD31− cells and 30.2 ± 2.16% in the control cells (p = 0.0006, Figure 5A), suggesting that upregulation of Nr1d1 inhibited cell proliferation. Nr1d1 overexpression in MCM cells had similar effects with inhibited cell proliferation (p < 0.0001, Figure 5B). Moreover, Nr1d1 overexpression promoted apoptosis with 13.17 ± 2.73% apoptotic cells in Nr1d1-overexpressed Y-Sca-1+CD31− cells and 6.07 ± 2.01% in the control cells (p = 0.0222, Figure 5C). Nr1d1 overexpression in MCM also promoted apoptosis (p = 0.0250, Figure 5D). Furthermore, senescence-associated beta-galactosidase (SA-b-gal) activity displayed significantly higher counts after Nr1d1 overexpression (p = 0.0010, Figure 5E). The percentage of cells in the G0/G1 phase was 75.38 ± 12.08% in the Nr1d1-overexpressed Y-Sca-1+CD31− cells and 35.43 ± 5.43% in the control cells (p < 0.0001). The percentages in the S phase were 21.51 ± 5.17% and 44.57 ± 1.58% (p = 0.0021) and in the G2/M phase were 8.78 ± 4.03% and 19.82 ± 3.71%, in the Nr1d1-overexpressed Y-Sca-1+CD31− and the control cells, respectively (Figure 5F). These results indicate that Nr1d1 overexpression arrests cells in the G0/G1 phase, consequently inhibiting cells in the S and G2/M phases. Similarly, the percentage of cells arrested in the G0/G1 phase increased in the MCM cells after Nr1d1 overexpression (Figure 5G).
In addition, we also treated MCM cells with GSK4112, an agonist of NR1D1. The results revealed that the cell proliferation of MCM cells was inhibited. At the same time, the proportion of apoptotic cells increased, cell cycle entry was slowed, and the proportion of senescent cells increased (Supplementary Figure S2).
Overall, the above results indicate that Nr1d1 is involved in the regulation of cell senescence.
2.6. The Molecular Mechanism Underlying the Regulation of Sca-1+CD31− Cells Aging by Nr1d1
To investigate the mechanism by which Nr1d1 regulates the Sca-1+CD31− cell plasticity, gene expression data were obtained using a microarray comparing the Nr1d1-cDNA-transduced Sca-1+CD31− cells and negative control. A total of 22 differentially expressed genes were identified, with a false discovery rate < 0.05 and fold change ≥ 2. Hierarchical clustering of differential genes was performed (Figure 6A). Microarray and qPCR showed similar Nr1d1 expression levels. The Nr1d1 levels were significantly upregulated in the Nr1d1-cDNA-infected Sca-1+CD31− cells. The interaction relationship among differentially expressed genes reveals that Nr1d1 directly interacts with Nr4a3 and indirectly regulates the gene expression patterns in the Sca-1+CD31− cells (Figure 6B). The expression of differentially expressed genes after Nr1d1 knockdown and overexpression in Sca-1+CD31− and MCM cells were further assessed by real-time PCR. The results showed that Nr1d1 knockdown in O-Sca-1+CD31− cells decreased the expression of Dpt (−1.926 ± 0.21%, p < 0.0001) and Serpina3 (−1.951 ± 0.09%, p < 0.0001) and increased the expression of Nr4a3 (1.363 ± 0.46%, p = 0.0079), Il11 (1.219 ± 0.09%, p = 0.0001), and Polr2k (1.344 ± 0.19%, p = 0.0013), but did not affect the expression levels of other differentially expressed components (Figure 6C). On the other hand, overexpression of Nr1d1 in Y- Sca-1+CD31− cells increased the expression of Dpt (3.931 ± 2.46%, p = 0.0153) and Serpina3 (1.897 ± 0.77%, p = 0.0171) and decreased the expression of Nr4a3 (−3.028 ± 1.57%, p = 0.0070), Il11 (−5.856 ± 1.32%, p < 0.0001), and Polr2k (−2.173 ± 0.27%, p < 0.0001), and did not affect the expression levels of other differentially expressed components (Figure 6D). The gene expression related to Nr1d1 knockdown or overexpression in MCM cells was also examined. Among the genes we investigated, only Nr4a3 was 1.84 ± 0.47 fold significantly upregulated with Nr1d1 knockdown (p = 0.0091, Figure 6E), and 52.15% downregulated with Nr1d1 overexpression when compared to the control (p = 0.0015, Figure 6F). Meanwhile, Serpina3 was 50.05% downregulated in MCM cells transfected with Nr1d1 shRNA (p = 0.0010, Figure 6E) and 1.94 ± 0.56 fold upregulated in MCM cells transfected with Nr1d1-cDNA when compared to the control (p = 0.0143, Figure 6F). Since the knockdown of Nr1d1 caused significant upregulation of Nr4a3 expression, we used the GCBI cloud platform to predict the interaction proteins of NR1D1. The results revealed that Nr4a3 was closely related to Nr1d1 (Figure 6B).
To further elucidate whether Nr1d1 directly regulates the expression of Nr4a3, we examined the binding of Nr1d1 to the promoter region of Nr4a3 using a luciferase reporter assay. The results showed that Nr4a3 promoter activity was enhanced by 2.24 ± 0.46-fold (p < 0.0001) (Figure 7A). On the other hand, expression of a Serpina3 promoter was increased by Nr4a3 (p < 0.0001, Figure 7B). The data suggest that Nr1d1 binds to the promoter of Nr4a3 and represses the expression of Nr4a3, and subsequently Nr4a3 binds to the promoter of Serpina3 and represses the expression of Serpina3.
To test this hypothesis, we knocked out Nr4a3 using CRISPR/Cas9 and knocked down Nr1d1 by Nr1d1-shRNA lentivirus in MCM cells. The results showed that Nr4a3 knockout counteracted the significant proliferation that occurred due to downregulated Nr1d1 in the MCM cells (p < 0.0001) (Figure 7C). Similarly, when Nr4a3 was depleted, the number of senescent cells in Nr1d1-knockdown cells increased significantly (p = 0.0012), as measured by the senescence-associated -galactosidase assay (Figure 7D). To further verify the relationship between Nr1d1, Nr4a3, and Serpina3, we examined the expression of Serpina3 in MCM cells with Nr1d1-knockdown or with Nr1d1-knockdown and Nr4a3-knockout. Serpina3 expression levels were significantly increased in cells with both Nr1d1-knockdown and Nr4a3 knockout (p = 0.0037, Figure 7E). These results confirm that Nr1d1 controls the expression of Nr4a3, which has the ability to regulate cellular senescence through Serpina3.
3. Discussion
Aging affects the fundamental properties of O-Sca-1+CD31− cells causing drastic changes of Sca-1+CD31− cells including decreased differentiation ability, proliferation capacity, and increased apoptosis [14]. NR1D1 is a ligand-sensitive transcription factor that can promote BMSC (bone marrow mesenchymal stem cell) aging with inhibited cell proliferation and osteogenesis [17]. In line with this, our results revealed that the abundance of Nr1d1 affects O- Sca-1+CD31− cell proliferation and apoptosis. Elevated levels of Nr1d1 in Y-Sca-1+CD31− cells triggered apoptosis and regulated the cell cycle to arrest cells in the G0/G1 phase, which then inhibited cell proliferation. This indicates that Nr1d1 promotes heart-derived Sca-1+CD31− aging by hindering cells from entering the cell cycle and thus cell proliferation. Reduced Nr1d1 levels in O-Sca-1+CD31 cells, on the other hand, inhibited cell apoptosis, regulated cell cycle stages to escape the G0/G1 phase, and increased the volumes of the S- and G2/M-phases, promoting cell proliferation. However, changes in Nr1d1 abundance did not affect the cell differentiation potential. Nr1d1 may indirectly affect the function and aging of the mouse heart by regulating the proliferation and senescence of Sca-1+CD31− cardiac cells.
Microarray analysis identified 22 differentially expressed genes when Nr1d1 is upregulated. Among them, many genes have not been previously identified as Nr1d1-responsive. Only Nr4a3 and Serpina3 were reported to be directly or indirectly related to Nr1d1.
NR4A3 (also known as NOR1) belongs to the NR4A subfamily of nuclear receptors and is a constitutively active transcription factor regulating cellular proliferation, differentiation, inflammation, and apoptosis [18,19]. Overexpression of Nr4a3 reduced VSMC apoptosis [20] and increased cell proliferation, with cyclin D1 and D2 as Nr4a3-target genes [19,21]. Nr4a3 deletion in hematopoietic stem cells (HSCs) accelerated atherosclerosis formation [18]. Serpina3 is a member of the serine proteinase inhibitor gene family and is highly expressed in HSCs [22]. Serpina3 has been shown to be involved in anti-adipogenesis [23] and anti-inflammation, and is associated with a number of human diseases [24]. Serpina3 was identified as an ApoA4-regulated gene transcriptionally via nuclear receptors Nr4a3 and Nr1d1 in hepatocytes [24]. A recent study confirmed that the downstream apoptosis trigger was independent of p53 by REV-ERB agonists [13]. The Nr1d1 overexpression in Young Sca-1+CD31− cells displayed the characteristics of aged cells. Expression analysis indicated that Nr1d1 increased the expression of Serpina3 but decreased the expression of Nr4a3. The luciferase reporter assay demonstrated that the expression of the Nr4a3 promoter was enhanced by Nr1d1, and the expression of the Serpina3 promoter was increased by Nr4a3. In addition, knockout of Nr4a3 reversed the proliferation and senescence of MCM cells due to knockdown of Nr1d1 and upregulated the expression of Serpina3. Therefore, we infer that Nr1d1 binds to the promoter of Nr4a3 and represses the expression of Nr4a3, and subsequently, the downregulated expression of Nr4a3 promotes the expression of Serpina3 due to the decreased binding of Nr4a3 to the promoter of Serpina3.
Our findings suggest that Nr1d1 can directly regulate gene expression in various types of cells. However, additional studies on the molecular mechanism by which Nr1d1 regulates Sca-1+CD31− cell aging are required. It was reported that Nr1d1 plays a key role in circadian rhythm [2]. Our microarray data, on the other hand, revealed that Nr1d1 did not regulate the circadian components in the Sca-1+CD31− cells. This indicates that the role of Nr1d1 in circadian rhythm may be cell-specific. Although some studies suggest that Rev-erb agonists are specifically lethal to cancer cells and have no effect on the viability of normal cells or tissues [15], Rev-erb agonist SR9009 treatment inhibits post-myocardial infarction mortality and improves cardiac function by modulating inflammation and remodeling processes [25]. In contrast, our data showed that increased Nr1d1 expression in heart Sca-1+CD31− cells may contribute to the reduced cell repair capacity. The intrinsic determinants of cellular senescence with higher Nr1d1 expression promote cell death and impair cell growth, compromising myocyte loss and decreasing cardiac function with age. These results strongly indicate that the effect on the heart should be taken into account when the pharmacological modulation of circadian machinery is used as a cancer treatment.
4. Materials and Methods
4.1. Experimental Animals and Cell Culture
Mice were purchased from SLAC Ltd. (Changsha, China). (SCXK(Xiang)2011-0003). Animals were maintained in the Guangxi Normal University Laboratory Animal Center and handled in accordance with the institution’s guidelines. All experimental protocols were approved by the Guangxi Normal University Animal Management Committee of Guangxi S&T Department (Approval Number: 20190313-003). FACS-sorted (Becton, Dickinson and Company, Franklin Lakes, NJ, USA) Lin−CD45−Sca-1+CD31− were used for experiments. Young (Y, 2 months old) and old (O, 22 months old) mice Sca-1+CD31− cells, respectively, were prepared and cultured as previously described [11,14].
The Mouse Crdiac Myocytes (MCM) cell line was isolated from postnatal day 2 mouse heart, and can be secondarily cultivated [26]. It was purchased from BeNa Culture Collection (Beijing, China) and cultured in DMEM containing 10% FBS, 100 μg/mL streptomycin, and 100 U/mL penicillin at 37 °C under 5% CO2. The MCM cells were passaged after 3 days. To study the effects of Nr1d1 agonists, MCM cells were incubated in DMEM without FBS for 16 h to deplete intracellular heme concentration and then switched to DMEM supplemented with either DMSO or Nr1d1 agonist GSK4112 (10 μM) or antagonist SR8278 (10 μM) for 6 h.
4.2. Nr1d1lentivirus Vectors Constructs and Stable Transfection
For Nr1d1 overexpression, full-length murine Nr1d1 cDNAs were obtained by PCR using the primers 5′-tatcgaattc (EcoRI) ATGACGACCCTGGACTCCA-3′ (forward) and 5′-GGATCCGCGG CCGCTTCTAGAtatcggatcc(BamHI)-3′(reverse). The amplified Nr1d1 cDNAs fragments were digested at EcoRI/BamHI and then cloned into CMV-MCS-IRES-EGFP lentiviral cDNA vector (Hanbio, Shanghai, China).
For Nr1d1 knockdown, oligonucleotides (GCAAGGCAACACCAAGAA TGT) targeting Nr1d1 were used to clone short hairpin (sh)RNA into the hU6-MCS-PGK-EGFP lentiviral RNAi vector (Hanbio). The recombinant overexpression and knockdown lentiviral vectors were produced by co-transfection of 293T cells with the pSPAX2, pMD2G, and pHBLV plasmids using LipoFiter reagent (Hanbio). Lentivirus-containing supernatant was collected 48 h after transfection and passed through a 0.45-μm cellulose acetate filter (Millipore, Billerica, MA, USA). Recombinant lentiviruses were concentrated by ultracentrifugation for 2 h at 72,000× g.
MCM cells were transfected with the lentiviral Nr1d1cDNA vector, lentiviral Nr1d1 RNAi vector, or empty vector encoding EGFP, respectively, using polybrene (5 μg/mL, Hanbio). Selection was initiated in medium containing 2 μg/mL puromycin (Invitrogen, Waltham, MA, USA). After selection, a stable Nr1d1 transfectant overexpression, knockdown, and the control cell line were established.
4.3. Nr4a3 Knockout and Nr1d1 Knockdown
The sgRNA sequences of mouse Nr4a3 (mm10/GRCm38) exons were retrieved using the CHOPCHOP website (http://chopchop.cbu.uib.no/, accessed on 13 October 2022). sgRNA without off-target and upstream of the exon was selected as the CRISPR/Cas9 target sequence (Supplementary Figure S3A). The sgRNA plasmid pTianJ2-Nr4a3 was constructed using the pTianJ2 plasmid. The constructed plasmid was cotransferred into MCM cells with the pST1374-Cas9-ZFNLS WT plasmid. Monoclonal cells were obtained by an infinite dilution method after puromycin screening. DNA sequencing of the target gene was performed to select the Nr4a3-knockout cell line (Supplementary Figure S3B,C).
MCM-Nr4a3-knockout cells were transfected with the lentiviral Nr1d1 RNAi vector to obtain cells with both Nr1d1 knockdown and Nr4a3 knockout. After two generations of cell passages, GFP positive cells were sorted by flow cytometry (Becton, Dickinson and Company, Franklin Lakes, NJ, USA).
4.4. Cell Differentiation and Immunofluorescence Analysis
Two days after the viral infection, lentivirus-infected and negative control Sca-1+CD31− cells were cultured in cardiomyocytes, smooth muscle cells, and endothelial differentiation induction medium for 14 days. Then, they were examined for the expression of cTnI, α-SMA, and VWF by immunocytochemistry. The experiment details as previously described [11,14].
4.5. Analysis of Cell Cycle, Proliferation, and Apoptosis
Y-/O-Sca-1+CD31− cells were transduced with Nr1d1-shRNA, Nr1d1 cDNA, and negative control lentiviral particles. After 48 h, cell apoptosis was detected by flow cytometry (Becton, Dickinson and Company, Franklin Lakes, NJ, USA) using an Annexin V-phycoerythrin (PE) Apoptosis Detection kit (Invitrogen, Carlsbad, CA, USA). The percentage of apoptotic cells was defined as the sum of annexin V-PE single-positive and annexin V-PE/7-aminoactinomycin D (7-AAD) double-positive cells. The 5-ethynyl-2′-deoxyuridine (EdU) assay was performed to assess cell proliferation 48 h after lentiviral infection by incubating the cells in a 10 μmol/L EdU solution (RiboBio, Guangzhou, China) for 2 h followed by flow cytometry analysis. Cell cycle analysis was performed using the 7-AAD Flow Cytometry Assay kit (Ebioscience, San Diego, CA, USA) according to the manufacturer’s instructions. These methods have been described in detail in previous work [11,14]. Cell apoptosis and cell cycle are performed on MCM cells as in Sca-1+CD31− cells. Proliferation of MCM cells was detected by MTT assay (Solarbio, Beijing, China).
4.6. Microarray Gene Expression Data
The Affymetrix Mouse Genome 2.0 Microarray (Santa Clara, CA, USA) was utilized to analyze gene expression of samples by high-throughput technologies. The experiments detail and data access were described in previously published studies [27,28]. Corresponding CEL files are publicly available on the Gene Expression Omnibus database (accession numbers GSE43556, GSM1024592-94, and GSE7196).
4.7. Quantitative Real-Time RT-PCR and Droplet Digital PCR
Total RNA and cDNA were prepared using a kit (Promega, Madison, WI, USA) according to manufacturer’s instructions. The details of real-time RT-PCR (Roche, Basel, Switzerland) and Droplet digital PCR(ddPCR) (Bio-Rad, Hercules, CA, USA) were described previously [29]. The primers were listed in Supplementary Table S1.
4.8. Luciferase Assay
The promoter sequence (2000 bp) upstream of the transcriptional start site of mouse Nr4a3 and Serpina3 was cloned into luciferase reporter plasmid and verified with direct sequence, respectively, as m-Nr4a3-pro+pRL-TK and m-Serpina3-pro+pRL-TK. The MCM cells (2 × 10⁵cells/well in 24-well plates) were transiently transfected with pGL3 or Nr1d1 plasmids (m-Nr1d1) and pRL-TK plasmid (Promega, Madison, WI, USA) using lipofectamine 3000. Cells were lysed 24 h after transfection and assayed for firefly and Renilla luciferase activity using the Dual-Luciferase reporter system (Promega, Madison, WI, USA). The data are expressed as the ratios of firefly to Renilla activity.
4.9. Statistical Analysis
Data analysis was performed using GraphPad Prism 6 software (GraphPad software, San Diego, CA, USA). Two-sided p-values were calculated, and p < 0.05 was considered statistically significant.
5. Conclusions
This study revealed an important role of Nr1d1 and the underlying mechanism in cardiac aging. High expression of Nr1d1 in cardiac-derived Sca-1+CD31- cells and MCM causes cell cycle arrest in the G0/G1 phase, inhibits proliferation, promotes apoptosis and senescence, and thus promotes cardiac senescence. Knockdown of Nr1d1 expression in Sca-1+CD31− cells and MCM promoted cell proliferation and reduced cellular senescence. Nr1d1 induces Serpina3 expression via Nr1d1 interaction with Nr4a3, thus promoting cell senescence. The finding will establish the functional relationship between cardiac senescence and Nr1d1 abnormal expression, reveal the molecular pathway of Nr1d1 in the regulation of cardiac senescence and its functional degeneration, and provide new targets and strategies for the diagnosis and treatment of age-related heart diseases.
Supplementary Materials
The supporting information can be downloaded at: https://0-www-mdpi-com.brum.beds.ac.uk/article/10.3390/ijms232012455/s1.
Author Contributions
S.P. managed the project, performed some experiments, and analyzed data; Q.W. (Qian Wang) performed some experiments; Q.L. carried out cell differentiation experiments; H.Z. interpreted data and revised the manuscript; Z.Z. designed the study, reviewed, and interpreted data; Q.W. (Qiong Wu) designed the study, interpreted data, and wrote the manuscript. All authors have read and agreed to the published version of the manuscript.
Funding
This study was supported by grants from the National Natural Science Foundation of China (31660344 and 32160170 to Qiong Wu, 61827819, 81972700, 32260188 to Zuping Zhou) and the Natural Science Foundation of Guangxi (2016GXNSFAA380169 and 2020GXNSFAA259049 to Qiong Wu; 2018GXNSFBA281115 to Shiming Pu). The Academy of Finland (decision No. 323670), the Jane and Aatos Erkko Foundation, and Guangxi distinguished expert funding (Hongxia Zhao).
Institutional Review Board Statement
All experiments were performed in accordance with the Guide for the Animal Care and Use Committee of Guangxi Normal University. The ethical review acceptance number is 20190313-003 (13 March 2019).
Informed Consent Statement
Not applicable.
Data Availability Statement
Not applicable.
Acknowledgments
We sincerely thank Hanbio for providing lentiviral and GCBI for the Analytics Cloud Platform. We sincerely thank Shisan Xu for his help in data analysis and manuscript revision and Xi Zhang for reviewing the typing and English. We also thank the International Journal of Molecular Sciences for editing this manuscript.
Conflicts of Interest
The authors have no competing financial interests.
References
- Okabe, T.; Chavan, R.; Costa, S.S.F.; Brenna, A.; Ripperger, J.A.; Albrecht, U. REV-ERBalpha influences the stability and nuclear localization of the glucocorticoid receptor. J. Cell Sci. 2016, 129, 4143–4154. [Google Scholar] [PubMed] [Green Version]
- Yin, L.; Wu, N.; Lazar, M.A. Nuclear receptor Rev-erbalpha: A heme receptor that coordinates circadian rhythm and metabolism. Nucl. Recept. Signal 2010, 8, e001. [Google Scholar] [CrossRef] [PubMed] [Green Version]
- Wang, Z.; Huang, Y.; Chu, F.; Ji, S.; Liao, K.; Cui, Z.; Chen, J.; Tang, S. Clock Gene Nr1d1 Alleviates Retinal Inflammation Through Repression of Hmga2 in Microglia. J. Inflamm. Res. 2021, 14, 5901–5918. [Google Scholar] [CrossRef]
- Everett, L.J.; Lazar, M.A. Nuclear receptor Rev-erbalpha: Up, down, and all around. Trends Endocrinol. Metab. 2014, 25, 586–592. [Google Scholar] [CrossRef] [Green Version]
- Yin, L.; Wang, J.; Kleinand, P.S.; Lazar, M.A. Nuclear receptor Rev-erbalpha is a critical lithium-sensitive component of the circadian clock. Science 2006, 311, 1002–1005. [Google Scholar] [CrossRef] [Green Version]
- Wang, J.; Yin, L.; Lazar, M.A. The orphan nuclear receptor Rev-erb alpha regulates circadian expression of plasminogen activator inhibitor type 1. J. Biol. Chem. 2006, 281, 33842–33848. [Google Scholar] [CrossRef] [Green Version]
- Lee, P.; Bova, R.; Schofield, L.; Bryant, W.; Dieckmann, W.; Slattery, A.; Govendir, M.A.; Emmett, L.; Greenfield, J.R. Brown Adipose Tissue Exhibits a Glucose-Responsive Thermogenic Biorhythm in Humans. Cell Metab. 2016, 23, 602–609. [Google Scholar] [CrossRef] [Green Version]
- Ka, N.-L.; Na, T.-Y.; Na, H.; Lee, M.-H.; Park, H.-S.; Hwang, S.; Kim, I.Y.; Seong, J.K.; Lee, M.-O. NR1D1 Recruitment to Sites of DNA Damage Inhibits Repair and Is Associated with Chemosensitivity of Breast Cancer. Cancer Res. 2017, 77, 2453–2463. [Google Scholar] [CrossRef] [Green Version]
- Woldt, E.; Sebti, Y.; Solt, L.A.; Duhem, C.; Lancel, S.; Eeckhoute, J.; Hesselink, M.K.C.; Paquet, C.; Delhaye, S.; Shin, Y.; et al. Rev-erb-α modulates skeletal muscle oxidative capacity by regulating mitochondrial biogenesis and autophagy. Nat. Med. 2013, 19, 1039–1046. [Google Scholar] [CrossRef]
- Pfister, O.; Oikonomopoulos, A.; Sereti, K.-I.; Liao, R. Isolation of Resident Cardiac Progenitor Cells by Hoechst 33342 Staining. Methods Mol. Biol. 2010, 660, 53–63. [Google Scholar]
- Wu, Q.; Zhan, J.; Li, Y.; Wang, X.; Xu, L.; Yu, J.; Pu, S.; Zhou, Z. Differentiation-Associated MicroRNA Alterations in Mouse Heart-Derived Sca-1(+)CD31(−)and Sca-1(+)CD31(+)Cells. Stem. Cells Int. 2016, 2016, 1–13. [Google Scholar] [CrossRef]
- Noseda, M.; Harada, M.; McSweeney, S.; Leja, T.; Belian, E.; Stuckey, D.J.; Paiva, M.S.A.; Habib, J.; Macaulay, I.; de Smith, A.J.; et al. PDGFRalpha demarcates the cardiogenic clonogenic Sca1+ stem/progenitor cell in adult murine myocardium. Nat. Commun. 2015, 6, 6930. [Google Scholar] [CrossRef] [Green Version]
- Tang, J.; Li, Y.; Huang, X.; He, L.; Zhang, L.; Wang, H.; Yu, W.; Pu, W.; Tian, X.; Nie, Y.; et al. Fate Mapping of Sca1 + Cardiac Progenitor Cells in the Adult Mouse Heart. Circulation 2018, 138, 2967–2969. [Google Scholar] [CrossRef]
- Wu, Q.; Zhan, J.; Pu, S.; Qin, L.; Li, Y.; Zhou, Z. Influence of aging on the activity of mice Sca-1+CD31− cardiac stem cells. Oncotarget 2017, 8, 29–41. [Google Scholar] [CrossRef] [Green Version]
- Sulli, G.; Rommel, A.; Wang, X.; Kolar, M.; Puca, F.; Saghatelian, A.; Plikus, M.V.; Verma, I.M.; Panda, S. Pharmacological activation of REV-ERBs is lethal in cancer and oncogene-induced senescence. Nature 2018, 553, 351–355. [Google Scholar] [CrossRef]
- Song, C.; Tan, P.; Zhang, Z.; Wu, W.; Dong, Y.; Zhao, L.; Liu, H.; Guan, H.; Li, F. REV-ERB agonism suppresses osteoclastogenesis and prevents ovariectomy-induced bone loss partially via FABP4 upregulation. FASEB J. 2018, 32, 3215–3228. [Google Scholar] [CrossRef] [Green Version]
- He, Y.; Lin, F.; Chen, Y.; Tan, Z.; Bai, D.; Zhao, Q. Overexpression of the Circadian Clock Gene Rev-erbalpha Affects Murine Bone Mesenchymal Stem Cell Proliferation and Osteogenesis. Stem. Cells Dev. 2015, 24, 1194–1204. [Google Scholar] [CrossRef] [Green Version]
- Qing, H.; Liu, Y.; Zhao, Y.; Aono, J.; Jones, K.L.; Heywood, E.B.; Howatt, D.; Binkley, C.M.; Daugherty, A.; Liang, Y.; et al. Deficiency of the NR4A Orphan Nuclear Receptor NOR1 in Hematopoietic Stem Cells Accelerates Atherosclerosis. Stem. Cells 2014, 32, 2419–2429. [Google Scholar] [CrossRef] [Green Version]
- Nomiyama, T.; Nakamachi, T.; Gizard, F.; Heywood, E.B.; Jones, K.L.; Ohkura, N.; Kawamori, R.; Conneely, O.M.; Bruemmer, D. The NR4A Orphan Nuclear Receptor NOR1 Is Induced by Platelet-derived Growth Factor and Mediates Vascular Smooth Muscle Cell Proliferation. J. Biol. Chem. 2006, 281, 33467–33476. [Google Scholar] [CrossRef] [Green Version]
- Alonso, J.; Galán, M.; Martí-Pàmies, I.; Romero, J.M.; Camacho, M.; Rodríguez, C.; Martínez-González, J. NOR-1/NR4A3 regulates the cellular inhibitor of apoptosis 2 (cIAP2) in vascular cells: Role in the survival response to hypoxic stress. Sci. Rep. 2016, 6, 34056. [Google Scholar] [CrossRef] [Green Version]
- Wang, C.-G.; Lei, W.; Li, C.; Zeng, D.-X.; Huang, J.-A. Neuron-derived orphan receptor 1 promoted human pulmonary artery smooth muscle cells proliferation. Exp. Lung Res. 2015, 41, 208–215. [Google Scholar] [CrossRef]
- Mizukami, T.; Kuramitsu, M.; Takizawa, K.; Momose, H.; Masumi, A.; Naito, S.; Iwama, A.; Ogawa, T.; Noce, T.; Hamaguchi, I.; et al. Identification of Transcripts Commonly Expressed in Both Hematopoietic and Germ-Line Stem Cells. Stem. Cells Dev. 2008, 17, 67–80. [Google Scholar] [CrossRef]
- Salazar-Olivo, L.A.; Mejia-Elizondo, R.; Alonso-Castro, A.J.; Ponce-Noyola, P.; Maldonado-Lagunas, V.; Melendez-Zajgla, J.; Saavedra-Alanis, V.M. SerpinA3g participates in the antiadipogenesis and insulin-resistance induced by tumor necrosis factor-α in 3T3-F442A cells. Cytokine 2014, 69, 180–188. [Google Scholar] [CrossRef]
- Zhang, Y.; He, J.; Zhao, J.; Xu, M.; Lou, D.; Tso, P.; Li, Z.; Li, X. Effect of ApoA4 on SERPINA3 mediated by nuclear receptors NR4A1 and NR1D1 in hepatocytes. Biochem. Biophys. Res. Commun. 2017, 487, 327–332. [Google Scholar] [CrossRef] [Green Version]
- Stujanna, E.; Murakoshi, N.; Tajiri, K.; Xu, D.; Kimura, T.; Qin, R.; Feng, D.; Yonebayashi, S.; Ogura, Y.; Yamagami, F.; et al. Rev-erb agonist improves adverse cardiac remodeling and survival in myocardial infarction through an anti-inflammatory mechanism. PLoS ONE 2017, 12, e0189330. [Google Scholar] [CrossRef] [Green Version]
- O’Connell, T.D.; Rodrigo, M.C.; Simpson, P.C. Isolation and Culture of Adult Mouse Cardiac Myocytes. Isolation and culture of adult mouse cardiac myocytes. Methods Mol Biol. 2007, 357, 271–296. [Google Scholar]
- Boon, R.; Iekushi, K.; Lechner, S.; Seeger, T.; Fischer, A.; Heydt, S.; Kaluza, D.; Tréguer, K.; Carmona, G.; Bonauer, A.; et al. MicroRNA-34a regulates cardiac ageing and function. Nature 2013, 495, 107–110. [Google Scholar] [CrossRef]
- Dufour, C.R.; Wilson, B.J.; Huss, J.M.; Kelly, D.P.; Alaynick, W.A.; Downes, M.; Evans, R.M.; Blanchette, M.; Giguère, V. Genome-wide orchestration of cardiac functions by the orphan nuclear receptors ERRalpha and gamma. Cell Metab. 2007, 5, 345–356. [Google Scholar] [CrossRef] [Green Version]
- Wu, Q.; Liu, Q.; Zhan, J.; Wang, Q.; Zhang, D.; He, S.; Pu, S.; Zhou, Z. Cited2 regulates proliferation and survival in young and old mouse cardiac stem cells. BMC Mol. Cell Biol. 2019, 20, 25. [Google Scholar] [CrossRef]
Figure 1.
The expression of Nr1d1. (A) Real-time RT-PCR was used to identify the mRNA expression level of Nr1d1 in aged organs. Each bar represents the fold change of gene expression in aged vs. young mice (n = 5). The expression levels were normalized by Gapdh and the expression level in young mice was used as a calibrator to calculate the fold change. A two-way ANOVA was applied for the analysis. p < 0.05 was considered statistically significant; (B) DD-PCR analysis of Nr1d1 mRNA expression in Sca-1+CD31− cells (n = 3). The left bar graph shows a knockdown of Nr1d1 in the old Sca-1+CD31− cells transduced with Nr1d1-shRNA lentiviral particles (Nr1d1-knockdown), while the right bar graph shows overexpression of Nr1d1 in the young Sca-1+CD31− cells transduced with Nr1d1-cDNA lentiviral particles (Nr1d1-overexpression). The control cell was transduced with an empty lentivector. A two-tailed unpaired t-test was applied for analysis. p < 0.05 was considered statistically significant; (C) real-time RT-PCR analysis of Nr1d1 overexpression in MCM cells transduced with Nr1d1-cDNA lentiviral particles (n = 9). One-way ANOVA was used for analysis. p < 0.05 was considered statistically significant; (D) immunoblot analysis of NR1D1 protein levels in MCM cells transduced with Nr1d1-cDNA lentiviral particles (n = 4). Overexpression and knockdown of Nr1d1 were performed using lentiviral transduction of Nr1d1-cDNA and Nr1d1-shRNA, respectively. The control was transduced with an empty lentivector in MCM cells. The data are from three independent experiments and are presented as mean ± SD. Two-way ANOVA was used to analyze the data. p < 0.05 was considered statistically significant. Statistical analysis was implemented by GraphPad Prism 5. Ctrl: control, KD: knockdown, OE: overexpression.

Figure 2.
The effect of Nr1d1 knockdown on cell plasticity. (A–C) cell differentiation of the old Sca-1+CD31− cell after the Nr1d1 knockdown compared to the negative control group. The left panel shows representative immunofluorescence images stained with cardiomyocyte-specific marker cTnI (red) (A), smooth muscle marker α-SMA (B), and endothelial cell marker VWF (C). Sca-1+CD31− cells were marked with GFP merged with DyLight® 550 (red). Scale bars: 50 μm. The bar graph on the right panel depicts the grayscale values of DyLight® 550 within the GFP region as determined by ImageJ and Photoshop, with data from three independent experiments (n = 3) presented as mean ± SD. Two-tail unpaired t-test was used for the analysis method, and p < 0.05 was considered statistically significant.

Figure 3.
The effect of Nr1d1 knockdown on cell senescence. (A) cell proliferation of old Sca-1+CD31− cells transduced with a Nr1d1-shRNA lentivirus as indicated by the embedding of EdU. The flow cytometric analysis of representative Edu embedding is shown in the left panel, and the bar graph on the right panel is a statistical plot of EdU embedding. The data were from three independent experiments (n = 3). Two-tail unpaired t-test was applied for statistical analysis, p < 0.05 was considered significant; (B) MTT analysis of cell proliferation of MCM transduced with a lentiviral Nr1d1-shRNA. The data were from three independent experiments, and each experiment had three replicates (n = 9). A two-tail unpaired t-test was used for statistical analysis, and p < 0.05 was considered significant. (C,D) Apoptosis rate of the old Sca-1+CD31− cells (C) and MCM (D) transduced with lentiviral Nr1d1-shRNA analyzed by FCM with annexin V-PE/7-AAD staining. The left panel is a representative flow cytometric scatter plot, and the right panel is a bar graph of apoptosis statistics. The data were from three independent experiments (n = 3). A two-tail unpaired t-test was applied for statistical analysis, and p < 0.05 was considered significant; (E) senescence-associated beta-galactosidase staining of MCM transduced with a lentiviral Nr1d1-shRNA. Control cells were transduced with an empty lentivector. The image on the left panel is a representative field of view, scale bars: 50 μm. The bar graph on the right panel shows the number of cells that were stained blue in each random field of view. Each experiment was repeated three times, and 10 random fields of view were counted (n = 10). A two-tail unpaired t-test was used for statistical analysis, and p < 0.05 was considered significant. (F,G) Cell cycle analysis by FCM for the old Sca-1+CD31− (F) and MCM (G) cells transduced with lentiviral Nr1d1-shRNA. The data were collected from three independent experiments (n = 3), two-way ANOVA was applied for statistical analysis, and p < 0.05 was considered significant. All data in the bar graph were presented as mean ± SD. Ctrl: control, KD: knockdown.

Figure 4.
The effect of Nr1d1 overexpression on cell plasticity. (A–C) differentiation of young Sca-1+CD31− cells after Nr1d1 overexpression compared to the negative control group. The left panel shows representative immunofluorescence images stained with cardiomyocyte-specific marker cTnI (A) (red), smooth muscle marker α-SMA (B), and endothelial cell marker VWF (C). Sca-1+CD31− cells were marked with GFP merged with DyLight® 550 (red). Each experiment was repeated three times, and each image represents a single result. Scale bars, 50 μm. The bar graph on the right panel depicts the grayscale values of DyLight® 550 within the GFP region as determined by ImageJ and Photoshop, with data from three independent experiments (n = 3) presented as mean SD. A two-tail unpaired t-test was used for statistical analysis, and p < 0.05 was considered significant.

Figure 5.
The effect of Nr1d1 overexpression on cell senescence. (A) Cell proliferation of young Sca-1+CD31− cells transduced with Nr1d1-cDNA lentiviral as indicated by the embedding of EdU. The left panel shows a flow cytometric analysis of a representative Edu embedding, and the right panel shows a statistical plot of Edu embedding. The data were from three independent experiments (n = 3). A two-tail unpaired t-test was applied for statistical analysis. p < 0.05 was considered significant. (B) MTT analysis of cell proliferation of MCM transduced with lentiviral Nr1d1-cDNA was detected. The data were from three independent experiments, and each experiment had three replicates (n = 9). A two-tail unpaired t-test was used for statistical analysis, and p < 0.05 was considered significant. (C,D) Apoptosis rate of young Sca-1+CD31− cells (C) and MCM (D) transduced with lentiviral Nr1d1-cDNA analyzed by FCM with annexin V-PE/7-AAD staining. The left panel is a representative flow cytometric scatter plot, and the right panel is quantification of apoptosis. The data were from three independent experiments (n = 3). A two-tail unpaired t-test was applied for statistical analysis, and p < 0.05 was considered significant; (E) senescence-associated beta-galactosidase staining of MCM transduced with lentiviral Nr1d1-cDNA. Control was transduced with an empty lentivector. The image on the left panel is a representative field of view. The scale bars: 50 μm. The bar graph on the right panel shows the number of cells that were stained blue in each random field of view. Each experiment was repeated three times, and 10 random fields of view were counted (n = 10). A two-tail unpaired t-test was used for statistical analysis, and p < 0.05 was considered significant; (F,G) cell cycle analysis by FCM for young Sca-1+CD31− cells (F) and MCM (G) cells transduced with lentiviral Nr1d1-cDNA. The data were collected from three independent experiments (n = 3), two-way ANOVA was applied for statistical analysis, and p < 0.05 was considered significant. All data in bar graph presented as mean ± SD. Ctrl: control, OE: overexpression.

Figure 6.
The effect of altered Nr1d1 expression levels on gene expression profiles. (A) the differentially expressed genes identified by a microarray in Young Sca-1+CD31− cells comparing the Nr1d1-cDNA-infected cells and negative control. The tree was based on log2 transformation of normalized probe signal intensity using hierarchical clustering. Red: upregulated gene expression; Green: downregulated gene expression. Every sample was tested twice. A total of 22 differentially expressed genes were identified via pairwise comparison. (B) Interaction relation of differentially expressed genes by generadar (https: //www.gcbi.com.cn/gcanalyze/html/generadar/index, accessed on 8 June 2020). (C,D) differentially expressed genes detected by real-time RT-PCR after Nr1d1 knockdown (C) and overexpression (D) in Sca-1+CD31− cells; data were from three independent experiments, and each experiment had two replicates (n = 6). (E,F) Differentially expressed genes detected by real-time RT-PCR after Nr1d1 knockdown (E) and overexpression (F) in MCM. Expression levels were normalized by Gapdh, and expression levels in the negative control were used as a calibrator to calculate fold changes. Calculated difference change based on a mean of three independent experiments, and each experiment had at least two replicates (n = 8). The ΔΔCT values were subjected to unpaired Student’s t-test implemented using Prism software. Bars above and below the x-axis show genes that are up- or downregulated, respectively. All data in bar graph presented as mean ± SD, and two-way ANOVA was used as statistical analysis, and p < 0.05 was considered significant. Ctrl: control, KD: knockdown, OE: overexpression.

Figure 7.
Regulatory mechanism of Nr1d1. (A,B) effect of Nr4a3 and Serpina3 on transcription of Nr1d1 assessed by a Dual-Luciferase reporter system. MCM cells were transfected with Nr4a3 luciferase reporter plasmid for 24 h, and incubated with or without the Nr1d1 plasmid (A) or MCM cells were transfected with Serpina3 luciferase reporter plasmid for 24 h, and incubated with or without the Nr4a3 plasmid (B). Cells were lysed with lysis buffer, and the lysates were subjected to the luciferase activity assay, data were collected from three independent experiments (n = 3), two-way ANOVA was applied for statistical analysis, and p < 0.05 was considered significant. (C–E) knockdown of Nr4a3 in MCM cells by CRISPR/Cas9 technique, followed by downregulation of Nr1d1 using Nr1d1-shRNA lentivirus transduction; (C) the effect of Nr4a3 knockout on cell proliferation in the MCM cells with Nr1d1 knockdown. The data were from three independent experiments, and each experiment had three replicates (n = 9). One-way ANOVA was used for statistical analysis and p < 0.05 was considered significant; (D) the effect of Nr4a3 knockout on cellular senescence (beta-galactosidase staining) in MCM cells with Nr1d1 knockdown. The image on the left panel is a representative field of view, scale bars: 50 μm. The bar graph on the right panel shows the number of cells that were stained blue in each random field of view. Each experiment was repeated three times, and 10 random fields of view were counted (n = 10). Two-way ANOVA was used for statistical analysis, and p < 0.05 was considered significant. (E) The Serpina3 mRNA expression levels were detected by real-time PCR on Nr1d1 knockdown MCM cells versus on Nr1d1 knockdown and Nr4a3 knockdown MCM cells (n = 3 vs. 5); a two-tail unpaired t-test was used as an analysis method, p < 0.05 was considered statistically significant. All data in bar graph presented as mean ± SD. Ctrl: control, KD: knockdown, KO: knockout.

Publisher’s Note: MDPI stays neutral with regard to jurisdictional claims in published maps and institutional affiliations. |
© 2022 by the authors. Licensee MDPI, Basel, Switzerland. This article is an open access article distributed under the terms and conditions of the Creative Commons Attribution (CC BY) license (https://creativecommons.org/licenses/by/4.0/).
Share and Cite
MDPI and ACS Style
Pu, S.; Wang, Q.; Liu, Q.; Zhao, H.; Zhou, Z.; Wu, Q. Nr1d1 Mediated Cell Senescence in Mouse Heart-Derived Sca-1+CD31− Cells. Int. J. Mol. Sci. 2022, 23, 12455. https://0-doi-org.brum.beds.ac.uk/10.3390/ijms232012455
AMA Style
Pu S, Wang Q, Liu Q, Zhao H, Zhou Z, Wu Q. Nr1d1 Mediated Cell Senescence in Mouse Heart-Derived Sca-1+CD31− Cells. International Journal of Molecular Sciences. 2022; 23(20):12455. https://0-doi-org.brum.beds.ac.uk/10.3390/ijms232012455
Chicago/Turabian StylePu, Shiming, Qian Wang, Qin Liu, Hongxia Zhao, Zuping Zhou, and Qiong Wu. 2022. "Nr1d1 Mediated Cell Senescence in Mouse Heart-Derived Sca-1+CD31− Cells" International Journal of Molecular Sciences 23, no. 20: 12455. https://0-doi-org.brum.beds.ac.uk/10.3390/ijms232012455
Note that from the first issue of 2016, this journal uses article numbers instead of page numbers. See further details here.