
The Effect of Heterozygous Mutation of Adenylate Kinase 2 Gene on Neutrophil Differentiation
 ,
,
Abstract
:1. Introduction
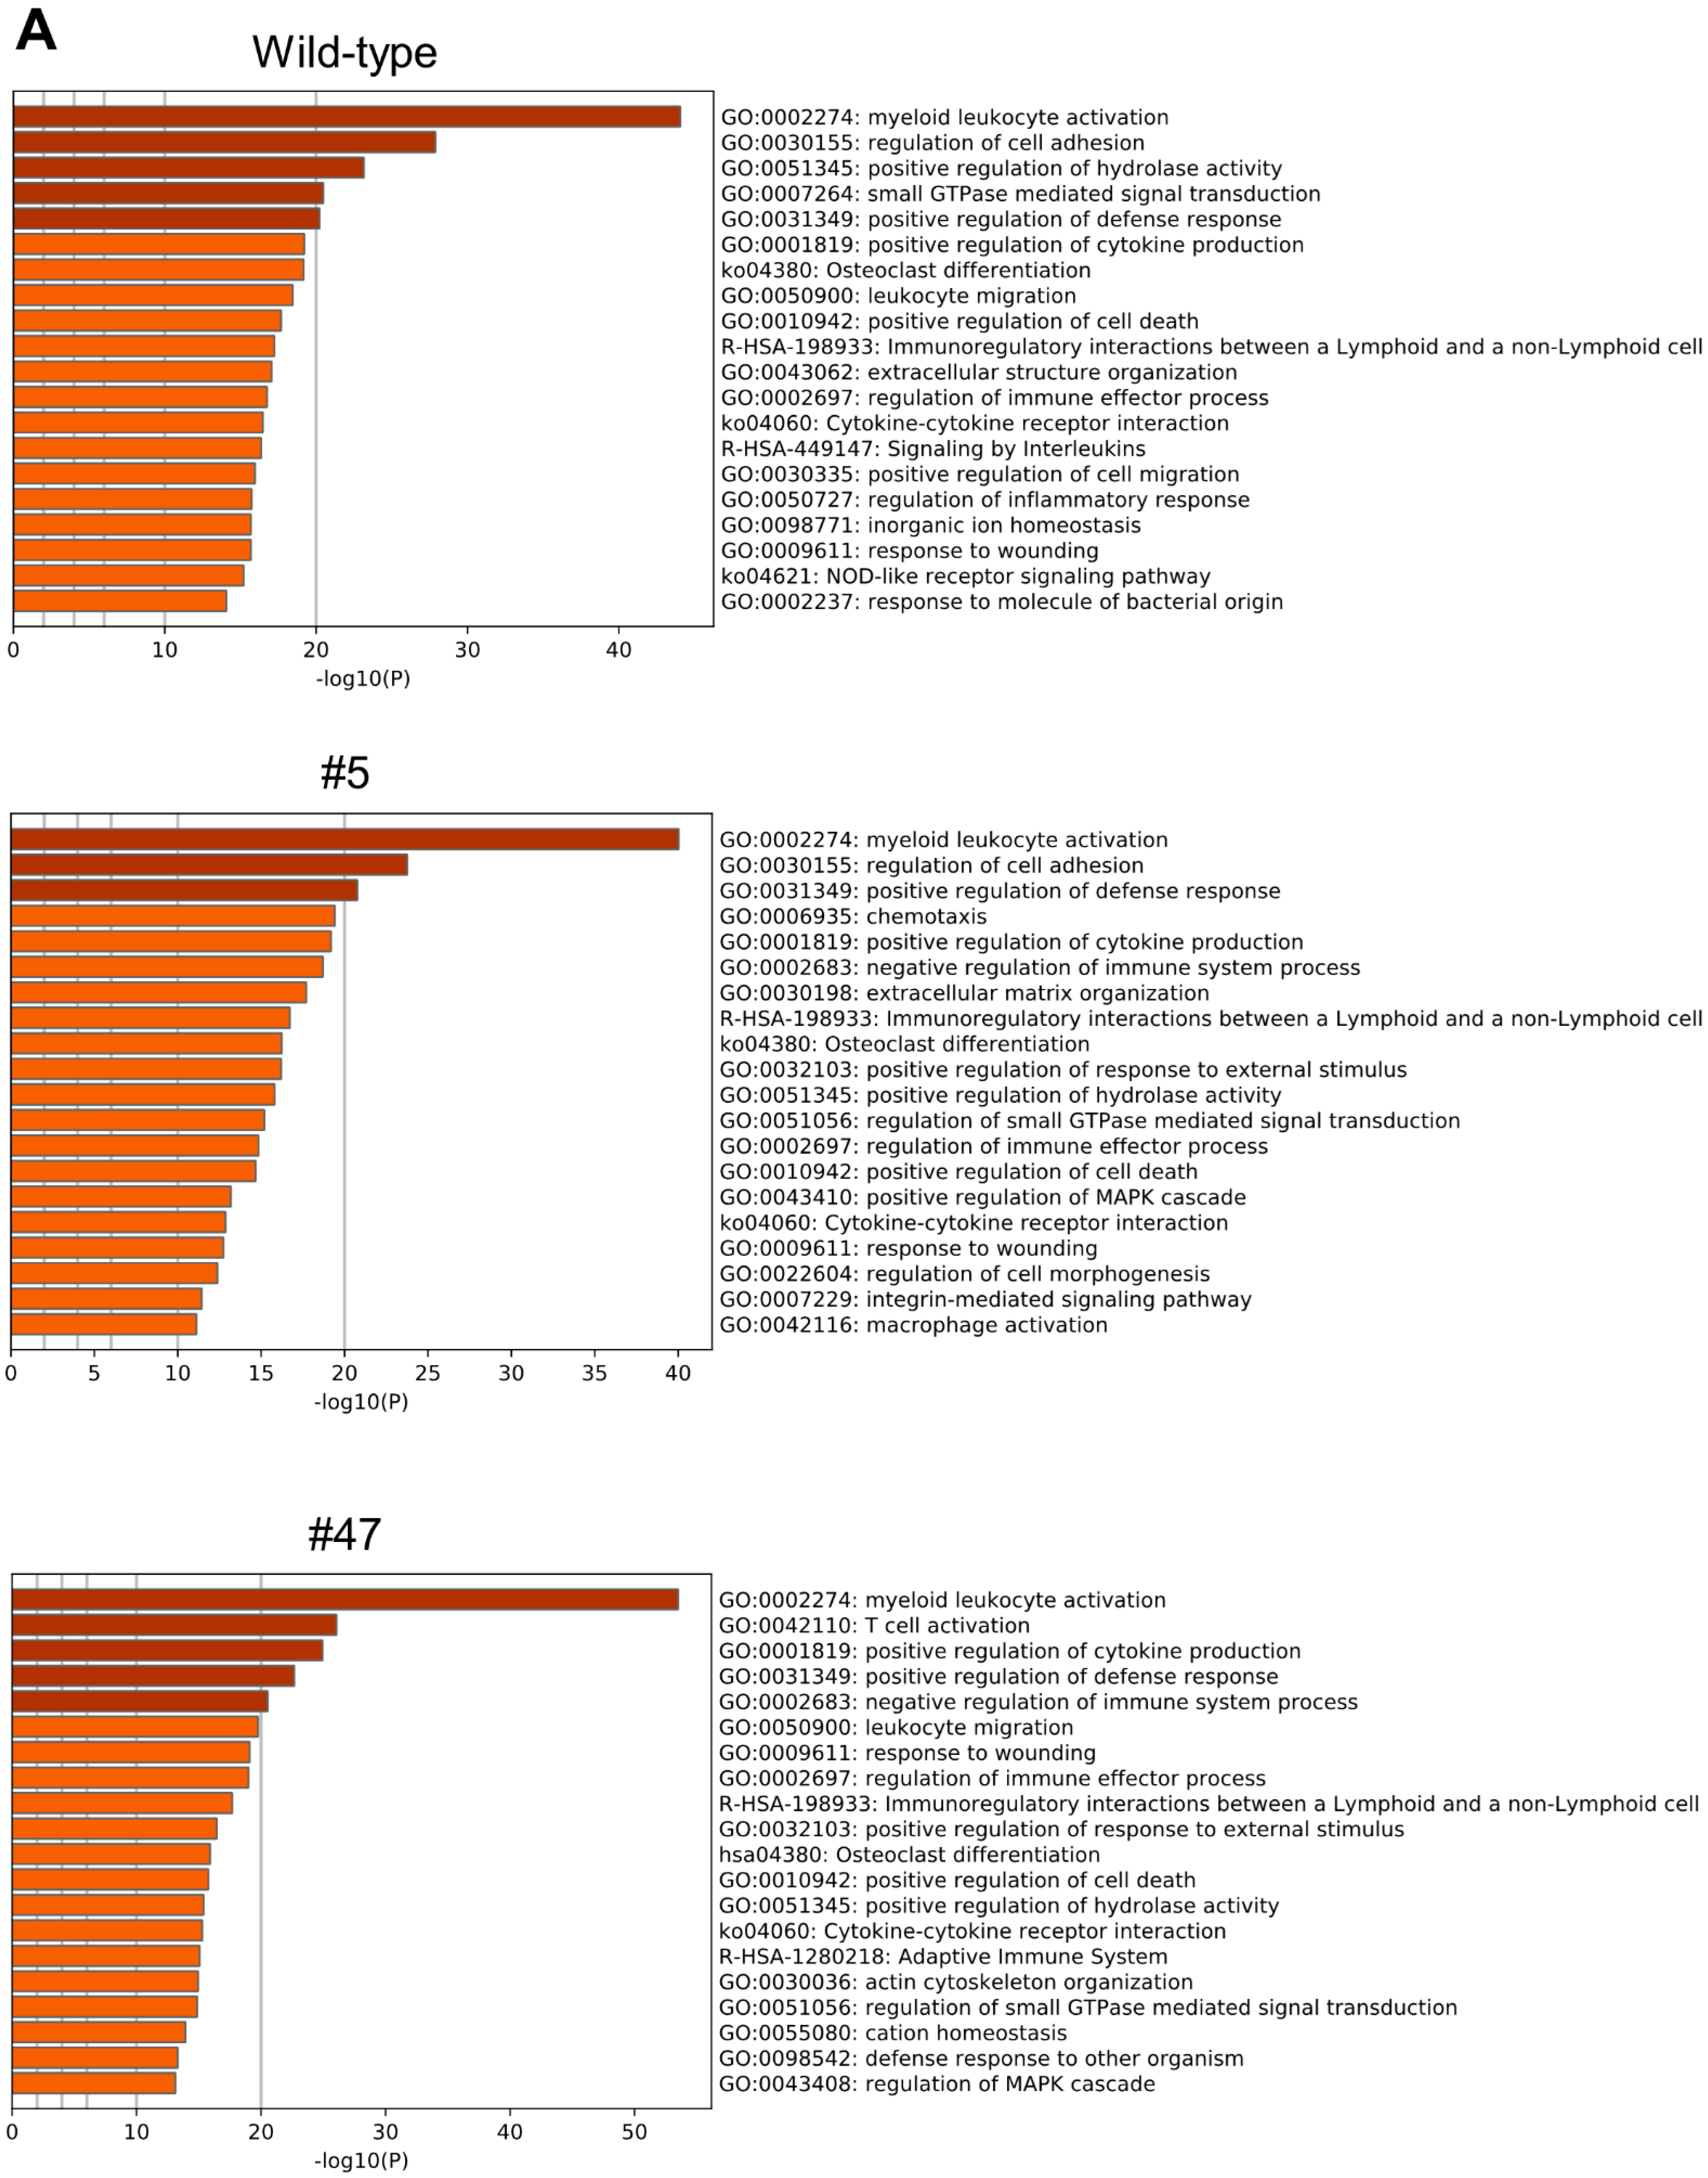
2. Results
2.1. Preparation of CRISPR/Cas9-Mediated AK2 Heterozygous Mutants
2.2. Protein Structure Analysis of Clone #5 with the 6-Base Deletion
2.3. Characterization of AK2 Heterozygous Mutants
2.4. Metabolite Restoration
3. Discussion
3.1. Characteristics of Heterozygous Mutants
3.2. Differentiation Activity of AK2 Heterozygous Mutants
3.3. Possible Roles of Domain Structure
3.4. Metabolic Restoration by Fructose Supplementation
4. Materials and Methods
4.1. Cell Culture and Differentiation
4.2. Preparation of CRISPR/Cas9-Mediated AK2 Heterozygous Mutant Clones of HL-60
4.3. Western Blot
4.4. Enzymatic Activity
4.5. Whole-Genome Analysis (Details of AK2 Locus)
4.6. Microarray Analysis during Neutrophil Differentiation
4.7. Metabolic Analysis
4.8. Protein Structure Analysis
4.9. Cytological Staining
4.10. Statistics
5. Conclusions
Supplementary Materials
Author Contributions
Funding
Institutional Review Board Statement
Informed Consent Statement
Data Availability Statement
Acknowledgments
Conflicts of Interest
References
- Tanimura, A.; Horiguchi, T.; Miyoshi, K.; Hagita, H.; Noma, T. Differential expression of adenine nucleotide converting enzymes in mitochondrial intermembrane space: A potential role of adenylate kinase isozyme 2 in neutrophil differentiation. PLoS ONE 2014, 9, e89916. [Google Scholar] [CrossRef] [PubMed]
- Tanimura, A.; Miyoshi, K.; Horiguchi, T.; Hagita, H.; Fujisawa, K.; Noma, T. Mitochondrial Activity and Unfolded Protein Response are Required for Neutrophil Differentiation. Cell Physiol. Biochem. 2018, 47, 1936–1950. [Google Scholar] [CrossRef] [PubMed]
- Lagresle-Peyrou, C.; Six, E.M.; Picard, C.; Rieux-Laucat, F.; Michel, V.; Ditadi, A.; Demerens-de Chappedelaine, C.; Morillon, E.; Valensi, F.; Simon-Stoos, K.L.; et al. Human adenylate kinase 2 deficiency causes a profound hematopoietic defect associated with sensorineural deafness. Nat. Genet. 2009, 41, 106–111. [Google Scholar] [CrossRef] [Green Version]
- Pannicke, U.; Hönig, M.; Hess, I.; Friesen, C.; Holzmann, K.; Rump, E.-M.; Barth, T.F.; Rojewski, M.T.; Schulz, A.; Boehm, T.; et al. Reticular dysgenesis (aleukocytosis) is caused by mutations in the gene encoding mitochondrial adenylate kinase 2. Nat. Genet. 2009, 41, 101–105. [Google Scholar] [CrossRef]
- Zhang, S.; Yamada, S.; Park, S.; Klepinin, A.; Kaambre, T.; Terzic, A.; Dzeja, P. Adenylate kinase AK2 isoform integral in embryo and adult heart homeostasis. Biochem. Biophys. Res. Commun. 2021, 546, 59–64. [Google Scholar] [CrossRef] [PubMed]
- Kim, H.; Lee, H.J.; Oh, Y.; Choi, S.G.; Hong, S.H.; Kim, H.J.; Lee, S.Y.; Choi, J.W.; Hwang, D.S.; Kim, K.S.; et al. The DUSP26 phosphatase activator adenylate kinase 2 regulates FADD phosphorylation and cell growth. Nat. Commun. 2014, 5, 3351. [Google Scholar] [CrossRef] [Green Version]
- Lee, Y.; Hong, M.; Kim, Y.J.; Kim, J.W.; Kim, C.H.; Lee, K.S.; Chang, S.Y.; Lim, J.S.; Choe, I.S. Cloning of the genomic sequence encoding a processed adenylate kinase 2 pseudogene. Biochem. Mol. Biol. Int. 1999, 47, 37–46. [Google Scholar] [CrossRef] [PubMed]
- Noma, T.; Song, S.; Yoon, Y.S.; Tanaka, S.; Nakazawa, A. cDNA cloning and tissue-specific expression of the gene encoding human adenylate kinase isozyme 2. Biochim. Biophys. Acta. 1998, 1395, 34–39. [Google Scholar] [CrossRef] [PubMed]
- Bheda, P. Metabolic transcriptional memory. Mol. Metab. 2020, 38, 100955. [Google Scholar] [CrossRef] [PubMed]
- Hoenig, M.; Pannicke, U.; Gaspar, H.B.; Schwarz, K. Recent advances in understanding the pathogenesis and management of reticular dysgenesis. Br. J. Haematol. 2018, 180, 644–653. [Google Scholar] [CrossRef] [PubMed]
- Collins, S.J. The HL-60 promyelocytic leukemia cell line: Proliferation, differentiation, and cellular oncogene expression. Blood 1987, 70, 1233–1244. [Google Scholar] [CrossRef] [PubMed] [Green Version]
- Horiguchi, T.; Fuka, M.; Fujisawa, K.; Tanimura, A.; Miyoshi, K.; Murakami, R.; Noma, T. Adenylate kinase 2 deficiency limits survival and regulates various genes during larval stages of Drosophila melanogaster. J. Med. Investig. 2014, 61, 137–150. [Google Scholar] [CrossRef] [Green Version]
- Tak, T.; Tesselaar, K.; Pillay, J.; Borghans, J.A.M.; Koenderman, L. What’s your age again? Determination of human neutrophil half-lives revisited. J. Leukoc. Biol. 2013, 94, 595–601. [Google Scholar] [CrossRef] [PubMed]
- Dreusicke, D.; Schulz, G.E. The glycine-rich loop of adenylate kinase forms a giant anion hole. FEBS Lett. 1986, 208, 301–304. [Google Scholar] [CrossRef] [PubMed] [Green Version]
- Ter Horst, K.W.; Serlie, M.J. Fructose Consumption, Lipogenesis, and Non-Alcoholic Fatty Liver Disease. Nutrients 2017, 9, 981. [Google Scholar] [CrossRef] [PubMed] [Green Version]
- Kansal, R. Fructose Metabolism and Acute Myeloid Leukemia. Explor. Res. Hypothesis Med. 2022, 7, 25–38. [Google Scholar] [CrossRef]
- Chen, W.L.; Wang, Y.Y.; Zhao, A.; Xia, L.; Xie, G.; Su, M.; Zhao, L.; Liu, J.; Qu, C.; Wei, R.; et al. Enhanced Fructose Utilization Mediated by SLC2A5 Is a Unique Metabolic Feature of Acute Myeloid Leukemia with Therapeutic Potential. Cancer Cell 2016, 30, 779–791. [Google Scholar] [CrossRef] [PubMed] [Green Version]
- Jin, L.; Zhou, Y. Crucial role of the pentose phosphate pathway in malignant tumors. Oncol. Lett. 2019, 17, 4213–4221. [Google Scholar] [CrossRef] [PubMed] [Green Version]
- Injarabian, L.; Devin, A.; Ransac, S.; Marteyn, B.S. Neutrophil Metabolic Shift during their Lifecycle: Impact on their Survival and Activation. Int. J. Mol. Sci. 2019, 21, 287. [Google Scholar] [CrossRef] [PubMed] [Green Version]
- Freeman, M.L.; Mertens-Talcott, S.U.; St Cyr, J.; Percival, S.S. Ribose enhances retinoic acid-induced differentiation of HL-60 cells. Nutr. Res. 2008, 28, 775–782. [Google Scholar] [CrossRef] [PubMed]
- Collins, S.J.; Ruscetti, F.W.; Gallagher, R.E.; Gallo, R.C. Normal functional characteristics of cultured human promyelocytic leukemia cells (HL-60) after induction of differentiation by dimethylsulfoxide. J. Exp. Med. 1979, 149, 969–974. [Google Scholar] [CrossRef] [PubMed]
- Harris, P.; Ralph, P. Human leukemic models of myelomonocytic development: A review of the HL-60 and U937 cell lines. J. Leukoc. Biol. 1985, 37, 407–422. [Google Scholar] [CrossRef] [PubMed]
- Breitman, T.; Selonick, S.; Collins, S. Induction of differentiation of the human promyelocytic leukemia cell line (HL-60) by retinoic acid. Proc. Natl. Acad. Sci. USA 1980, 77, 2936–2940. [Google Scholar] [CrossRef] [PubMed] [Green Version]
- Nobumoto, M.; Yamada, M.; Song, S.; Inouye, S.; Nakazawa, A. Mechanism of mitochondrial import of adenylate kinase isozymes. J. Biochem. 1998, 123, 128–135. [Google Scholar] [CrossRef] [PubMed]
- Conner, J.; Russell, P.J. Elemental sulfur: A novel inhibitor of adenylate kinase. Biochem. Biophys. Res. Commun. 1983, 113, 348–352. [Google Scholar] [CrossRef] [PubMed]
- Zhou, Y.; Zhou, B.; Pache, L.; Chang, M.; Khodabakhshi, A.H.; Tanaseichuk, O.; Benner, C.; Chanda, S.K. Metascape provides a biologist-oriented resource for the analysis of systems-level datasets. Nat. Commun. 2019, 10, 1523. [Google Scholar] [CrossRef]
- Jones, D.T. Protein secondary structure prediction based on position-specific scoring matrices. J. Mol. Biol. 1999, 292, 195–202. [Google Scholar] [CrossRef] [Green Version]
- Jones, D.T.; Cozzetto, D. DISOPRED3: Precise disordered region predictions with annotated protein-binding activity. Bioinformatics 2015, 31, 857–863. [Google Scholar] [CrossRef] [Green Version]
- Mirdita, M.; Schütze, K.; Moriwaki, Y.; Heo, L.; Ovchinnikov, S.; Steinegger, M. ColabFold-Making protein folding accessible to all. Nat. Methods 2022, 19, 679–682. [Google Scholar] [CrossRef]
- Pettersen, E.F.; Goddard, T.D.; Huang, C.C.; Couch, G.S.; Greenblatt, D.M.; Meng, E.C.; Ferrin, T.E. UCSF Chimera--a visualization system for exploratory research and analysis. J. Comput. Chem. 2004, 25, 1605–1612. [Google Scholar] [CrossRef]


| Clone | Mutations | cDNA Mutation Sites | ||
|---|---|---|---|---|
| PCR | Whole Genome Analysis | |||
| 1st trial | #1 | 1-base ins and 11-base del/WT | 1-base ins and 11-base del/WT | 221_222insA and 228_238del11/none |
| 2nd trial | #5 | 1-base ins and 11-base del/6-base del | 1-base ins and 11-base del/6-base del | 221_222insA and 228_238del11/230_235delAAGGCA |
| #47 | 1-base ins and 11-base del/3-base del | 1-base ins and 11-base del/WT | 221_222insA and 228_238del11/none | |
| Viability (%) | |
| WT | 76.63 ± 2.96 |
| #5 | 92.57 ± 2.37 ** |
| #47 | 94.67 ± 1.11 ** |
Publisher’s Note: MDPI stays neutral with regard to jurisdictional claims in published maps and institutional affiliations. |
© 2022 by the authors. Licensee MDPI, Basel, Switzerland. This article is an open access article distributed under the terms and conditions of the Creative Commons Attribution (CC BY) license (https://creativecommons.org/licenses/by/4.0/).
Share and Cite
Horiguchi, T.; Tanimura, A.; Miyoshi, K.; Hagita, H.; Minami, H.; Noma, T. The Effect of Heterozygous Mutation of Adenylate Kinase 2 Gene on Neutrophil Differentiation. Int. J. Mol. Sci. 2022, 23, 16089. https://0-doi-org.brum.beds.ac.uk/10.3390/ijms232416089
Horiguchi T, Tanimura A, Miyoshi K, Hagita H, Minami H, Noma T. The Effect of Heterozygous Mutation of Adenylate Kinase 2 Gene on Neutrophil Differentiation. International Journal of Molecular Sciences. 2022; 23(24):16089. https://0-doi-org.brum.beds.ac.uk/10.3390/ijms232416089
Chicago/Turabian StyleHoriguchi, Taigo, Ayako Tanimura, Keiko Miyoshi, Hiroko Hagita, Hisanori Minami, and Takafumi Noma. 2022. "The Effect of Heterozygous Mutation of Adenylate Kinase 2 Gene on Neutrophil Differentiation" International Journal of Molecular Sciences 23, no. 24: 16089. https://0-doi-org.brum.beds.ac.uk/10.3390/ijms232416089