
Dual RNA Sequencing of Mycobacterium tuberculosis-Infected Human Splenic Macrophages Reveals a Strain-Dependent Host–Pathogen Response to Infection

 , , , , and
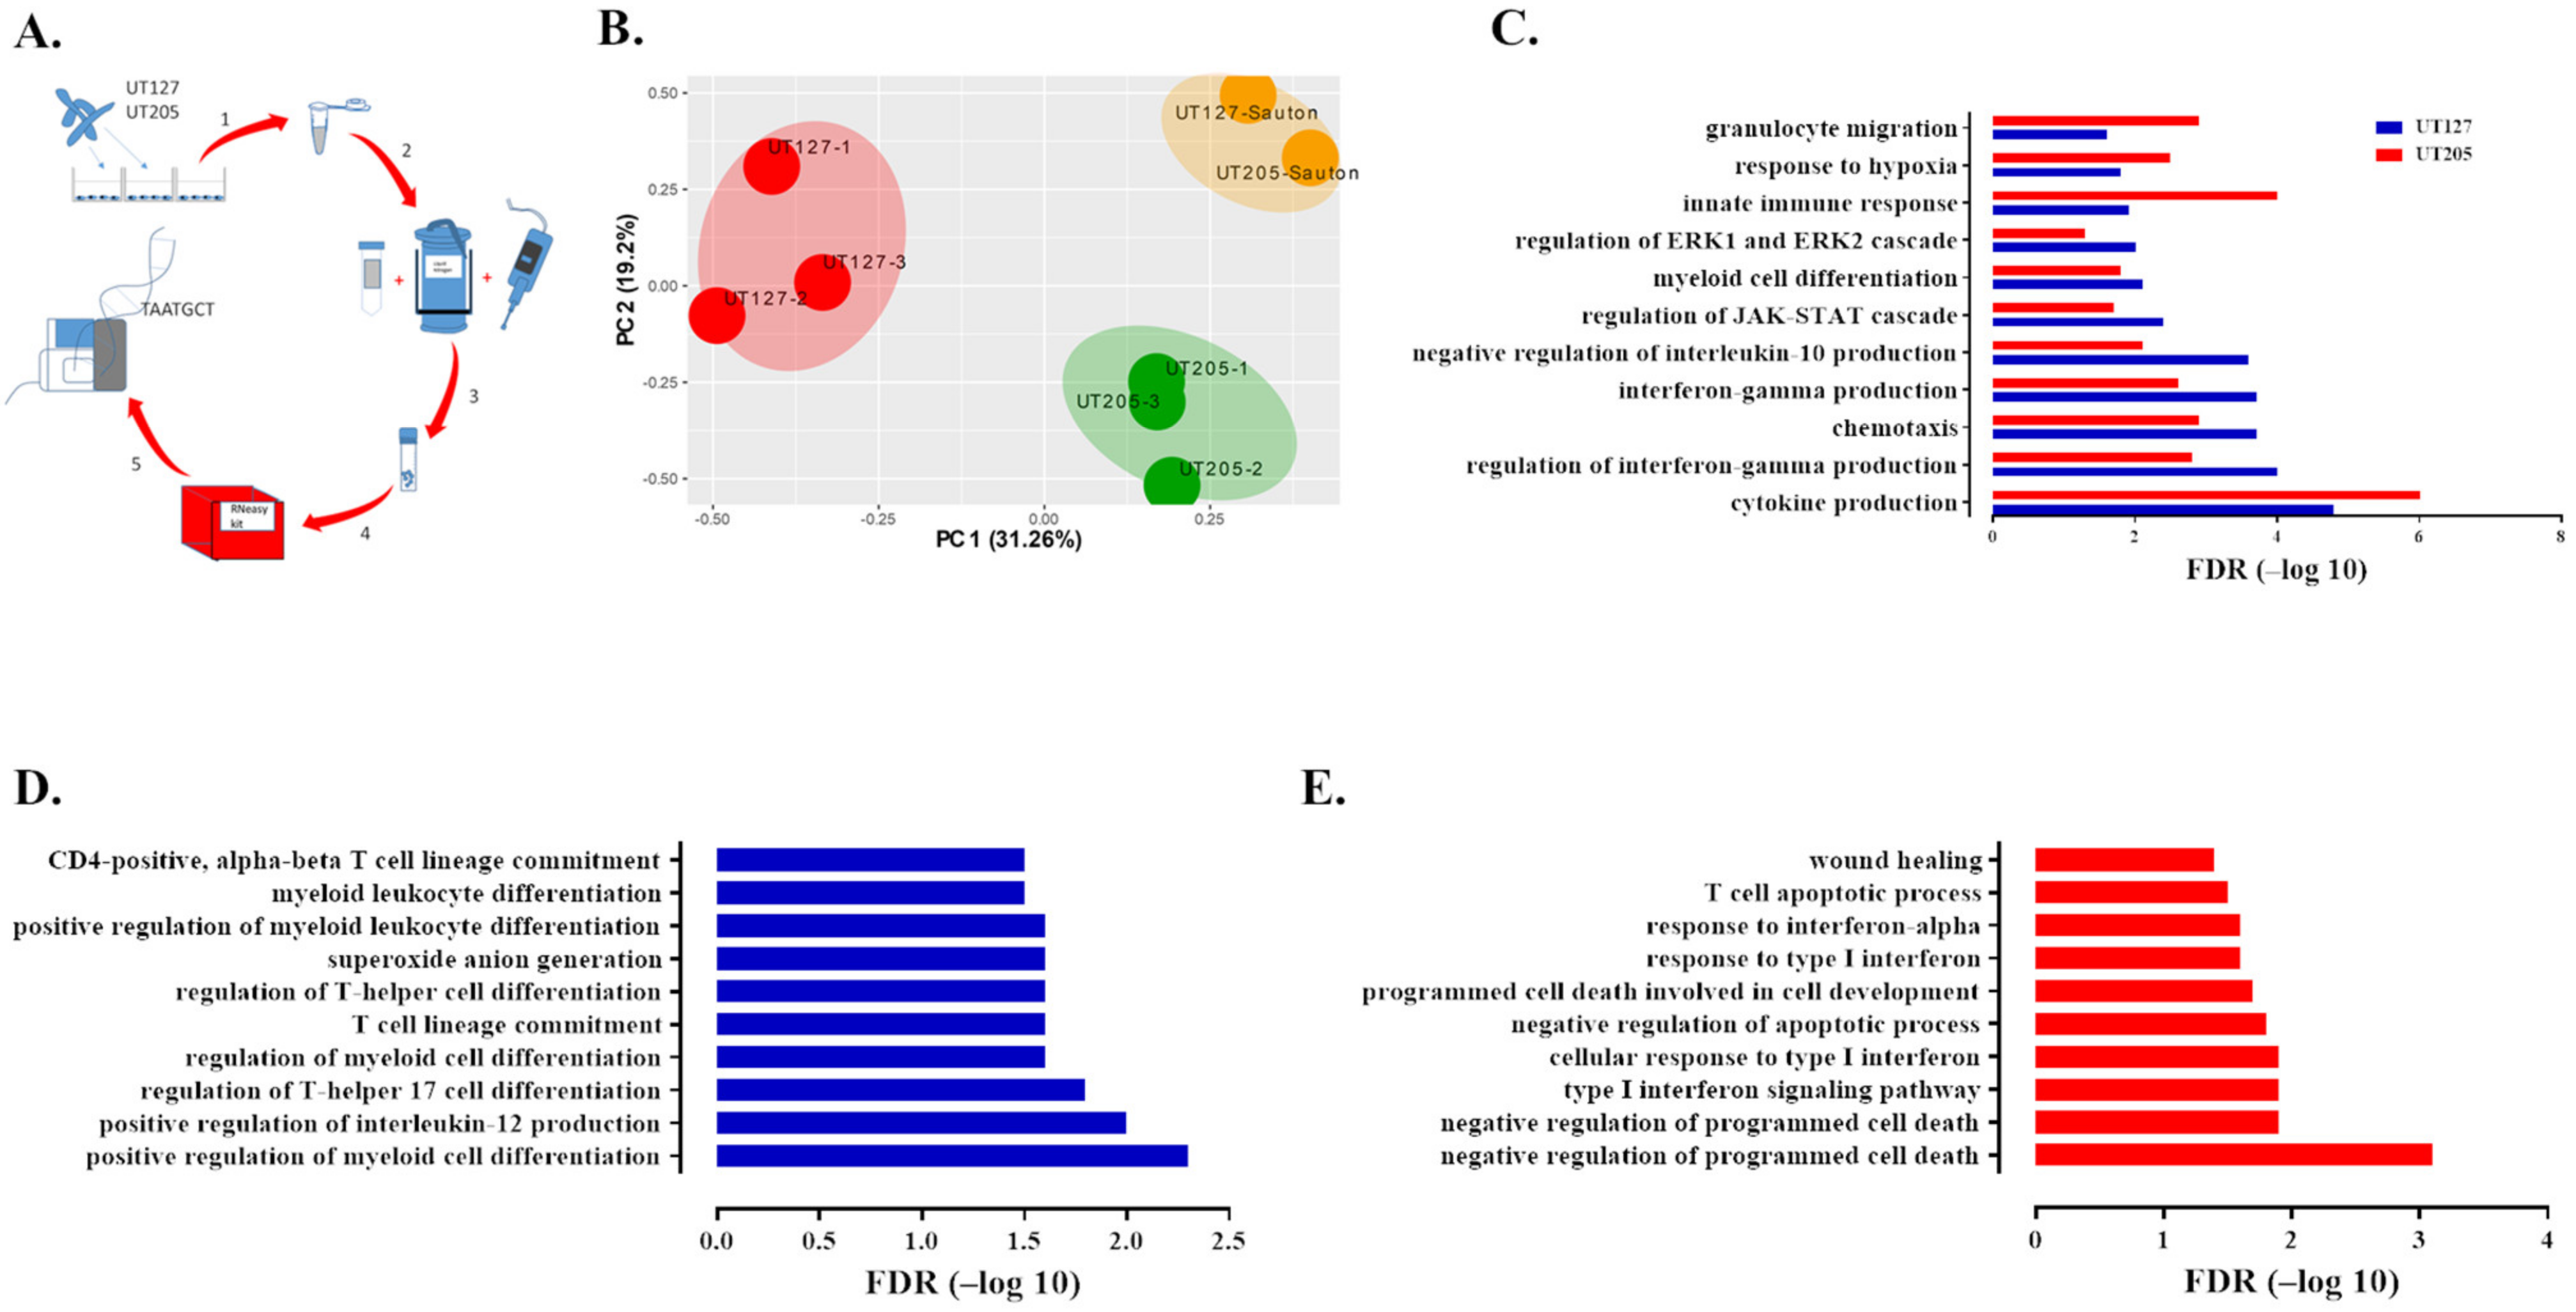
Abstract
:1. Introduction
2. Results
2.1. Infection with the Clinical Strains UT127 and UT205 Induced a Distinct Transcriptomic Response of Splenic Macrophages
2.2. Splenic Macrophages Have a Unique Immune Response to Mtb Infection
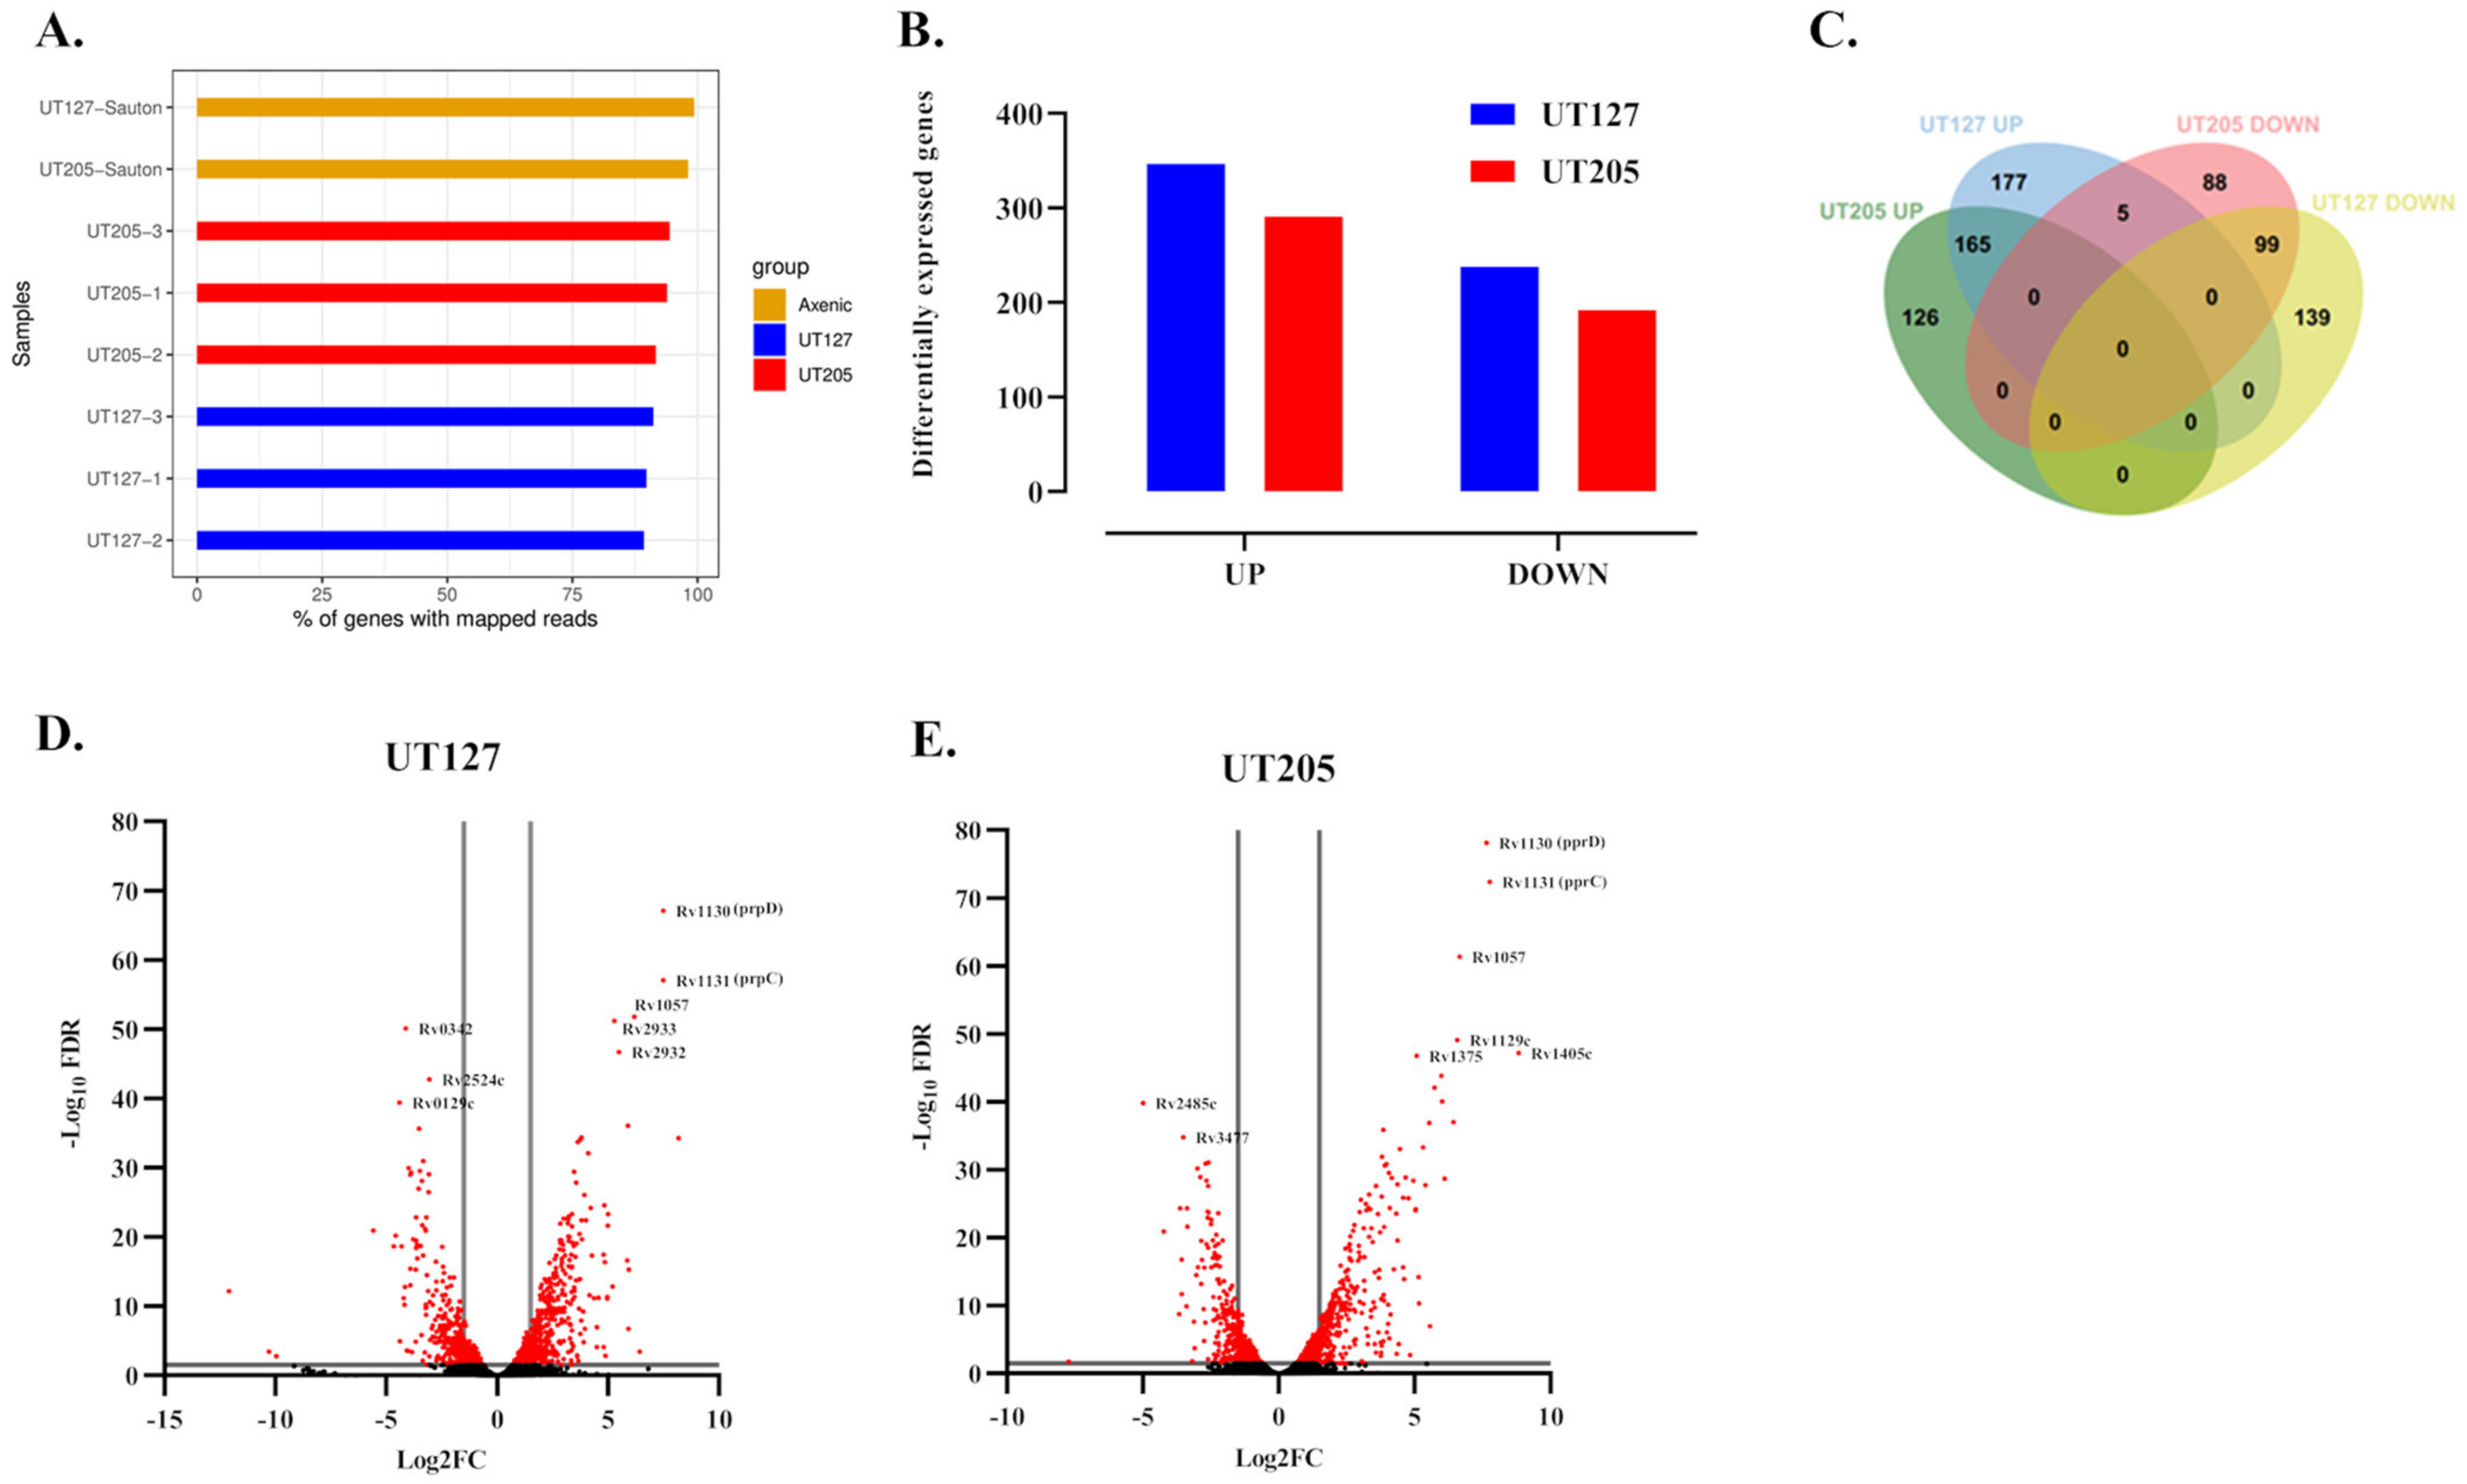
2.3. M. tuberculosis UT127 and UT205 Display Distinct Transcriptomic Profiles Inside hSMs
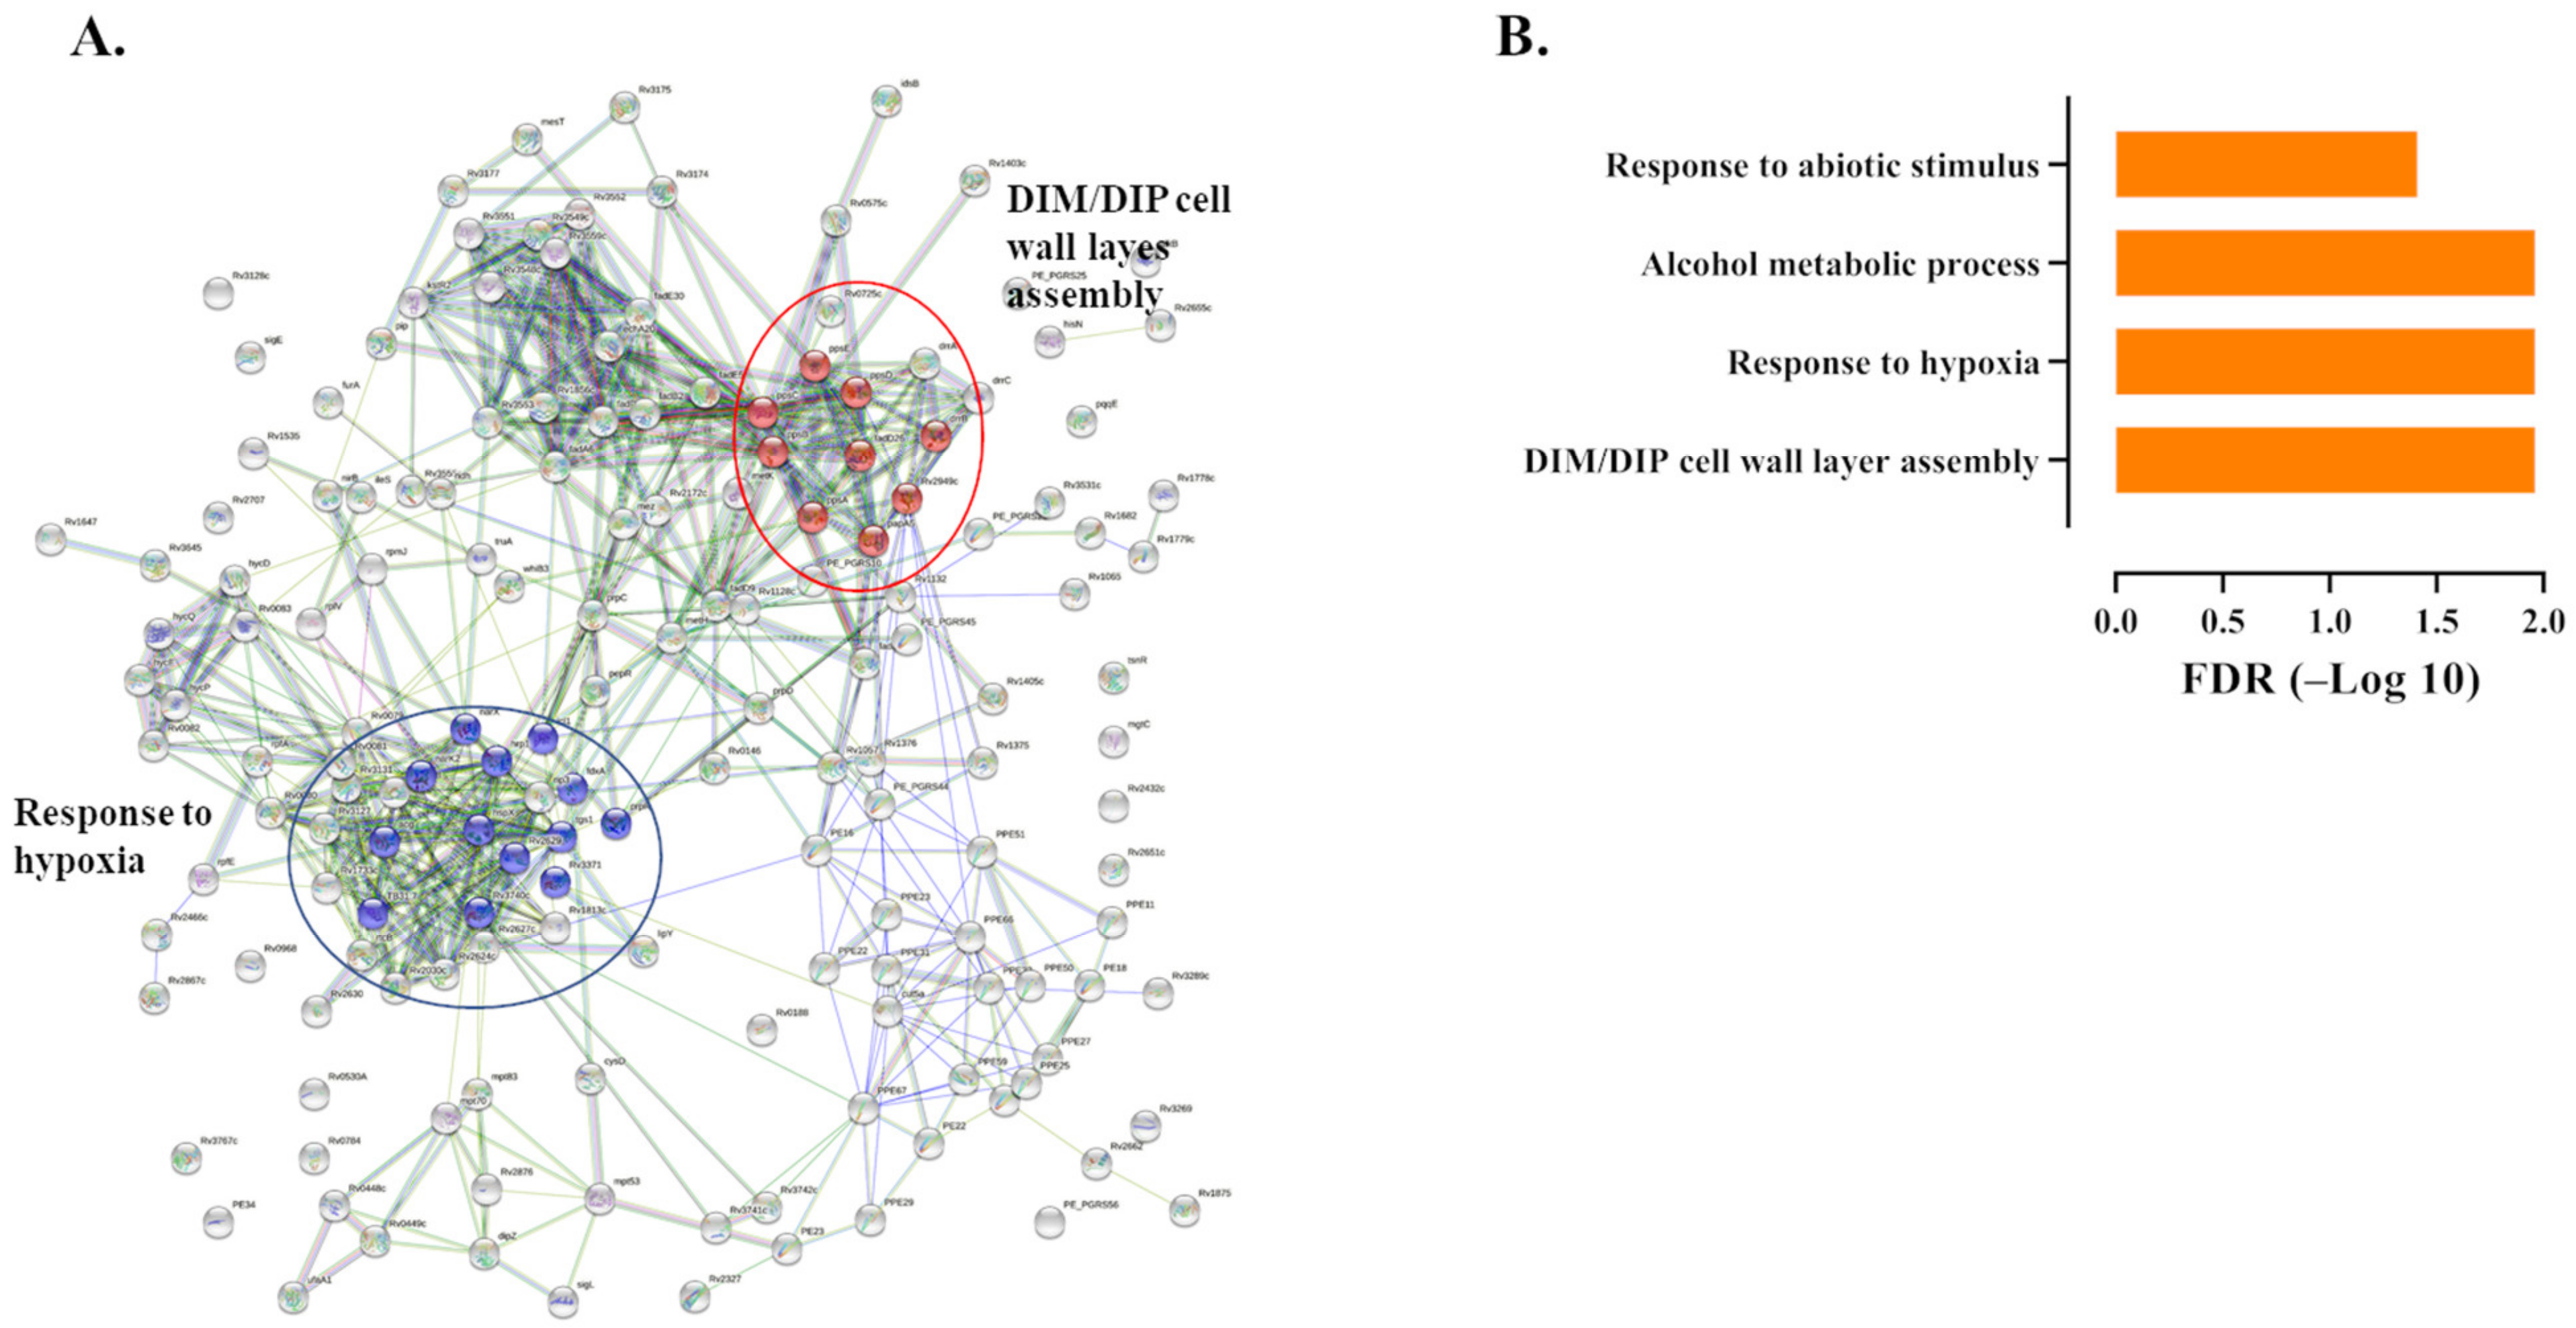
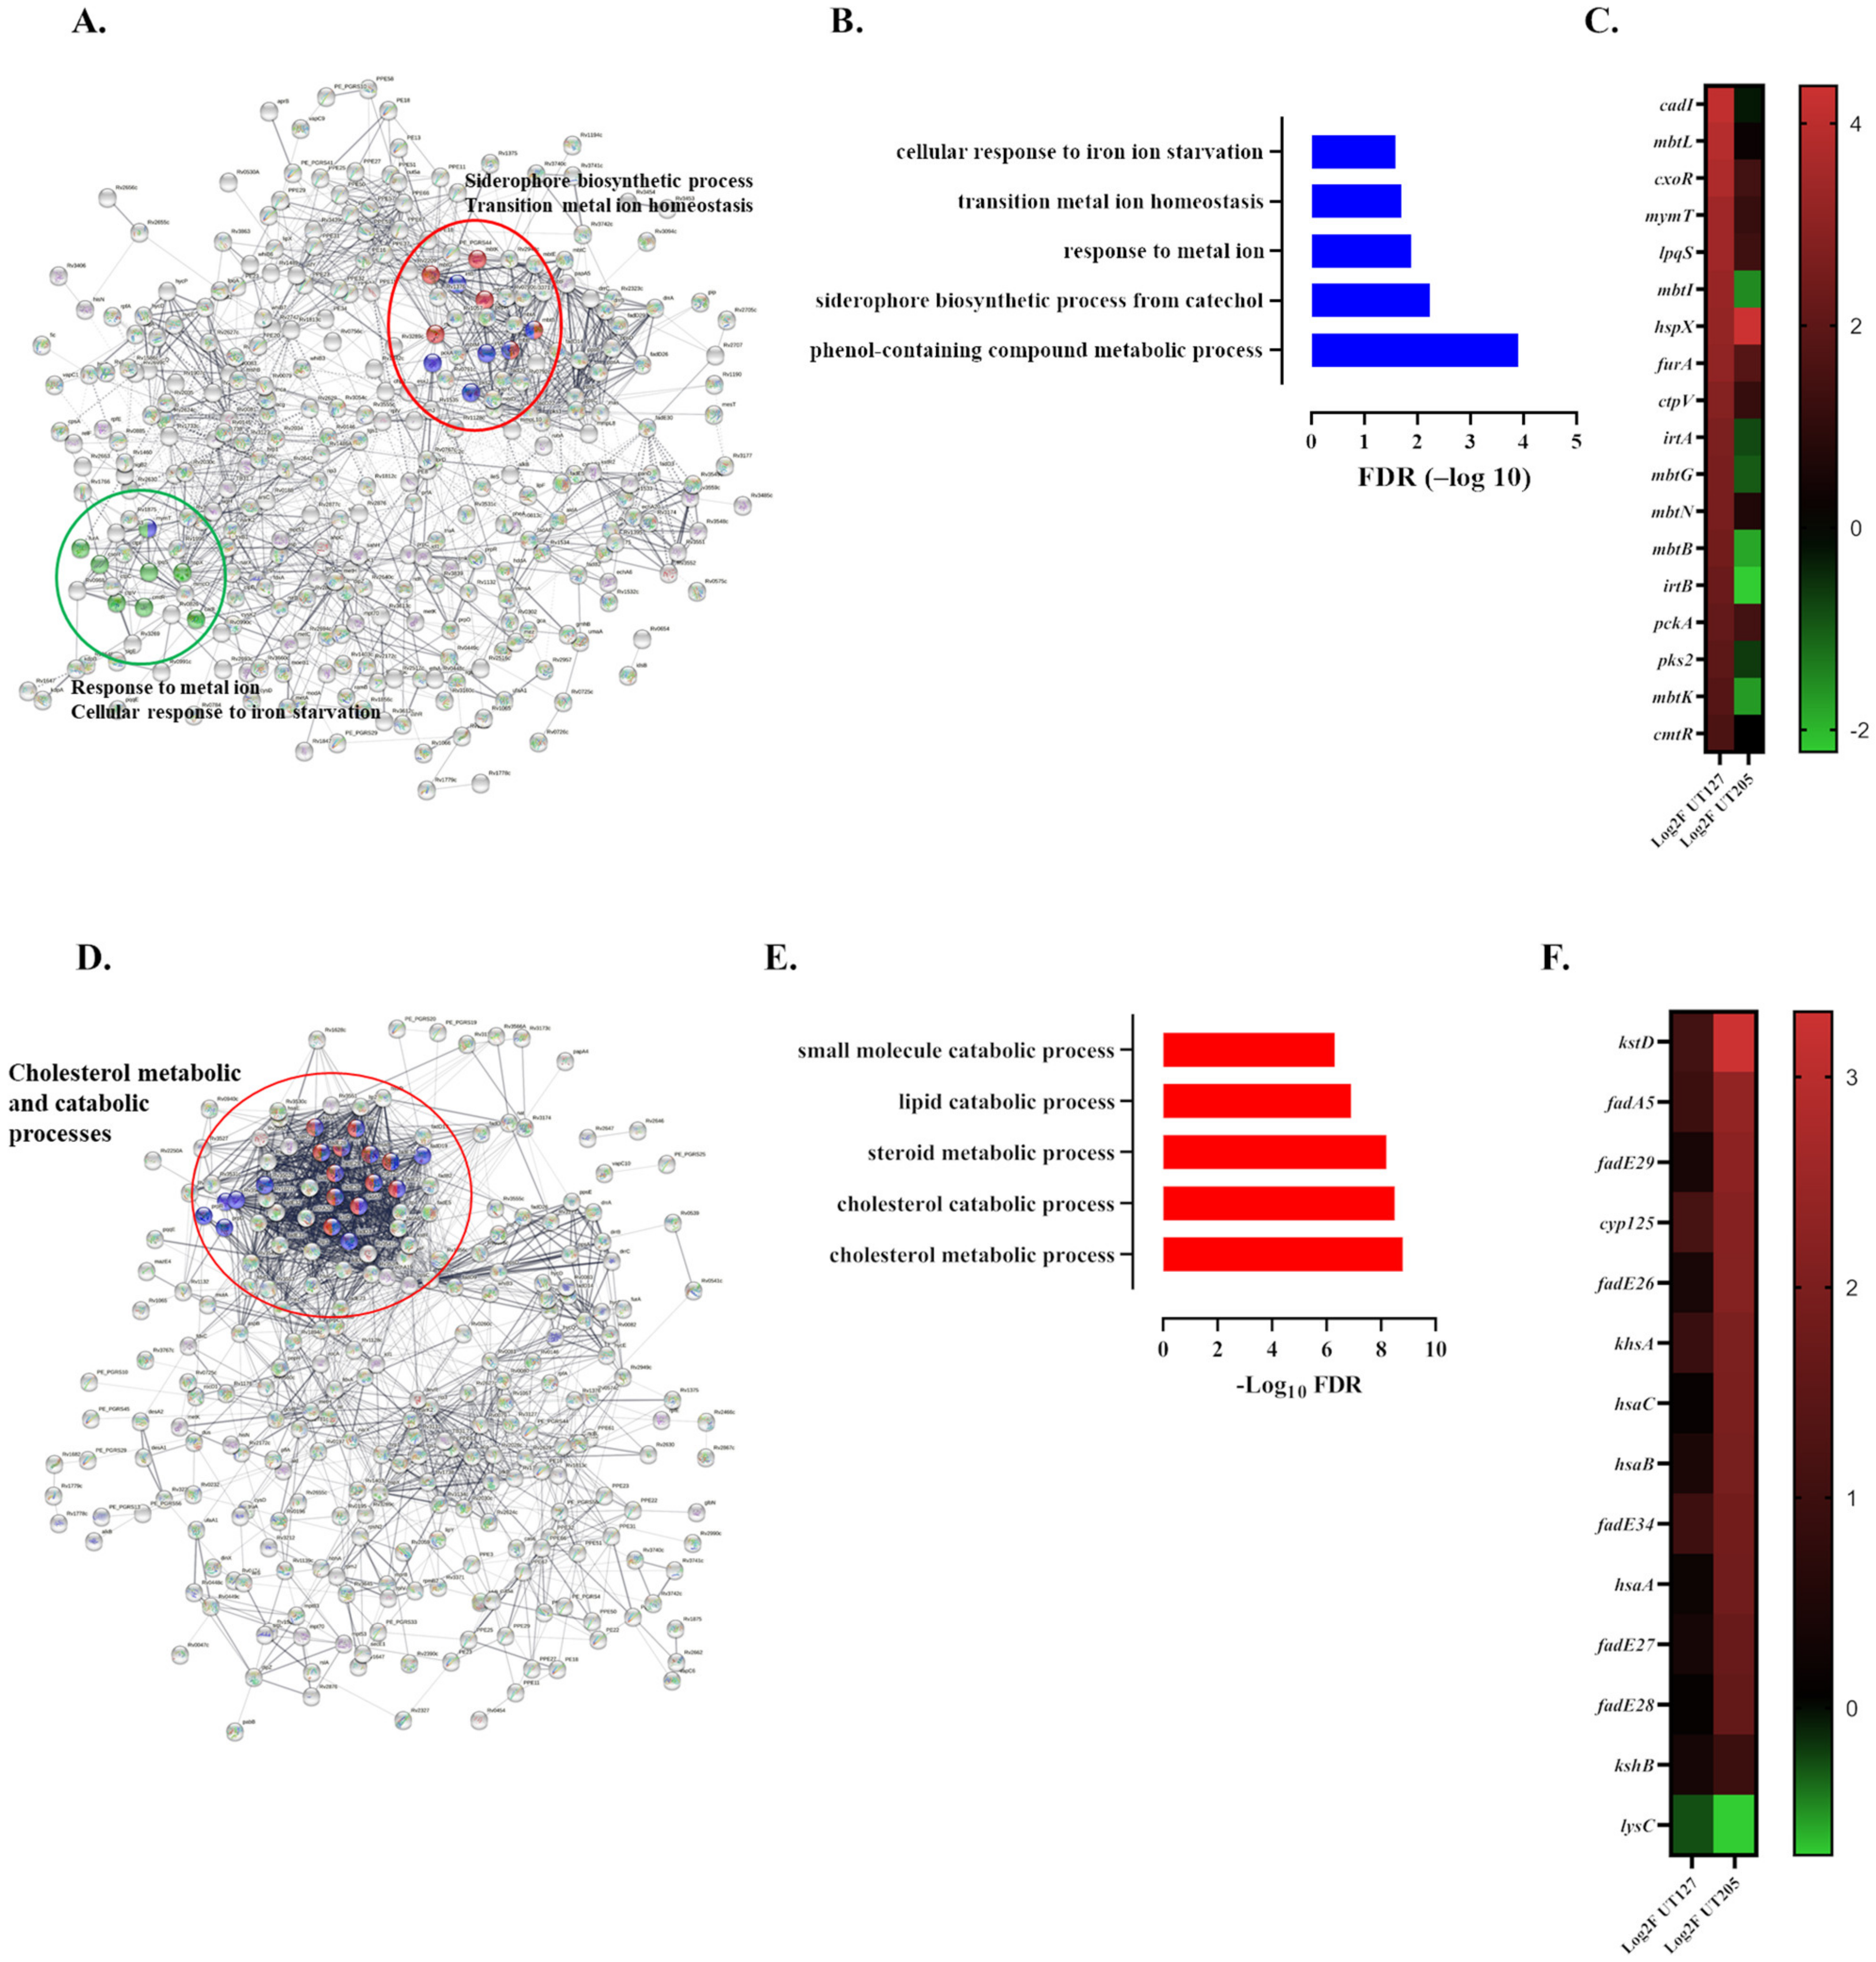
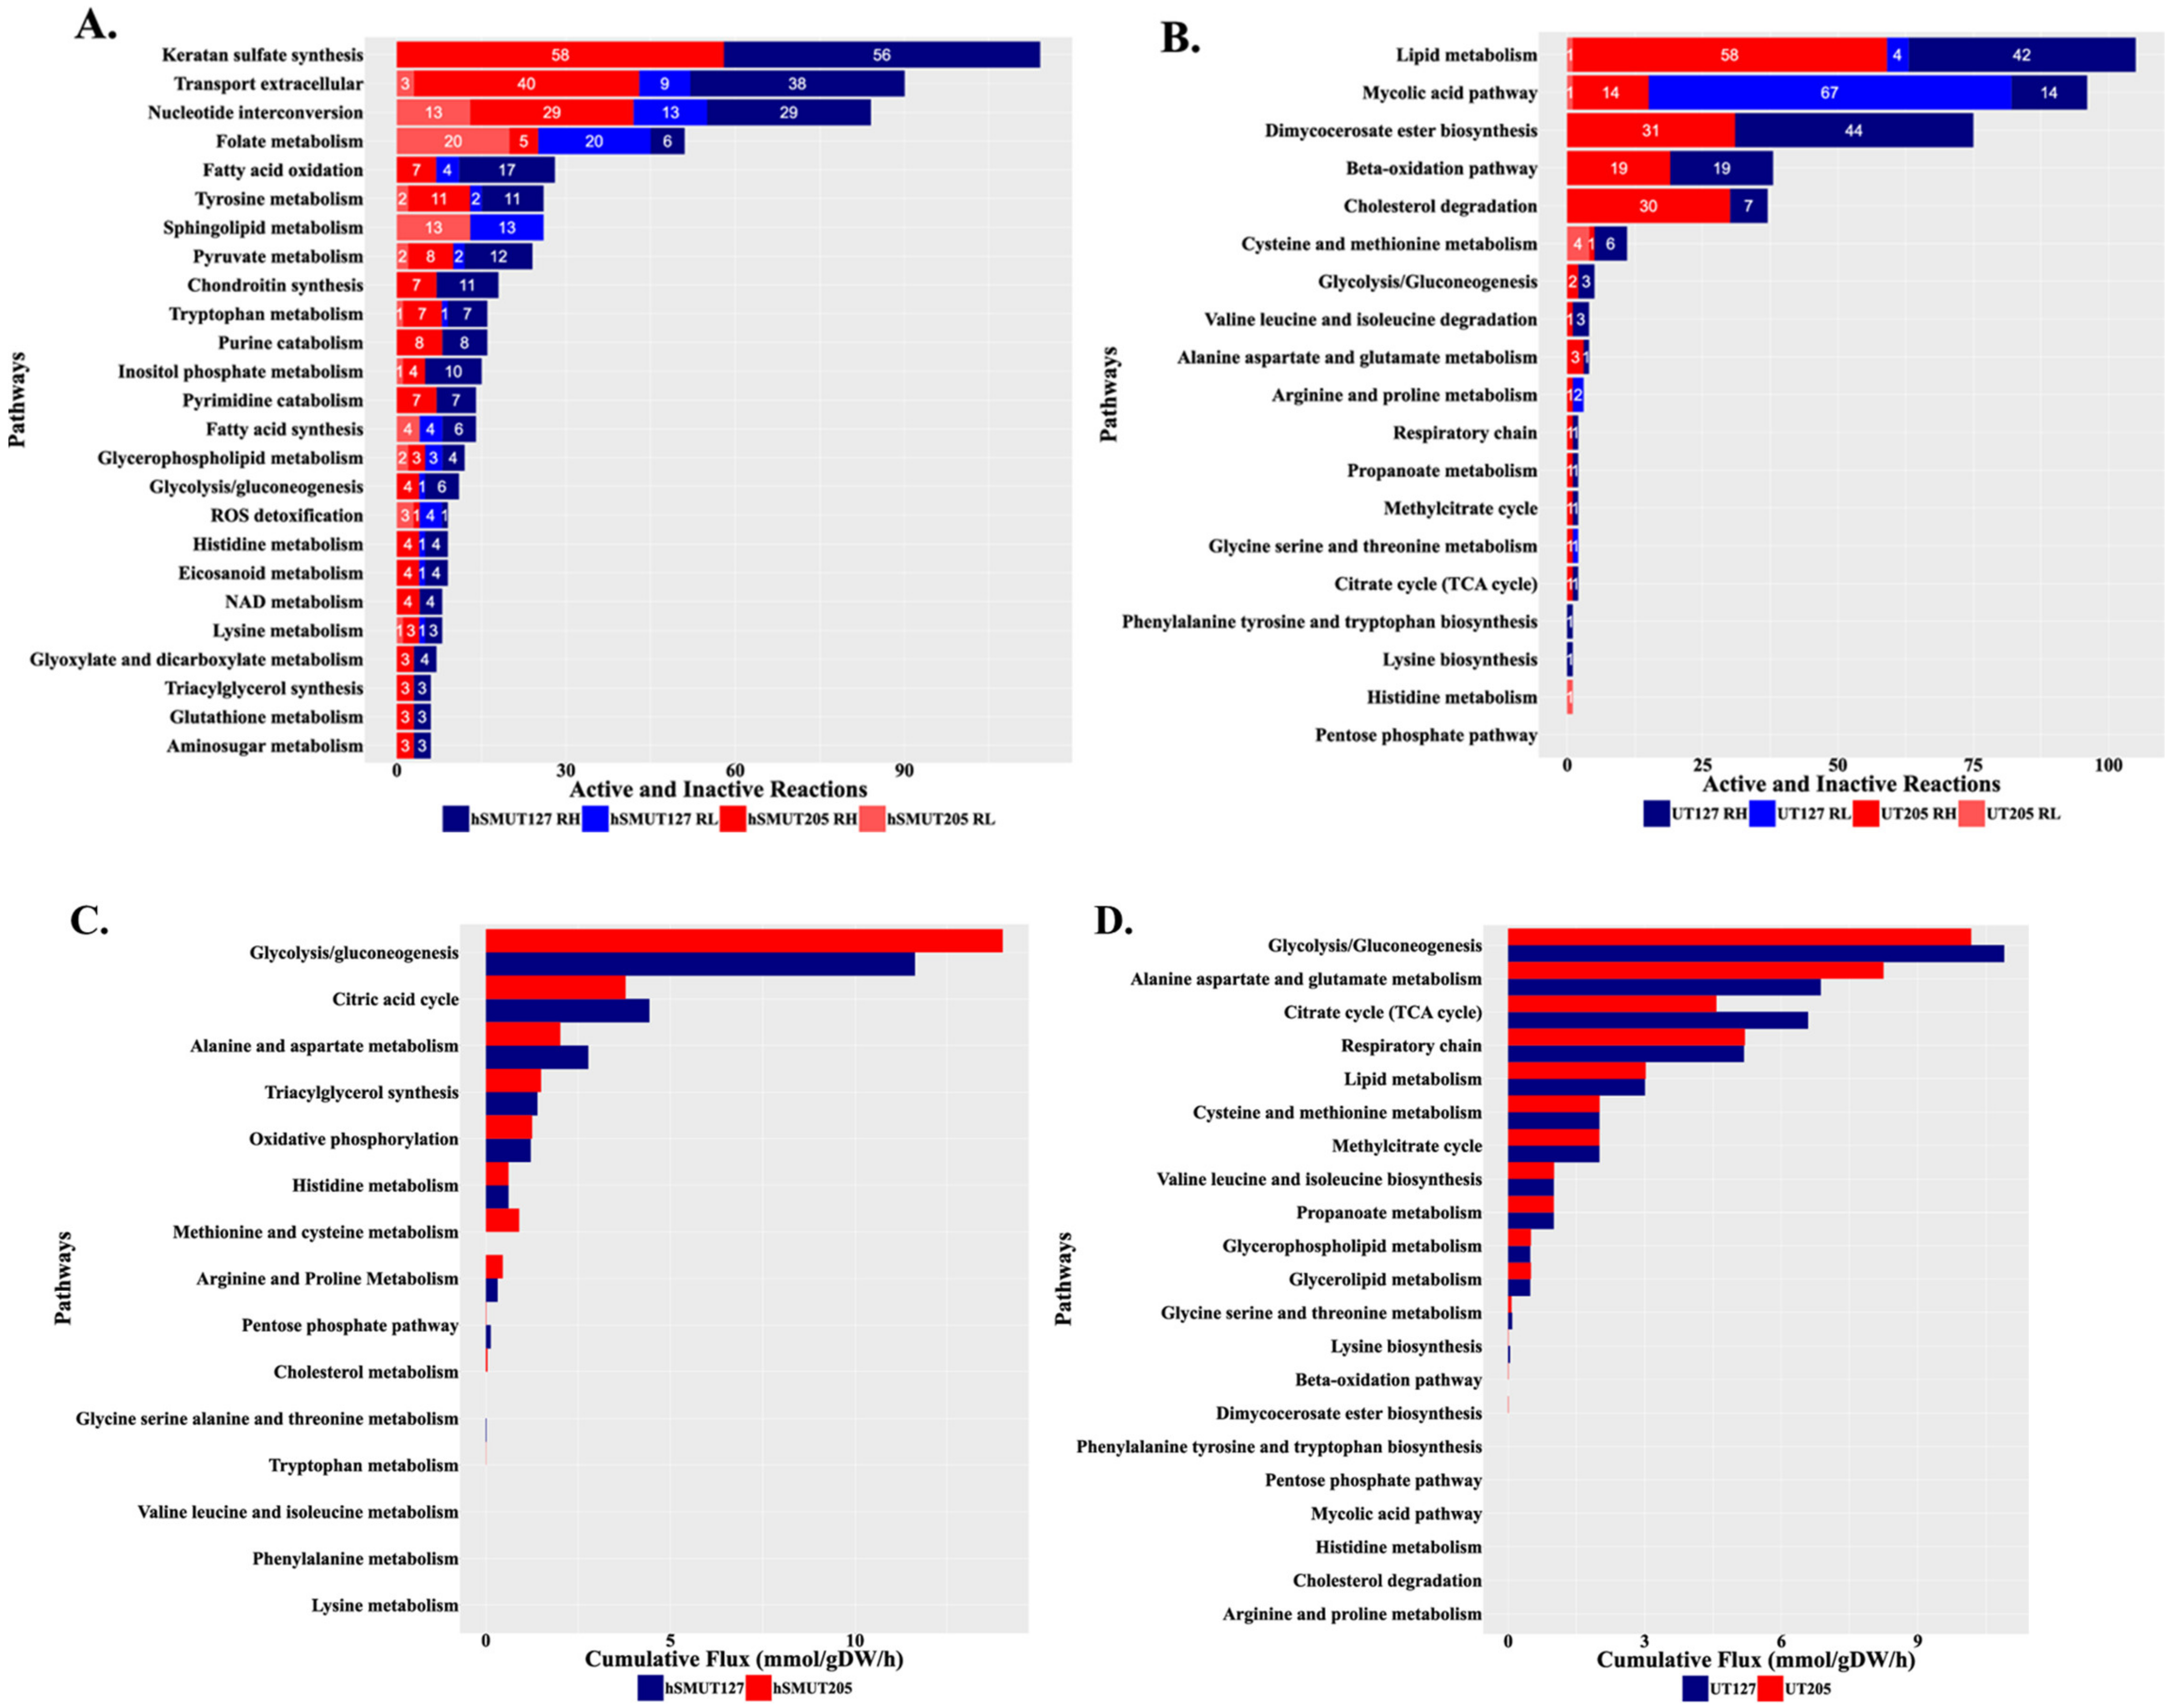
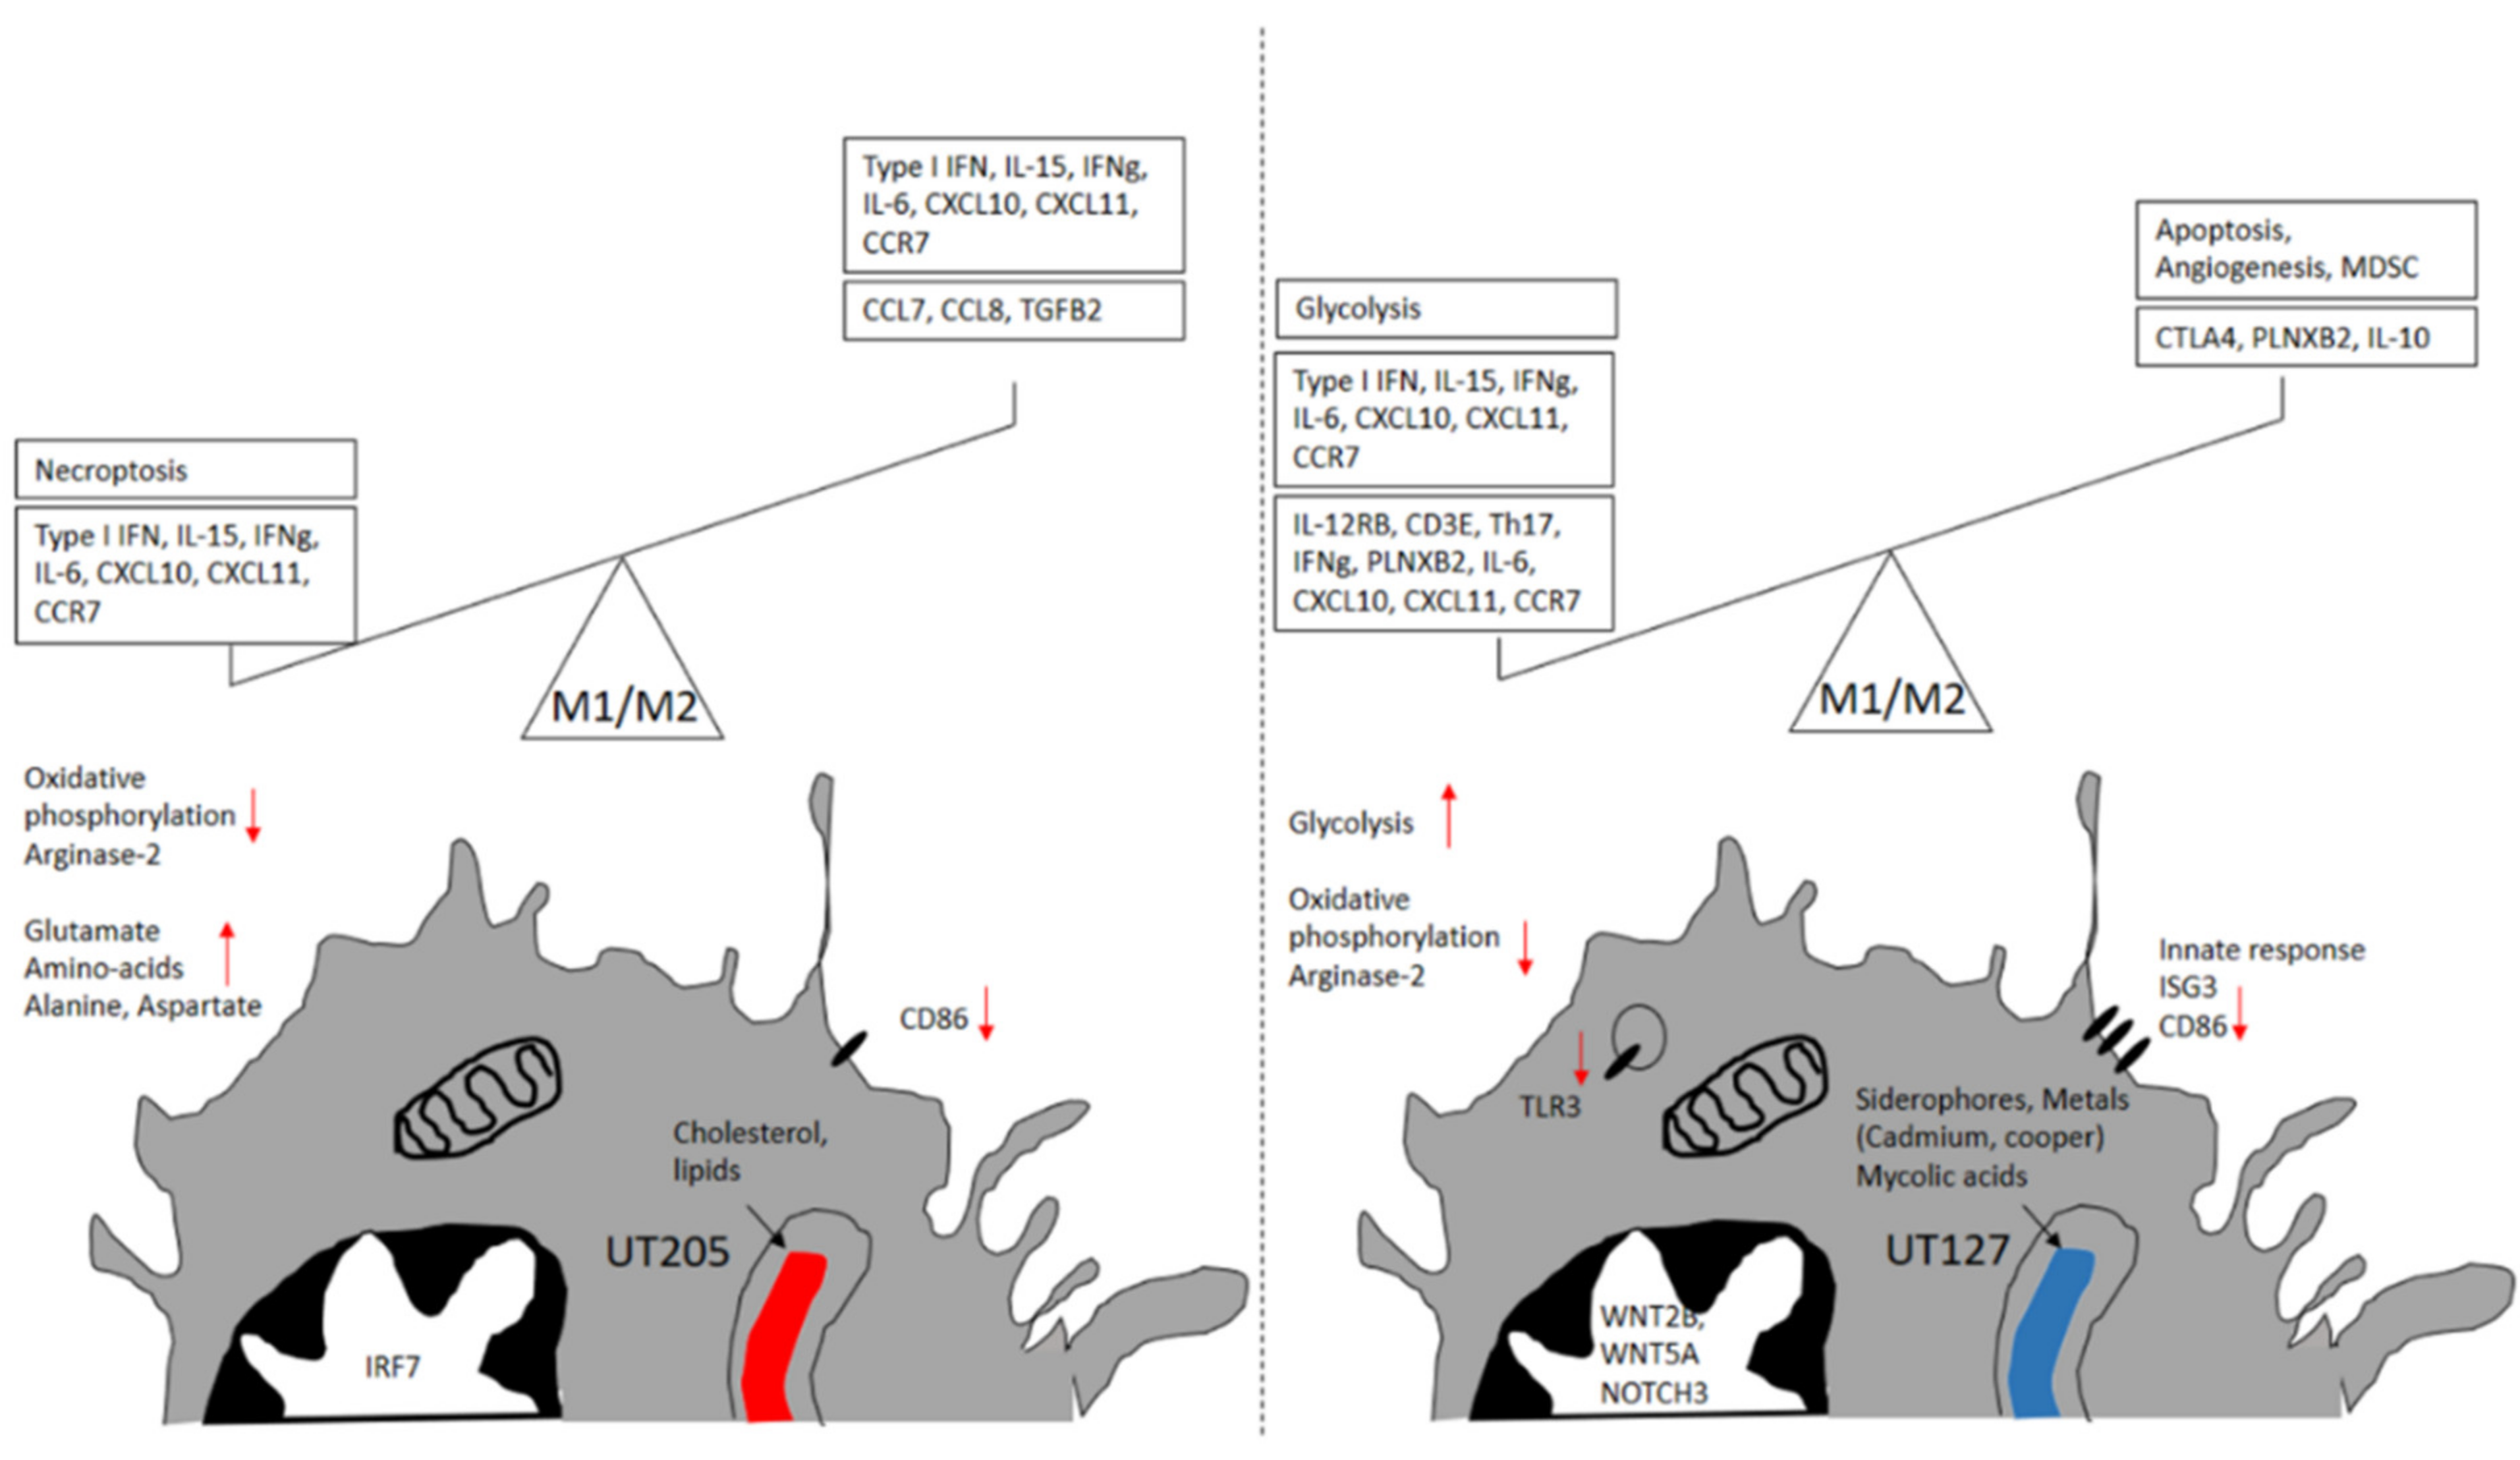
2.4. The Infecting Strain of M. tuberculosis Drives Distinct Metabolic Environments
3. Discussion
4. Materials and Methods
4.1. Mycobacterium tuberculosis Clinical Strains
4.2. Human Splenic Macrophages and Infection
4.3. Dual RNA-Seq
4.4. Bioinformatics and Differential Gene Expression Analysis
4.5. Enrichment Analysis
4.6. Host–Pathogen Genome-Scale Metabolic Network
4.7. Integration of Transcriptomics Data into Host–Pathogen Models of Mtb
Supplementary Materials
Author Contributions
Funding
Institutional Review Board Statement
Informed Consent Statement
Data Availability Statement
Acknowledgments
Conflicts of Interest
References
- WHO. Global Tuberculosis Report 2018. 2018. Available online: https://www.who.int/tb/publications/global_report/en/ (accessed on 1 November 2021).
- Pai, M.; Behr, M.A.; Dowdy, D.; Dheda, K.; Divangahi, M.; Boehme, C.C.; Ginsberg, A.; Swaminathan, S.; Spigelman, M.; Getahun, H.; et al. Tuberculosis. Nat. Rev. Dis. Primers 2016, 2, 16076. [Google Scholar] [CrossRef] [PubMed]
- Ryndak, M.B.; Laal, S. Mycobacterium tuberculosis Primary Infection and Dissemination: A Critical Role for Alveolar Epithelial Cells. Front. Cell. Infect. Microbiol. 2019, 9, 299. [Google Scholar] [CrossRef] [PubMed]
- Nahrendorf, M.; Swirski, F.K. Abandoning M1/M2 for a Network Model of Macrophage Function. Circ. Res. 2016, 119, 414–417. [Google Scholar] [CrossRef] [Green Version]
- Huang, L.; Nazarova, E.V.; Tan, S.; Liu, Y.; Russell, D.G. Growth of Mycobacterium tuberculosis in vivo segregates with host macrophage metabolism and ontogeny. J. Exp. Med. 2018, 215, 1135–1152. [Google Scholar] [CrossRef] [PubMed] [Green Version]
- Khan, A.; Singh, V.K.; Hunter, R.L.; Jagannath, C. Macrophage heterogeneity and plasticity in tuberculosis. J. Leukoc. Biol. 2019, 106, 275–282. [Google Scholar] [CrossRef] [PubMed]
- Pisu, D.; Huang, L.; Grenier, J.K.; Russell, D.G. Dual RNA-Seq of Mtb-Infected Macrophages In Vivo Reveals Ontologically Distinct Host-Pathogen Interactions. Cell Rep. 2020, 30, 335–350. [Google Scholar] [CrossRef] [PubMed]
- Manca, C.; Tsenova, L.; Bergtold, A.; Freeman, S.; Tovey, M.; Musser, J.M.; Barry, C.E., 3rd; Freedman, V.H.; Kaplan, G. Vir-ulence of a Mycobacterium tuberculosis clinical isolate in mice is determined by failure to induce Th1 type immunity and is associated with induction of IFN-alpha/beta. Proc. Natl. Acad. Sci. USA 2001, 98, 5752–5757. [Google Scholar] [CrossRef] [Green Version]
- Dormans, J.; Burger, M.; Aguilar, D.; Hernandez-Pando, R.; Kremer, K.; Roholl, P.; Arend, S.M.; Van Soolingen, D. Correlation of virulence, lung pathology, bacterial load and delayed type hypersensitivity responses after infection with different Mycobacterium tuberculosis genotypes in a BALB/c mouse model. Clin. Exp. Immunol. 2004, 137, 460–468. [Google Scholar] [CrossRef]
- Mourik, B.C.; De Steenwinkel, J.E.M.; De Knegt, G.J.; Huizinga, R.; Verbon, A.; Ottenhoff, T.H.M.; Van Soolingen, D.; Leenen, P.J.M. Mycobacterium tuberculosis clinical isolates of the Beijing and East-African Indian lineage induce fundamentally different host responses in mice compared to H37Rv. Sci. Rep. 2019, 9, 19922. [Google Scholar] [CrossRef]
- Bottai, D.; Frigui, W.; Sayes, F.; Di Luca, M.; Spadoni, D.; Pawlik, A.; Zoppo, M.; Orgeur, M.; Khanna, V.; Hardy, D.; et al. TbD1 deletion as a driver of the evolutionary success of modern epidemic Mycobacterium tuberculosis lineages. Nat. Commun. 2020, 11, 684. [Google Scholar] [CrossRef]
- Homolka, S.; Niemann, S.; Russell, D.; Rohde, K.H. Functional Genetic Diversity among Mycobacterium tuberculosis Complex Clinical Isolates: Delineation of Conserved Core and Lineage-Specific Transcriptomes during Intracellular Survival. PLoS Pathog. 2010, 6, e1000988. [Google Scholar] [CrossRef] [Green Version]
- Li, A.H.; Waddell, S.; Hinds, J.; Malloff, C.A.; Bains, M.; Hancock, R.E.; Lam, W.L.; Butcher, P.; Stokes, R.W. Contrasting Transcriptional Responses of a Virulent and an Attenuated Strain of Mycobacterium tuberculosis Infecting Macrophages. PLoS ONE 2010, 5, e11066. [Google Scholar] [CrossRef] [Green Version]
- Krishnan, N.; Malaga, W.; Constant, P.; Caws, M.; Chau, T.T.H.; Salmons, J.; Lan, N.T.N.; Bang, N.D.; Daffé, M.; Young, D.B.; et al. Mycobacterium tuberculosis Lineage Influences Innate Immune Response and Virulence and Is Associated with Distinct Cell Envelope Lipid Profiles. PLoS ONE 2011, 6, e23870. [Google Scholar] [CrossRef] [Green Version]
- Koo, M.-S.; Subbian, S.; Kaplan, G. Strain specific transcriptional response in Mycobacterium tuberculosis infected macrophages. Cell Commun. Signal. 2012, 10, 2. [Google Scholar] [CrossRef] [Green Version]
- Leisching, G.; Pietersen, R.D.; van Heerden, C.; van Helden, P.; Wiid, I.; Baker, B. RNAseq reveals hypervirulence-specific host responses to M. tuberculosis infection. Virulence 2017, 8, 848–858. [Google Scholar] [CrossRef] [Green Version]
- Reed, M.B.; Domenech, P.; Manca, C.; Su, H.; Barczak, A.K.; Kreiswirth, B.N.; Kaplan, G.; Barry, C.E. A glycolipid of hypervirulent tuberculosis strains that inhibits the innate immune response. Nature 2004, 431, 84–87. [Google Scholar] [CrossRef]
- Wang, C.; Peyron, P.; Mestre, O.; Kaplan, G.; Van Soolingen, D.; Gao, Q.; Gicquel, B.; Neyrolles, O. Innate Immune Response to Mycobacterium tuberculosis Beijing and Other Genotypes. PLoS ONE 2010, 5, e13594. [Google Scholar] [CrossRef]
- Portevin, D.; Gagneux, S.; Comas, I.; Young, D. Human Macrophage Responses to Clinical Isolates from the Mycobacterium tuberculosis Complex Discriminate between Ancient and Modern Lineages. PLoS Pathog. 2011, 7, e1001307. [Google Scholar] [CrossRef] [Green Version]
- Gao, Q.; Kripke, K.E.; Saldanha, A.J.; Yan, W.; Holmes, S.; Small, P.M. Gene expression diversity among Mycobacterium tuberculosis clinical isolates. Microbiology 2005, 151, 5–14. [Google Scholar] [CrossRef] [Green Version]
- Rose, G.; Cortes, T.; Comas, I.; Coscolla, M.; Gagneux, S.; Young, D.B. Mapping of Genotype–Phenotype Diversity among Clinical Isolates of Mycobacterium tuberculosis by Sequence-Based Transcriptional Profiling. Genome Biol. Evol. 2013, 5, 1849–1862. [Google Scholar] [CrossRef] [Green Version]
- Baena, A.; Cabarcas, F.; Alvarez-Eraso, K.L.; Isaza, J.P.; Alzate, J.F.; Barrera, L.F. Differential determinants of virulence in two Mycobacterium tuberculosis Colombian clinical isolates of the LAM09 family. Virulence 2019, 10, 695–710. [Google Scholar] [CrossRef] [Green Version]
- Kendall, S.L.; Rison, S.C.; Movahedzadeh, F.; Frita, R.; Stoker, N.G. What do microarrays really tell us about M. tuberculosis? Trends Microbiol. 2004, 12, 537–544. [Google Scholar] [CrossRef]
- Schnappinger, D.; Schoolnik, G.K.; Ehrt, S. Expression profiling of host pathogen interactions: How Mycobacterium tuberculosis and the macrophage adapt to one another. Microbes Infect. 2006, 8, 1132–1140. [Google Scholar] [CrossRef]
- Mukhopadhyay, S.; Nair, S.; Ghosh, S. Pathogenesis in tuberculosis: Transcriptomic approaches to unraveling virulence mechanisms and finding new drug targets. FEMS Microbiol. Rev. 2012, 36, 463–485. [Google Scholar] [CrossRef]
- Lavalett, L.; Rodriguez, H.; Ortega, H.; Sadee, W.; Schlesinger, L.S.; Barrera, L.F. Alveolar macrophages from tuberculosis patients display an altered inflammatory gene expression profile. Tuberculosis 2017, 107, 156–167. [Google Scholar] [CrossRef] [PubMed]
- Papp, A.C.; Azad, A.K.; Pietrzak, M.; Williams, A.; Handelman, S.; Igo, R.; Stein, C.; Hartmann, K.; Schlesinger, L.S.; Sadee, W. AmpliSeq transcriptome analysis of human alveolar and monocyte-derived macrophages over time in response to Mycobacterium tuberculosis infection. PLoS ONE 2018, 13, e0198221. [Google Scholar] [CrossRef]
- Lavalett, L.; Ortega, H.; Barrera, L.F. Human Alveolar and Splenic Macrophage Populations Display a Distinct Transcriptomic Response to Infection With Mycobacterium tuberculosis. Front. Immunol. 2020, 11, 630. [Google Scholar] [CrossRef] [PubMed] [Green Version]
- Westermann, A.J.; Barquist, L.; Vogel, J. Resolving host–pathogen interactions by dual RNA-seq. PLoS Pathog. 2017, 13, e1006033. [Google Scholar] [CrossRef] [Green Version]
- Zimmermann, M.; Kogadeeva, M.; Gengenbacher, M.; McEwen, G.; Mollenkopf, H.-J.; Zamboni, N.; Kaufmann, S.H.E.; Sauer, U. Integration of Metabolomics and Transcriptomics Reveals a Complex Diet of Mycobacterium tuberculosis during Early Macrophage Infection. mSystems 2017, 2, e00057-17. [Google Scholar] [CrossRef] [Green Version]
- Troha, K.; Ayres, J.S. Metabolic Adaptations to Infections at the Organismal Level. Trends Immunol. 2020, 41, 113–125. [Google Scholar] [CrossRef]
- Shi, L.; Jiang, Q.; Bushkin, Y.; Subbian, S.; Tyagi, S. Biphasic Dynamics of Macrophage Immunometabolism during Mycobacterium tuberculosis Infection. mBio 2019, 10, e02550-18. [Google Scholar] [CrossRef] [PubMed] [Green Version]
- Isaza, J.; Duque, C.; Gomez, V.; Robledo, J.; Barrera, L.; Alzate, J.F. Whole genome shotgun sequencing of one Colombian clinical isolate of Mycobacterium tuberculosis reveals DosR regulon gene deletions. FEMS Microbiol. Lett. 2012, 330, 113–120. [Google Scholar] [CrossRef] [PubMed]
- Duque, C.; Arroyo, L.; Ortega, H.; Montúfar, F.; Ortíz, B.; Rojas, M.; Barrera, L.F. Different responses of human mononuclear phagocyte populations to Mycobacterium tuberculosis. Tuberculosis 2014, 94, 111–122. [Google Scholar] [CrossRef] [PubMed]
- Lavalett, L.; Ortega, H.; Barrera, L.F. Infection of Monocytes From Tuberculosis Patients With Two Virulent Clinical Isolates of Mycobacterium tuberculosis Induces Alterations in Myeloid Effector Functions. Front. Cell. Infect. Microbiol. 2020, 10, 163. [Google Scholar] [CrossRef]
- Henao, J.; Sánchez, D.; Muñoz, C.H.; Mejía, N.; Arias, M.A.; García, L.F.; Barrera, L.F. Human splenic macrophages as a model for in vitro infection with Mycobacterium tuberculosis. Tuberculosis 2007, 87, 509–517. [Google Scholar] [CrossRef]
- Bhattacharya, S.; Dunn, P.; Thomas, C.; Smith, B.; Schaefer, H.; Chen, J.; Hu, Z.; Zalocusky, K.A.; Shankar, R.D.; Shen-Orr, S.S.; et al. ImmPort, toward repurposing of open access immunological assay data for translational and clinical research. Sci. Data 2018, 5, 180015. [Google Scholar] [CrossRef]
- Zalocusky, K.A.; Kan, M.J.; Hu, Z.; Dunn, P.; Thomson, E.; Wiser, J.; Bhattacharya, S.; Butte, A.J. The 10,000 Immunomes Project: Building a Resource for Human Immunology. Cell Rep. 2018, 25, 1995. [Google Scholar] [CrossRef] [Green Version]
- Young, M.D.; Wakefield, M.J.; Smyth, G.K.; Oshlack, A. Gene ontology analysis for RNA-seq: Accounting for selection bias. Genome Biol. 2010, 11, R14. [Google Scholar] [CrossRef] [Green Version]
- Tarca, A.L.; Draghici, S.; Khatri, P.; Hassan, S.S.; Mittal, P.; Kim, J.-S.; Kim, C.J.; Kusanovic, J.P.; Romero, R. A novel signaling pathway impact analysis. Bioinformatics 2008, 25, 75–82. [Google Scholar] [CrossRef] [Green Version]
- Munoz-Elias, E.J.; McKinney, J.D. Carbon metabolism of intracellular bacteria. Cell. Microbiol. 2006, 8, 10–22. [Google Scholar] [CrossRef]
- Laval, T.; Chaumont, L.; Demangel, C. Not too fat to fight: The emerging role of macrophage fatty acid metabolism in immunity to Mycobacterium tuberculosis. Immunol. Rev. 2021, 301, 84–97. [Google Scholar] [CrossRef]
- Haydel, S.E.; Clark-Curtiss, J.E. The Mycobacterium tuberculosis TrcR Response Regulator Represses Transcription of the Intracellularly Expressed Rv1057 Gene, Encoding a Seven-Bladed β-Propeller. J. Bacteriol. 2006, 188, 150–159. [Google Scholar] [CrossRef] [Green Version]
- Fu, J.; Zong, G.; Zhang, P.; Gu, Y.; Cao, G. Deletion of the beta-Propeller Protein Gene Rv1057 Reduces ESAT-6 Secretion and Intracellular Growth of Mycobacterium tuberculosis. Curr. Microbiol. 2018, 75, 401–409. [Google Scholar] [CrossRef]
- Yang, Q.; Zhang, M.; Chen, Q.; Chen, W.; Wei, C.; Qiao, K.; Ye, T.; Deng, G.; Li, J.; Zhu, J.; et al. Cutting Edge: Characterization of Human Tissue-Resident Memory T Cells at Different Infection Sites in Patients with Tuberculosis. J. Immunol. 2020, 204, 2331–2336. [Google Scholar] [CrossRef]
- Maya-Hoyos, M.; Rosales, C.; Novoa-Aponte, L.; Castillo, E.; Soto, C.Y. The P-type ATPase CtpF is a plasma membrane transporter mediating calcium efflux in Mycobacterium tuberculosis cells. Heliyon 2019, 5, e02852. [Google Scholar] [CrossRef]
- Garg, R.; Borbora, S.M.; Bansia, H.; Rao, S.; Singh, P.; Verma, R.; Balaji, K.N.; Nagaraja, V. Mycobacterium tuberculosis Calcium Pump CtpF Modulates the Autophagosome in an mTOR-Dependent Manner. Front. Cell. Infect. Microbiol. 2020, 10, 461. [Google Scholar] [CrossRef]
- Sherman, D.R.; Voskuil, M.; Schnappinger, D.; Liao, R.; Harrell, M.I.; Schoolnik, G.K. Regulation of the Mycobacterium tuberculosis hypoxic response gene encoding -crystallin. Proc. Natl. Acad. Sci. USA 2001, 98, 7534–7539. [Google Scholar] [CrossRef] [Green Version]
- Fisher, M.A.; Plikaytis, B.B.; Shinnick, T.M. Microarray Analysis of the Mycobacterium tuberculosis Transcriptional Response to the Acidic Conditions Found in Phagosomes. J. Bacteriol. 2002, 184, 4025–4032. [Google Scholar] [CrossRef] [Green Version]
- Neyrolles, O.; Wolschendorf, F.; Mitra, A.; Niederweis, M. Mycobacteria, metals, and the macrophage. Immunol. Rev. 2015, 264, 249–263. [Google Scholar] [CrossRef]
- Wolschendorf, F.; Ackart, D.; Shrestha, T.B.; Hascall-Dove, L.; Nolan, S.; Lamichhane, G.; Wang, Y.; Bossmann, S.H.; Basaraba, R.J.; Niederweis, M. Copper resistance is essential for virulence of Mycobacterium tuberculosis. Proc. Natl. Acad. Sci. USA 2011, 108, 1621–1626. [Google Scholar] [CrossRef] [Green Version]
- Pandey, A.K.; Sassetti, C.M. Mycobacterial persistence requires the utilization of host cholesterol. Proc. Natl. Acad. Sci. USA 2008, 105, 4376–4380. [Google Scholar] [CrossRef] [Green Version]
- Wilburn, K.M.; Fieweger, R.A.; VanderVen, B. Cholesterol and fatty acids grease the wheels of Mycobacterium tuberculosis pathogenesis. Pathog. Dis. 2018, 76, fty021. [Google Scholar] [CrossRef]
- Fenn, K.; Wong, C.T.; Darbari, V.C. Mycobacterium tuberculosis Uses Mce Proteins to Interfere With Host Cell Signaling. Front. Mol. Biosci. 2020, 6, 149. [Google Scholar] [CrossRef] [Green Version]
- Shimono, N.; Morici, L.; Casali, N.; Cantrell, S.; Sidders, B.; Ehrt, S.; Riley, L.W. Hypervirulent mutant of Mycobacterium tuberculosis resulting from disruption of the mce1 operon. Proc. Natl. Acad. Sci. USA 2003, 100, 15918–15923. [Google Scholar] [CrossRef] [Green Version]
- Lima, P.; Sidders, B.; Morici, L.; Reader, R.; Senaratne, R.; Casali, N.; Riley, L.W. Enhanced mortality despite control of lung infection in mice aerogenically infected with a Mycobacterium tuberculosis mce1 operon mutant. Microbes Infect. 2007, 9, 1285–1290. [Google Scholar] [CrossRef] [Green Version]
- Sequeira, P.C.; Senaratne, R.H.; Riley, L.W. Inhibition of toll-like receptor 2 (TLR-2)-mediated response in human alveolar epithelial cells by mycolic acids and Mycobacterium tuberculosis mce1 operon mutant. Pathog. Dis. 2014, 70, 132–140. [Google Scholar] [CrossRef] [Green Version]
- Queiroz, A.; Medina-Cleghorn, D.; Marjanovic, O.; Nomura, D.K.; Riley, L.W. Comparative metabolic profiling of mce1 operon mutant vs. wild-type Mycobacterium tuberculosis strains. Pathog. Dis. 2015, 73, ftv066. [Google Scholar] [CrossRef] [Green Version]
- Graham, J.E.; Clark-Curtiss, J.E. Identification of Mycobacterium tuberculosis RNAs synthesized in response to phagocytosis by human macrophages by selective capture of transcribed sequences (SCOTS). Proc. Natl. Acad. Sci. USA 1999, 96, 11554–11559. [Google Scholar] [CrossRef] [PubMed] [Green Version]
- Schnappinger, D.; Ehrt, S.; Voskuil, M.I.; Liu, Y.; Mangan, J.A.; Monahan, I.M.; Dolganov, G.; Efron, B.; Butcher, P.D.; Nathan, C.; et al. Transcriptional Adaptation of Mycobacterium tuberculosis within Macrophages: Insights into the Phagosomal Environment. J. Exp. Med. 2003, 198, 693–704. [Google Scholar] [CrossRef] [PubMed] [Green Version]
- Casali, N.; White, A.M.; Riley, L.W. Regulation of the Mycobacterium tuberculosis mce1 Operon. J. Bacteriol. 2006, 188, 441–449. [Google Scholar] [CrossRef] [PubMed] [Green Version]
- Vilchèze, C.; Weinrick, B.; Leung, L.; Jacobs, W.R. Plasticity ofMycobacterium tuberculosisNADH dehydrogenases and their role in virulence. Proc. Natl. Acad. Sci. USA 2018, 115, 1599–1604. [Google Scholar] [CrossRef] [Green Version]
- Velmurugan, K.; Chen, B.; Miller, J.L.; Azogue, S.; Gurses, S.; Hsu, T.; Glickman, M.; Jacobs, W.R., Jr.; Porcelli, S.A.; Briken, V. Mycobacterium tuberculosis nuoG Is a Virulence Gene That Inhibits Apoptosis of Infected Host Cells. PLoS Pathog. 2007, 3, e110. [Google Scholar] [CrossRef] [Green Version]
- Miller, J.L.; Velmurugan, K.; Cowan, M.J.; Briken, V. The Type I NADH Dehydrogenase of Mycobacterium tuberculosis Counters Phagosomal NOX2 Activity to Inhibit TNF-α-Mediated Host Cell Apoptosis. PLoS Pathog. 2010, 6, e1000864. [Google Scholar] [CrossRef]
- Blomgran, R.; Desvignes, L.; Briken, V.; Ernst, J.D. Mycobacterium tuberculosis Inhibits Neutrophil Apoptosis, Leading to Delayed Activation of Naive CD4 T cells. Cell Host Microbe 2012, 11, 81–90. [Google Scholar] [CrossRef] [Green Version]
- López-Agudelo, V.A.; Mendum, T.A.; Laing, E.; Wu, H.; Baena, A.; Barrera, L.F.; Beste, D.J.V.; Rios-Estepa, R. A systematic evaluation of Mycobacterium tuberculosis Genome-Scale Metabolic Networks. PLoS Comput. Biol. 2020, 16, e1007533. [Google Scholar] [CrossRef]
- Shlomi, T.; Cabili, M.N.; Herrgård, M.J.; Palsson, B.; Ruppin, E. Network-based prediction of human tissue-specific metabolism. Nat. Biotechnol. 2008, 26, 1003–1010. [Google Scholar] [CrossRef]
- Kim, M.K.; Lun, D.S. Methods for integration of transcriptomic data in genome-scale metabolic models. Comput. Struct. Biotechnol. J. 2014, 11, 59–65. [Google Scholar] [CrossRef] [Green Version]
- Billig, S.; Schneefeld, M.; Huber, C.; Grassl, G.A.; Eisenreich, W.; Bange, F.-C. Author Correction: Lactate oxidation facilitates growth of Mycobacterium tuberculosis in human macrophages. Sci. Rep. 2018, 8, 5241. [Google Scholar] [CrossRef]
- Kumar, R.; Singh, P.; Kolloli, A.; Shi, L.; Bushkin, Y.; Tyagi, S.; Subbian, S. Immunometabolism of Phagocytes During Mycobacterium tuberculosis Infection. Front. Mol. Biosci. 2019, 6, 105. [Google Scholar] [CrossRef] [Green Version]
- Howard, N.C.; Khader, S.A. Immunometabolism during Mycobacterium tuberculosis Infection. Trends Microbiol. 2020, 28, 832–850. [Google Scholar] [CrossRef]
- Gouzy, A.; Larrouy-Maumus, G.; Wu, T.D.; Peixoto, A.; Levillain, F.; Lugo-Villarino, G.; Guerquin-Kern, J.L.; de Carvalho, L.P.; Poquet, Y.; Neyrolles, O. Mycobacterium tuberculosis nitrogen assimilation and host colonization require aspartate. Nat. Chem. Biol. 2013, 9, 674–676. [Google Scholar] [CrossRef] [PubMed] [Green Version]
- Gouzy, A.; Larrouy-Maumus, G.; Bottai, D.; Levillain, F.; Dumas, A.; Wallach, J.B.; Caire-Brändli, I.; De Chastellier, C.; Wu, T.-D.; Poincloux, R.; et al. Mycobacterium tuberculosis Exploits Asparagine to Assimilate Nitrogen and Resist Acid Stress during Infection. PLoS Pathog. 2014, 10, e1003928. [Google Scholar] [CrossRef] [PubMed] [Green Version]
- Agapova, A.; Serafini, A.; Petridis, M.; Hunt, D.M.; Garza-Garcia, A.; Sohaskey, C.D.; de Carvalho, L.P.S. Flexible nitrogen utilisation by the metabolic generalist pathogen Mycobacterium tuberculosis. eLife 2019, 8, e41129. [Google Scholar] [CrossRef]
- Borah, K.; Beyss, M.; Theorell, A.; Wu, H.; Basu, P.; Mendum, T.A.; Nöh, K.; Beste, D.; McFadden, J. Intracellular Mycobacterium tuberculosis Exploits Multiple Host Nitrogen Sources during Growth in Human Macrophages. Cell Rep. 2019, 29, 3580–3591. [Google Scholar] [CrossRef] [PubMed]
- Moreira-Teixeira, L.; Mayer-Barber, K.; Sher, A.; O’Garra, A. Type I interferons in tuberculosis: Foe and occasionally friend. Exp. Med. 2018, 215, 1273–1285. [Google Scholar] [CrossRef] [PubMed] [Green Version]
- Moreira-Teixeira, L.; Tabone, O.; Graham, C.M.; Singhania, A.; Stavropoulos, E.; Redford, P.S.; Chakravarty, P.; Priestnall, S.L.; Suarez-Bonnet, A.; Herbert, E.; et al. Mouse transcriptome reveals potential signatures of protection and pathogenesis in human tuberculosis. Nat. Immunol. 2020, 21, 464–476. [Google Scholar] [CrossRef]
- Manca, C.; Tsenova, L.; Freeman, S.; Barczak, A.K.; Tovey, M.; Murray, P.J.; Barry, C.E.; Kaplan, G. HypervirulentM. tuberculosisW/Beijing Strains Upregulate Type I IFNs and Increase Expression of Negative Regulators of the Jak-Stat Pathway. J. Interf. Cytokine Res. 2005, 25, 694–701. [Google Scholar] [CrossRef]
- Wiens, K.E.; Ernst, J.D. The Mechanism for Type I Interferon Induction by Mycobacterium tuberculosis is Bacterial Strain-Dependent. PLoS Pathog. 2016, 12, e1005809. [Google Scholar] [CrossRef] [Green Version]
- Rattigan, K.M.; Pountain, A.; Regnault, C.; Achcar, F.; Vincent, I.; Goodyear, C.S.; Barrett, M.P. Metabolomic profiling of macrophages determines the discrete metabolomic signature and metabolomic interactome triggered by polarising immune stimuli. PLoS ONE 2018, 13, e0194126. [Google Scholar] [CrossRef]
- Viola, A.; Munari, F.; Sánchez-Rodríguez, R.; Scolaro, T.; Castegna, A. The Metabolic Signature of Macrophage Responses. Front. Immunol. 2019, 10, 1462. [Google Scholar] [CrossRef] [Green Version]
- Jha, A.K.; Huang, S.C.-C.; Sergushichev, A.; Lampropoulou, V.; Ivanova, Y.; Loginicheva, E.; Chmielewski, K.; Stewart, K.M.; Ashall, J.; Everts, B.; et al. Network Integration of Parallel Metabolic and Transcriptional Data Reveals Metabolic Modules that Regulate Macrophage Polarization. Immunity 2015, 42, 419–430. [Google Scholar] [CrossRef] [Green Version]
- Orecchioni, M.; Ghosheh, Y.; Pramod, A.B.; Ley, K. Macrophage Polarization: Different Gene Signatures in M1(LPS+) vs. Classically and M2(LPS–) vs. Alternatively Activated Macrophages. Front. Immunol. 2019, 10, 1084. [Google Scholar] [CrossRef]
- Lavin, Y.; Mortha, A.; Rahman, A.; Merad, M. Regulation of macrophage development and function in peripheral tissues. Nat. Rev. Immunol. 2015, 15, 731–744. [Google Scholar] [CrossRef] [Green Version]
- Mitsi, E.; Kamng’Ona, R.; Rylance, J.; Solorzano, C.; Reiné, J.; Mwandumba, H.C.; Ferreira, D.M.; Jambo, K.C. Human alveolar macrophages predominately express combined classical M1 and M2 surface markers in steady state. Respir. Res. 2018, 19, 66. [Google Scholar] [CrossRef] [Green Version]
- Higashi-Kuwata, N.; Jinnin, M.; Makino, T.; Fukushima, S.; Inoue, Y.; Muchemwa, F.C.; Yonemura, Y.; Komohara, Y.; Takeya, M.; Mitsuya, H.; et al. Characterization of monocyte/macrophage subsets in the skin and peripheral blood derived from patients with systemic sclerosis. Arthritis Res. Ther. 2010, 12, R128. [Google Scholar] [CrossRef] [Green Version]
- Soldano, S.; Trombetta, A.C.; Contini, P.; Tomatis, V.; Ruaro, B.; Brizzolara, R.; Montagna, P.; Sulli, A.; Paolino, S.; Pizzorni, C.; et al. Increase in circulating cells coexpressing M1 and M2 macrophage surface markers in patients with systemic sclerosis. Ann. Rheum. Dis. 2018, 77, 1842–1845. [Google Scholar] [CrossRef]
- Trombetta, A.C.; Soldano, S.; Contini, P.; Tomatis, V.; Ruaro, B.; Paolino, S.; Brizzolara, R.; Montagna, P.; Sulli, A.; Pizzorni, C.; et al. A circulating cell population showing both M1 and M2 monocyte/macrophage surface markers characterizes systemic sclerosis patients with lung involvement. Respir. Res. 2018, 19, 186. [Google Scholar] [CrossRef]
- Cumming, B.M.; Addicott, K.W.; Adamson, J.H.; Steyn, A.J. Mycobacterium tuberculosis induces decelerated bioenergetic metabolism in human macrophages. eLife 2018, 7, e39169. [Google Scholar] [CrossRef]
- Zhai, W.; Wu, F.; Zhang, Y.; Fu, Y.; Liu, Z. The Immune Escape Mechanisms of Mycobacterium Tuberculosis. Int. J. Mol. Sci. 2019, 20, 340. [Google Scholar] [CrossRef] [Green Version]
- Shin, J.-H.; Yang, J.-Y.; Jeon, B.-Y.; Yoon, Y.J.; Cho, S.-N.; Kang, Y.-H.; Ryu, D.H.; Hwang, G.-S. 1H NMR-based Metabolomic Profiling in Mice Infected with Mycobacterium tuberculosis. J. Proteome Res. 2011, 10, 2238–2247. [Google Scholar] [CrossRef]
- Gautier, E.L.; Chow, A.; Spanbroek, R.; Marcelin, G.; Greter, M.; Jakubzick, C.; Bogunovic, M.; Leboeuf, M.; van Rooijen, N.; Habenicht, A.J.; et al. Systemic analysis of PPARgamma in mouse macrophage populations reveals marked diversity in ex-pression with critical roles in resolution of inflammation and airway immunity. J. Immunol. 2012, 189, 2614–2624. [Google Scholar] [CrossRef] [Green Version]
- Del Corral, H.; París, S.C.; Marín, N.D.; Marín, D.M.; López, L.L.; Henao, H.M.; Martínez, T.; Villa, L.; Barrera, L.F.; Ortiz, B.L.; et al. IFNγ Response to Mycobacterium tuberculosis, Risk of Infection and Disease in Household Contacts of Tuberculosis Patients in Colombia. PLoS ONE 2009, 4, e8257. [Google Scholar] [CrossRef]
- Realpe, T.; Correa, N.; Rozo, J.C.; Ferro, B.; Gomez, V.; Zapata, E.; Ribon, W.; Puerto, G.; Castro, C.; Nieto, L.M.; et al. Population Structure among Mycobacterium tuberculosis Isolates from Pulmonary Tuberculosis Patients in Colombia. PLoS ONE 2014, 9, e93848. [Google Scholar] [CrossRef] [Green Version]
- Yam, K.C.; D’Angelo, I.; Kalscheuer, R.; Zhu, H.; Wang, J.-X.; Snieckus, V.; Ly, L.H.; Converse, P.J.; Jacobs, W.R., Jr.; Strynadka, N.; et al. Studies of a Ring-Cleaving Dioxygenase Illuminate the Role of Cholesterol Metabolism in the Pathogenesis of Mycobacterium tuberculosis. PLoS Pathog. 2009, 5, e1000344. [Google Scholar] [CrossRef] [PubMed]
- Berney, M.; Berney-Meyer, L. Mycobacterium tuberculosis in the Face of Host-Imposed Nutrient Limitation. Microbiol. Spectr. 2017, 5. [Google Scholar] [CrossRef] [PubMed] [Green Version]
- Piddington, D.L.; Kashkouli, A.; Buchmeier, N.A. Growth of Mycobacterium tuberculosis in a Defined Medium Is Very Restricted by Acid pH and Mg 2+ Levels. Infect. Immun. 2000, 68, 4518–4522. [Google Scholar] [CrossRef] [PubMed] [Green Version]
- Mariani, F.; Cappelli, G.; Riccardi, G.; Colizzi, V. Mycobacterium tuberculosis H37Rv comparative gene-expression analysis in synthetic medium and human macrophage. Gene 2000, 253, 281–291. [Google Scholar] [CrossRef]
- Shleeva, M.O.; Bagramyan, K.; Telkov, M.V.; Mukamolova, G.V.; Young, M.; Kell, D.; Kaprelyants, A.S. Formation and resuscitation of ‘non-culturable’ cells of Rhodococcus rhodochrous and Mycobacterium tuberculosis in prolonged stationary phase. Microbiology 2002, 148, 1581–1591. [Google Scholar] [CrossRef] [Green Version]
- Florio, W.; Batoni, G.; Esin, S.; Bottai, D.; Maisetta, G.; Favilli, F.; Brancatisano, F.L.; Campa, M. Influence of culture medium on the resistance and response of Mycobacterium bovis BCG to reactive nitrogen intermediates. Microbes Infect. 2006, 8, 434–441. [Google Scholar] [CrossRef]
- Sakthi, S.; Narayanan, S. The lpqS knockout mutant of Mycobacterium tuberculosis is attenuated in Macrophages. Microbiol. Res. 2013, 168, 407–414. [Google Scholar] [CrossRef]
- Goodsmith, N.; Guo, X.V.; Vandal, O.H.; Vaubourgeix, J.; Wang, R.; Botella, H.; Song, S.; Bhatt, K.; Liba, A.; Salgame, P.; et al. Disruption of an M. tuberculosis membrane protein causes a magnesi-um-dependent cell division defect and failure to persist in mice. PLoS Pathog. 2015, 11, e1004645. [Google Scholar] [CrossRef] [Green Version]
- Crowle, A.J.; May, M. Preliminary demonstration of human tuberculoimmunity in vitro. Infect. Immun. 1981, 31, 453–464. [Google Scholar] [CrossRef] [Green Version]
- Rienksma, R.A.; Suarez-Diez, M.; Mollenkopf, H.-J.; Dolganov, G.M.; Dorhoi, A.; Schoolnik, G.K.; Santos, V.A.M.D.; Kaufmann, S.H.; Schaap, P.J.; Gengenbacher, M. Comprehensive insights into transcriptional adaptation of intracellular mycobacteria by microbe-enriched dual RNA sequencing. BMC Genom. 2015, 16, 34. [Google Scholar] [CrossRef] [Green Version]
- Dobin, A.; Davis, C.A.; Schlesinger, F.; Drenkow, J.; Zaleski, C.; Jha, S.; Batut, P.; Chaisson, M.; Gingeras, T.R. STAR: Ultrafast universal RNA-seq aligner. Bioinformatics 2013, 29, 15–21. [Google Scholar] [CrossRef]
- Robinson, M.D.; McCarthy, D.J.; Smyth, G.K. EdgeR: A Bioconductor package for differential expression analysis of digital gene expression data. Bioinformatics 2010, 26, 139–140. [Google Scholar] [CrossRef] [Green Version]
- Langmead, B.; Salzberg, S.L. Fast gapped-read alignment with Bowtie 2. Nat. Methods 2012, 9, 357–359. [Google Scholar] [CrossRef] [Green Version]
- Anders, S.; Pyl, P.T.; Huber, W. HTSeq—A Python framework to work with high-throughput sequencing data. Bioinformatics 2015, 31, 166–169. [Google Scholar] [CrossRef]
- Benjamini, Y.; Hochberg, Y. Controlling the False Discovery Rate: A Practical and Powerful Approach to Multiple Testing. J. R. Stat. Soc. Ser. B 1995, 57, 289–300. [Google Scholar] [CrossRef]
- Jensen, L.J.; Kuhn, M.; Stark, M.; Chaffron, S.; Creevey, C.; Muller, J.; Doerks, T.; Julien, P.; Roth, A.; Simonovic, M.; et al. STRING 8--a global view on proteins and their functional interactions in 630 organisms. Nucleic Acids Res. 2008, 37, D412–D416. [Google Scholar] [CrossRef]
- Szklarczyk, D.; Morris, J.H.; Cook, H.; Kuhn, M.; Wyder, S.; Simonovic, M.; Santos, A.; Doncheva, N.T.; Roth, A.; Bork, P.; et al. The STRING database in 2017: Quality-controlled protein–protein association networks, made broadly accessible. Nucleic Acids Res. 2017, 45, D362–D368. [Google Scholar] [CrossRef]
- Jamshidi, N.; Raghunathan, A. Cell scale host-pathogen modeling: Another branch in the evolution of constraint-based methods. Front Microbiol. 2015, 6, 1032. [Google Scholar] [CrossRef] [Green Version]
- Swainston, N.; Smallbone, K.; Hefzi, H.; Dobson, P.D.; Brewer, J.; Hanscho, M.; Zielinski, D.C.; Ang, K.S.; Gardiner, N.; Gutierrez, J.M.; et al. Recon 2.2: From reconstruction to model of human metabolism. Metabolomics 2016, 12, 109. [Google Scholar] [CrossRef]
- Bordbar, A.; Monk, J.M.; King, Z.; Palsson, B.O. Constraint-based models predict metabolic and associated cellular functions. Nat. Rev. Genet. 2014, 15, 107–120. [Google Scholar] [CrossRef]
- Duarte, N.C.; Becker, S.A.; Jamshidi, N.; Thiele, I.; Mo, M.L.; Vo, T.D.; Srivas, R.; Palsson, B. Global reconstruction of the human metabolic network based on genomic and bibliomic data. Proc. Natl. Acad. Sci. USA 2007, 104, 1777–1782. [Google Scholar] [CrossRef] [Green Version]
- Zur, H.; Ruppin, E.; Shlomi, T. iMAT: An integrative metabolic analysis tool. Bioinformatics 2010, 26, 3140–3142. [Google Scholar] [CrossRef]
- Mahadevan, R.; Schilling, C.H. The effects of alternate optimal solutions in constraint-based genome-scale metabolic models. Metab. Eng. 2003, 5, 264–276. [Google Scholar] [CrossRef] [PubMed]


Publisher’s Note: MDPI stays neutral with regard to jurisdictional claims in published maps and institutional affiliations. |
© 2022 by the authors. Licensee MDPI, Basel, Switzerland. This article is an open access article distributed under the terms and conditions of the Creative Commons Attribution (CC BY) license (https://creativecommons.org/licenses/by/4.0/).
Share and Cite
López-Agudelo, V.A.; Baena, A.; Barrera, V.; Cabarcas, F.; Alzate, J.F.; Beste, D.J.V.; Ríos-Estepa, R.; Barrera, L.F. Dual RNA Sequencing of Mycobacterium tuberculosis-Infected Human Splenic Macrophages Reveals a Strain-Dependent Host–Pathogen Response to Infection. Int. J. Mol. Sci. 2022, 23, 1803. https://0-doi-org.brum.beds.ac.uk/10.3390/ijms23031803
López-Agudelo VA, Baena A, Barrera V, Cabarcas F, Alzate JF, Beste DJV, Ríos-Estepa R, Barrera LF. Dual RNA Sequencing of Mycobacterium tuberculosis-Infected Human Splenic Macrophages Reveals a Strain-Dependent Host–Pathogen Response to Infection. International Journal of Molecular Sciences. 2022; 23(3):1803. https://0-doi-org.brum.beds.ac.uk/10.3390/ijms23031803
Chicago/Turabian StyleLópez-Agudelo, Víctor A., Andres Baena, Vianey Barrera, Felipe Cabarcas, Juan F. Alzate, Dany J. V. Beste, Rigoberto Ríos-Estepa, and Luis F. Barrera. 2022. "Dual RNA Sequencing of Mycobacterium tuberculosis-Infected Human Splenic Macrophages Reveals a Strain-Dependent Host–Pathogen Response to Infection" International Journal of Molecular Sciences 23, no. 3: 1803. https://0-doi-org.brum.beds.ac.uk/10.3390/ijms23031803