
Fluorescent Silica Nanoparticles Targeting Mitochondria: Trafficking in Myeloid Cells and Application as Doxorubicin Delivery System in Breast Cancer Cells


 , ,
, , 
 , , and
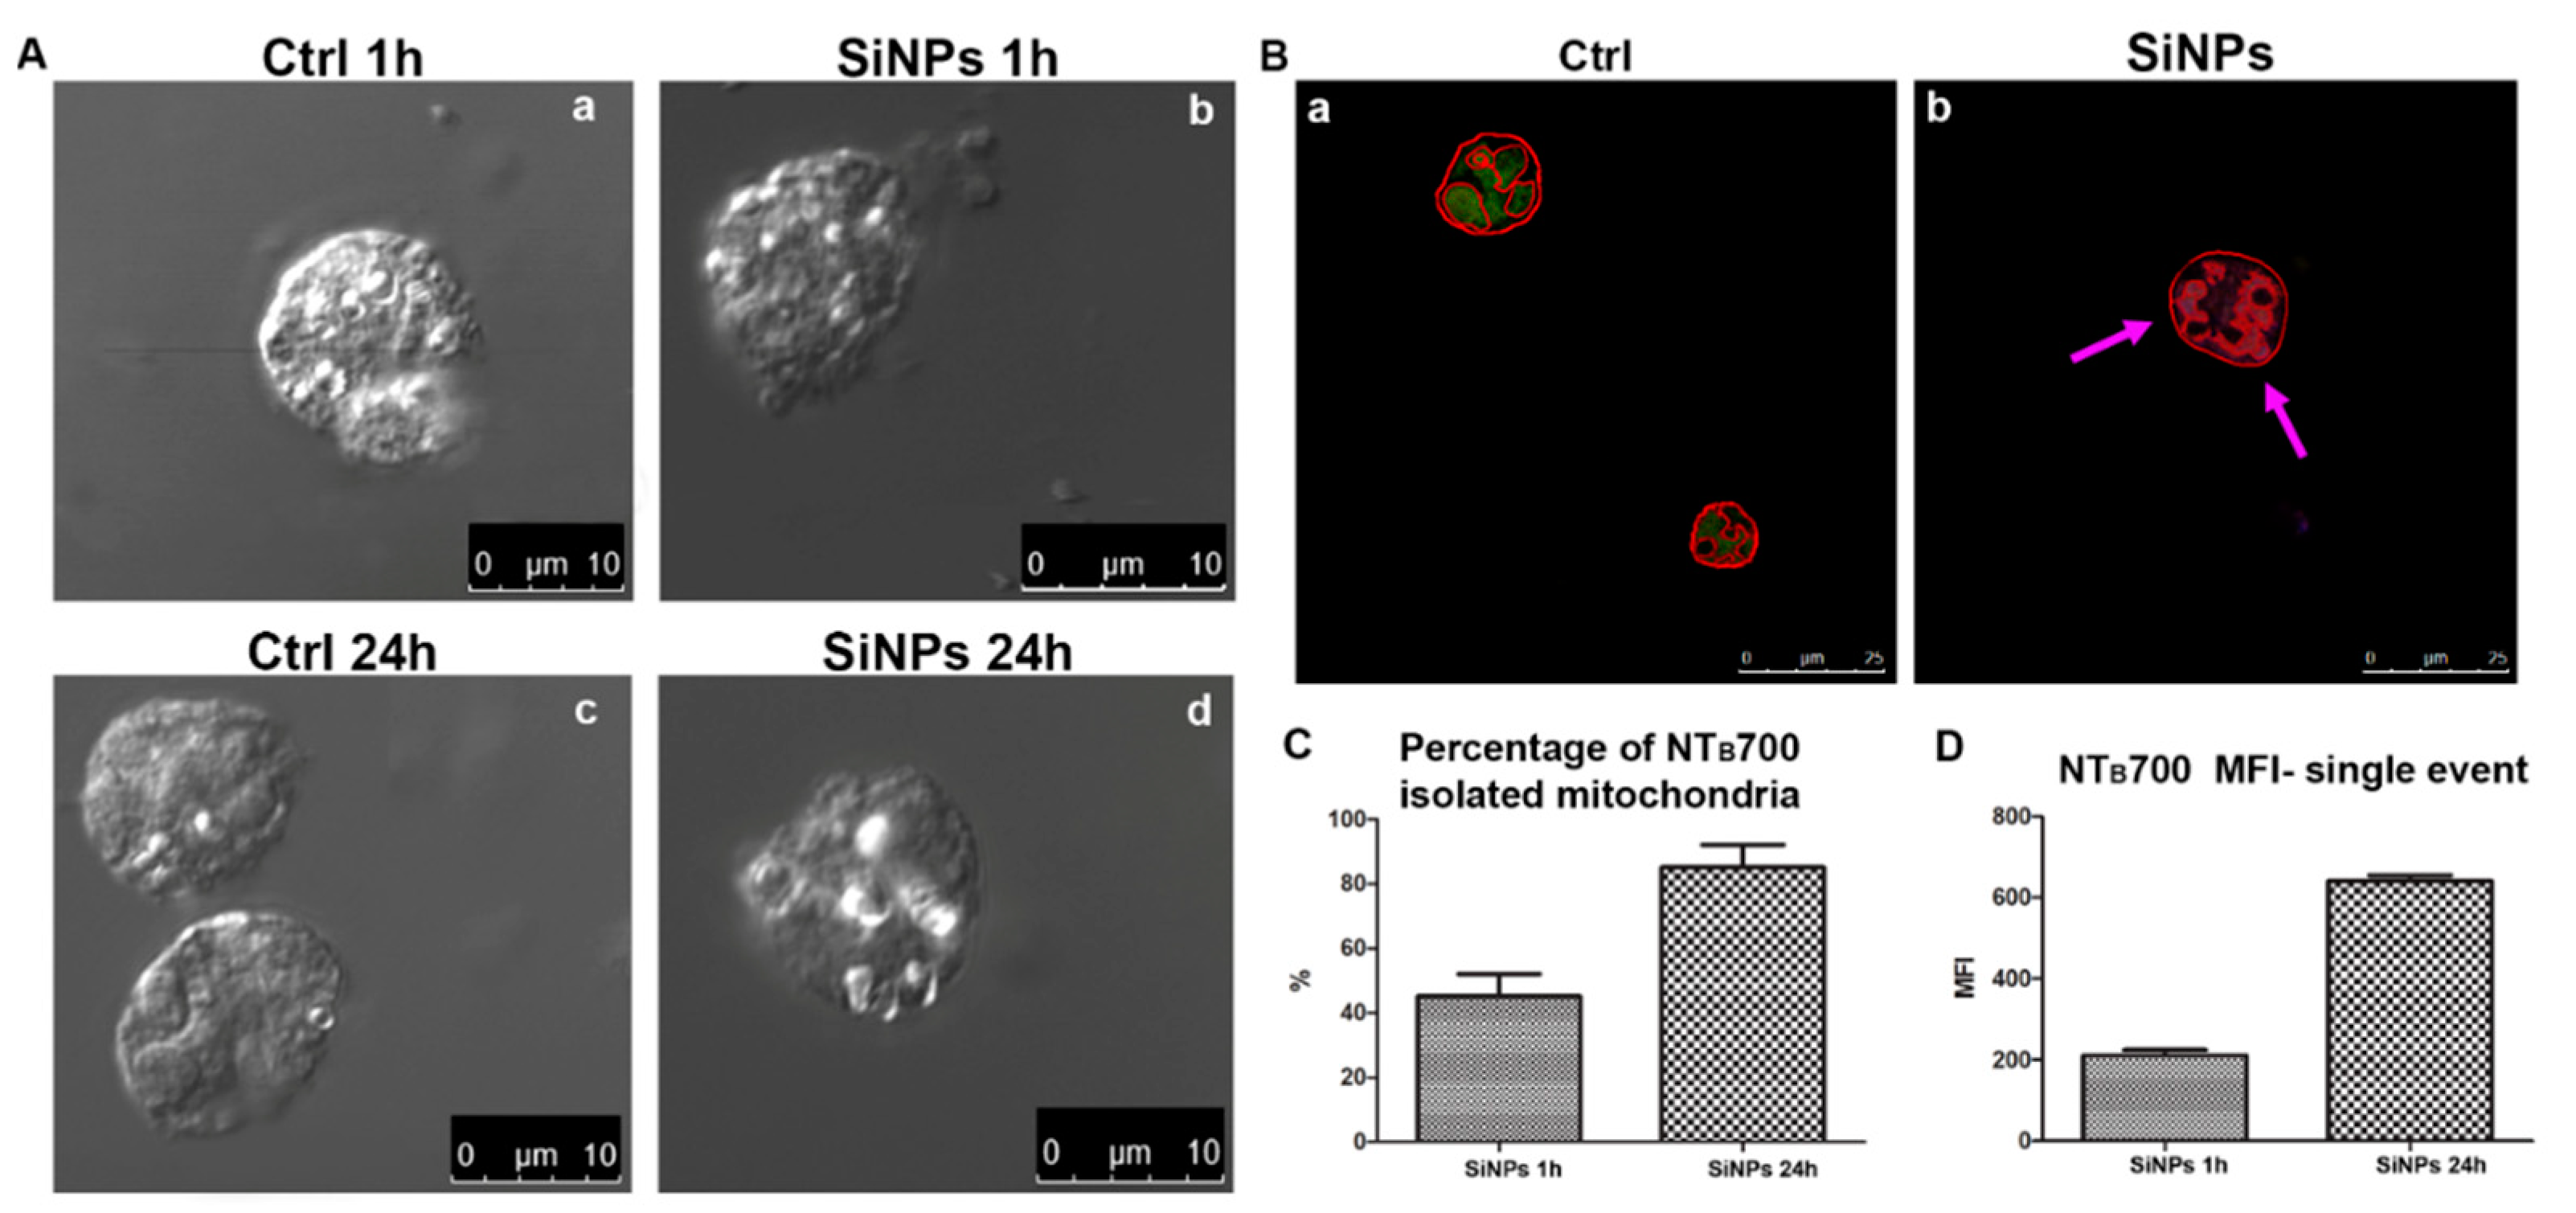
Abstract
:1. Introduction
2. Results and Discussion
2.1. In-Depth Analysis of Fluorescent SiNPs Localization and Effects on Isolated Mitochondria
- (1)
- Cells after 1 h maintain the ability to synthesize GSH in the cytosol and its transport to mitochondria is not compromised; indeed the transport is increased in respect to control cells, as demonstrated by data on mitochondrial GSH.
- (2)
- After 24 h, total GSH of SiNPs treated-cells is higher than control cells and mitochondrial GSH is slightly reduced, suggesting that the NP filled peri-mitochondrial space, may impair specific inner mitochondrial membrane (IMM) carriers, able to transport GSH.
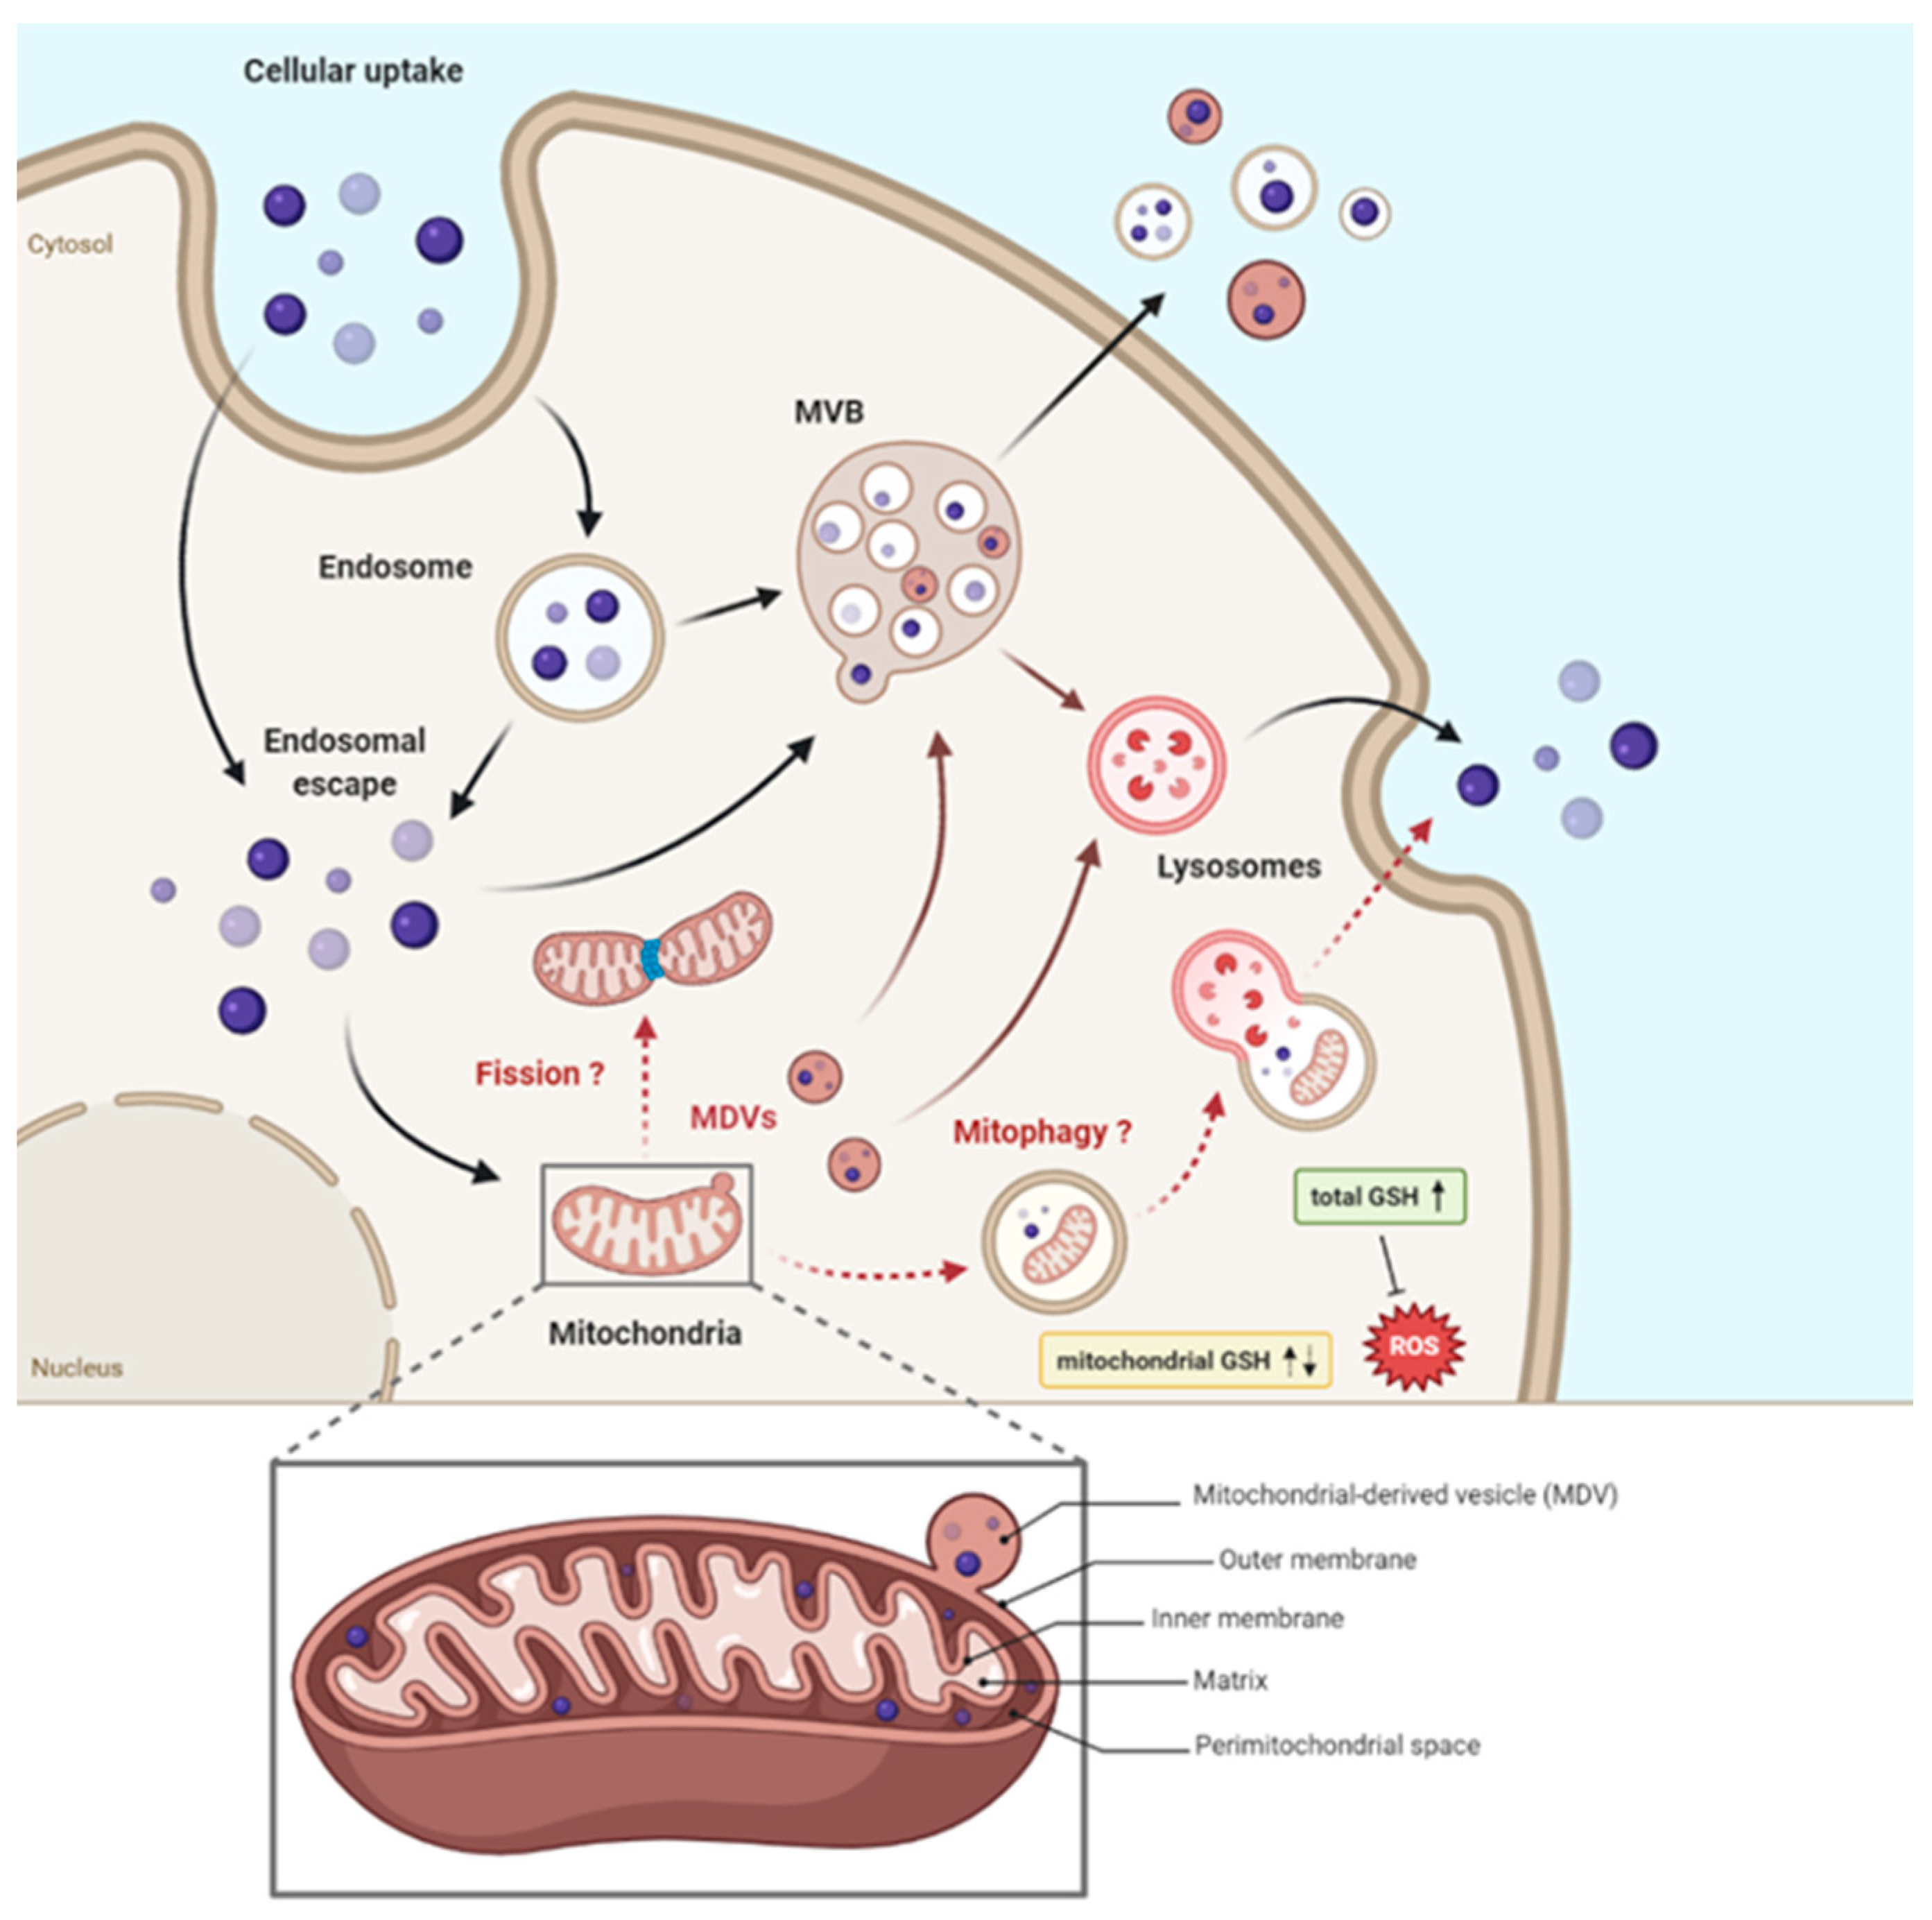
- (3)
- MDVs budding (to deeply characterize) should have the capability to partially free mitochondria from SiNPs MDVs and this option is absolutely in agreement with the viable status of the cells and SiNPs release in the environment [1].
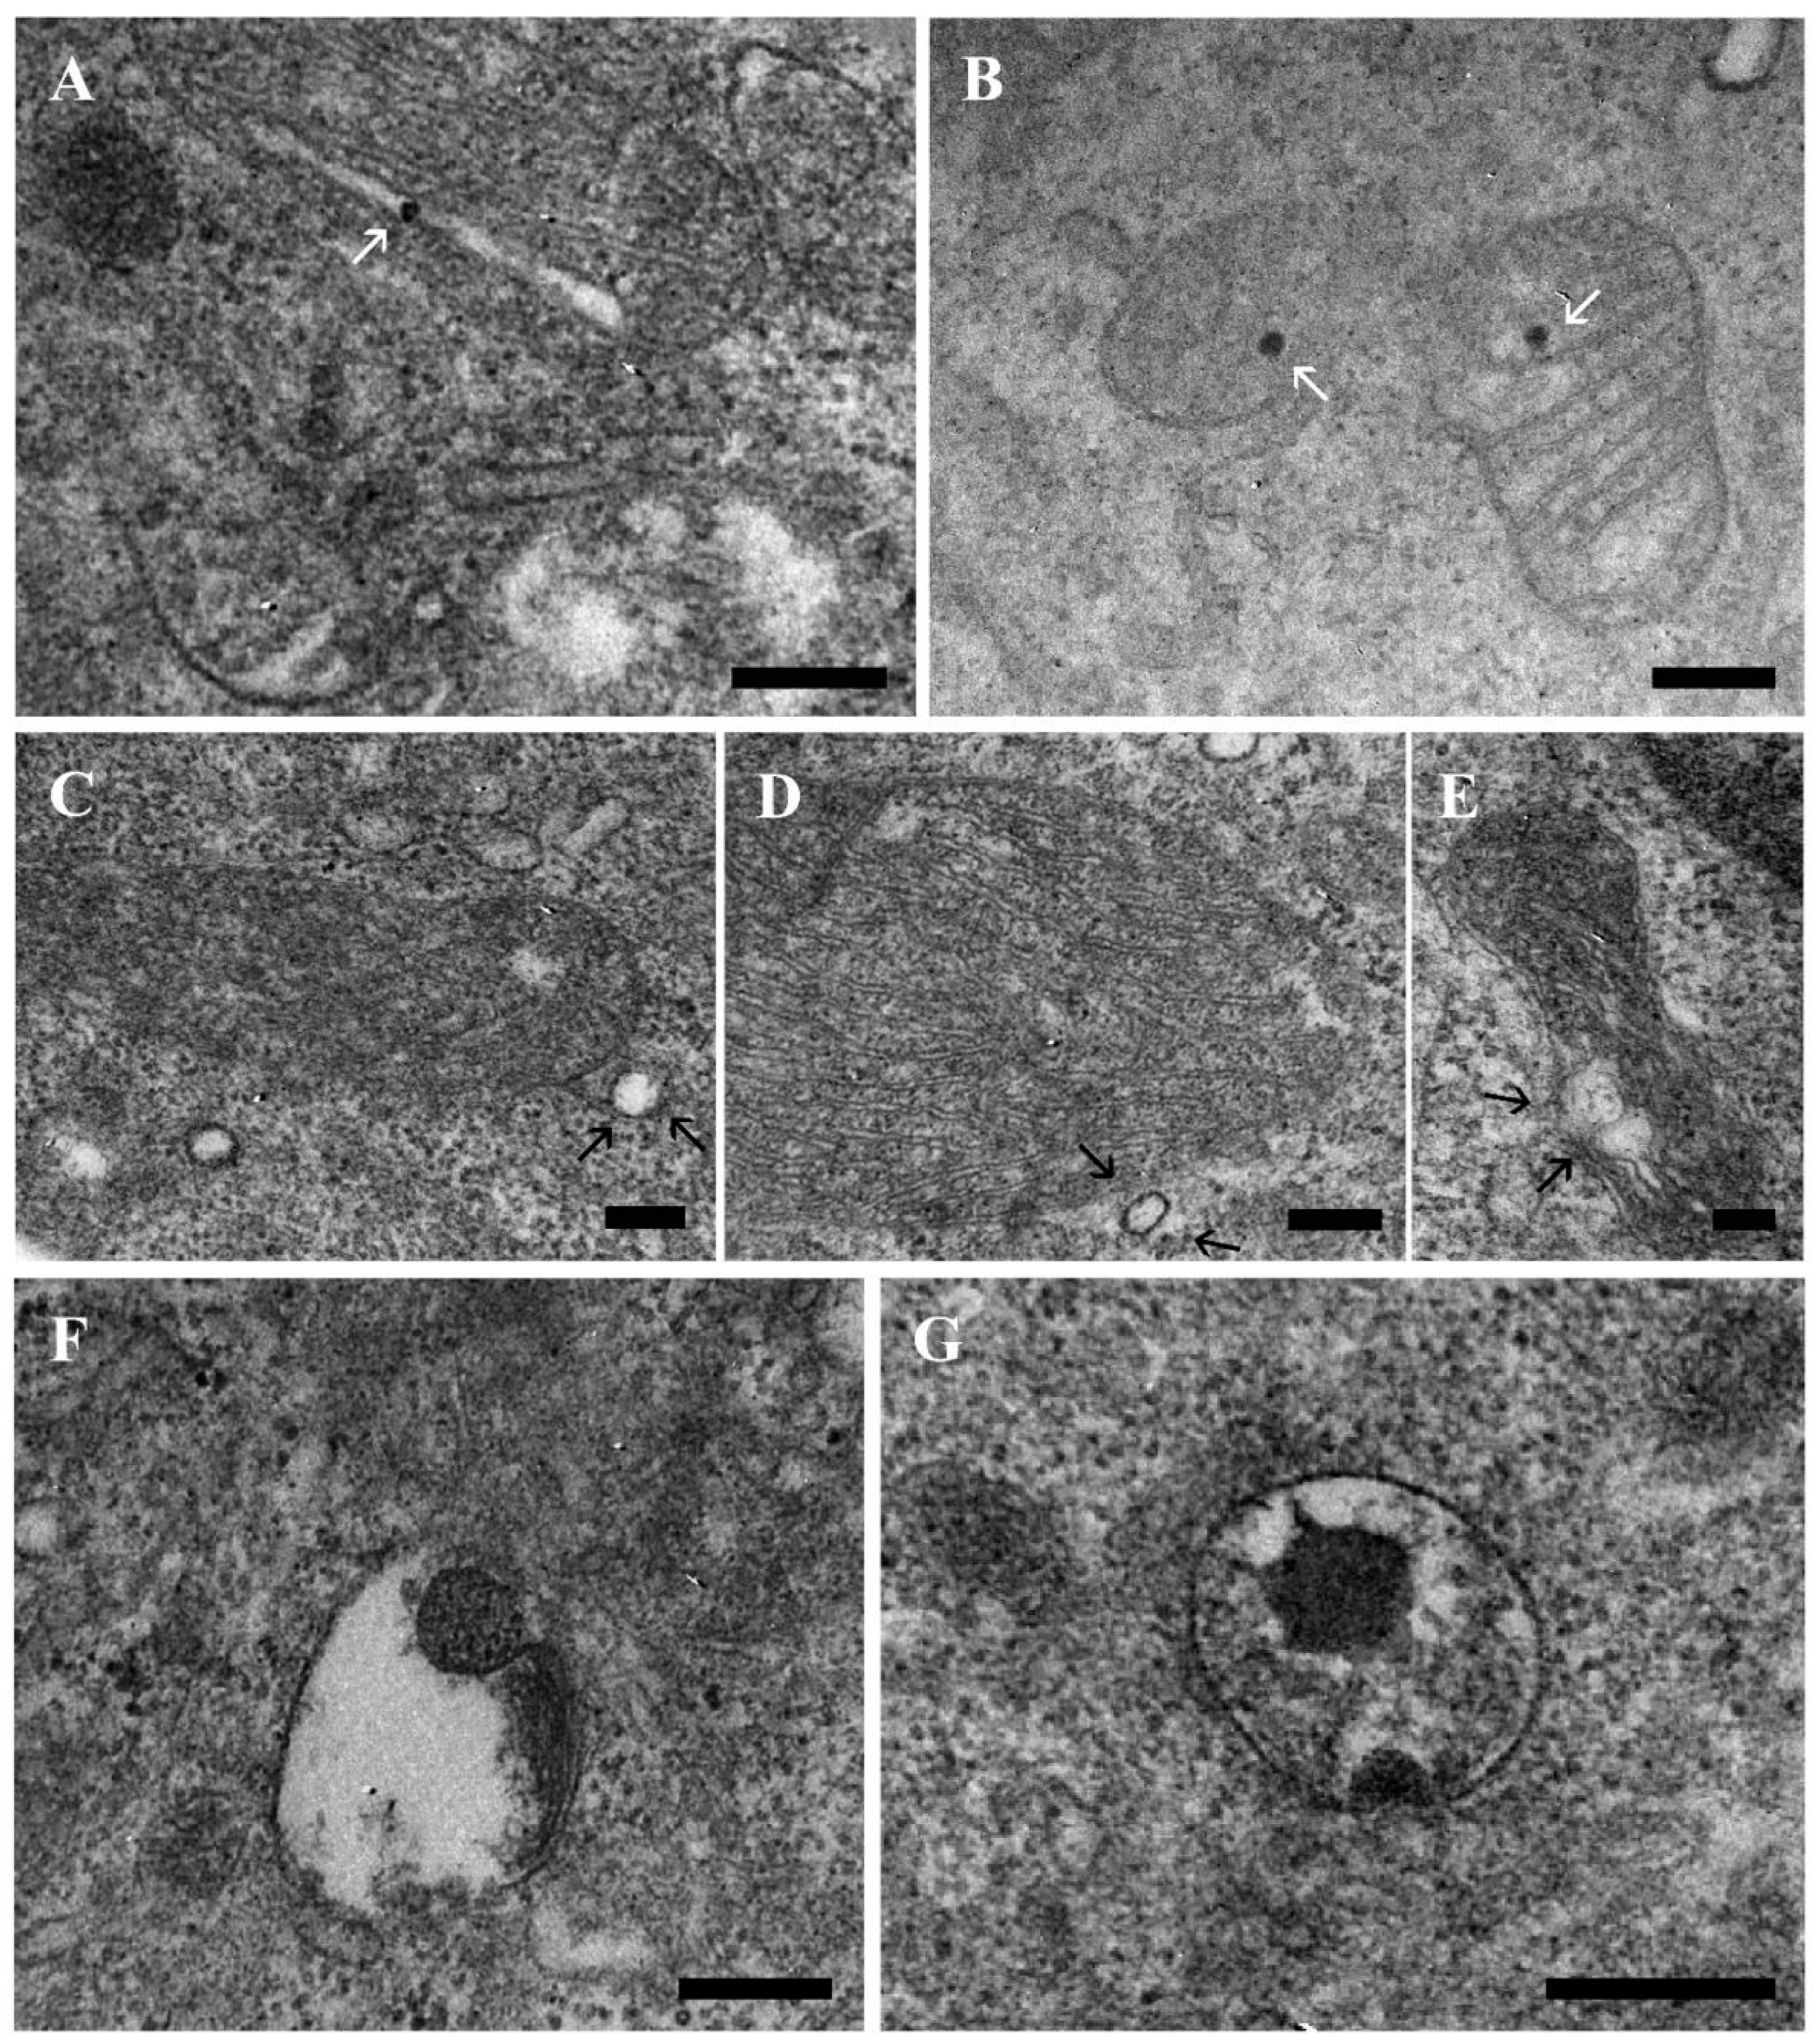
2.2. TEM Analysis of Different Intracellular Localization: Focus on Mitochondria Behavior
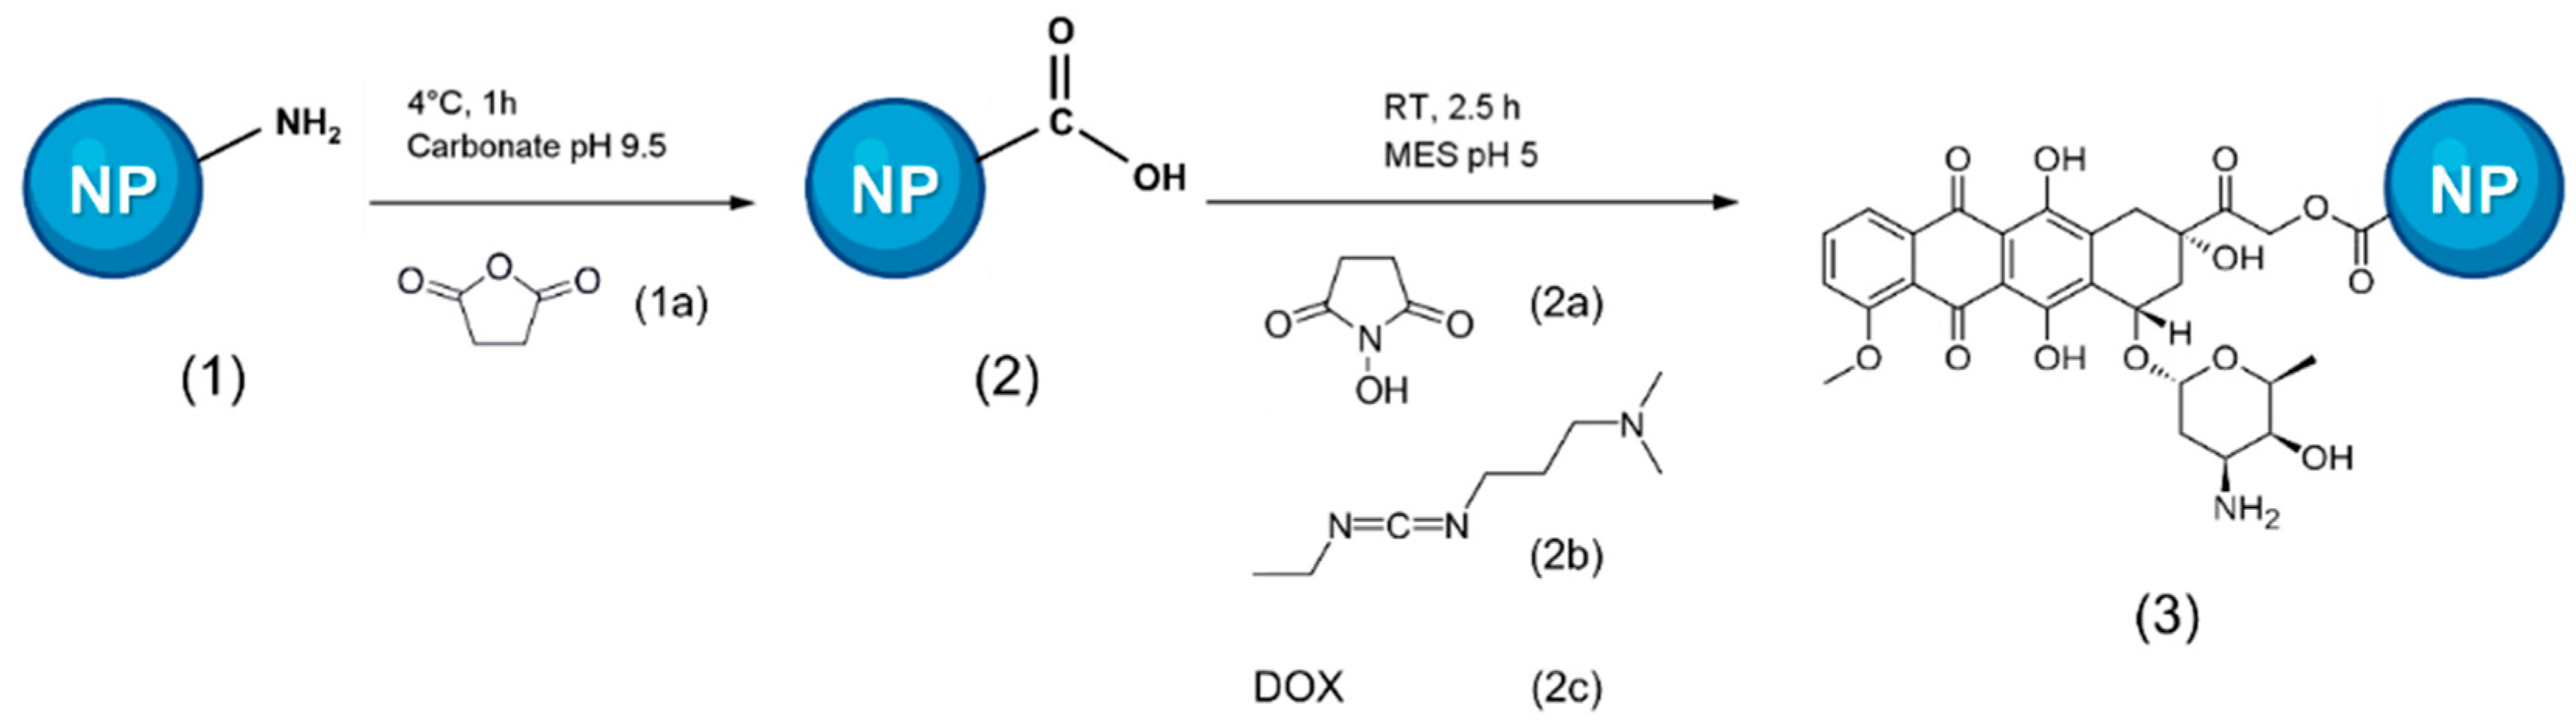
2.3. Moving to the Doxorubicin Delivery-System: Synthesis and Characterization of DOX-NPs
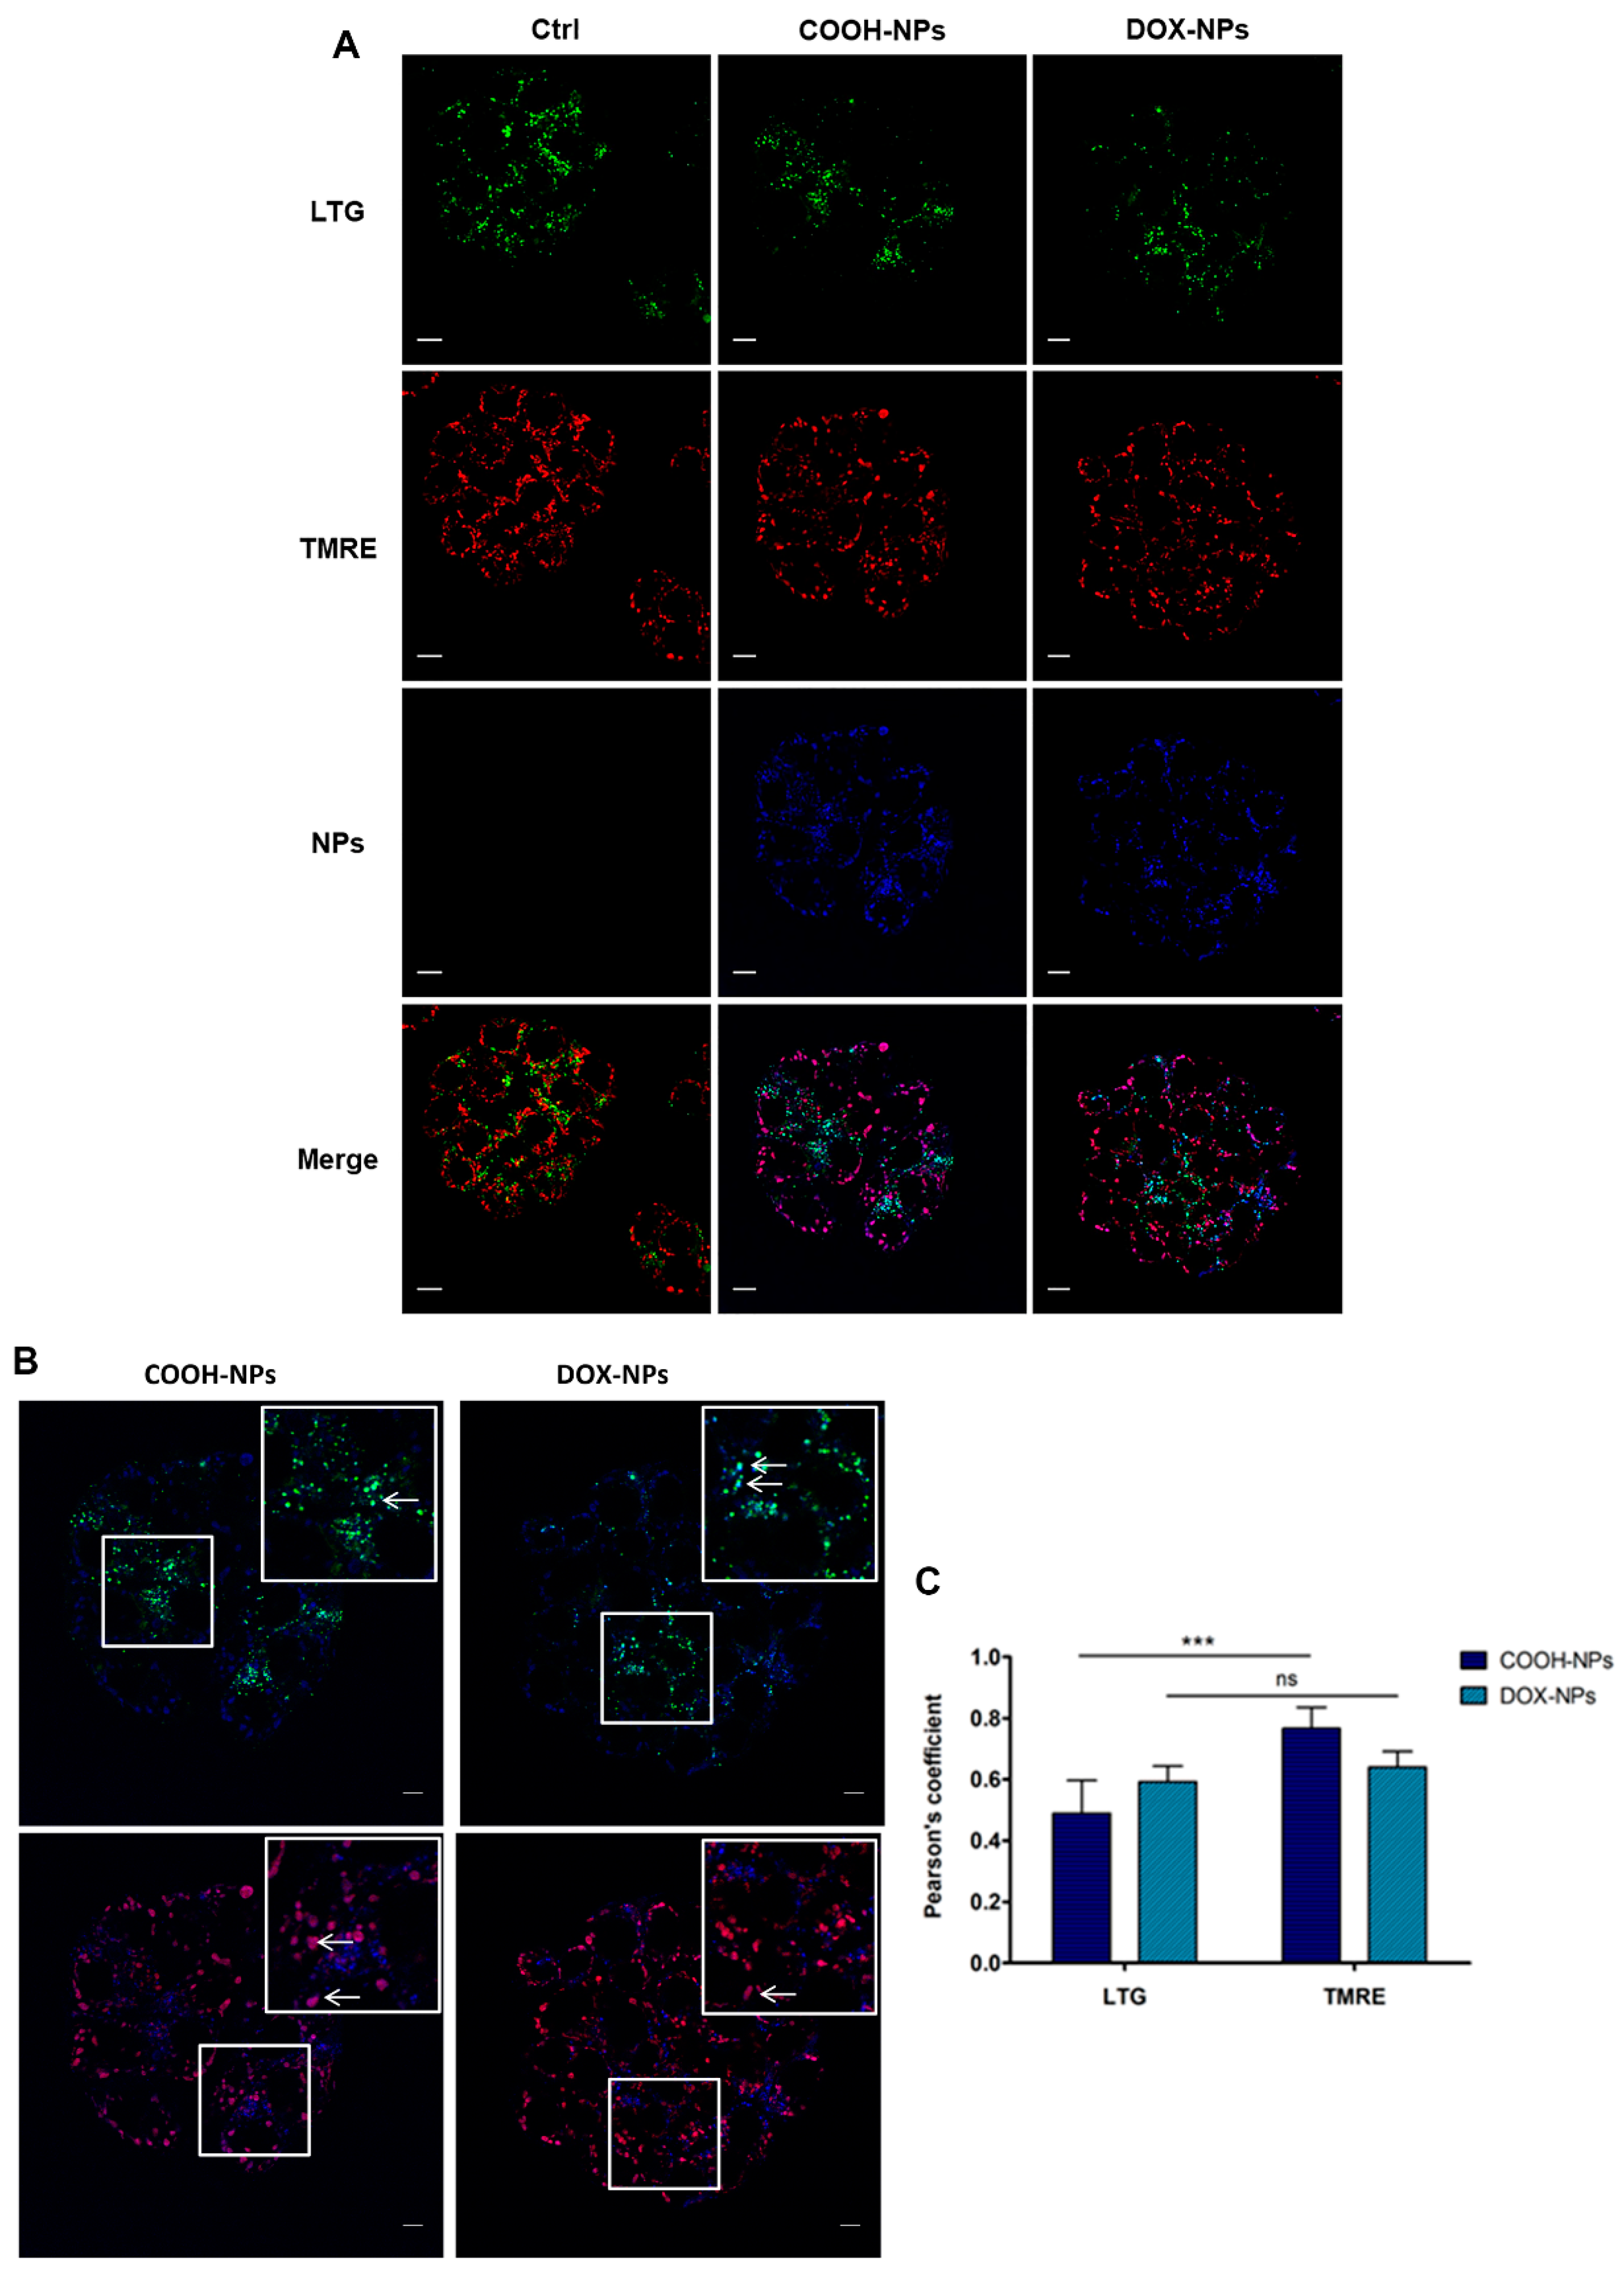
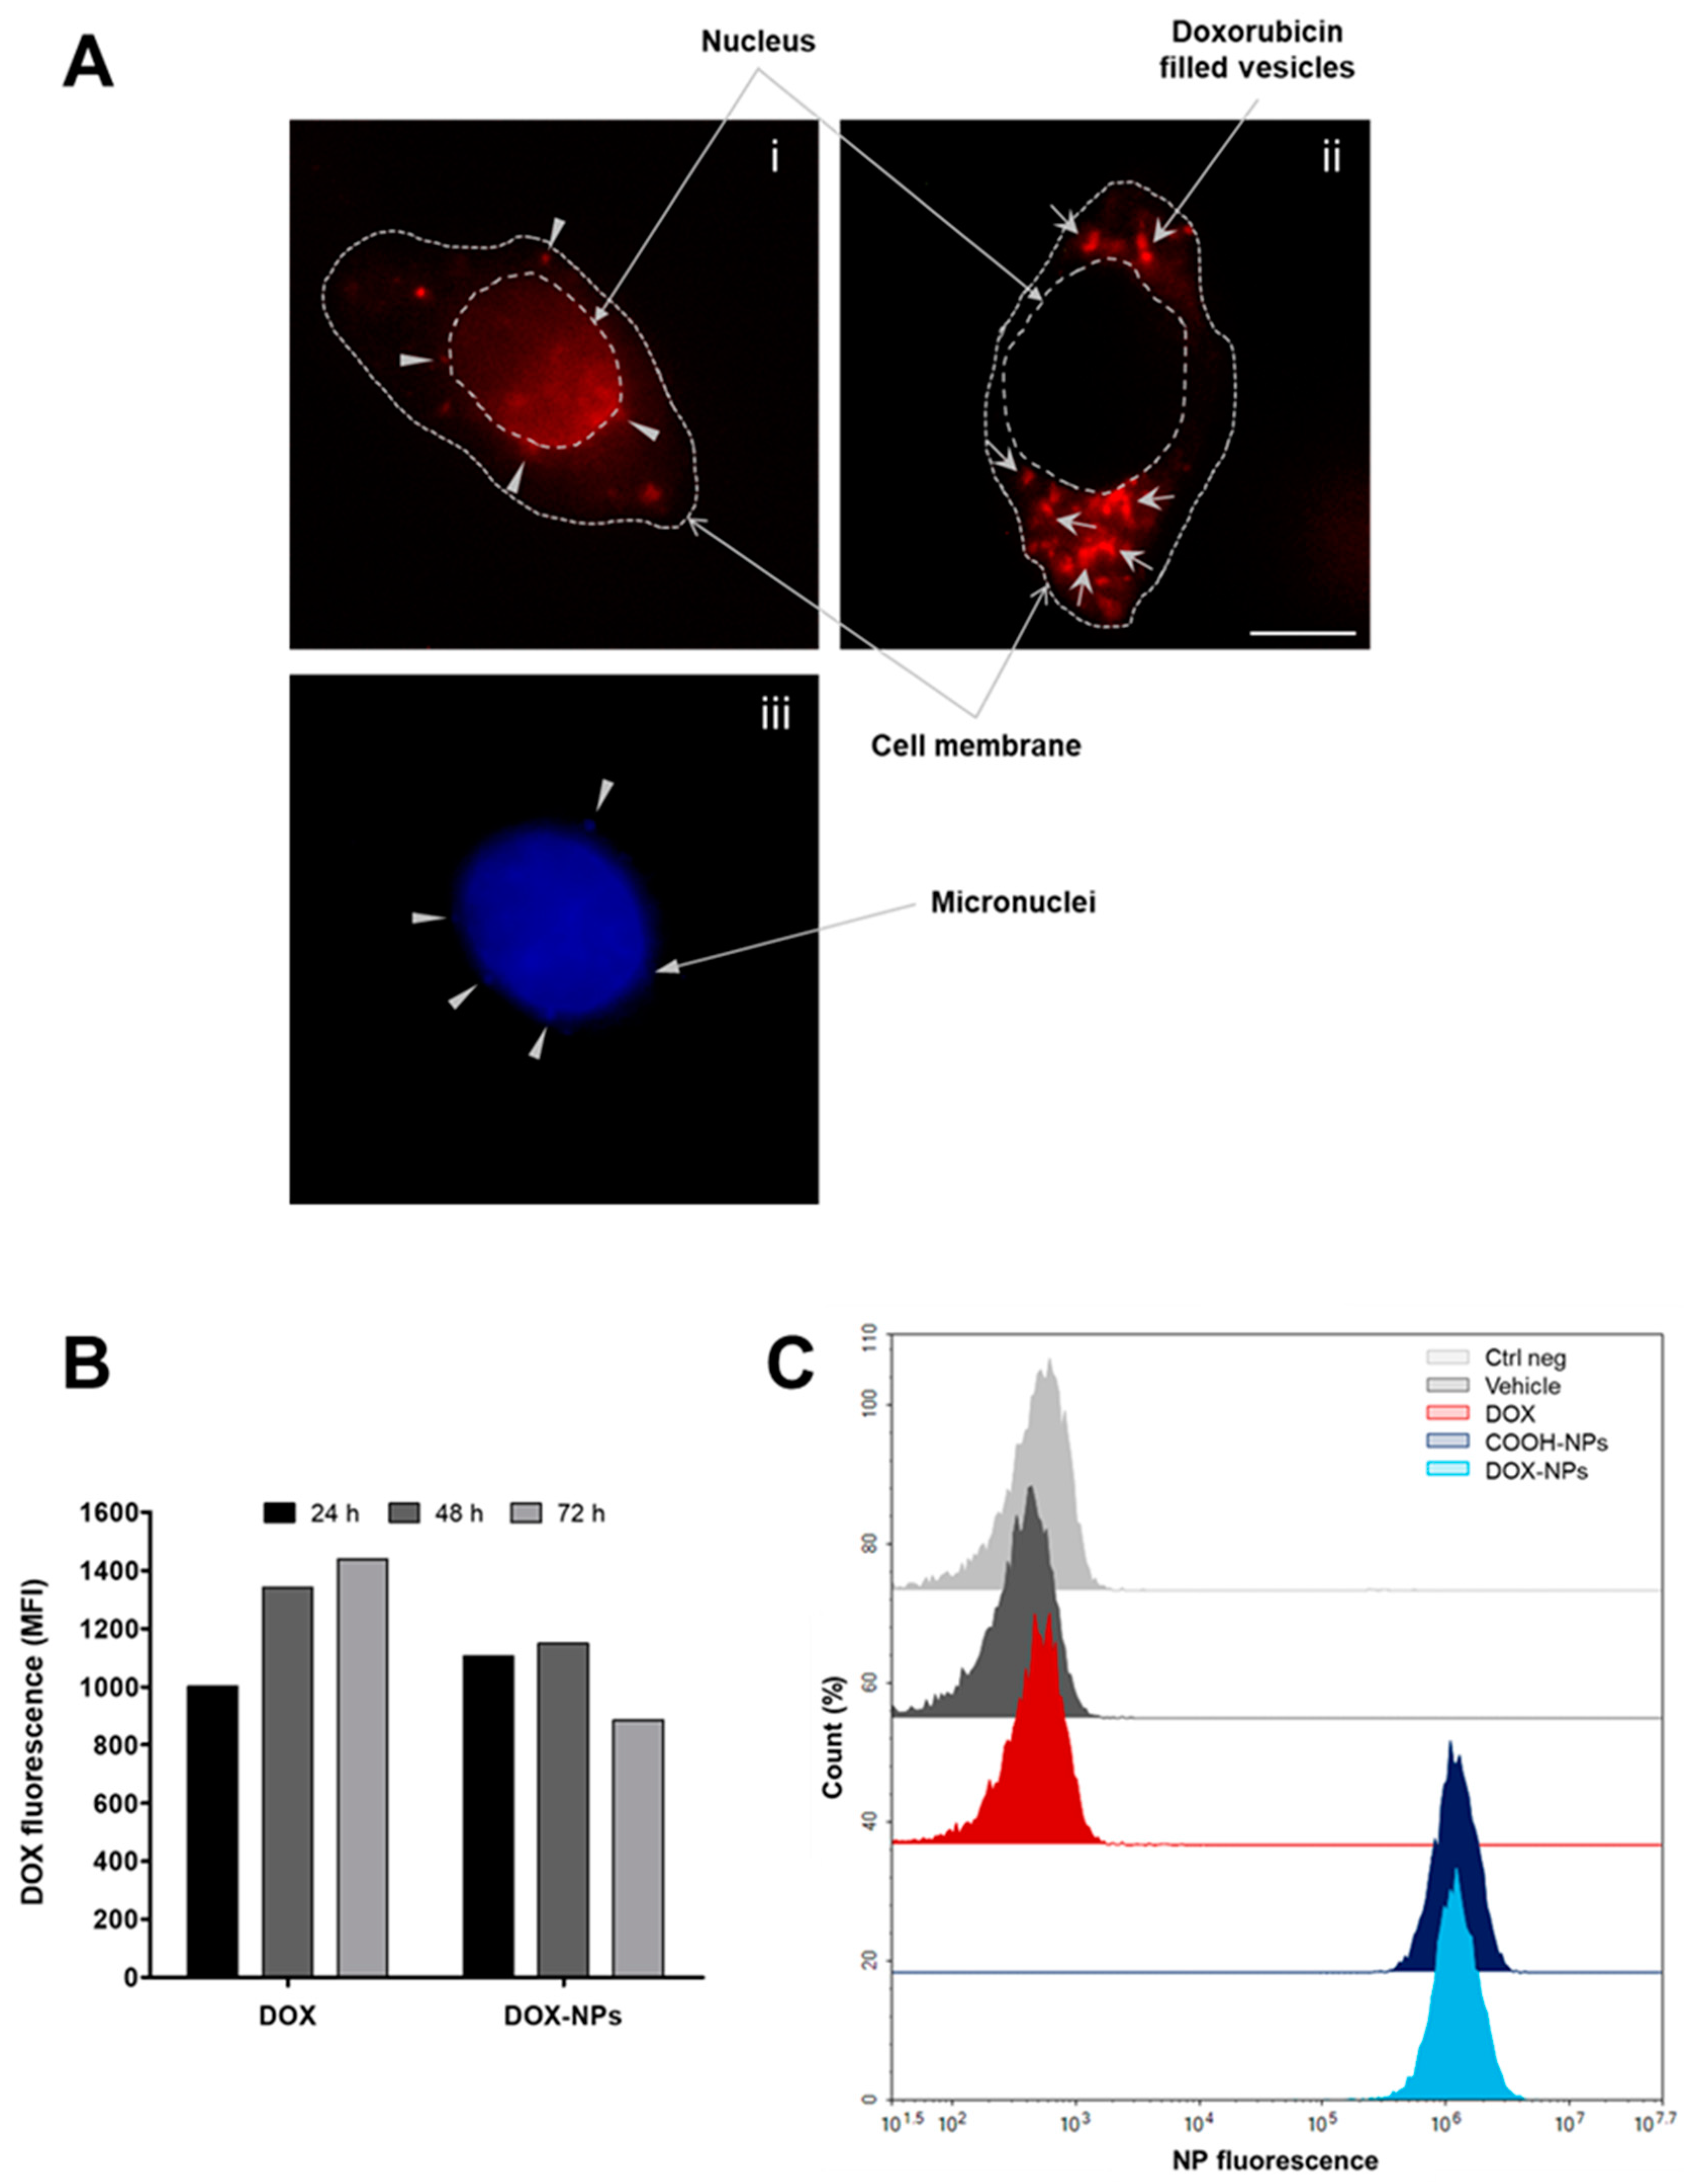
2.4. DOX and NP Uptake and Intracellular Localization
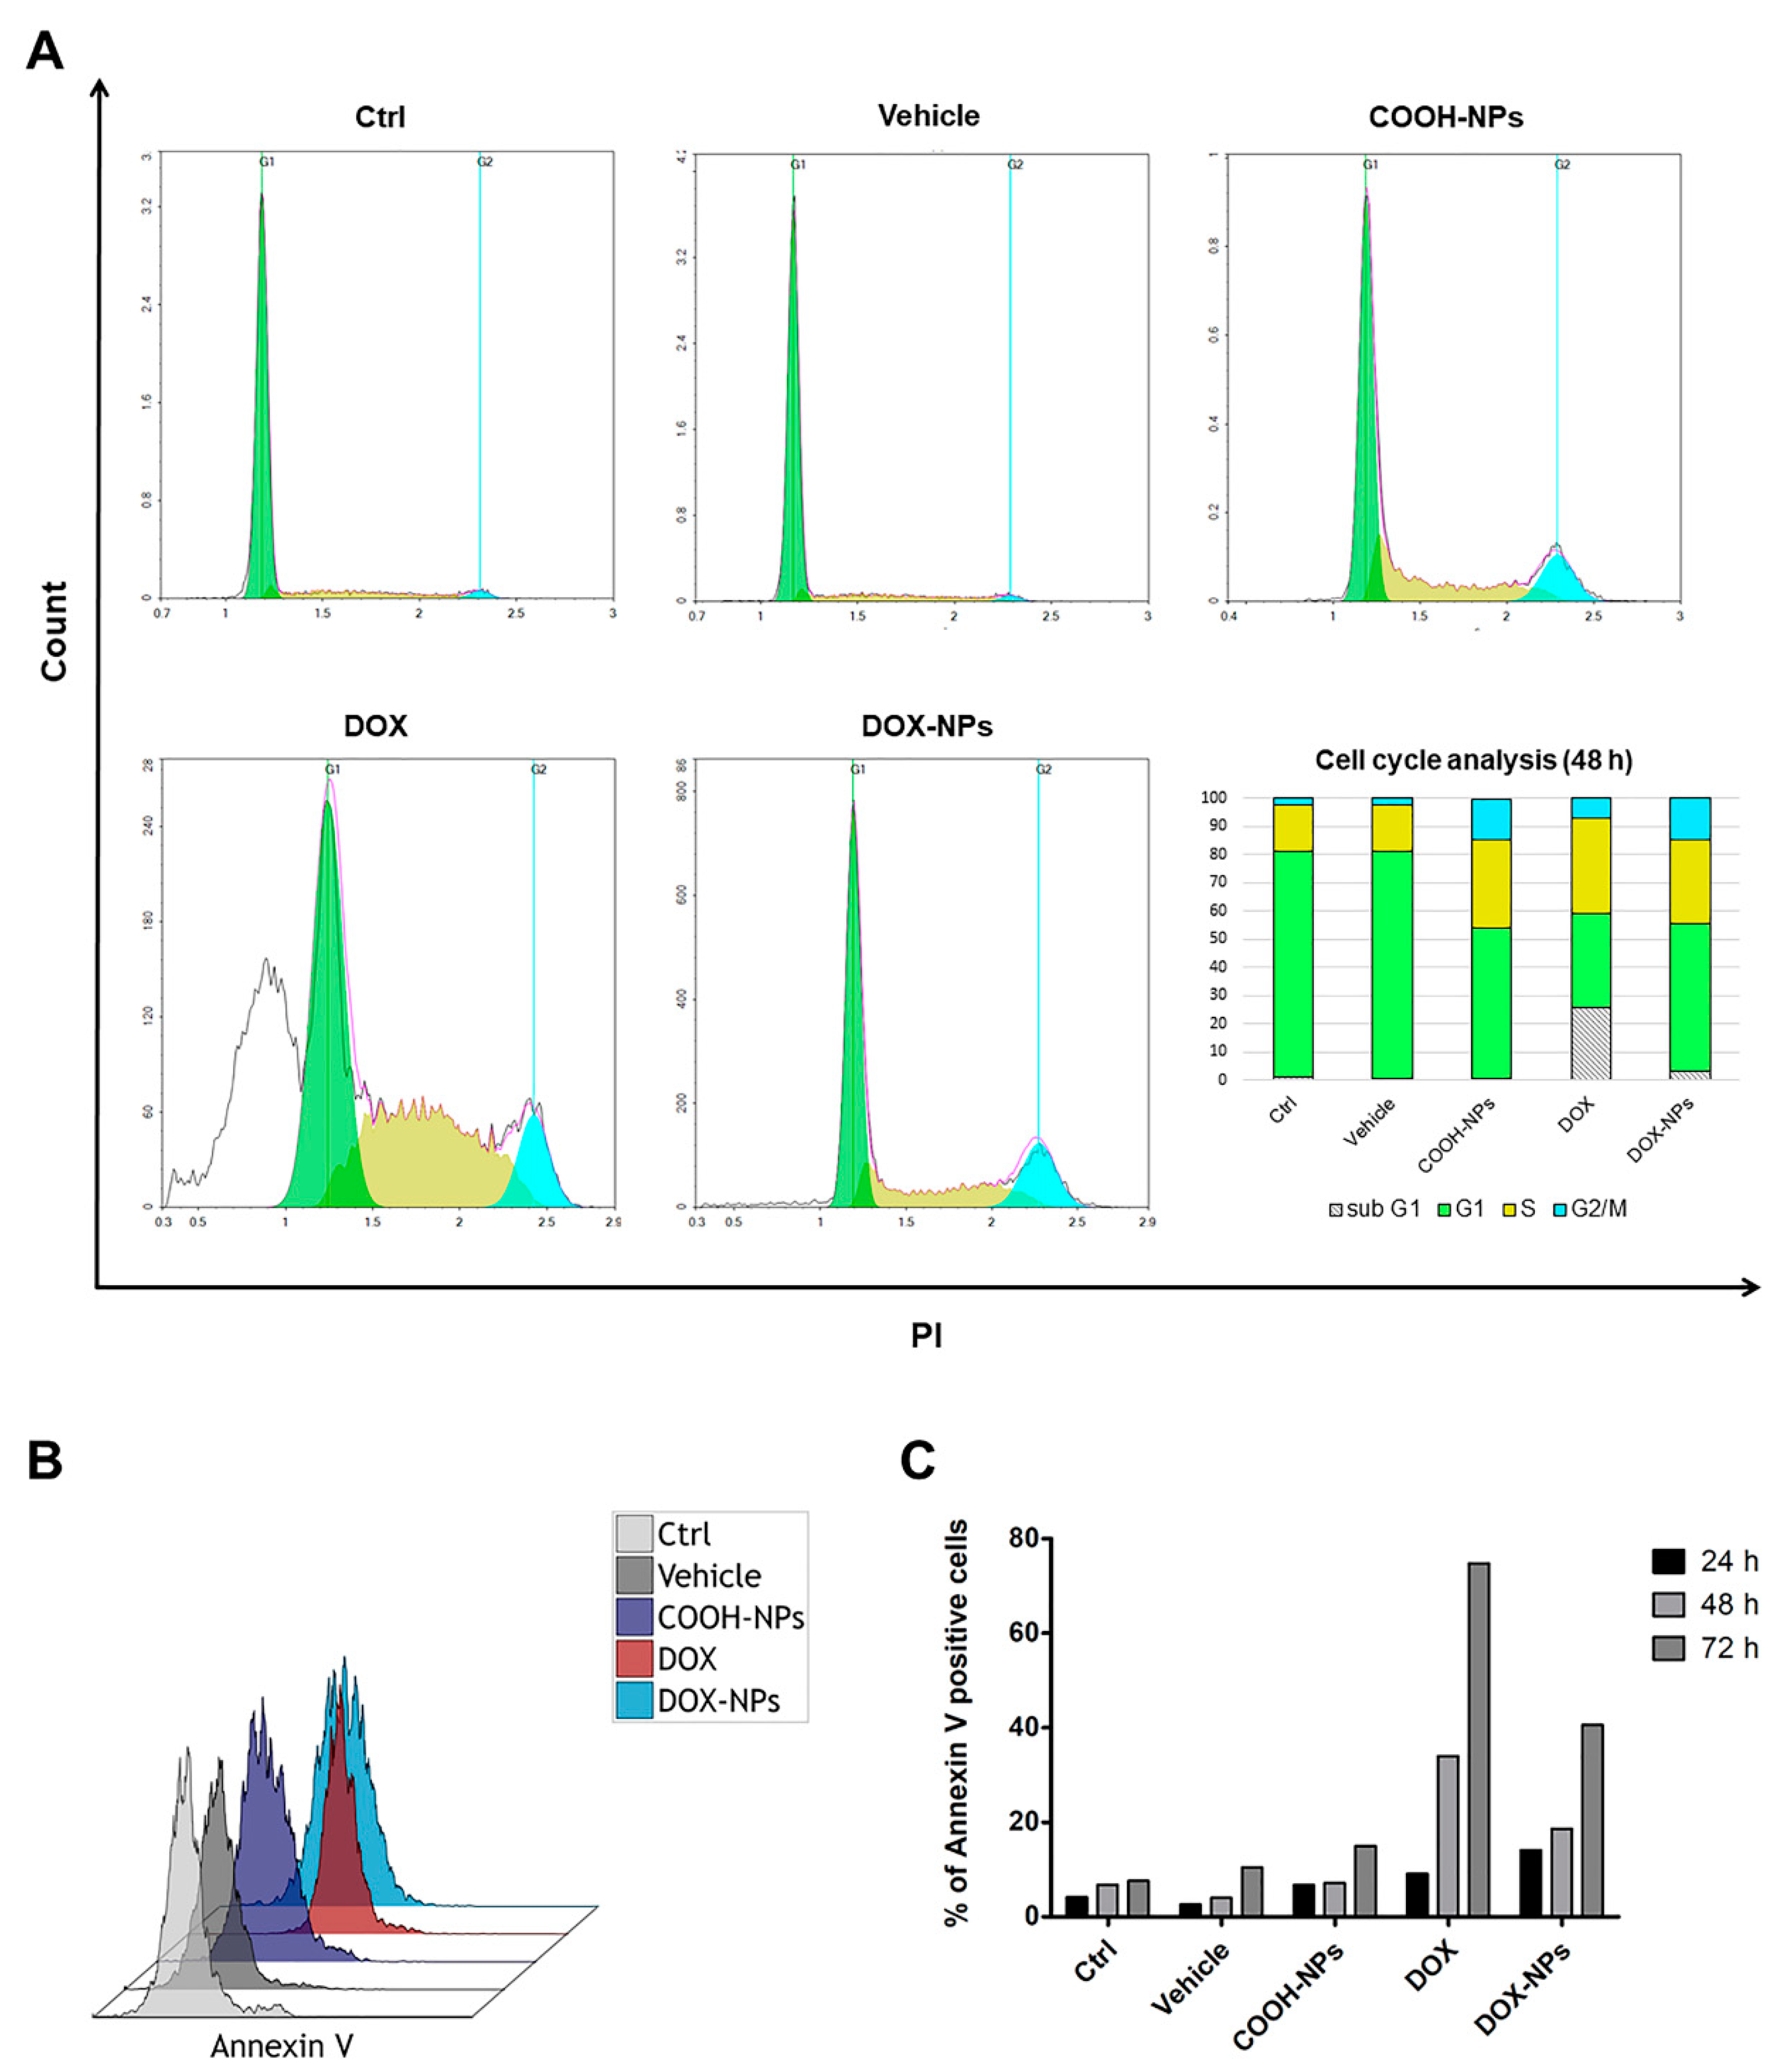
2.5. Investigation of Cell Death
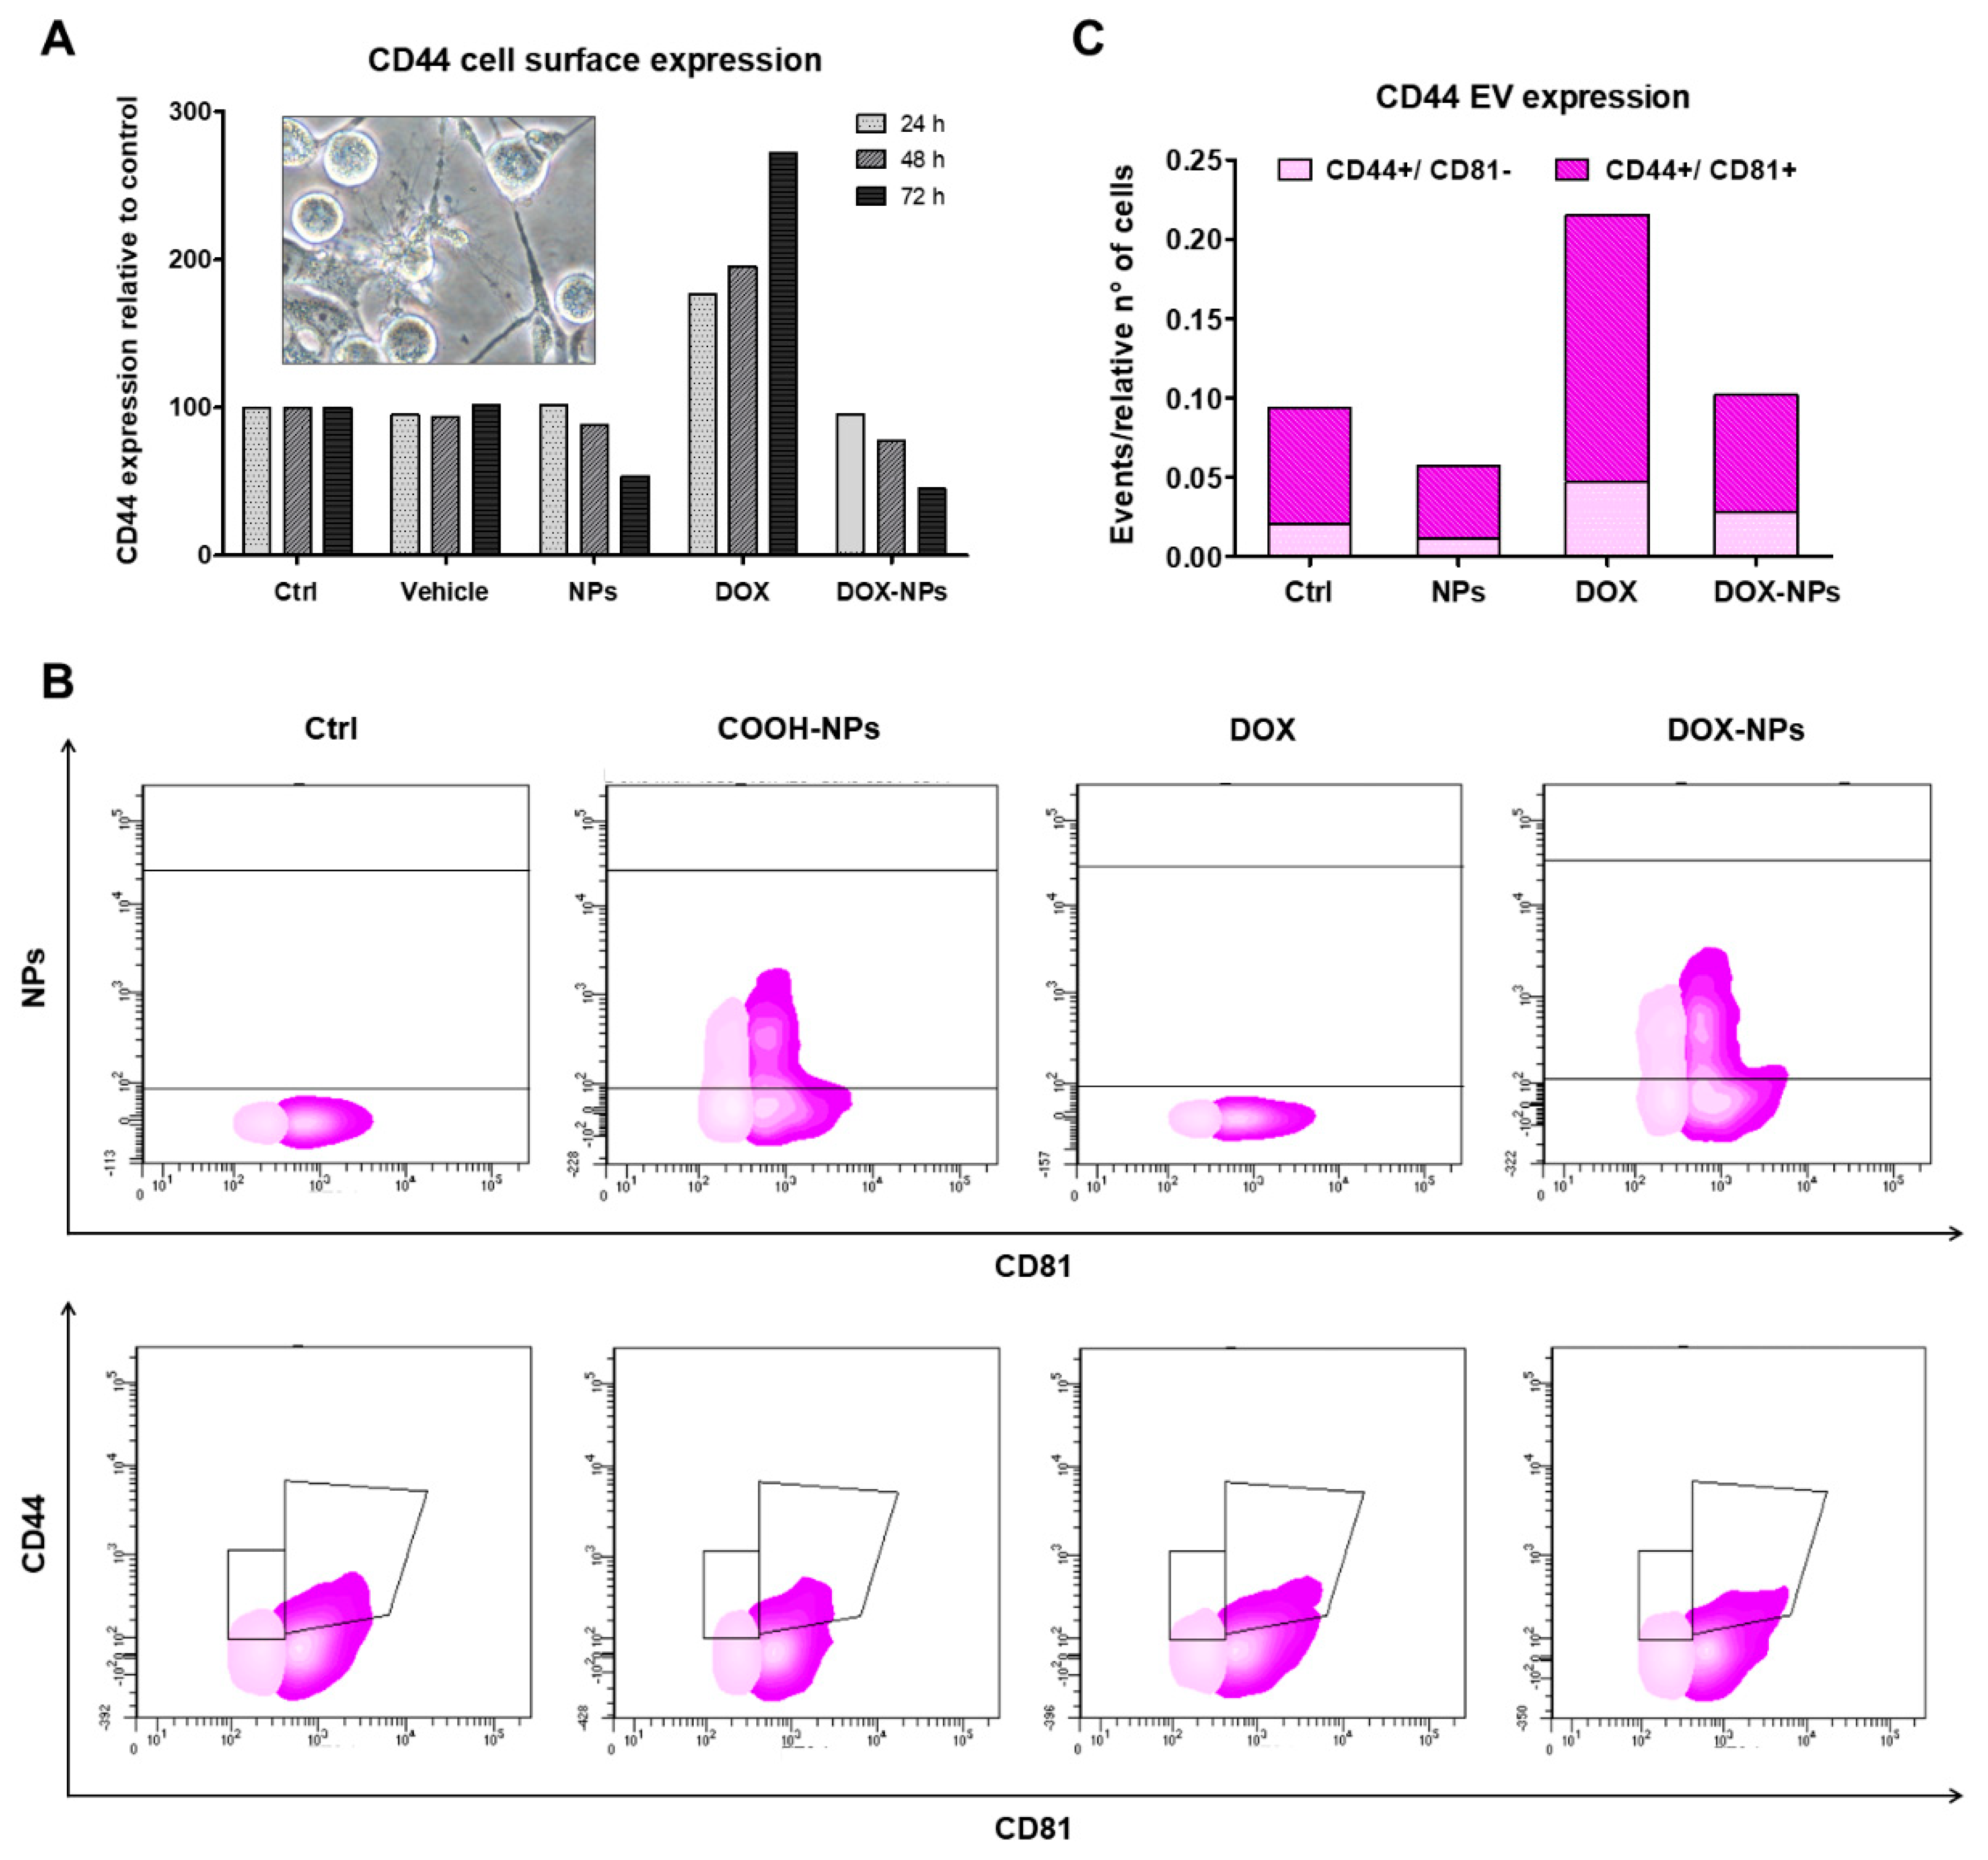
2.6. Effect on Tumor Spreading and Invasion
3. Discussion
4. Materials and Methods
4.1. Cell Culture
4.2. Isolation of Mitochondria
4.3. Measurement of GSH Content in Cells and Mitochondria by High Performance Liquid Chromatography
4.4. Flow Cytometric and Confocal Analyses
4.5. Transmission Electron Microscopy (TEM)
4.6. DOX-NP Synthesis and Physicochemical Characterization
4.7. Nanoparticle Uptake and Intracellular Localization
4.8. DOX Internalization and Accumulation
4.9. Cytotoxic Activity
Trypan Blue Exclusion Assay
4.10. Evaluation of Cell Surface Expression of Phosphatidylserine
4.11. Morphological Changes
4.12. Cell Cycle Analysis
4.13. Flow Cytometric Analysis of CD44 Expression
4.14. Statistical Analysis
Supplementary Materials
Author Contributions
Funding
Institutional Review Board Statement
Informed Consent Statement
Conflicts of Interest
References
- Sola, F.; Canonico, B.; Montanari, M.; Volpe, A.; Barattini, C.; Pellegrino, C.; Cesarini, E.; Guescini, M.; Battistelli, M.; Ortolani, C.; et al. Uptake and intracellular trafficking studies of multiple dye-doped core-shell silica nanoparticles in lymphoid and myeloid cells. Nanotechnol. Sci. Appl. 2021, 14, 29–48. [Google Scholar] [CrossRef] [PubMed]
- Shi, M.; Zhang, J.; Li, X.; Pan, S.; Li, J.; Yang, C.; Hu, H.; Qiao, M.; Chen, D.; Zhao, X. Mitochondria-targeted delivery of doxorubicin to enhance antitumor activity with HER-2 peptide-mediated multifunctional pH-sensitive DQAsomes. Int. J. Nanomed. 2018, 13, 4209–4226. [Google Scholar] [CrossRef] [PubMed] [Green Version]
- Solazzo, M.; Fantappiè, O.; Lasagna, N.; Sassoli, C.; Nosi, D.; Mazzanti, R. P-gp localization in mitochondria and its functional characterization in multiple drug-resistant cell lines. Exp. Cell Res. 2006, 312, 4070–4078. [Google Scholar] [CrossRef] [PubMed]
- Barot, M.; Gokulgandhi, M.R.; Pal, D.; Mitra, A.K. Mitochondrial localization of P-glycoprotein and peptide transporters in corneal epithelial cells—Novel strategies for intracellular drug targeting. Exp. Eye Res. 2013, 106, 47–54. [Google Scholar] [CrossRef] [PubMed] [Green Version]
- Abbasi, E.; Aval, S.F.; Akbarzadeh, A.; Milani, M.; Nasrabadi, H.T.; Joo, S.W.; Hanifehpour, Y.; Nejati-Koshki, K.; Pashaei-Asl, R. Dendrimers: Synthesis, applications, and properties. Nanoscale Res. Lett. 2014, 9, 247. [Google Scholar] [CrossRef] [PubMed] [Green Version]
- Barua, S.; Yoo, J.W.; Kolhar, P.; Wakankar, A.; Gokarn, Y.R.; Mitragotri, S. Particle shape enhances specificity of antibody-displaying nanoparticles. Proc. Natl. Acad. Sci. USA 2013, 110, 3270–3275. [Google Scholar] [CrossRef] [PubMed] [Green Version]
- Bayda, S.; Adeel, M.; Tuccinardi, T.; Cordani, M.; Rizzolio, F. The History of Nanoscience and Nanotechnology: From Chemical–Physical Applications to Nanomedicine. Molecules 2020, 25, 112. [Google Scholar] [CrossRef] [PubMed] [Green Version]
- Rizvi, S.A.A.; Saleh, A.M. Applications of nanoparticle systems in drug delivery technology. Saudi Pharm. J. 2018, 26, 64–70. [Google Scholar] [CrossRef]
- Prados, J.; Melguizo, C.; Ortiz, R.; Velez, C.; Alvarez, J.P.; Arias, L.J.; Ruiz, A.M.; Gallardo, V.; Aranega, A. Doxorubicin-Loaded Nanoparticles: New Advances in Breast Cancer Therapy. Anti-Cancer Agents Med. Chem. 2012, 12, 1058–1070. [Google Scholar] [CrossRef] [PubMed]
- Khutale, G.V.; Casey, A. Synthesis and characterization of a multifunctional gold-doxorubicin nanoparticle system for pH triggered intracellular anticancer drug release. Eur. J. Pharm. Biopharm. 2017, 119, 372–380. [Google Scholar] [CrossRef] [Green Version]
- Auten, R.L.; Davis, J.M. Oxygen toxicity and reactive oxygen species: The devil is in the details. Pediatr. Res. 2009, 66, 121–127. [Google Scholar] [CrossRef] [Green Version]
- Babu, A.; Templeton, A.K.; Munshi, A.; Ramesh, R. Nanodrug delivery systems: A promising technology for detection, diagnosis, and treatment of cancer. AAPS PharmSciTech 2014, 15, 709–721. [Google Scholar] [CrossRef] [PubMed] [Green Version]
- Soe, Z.C.; Kwon, J.B.; Thapa, R.K.; Ou, W.; Nguyen, H.T.; Gautam, M.; Oh, K.T.; Choi, H.G.; Ku, S.K.; Yong, C.S.; et al. Transferrin-Conjugated Polymeric Nanoparticle for Receptor-Mediated Delivery of Doxorubicin in Doxorubicin-Resistant Breast Cancer Cells. Pharmaceutics 2019, 11, 63. [Google Scholar] [CrossRef] [Green Version]
- Nebigil, C.G.; Désaubry, L. Updates in Anthracycline-Mediated Cardiotoxicity. Front. Pharmacol. 2018, 9, 1262. [Google Scholar] [CrossRef] [Green Version]
- Wigner, P.; Zielinski, K.; Labieniec-Watala, M.; Marczak, A.; Szwed, M. Doxorubicin–transferrin conjugate alters mitochondrial homeostasis and energy metabolism in human breast cancer cells. Sci. Rep. 2021, 11, 4544. [Google Scholar] [CrossRef] [PubMed]
- Zhao, N.; Woodle, M.C.; Mixson, A.J. Advances in Delivery Systems for Doxorubicin. J. Nanomed. Nanotechnol. 2018, 9, 519. [Google Scholar] [CrossRef] [PubMed]
- Pellegrino, C.; Volpe, A.; Juris, R.; Menna, M.; Calabrese, V.; Sola, F.; Barattini, C.; Ventola, A. Multiple Dye Doped Core-Shell Silica Nanoparticles: Outstanding Stability and Signal Intensity Exploiting FRET Phenomenon for Biomedical Applications. J. Nanomater. Mol. Nanotechnol. 2018, S6, 2. [Google Scholar] [CrossRef]
- Duan, C.; Kuang, L.; Xiang, X.; Zhang, J.; Zhu, Y.; Wu, Y.; Yan, Q.; Liu, L. Drp1 regulates mitochondrial dysfunction and dysregulated metabolism in ischemic injury via Clec16a-, BAX-, and GSH-pathways. Cell Death Dis. 2020, 11, 251. [Google Scholar] [CrossRef] [Green Version]
- Zhao, X.; Abulikemu, A.; Lv, S.; Qi, Y.; Duan, J.; Zhang, J.; Chen, R.; Guo, C.; Li, Y.; Sun, Z. Oxidative stress- and mitochondrial dysfunction-mediated cytotoxicity by silica nanoparticle in lung epithelial cells from metabolomic perspective. Chemosphere 2021, 275, 129969. [Google Scholar] [CrossRef]
- Picca, A.; Guerra, F.; Calvani, R.; Coelho-Junior, H.J.; Bossola, M.; Landi, F.; Bernabei, R.; Bucci, C.; Marzetti, E. Generation and Release of Mitochondrial-Derived Vesicles in Health, Aging and Disease. J. Clin. Med. 2020, 9, 1440. [Google Scholar] [CrossRef] [PubMed]
- Bolte, S.; Cordelières, F.P. A guided tour into subcellular colocalization analysis in light microscopy. J. Microsc. 2006, 224, 213–232. [Google Scholar] [CrossRef]
- Sriramulu, D.; Reed, E.L.; Annamalai, M.; Venkatesan, T.V.; Valiyaveettil, S. Synthesis and Characterization of Superhydrophobic, Self-cleaning NIR-reflective Silica Nanoparticles. Sci. Rep. 2016, 6, 35993. [Google Scholar] [CrossRef] [PubMed] [Green Version]
- Kauffman, M.; Kauffman, M.; Zhu, H.; Jia, Z.; Li, Y. Fluorescence-Based Assays for Measuring Doxorubicin in Biological Systems. React. Oxyg. Species 2016, 2, 432. [Google Scholar] [CrossRef] [PubMed] [Green Version]
- Bhattacharjee, S.; de Haan, L.H.J.; Evers, N.M.; Jiang, X.; Marcelis, A.T.M.; Zuilhof, H.; Rietjens, I.M.C.M.; Alink, G.M. Role of surface charge and oxidative stress in cytotoxicity of organic monolayer-coated silicon nanoparticles towards macrophage NR8383 cells. Part. Fibre Toxicol. 2010, 7, 25. [Google Scholar] [CrossRef] [PubMed] [Green Version]
- Riebeling, C.; Piret, J.-P.; Trouiller, B.; Nelissen, I.; Saout, C.; Toussaint, O.; Haase, A. A guide to nanosafety testing: Considerations on cytotoxicity testing in different cell models. NanoImpact 2018, 10, 1–11. [Google Scholar] [CrossRef]
- Wu, S.-H.; Hsieh, C.-C.; Hsu, S.-C.; Yao, M.; Hsiao, J.-K.; Wang, S.-W.; Lin, C.-P.; Huang, D.-M. RBC-derived vesicles as a systemic delivery system of doxorubicin for lysosomal-mitochondrial axis-improved cancer therapy. J. Adv. Res. 2020, 30, 185–196. [Google Scholar] [CrossRef]
- Bar-On, O.; Shapira, M.; Hershko, D.D. Differential effects of doxorubicin treatment on cell cycle arrest and Skp2 expression in breast cancer cells. Anti-Cancer Drugs 2007, 18, 1113–1121. [Google Scholar] [CrossRef]
- Saraste, A.; Pulkki, K. Morphologic and biochemical hallmarks of apoptosis. Cardiovasc. Res. 2000, 45, 528–537. [Google Scholar] [CrossRef]
- Hintzsche, H.; Montag, G.; Stopper, H. Induction of micronuclei by four cytostatic compounds in human hematopoietic stem cells and human lymphoblastoid TK6 cells. Sci. Rep. 2018, 8, 3371. [Google Scholar] [CrossRef]
- Kim, H.S.; Lee, Y.S.; Kim, D.K. Doxorubicin exerts cytotoxic effects through cell cycle arrest and fas-mediated cell death. Pharmacology 2009, 84, 300–309. [Google Scholar] [CrossRef]
- Yuste, V.J.; Bayascas, J.R.; Llecha, N.; Sánchez-López, I.; Boix, J.; Comella, J.X. The absence of oligonucleosomal DNA fragmentation during apoptosis of IMR-5 neuroblastoma cells. Disappearance of the caspase-activated DNase. J. Biol. Chem. 2001, 276, 22323–22331. [Google Scholar] [CrossRef] [Green Version]
- Dong, H.P.; Holth, A.; Kleinberg, L.; Ruud, M.G.; Elstrand, M.B.; Tropé, C.G.; Davidson, B.; Risberg, B. Evaluation of Cell Surface Expression of Phosphatidylserine in Ovarian Carcinoma Effusions Using the Annexin-V/7-AAD Assay Clinical Relevance and Comparison With Other Apoptosis Parameters. Am. J. Clin. Pathol. 2009, 132, 756–762. [Google Scholar] [CrossRef] [PubMed] [Green Version]
- Eruslanov, E.; Kusmartsev, S. Identification of ROS using oxidized DCFDA and flow-cytometry. Methods Mol. Biol. 2010, 594, 57–72. [Google Scholar] [CrossRef] [PubMed]
- Friedl, P.; Alexander, S. Cancer invasion and the microenvironment: Plasticity and reciprocity. Cell 2011, 147, 992–1009. [Google Scholar] [CrossRef] [Green Version]
- Van Blaaderen, A.; Vrij, A. Synthesis and Characterization of Monodisperse Colloidal Organo-silica Spheres. J. Colloid Interface Sci. 1993, 156, 1–18. [Google Scholar] [CrossRef] [Green Version]
- Trevisan, S.; Francioso, O.; Quaggiotti, S.; Nardi, S. Humic substances biological activity at the plant-soil interface: From environmental aspects to molecular factors. Plant Signal. Behav. 2010, 5, 635. [Google Scholar] [CrossRef] [Green Version]
- Fang, X.J.; Jiang, H.; Zhu, Y.Q.; Zhang, L.Y.; Fan, Q.H.; Tian, Y. Doxorubicin induces drug resistance and expression of the novel CD44st via NF-κB in human breast cancer MCF-7 cells. Oncol. Rep. 2014, 31, 2735–2742. [Google Scholar] [CrossRef] [Green Version]
- Wolf, K.J.; Shukla, P.; Springer, K.; Lee, S.; Coombes, J.D.; Choy, C.J.; Kenny, S.J.; Xu, K.; Kumar, S. A mode of cell adhesion and migration facilitated by CD44-dependent microtentacles. Proc. Natl. Acad. Sci. USA 2020, 117, 11432–11443. [Google Scholar] [CrossRef] [PubMed]
- Rilla, K. Diverse plasma membrane protrusions act as platforms for extracellular vesicle shedding. J. Extracell. Vesicles 2021, 10, e12148. [Google Scholar] [CrossRef]
- Comşa, Ş.; Cîmpean, A.M.; Raica, M. The Story of MCF-7 Breast Cancer Cell Line: 40 years of Experience in Research. Anti-Cancer Res. 2015, 35, 3147–3154. [Google Scholar]
- Holliday, D.L.; Speirs, V. Choosing the right cell line for breast cancer research. Breast Cancer Res. 2011, 13, 215. [Google Scholar] [CrossRef] [PubMed] [Green Version]
- Lead, J.R.; Wilkinson, K.J. Aquatic Colloids and Nanoparticles: Current Knowledge and Future Trends. Environ. Chem. 2006, 3, 159–171. [Google Scholar] [CrossRef]
- Boxall, A.B.A.; Tiede, K.; Chaudhry, Q. Engineered nanomaterials in soils and water: How do they behave and could they pose a risk to human health? Nanomedicine 2007, 2, 919–927. [Google Scholar] [CrossRef]
- Spooner, R.A.; Smith, D.C.; Easton, A.J.; Roberts, L.M.; Lord, J.M. Retrograde transport pathways utilised by viruses and protein toxins. Virol. J. 2006, 3, 26. [Google Scholar] [CrossRef] [PubMed] [Green Version]
- Shi, M.; Ho, K.; Keating, A.; Shoichet, M.S. Doxorubicin-conjugated immuno-nanoparticles for intracellular anticancer drug delivery. Adv. Funct. Mater. 2009, 19, 1689–1696. [Google Scholar] [CrossRef]
- Aryal, S.; Grailer, J.J.; Pilla, S.; Steeber, D.A.; Gong, S. Doxorubicin conjugated gold nanoparticles as water-soluble and pH-responsive anticancer drug nanocarriers. J. Mater. Chem. 2009, 19, 7879–7884. [Google Scholar] [CrossRef]
- Yusupov, M.; Privat-Maldonado, A.; Cordeiro, R.M.; Verswyvel, H.; Shaw, P.; Razzokov, J.; Smits, E.; Bogaerts, A. Oxidative damage to hyaluronan–CD44 interactions as an underlying mechanism of action of oxidative stress-inducing cancer therapy. Redox Biol. 2021, 43, 101968. [Google Scholar] [CrossRef]
- Fiorani, M.; Guidarelli, A.; Blasa, M.; Azzolini, C.; Candiracci, M.; Piatti, E.; Cantoni, O. Mitochondria accumulate large amounts of quercetin: Prevention of mitochondrial damage and release upon oxidation of the extramitochondrial fraction of the flavonoid. J. Nutr. Biochem. 2010, 21, 397–404. [Google Scholar] [CrossRef] [PubMed]
- Fiorani, M.; Guidarelli, A.; Capellacci, V.; Cerioni, L.; Crinelli, R.; Cantoni, O. The dual role of mitochondrial superoxide in arsenite toxicity: Signaling at the boundary between apoptotic commitment and cytoprotection. Toxicol. Appl. Pharmacol. 2018, 345, 26–35. [Google Scholar] [CrossRef] [PubMed]
- Guidarelli, A.; Fiorani, M.; Cerioni, L.; Cantoni, O. Calcium signals between the ryanodine receptor- and mitochondria critically regulate the effects of arsenite on mitochondrial superoxide formation and on the ensuing survival vs apoptotic signaling. Redox Biol. 2019, 20, 285–295. [Google Scholar] [CrossRef] [PubMed]
- Presley, A.D.; Fuller, K.M.; Arriaga, E.A. MitoTracker Green labeling of mitochondrial proteins and their subsequent analysis by capillary electrophoresis with laser-induced fluorescence detection. J. Chromatogr. B 2003, 793, 141–150. [Google Scholar] [CrossRef]
- Canonico, B.; Cesarini, E.; Montanari, M.; Di Sario, G.; Campana, R.; Galluzzi, L.; Sola, F.; Gundogdu, O.; Luchetti, F.; Diotallevi, A.; et al. Rapamycin re-directs lysosome network, stimulates er-remodeling, involving membrane CD317 and affecting exocytosis, in Campylobacter Jejuni-lysate-infected U937 cells. Int. J. Mol. Sci. 2020, 21, 2207. [Google Scholar] [CrossRef] [PubMed] [Green Version]
- Miyazono, Y.; Hirashima, S.; Ishihara, N.; Kusukawa, J.; Nakamura, K.I.; Ohta, K. Uncoupled mitochondria quickly shorten along their long axis to form indented spheroids, instead of rings, in a fission-independent manner. Sci. Rep. 2018, 8, 350. [Google Scholar] [CrossRef] [PubMed] [Green Version]
- Shah, S.; Chandra, A.; Kaur, A.; Sabnis, N.; Lacko, A.; Gryczynski, Z.; Fudala, R.; Gryczynski, I. Fluorescence properties of doxorubicin in PBS buffer and PVA films. J. Photochem. Photobiol. B. 2017, 170, 65–69. [Google Scholar] [CrossRef] [PubMed] [Green Version]
- Chazotte, B. Labeling lysosomes in live cells with LysoTracker. Cold Spring Harb. Protoc. 2011, 2011, pdb.prot5571. [Google Scholar] [CrossRef] [PubMed]
- Strober, W. Trypan Blue Exclusion Test of Cell Viability. Curr. Protoc. Immunol. 2015, 111, A3.B.1–A3.B.3. [Google Scholar] [CrossRef] [PubMed]
- Canonico, B.; Cesarini, E.; Salucci, S.; Luchetti, F.; Falcieri, E.; di Sario, G.; Palma, F.; Papa, S. Defective Autophagy, Mitochondrial Clearance and Lipophagy in Niemann-Pick Type B Lymphocytes. PLoS ONE 2016, 11, e0165780. [Google Scholar] [CrossRef]
- Simeone, P.; Celia, C.; Bologna, G.; Ercolino, E.; Pierdomenico, L.; Cilurzo, F.; Grande, R.; Diomede, F.; Vespa, S.; Canonico, B.; et al. Diameters and Fluorescence Calibration for Extracellular Vesicle Analyses by Flow Cytometry. Int. J. Mol. Sci. 2020, 21, 7885. [Google Scholar] [CrossRef] [PubMed]
- Andreu, Z.; Yáñez-Mó, M. Tetraspanins in extracellular vesicle formation and function. Front. Immunol. 2014, 5, 442. [Google Scholar] [CrossRef] [Green Version]


Publisher’s Note: MDPI stays neutral with regard to jurisdictional claims in published maps and institutional affiliations. |
© 2022 by the authors. Licensee MDPI, Basel, Switzerland. This article is an open access article distributed under the terms and conditions of the Creative Commons Attribution (CC BY) license (https://creativecommons.org/licenses/by/4.0/).
Share and Cite
Sola, F.; Montanari, M.; Fiorani, M.; Barattini, C.; Ciacci, C.; Burattini, S.; Lopez, D.; Ventola, A.; Zamai, L.; Ortolani, C.; et al. Fluorescent Silica Nanoparticles Targeting Mitochondria: Trafficking in Myeloid Cells and Application as Doxorubicin Delivery System in Breast Cancer Cells. Int. J. Mol. Sci. 2022, 23, 3069. https://0-doi-org.brum.beds.ac.uk/10.3390/ijms23063069
Sola F, Montanari M, Fiorani M, Barattini C, Ciacci C, Burattini S, Lopez D, Ventola A, Zamai L, Ortolani C, et al. Fluorescent Silica Nanoparticles Targeting Mitochondria: Trafficking in Myeloid Cells and Application as Doxorubicin Delivery System in Breast Cancer Cells. International Journal of Molecular Sciences. 2022; 23(6):3069. https://0-doi-org.brum.beds.ac.uk/10.3390/ijms23063069
Chicago/Turabian StyleSola, Federica, Mariele Montanari, Mara Fiorani, Chiara Barattini, Caterina Ciacci, Sabrina Burattini, Daniele Lopez, Alfredo Ventola, Loris Zamai, Claudio Ortolani, and et al. 2022. "Fluorescent Silica Nanoparticles Targeting Mitochondria: Trafficking in Myeloid Cells and Application as Doxorubicin Delivery System in Breast Cancer Cells" International Journal of Molecular Sciences 23, no. 6: 3069. https://0-doi-org.brum.beds.ac.uk/10.3390/ijms23063069