Article

Isolation and Functional Characterization of Two CONSTANS-like 16 (MiCOL16) Genes from Mango

State Key Laboratory for Conservation and Utilization of Subtropical Agro-Bioresources, College of Agriculture, National Demonstration Center for Experimental Plant Science Education, Guangxi University, Nanning 530004, China
*
Author to whom correspondence should be addressed.
These authors contributed equally to this work.
Int. J. Mol. Sci. 2022, 23(6), 3075; https://0-doi-org.brum.beds.ac.uk/10.3390/ijms23063075
Submission received: 12 February 2022 / Revised: 8 March 2022 / Accepted: 11 March 2022 / Published: 12 March 2022
(This article belongs to the Topic Plant Responses and Tolerance to Salinity Stress)

Abstract

:
CONSTANS (CO) is an important regulator of photoperiodic flowering and functions at a key position in the flowering regulatory network. Here, two CO homologs, MiCOL16A and MiCOL16B, were isolated from “SiJiMi” mango to elucidate the mechanisms controlling mango flowering. The MiCOL16A and MiCOL16B genes were highly expressed in the leaves and expressed at low levels in the buds and flowers. The expression levels of MiCOL16A and MiCOL16B increased during the flowering induction period but decreased during the flower organ development and flowering periods. The MiCOL16A gene was expressed in accordance with the circadian rhythm, and MiCOL16B expression was affected by diurnal variation, albeit not regularly. Both the MiCOL16A and MiCOL16B proteins were localized in the nucleus of cells and exerted transcriptional activity through their MR domains in yeast. Overexpression of both the MiCOL16A and MiCOL16B genes significantly repressed flowering in Arabidopsis under short-day (SD) and long-day (LD) conditions because they repressed the expression of AtFT and AtSOC1. This research also revealed that overexpression of MiCOL16A and MiCOL16B improved the salt and drought tolerance of Arabidopsis, conferring longer roots and higher survival rates to overexpression lines under drought and salt stress. Together, our results demonstrated that MiCOL16A and MiCOL16B not only regulate flowering but also play a role in the abiotic stress response in mango.

1. Introduction

In higher plants, floral transition is the process that describes the switch from the vegetative stage to the reproductive stage. The time for this process is referred to as flowering time. The flowering mechanism of the annual plant species Arabidopsis is thoroughly understood. According to recent research, the onset of flowering is regulated in a timely manner by an intricate network involving a series of regulatory pathways, such as gibberellin, photoperiod, autonomous, aging and vernalization pathways [1,2,3]. Of the many regulatory pathways, the photoperiod pathway is especially important; it is involved in plant responses to photoperiod sensing and subsequent molecular events [4].
Many photoperiod pathway-related genes have been discovered, such as TIME OF CAB EXPRESSION 1 (TOC1), LATE ELONGATED HYPOCOTYL (LHY), EARLY FLOWERING 4 (ELF4), GIGANTEA (GI), CIRCADIAN CLOCK ASSOCIATED 1 (CCA1), FLOWERING LOCUS T (FT) and CONSTANS (CO) [5]. Among them, CO is a key component of which there are orthologs in various plant species [6,7,8,9]. Currently, CYCLING DOF FACTOR (CDF) is known as the only transcription factor that directly binds to the CO promoter and suppresses the expression of CO [10,11,12]. The GI gene plays a key role in the photoperiod induction pathway and positively regulates the expression of the CO gene under long-day conditions [13]. Overexpression of the FLOWERING BHLH (FBH) gene elevates CO levels without being affected by photoperiod [14]. In addition, phytochrome-interacting factors (PIFs) interact with CO to suppress flowering [15]. The E3 ubiquitin ligase-encoding gene HIGH EXPRESSION OF OSMOTICALLY RESPONSIVE GENES1 (HOS1) is involved in controlling the abundance of CO, and CONSTITUTIVE PHOTOMORPHOGENIC1 (COP1), as a flowering repressor, is regulated by cryptochromes (CRY) and promotes the proteolysis of CO in the dark [16,17]. CO genes belong to the BBX family and can be divided into three categories according to their domains in Arabidopsis [7,18]. Group I genes have one CO, CO-like, and TOC1 (CCT) domain and two B-box domains; group II genes have one B-box and one CCT domain; and group III genes have one B-box, one variant B-box and one CCT domain.
However, the functions of CO orthologs vary across different species. In Arabidopsis, overexpression of the AtCO, AtCOL5 and AtCOL16 genes promotes flowering under long-day (LD) or short-day (SD) conditions [19,20], but AtCOL7, AtCOL8 and AtCOL9 inhibit flowering under LD conditions [21,22]. In rice, the OsHd1 gene delays flowering under LD conditions and promotes flowering under SD conditions [23], and OsCOL16 inhibits flowering under both SD and LD conditions [24]. StCO, a CO homolog in potato, regulates flowering [25]. Moreover, the CO orthologs in Fuji apple, MdCOL1 and MdCOL2, play a significant role in the growth and development of reproductive organs [26]. Thus, homologous CO genes have a wide range of effects on plant flowering and development.
Mango (Mangifera indica L.) is a member of the Anacardiaceae family and is an economically important fruit tree species. Flowering time has a considerable influence on the yield and quality of mango. Therefore, the discovery and identification of flowering-related genes are necessary for mango production. Mango flowering is the result of a complex process influenced by many factors, but it is not affected by daylength [27]. Several flowering-related regulatory genes have recently been identified in mango. For example, the MiFT, MiSOC1 and MiAP1 genes promote flowering, but the MiCO gene inhibits flowering in Arabidopsis [28,29,30,31]. However, the COL16 gene has not been studied in mango. Here, we isolated two COL genes, MiCOL16A and MiCOL16B, and verified their function. Our results indicated that these two genes strongly influence the flowering and abiotic stress responses of mango.

2. Results

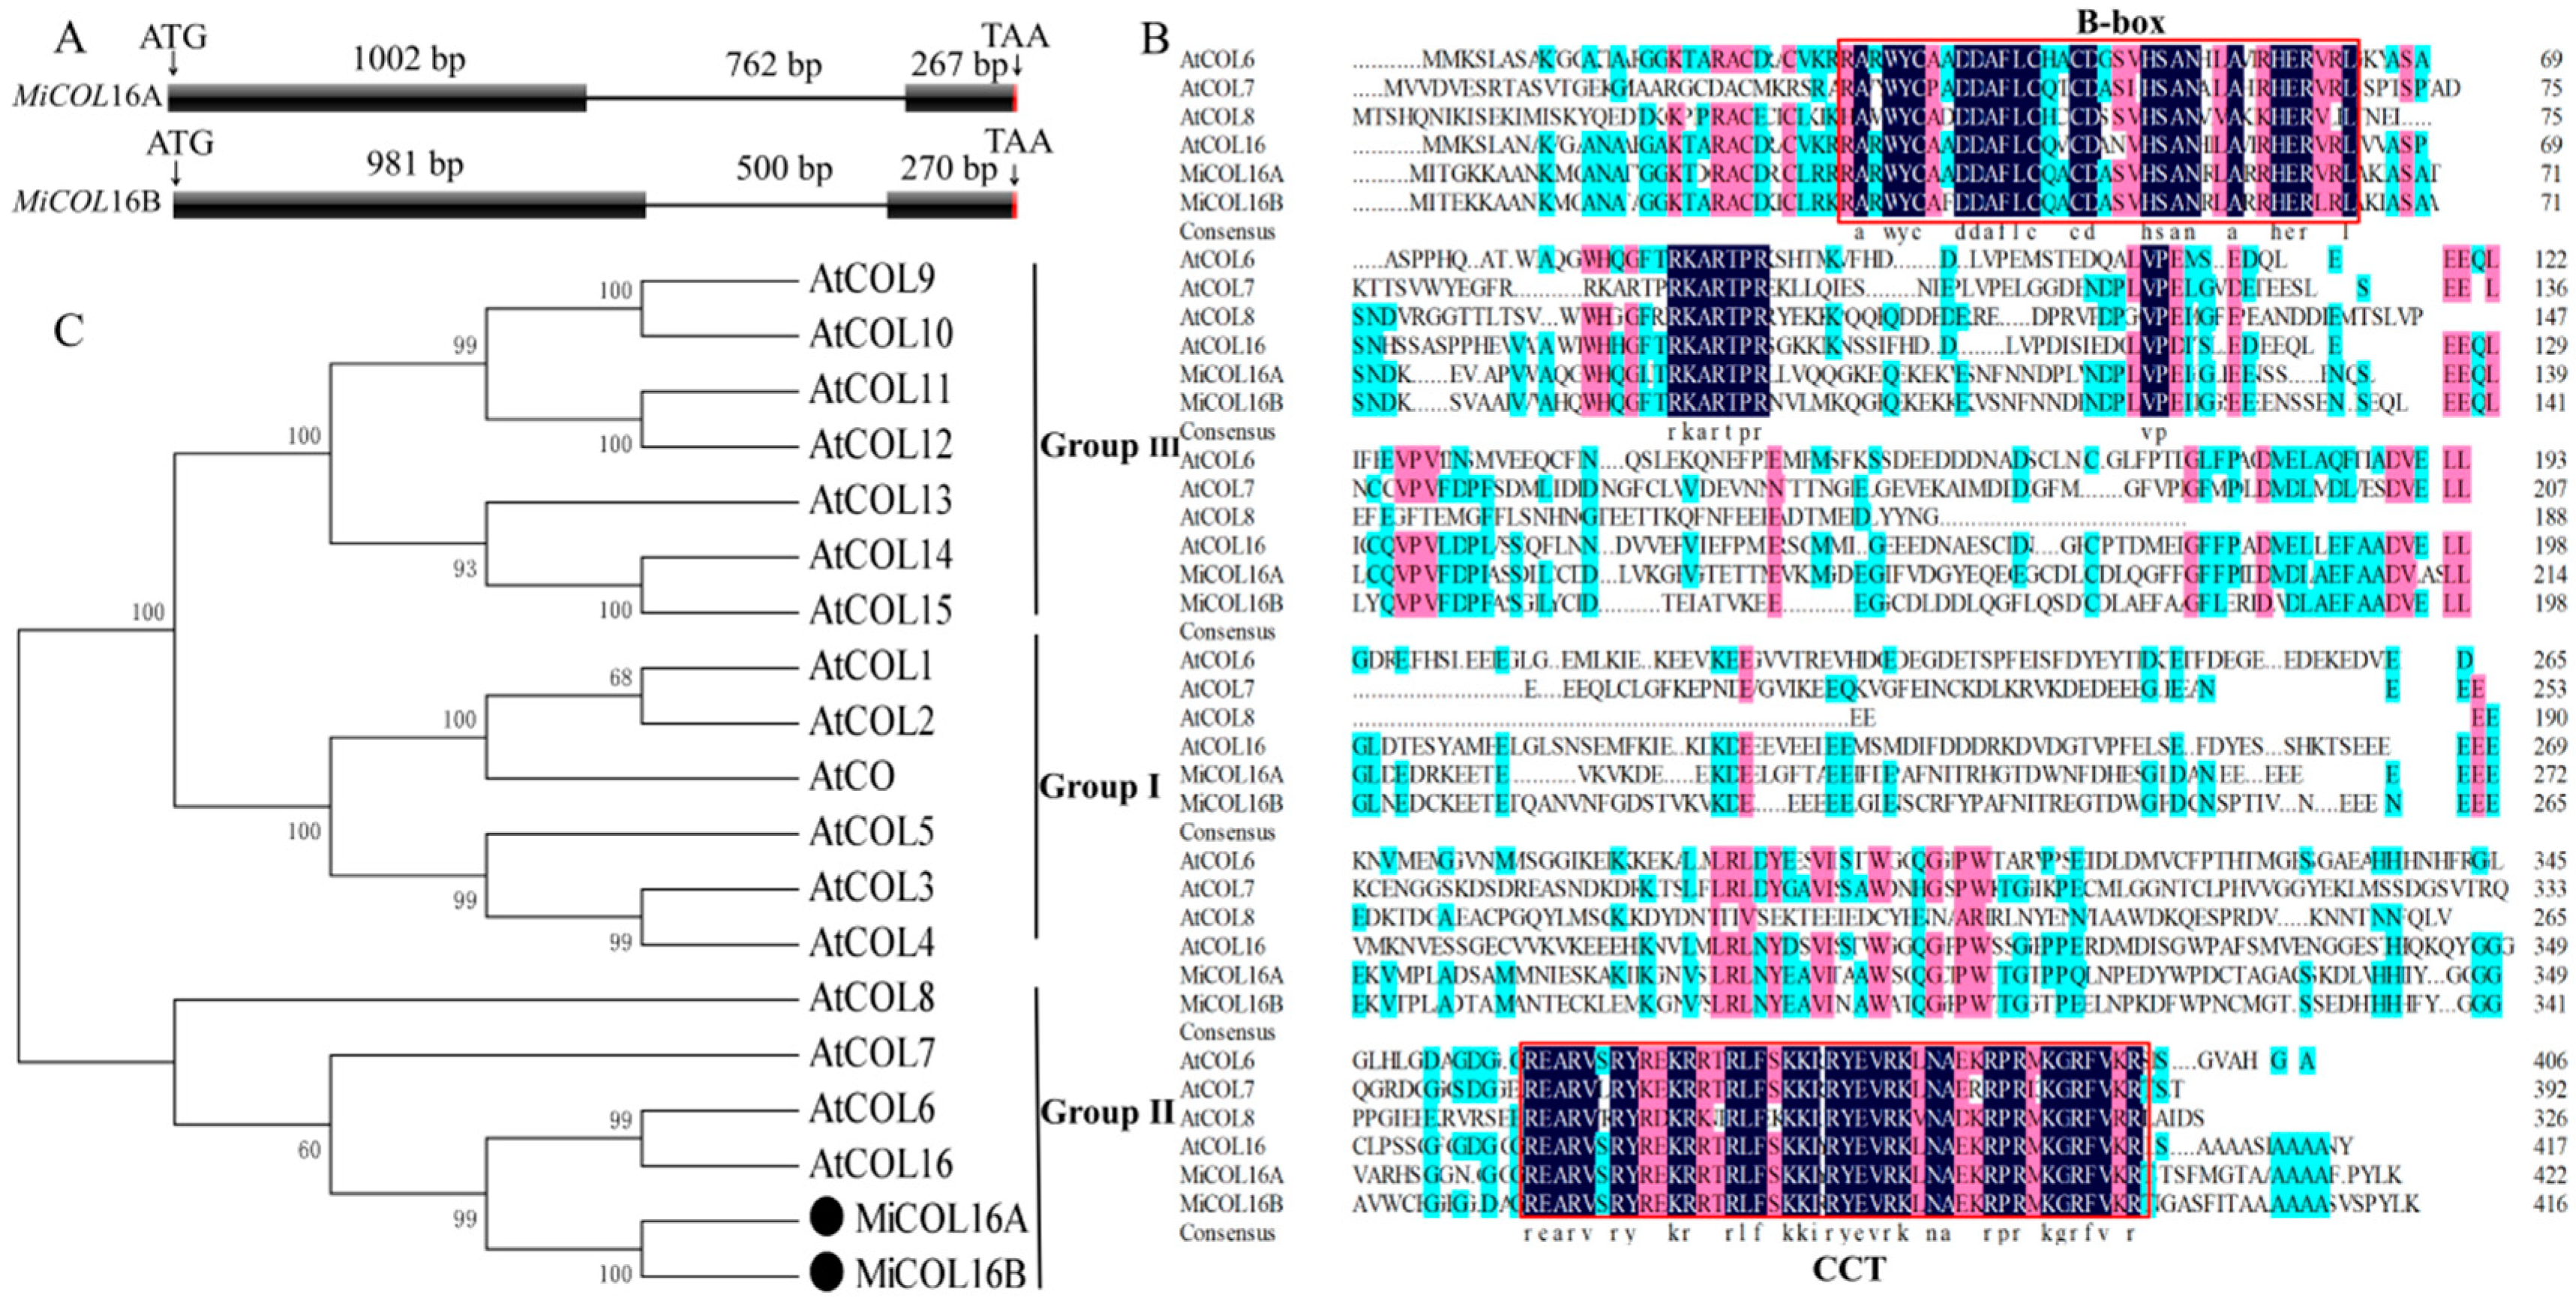
2.1. Isolation and Analysis of MiCOL16A and MiCOL16B

Two CO homologs, MiCOL16A (GenBank No: MW326761) and MiCOL16B (GenBank No: MW326762), were identified from M. indica. L. cv. SiJiMi. The full cDNA sequences of MiCOL16A and MiCOL16B were 1269 bp and 1251 bp, encoding 423 and 417 amino acids, respectively; the two genes were 73.06% identical. The DNA sequences of MiCOL16A and MiCOL16B were 2030 bp and 1751 bp, respectively, and each contained one intron (Figure 1A). The alignment of MiCOL16A and MiCOL16B indicated that both have one CCT and one B-box domain and are highly conserved with other genes (Figure 1B). Phylogenetic analysis showed that these two genes were highly identical to Arabidopsis AtCOL6 and AtCOL16 in group II (Figure 1C). Therefore, these results indicated that MiCOL16A and MiCOL16B belong to group II genes of the CO gene family.

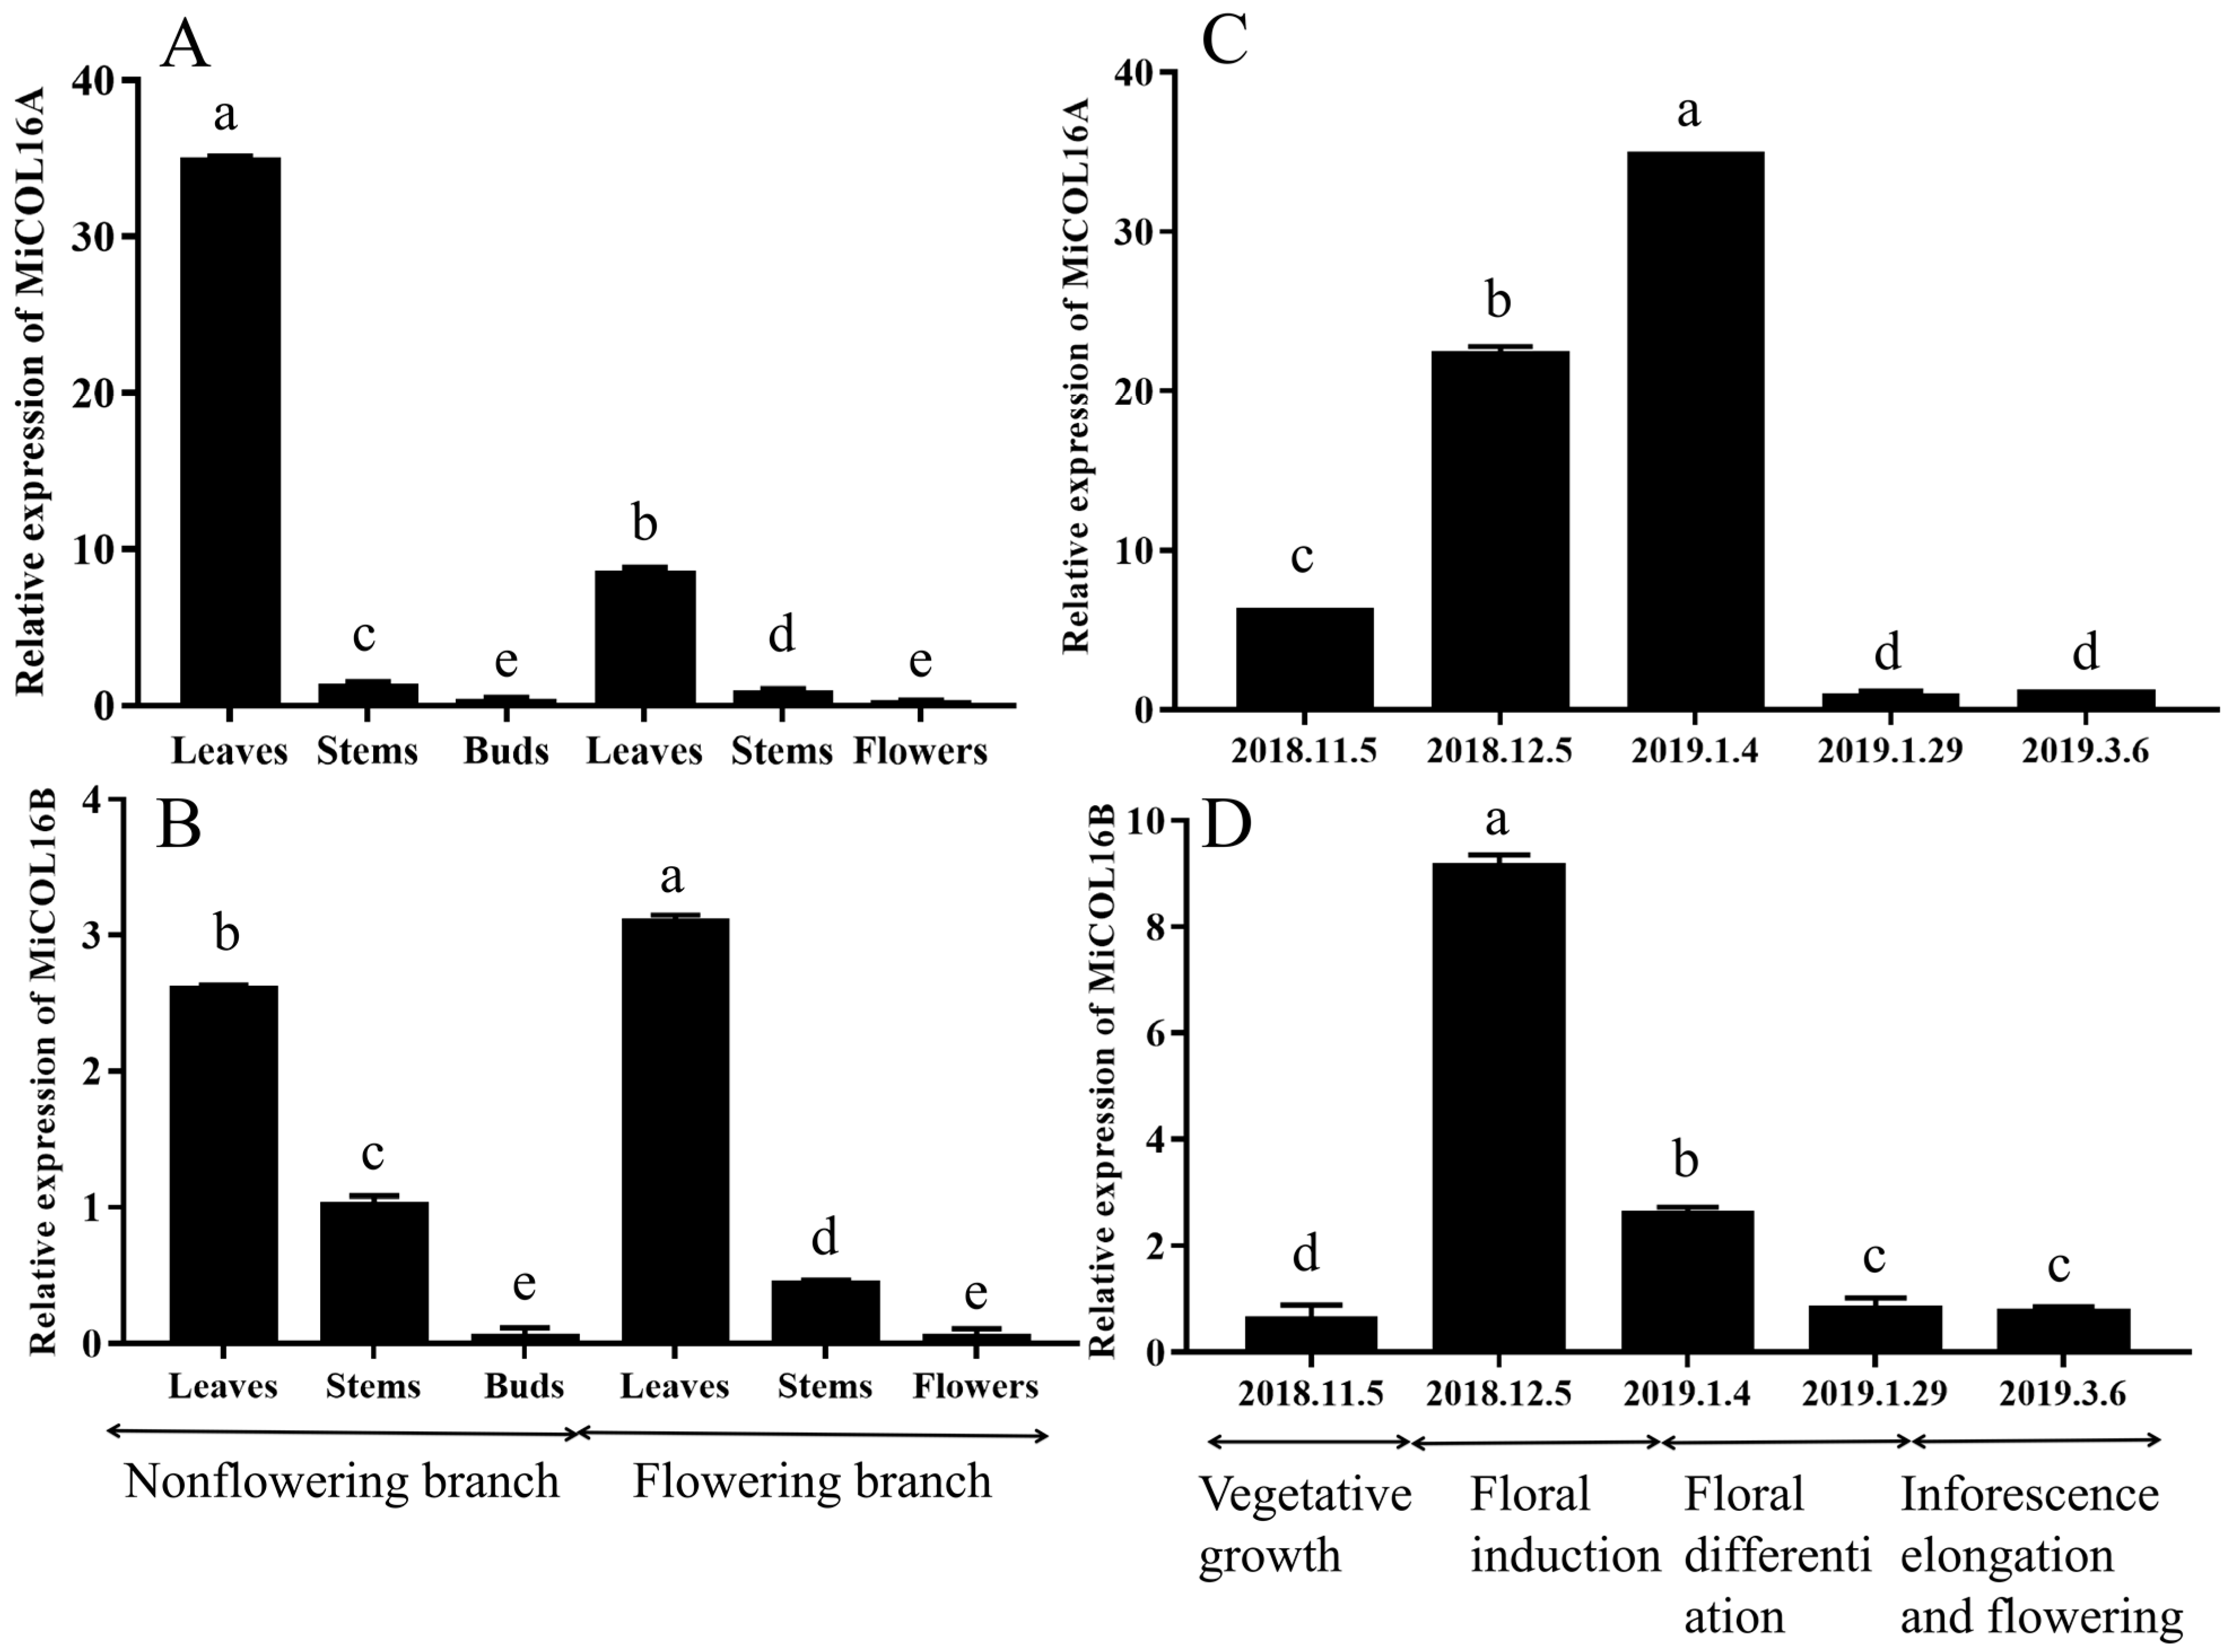
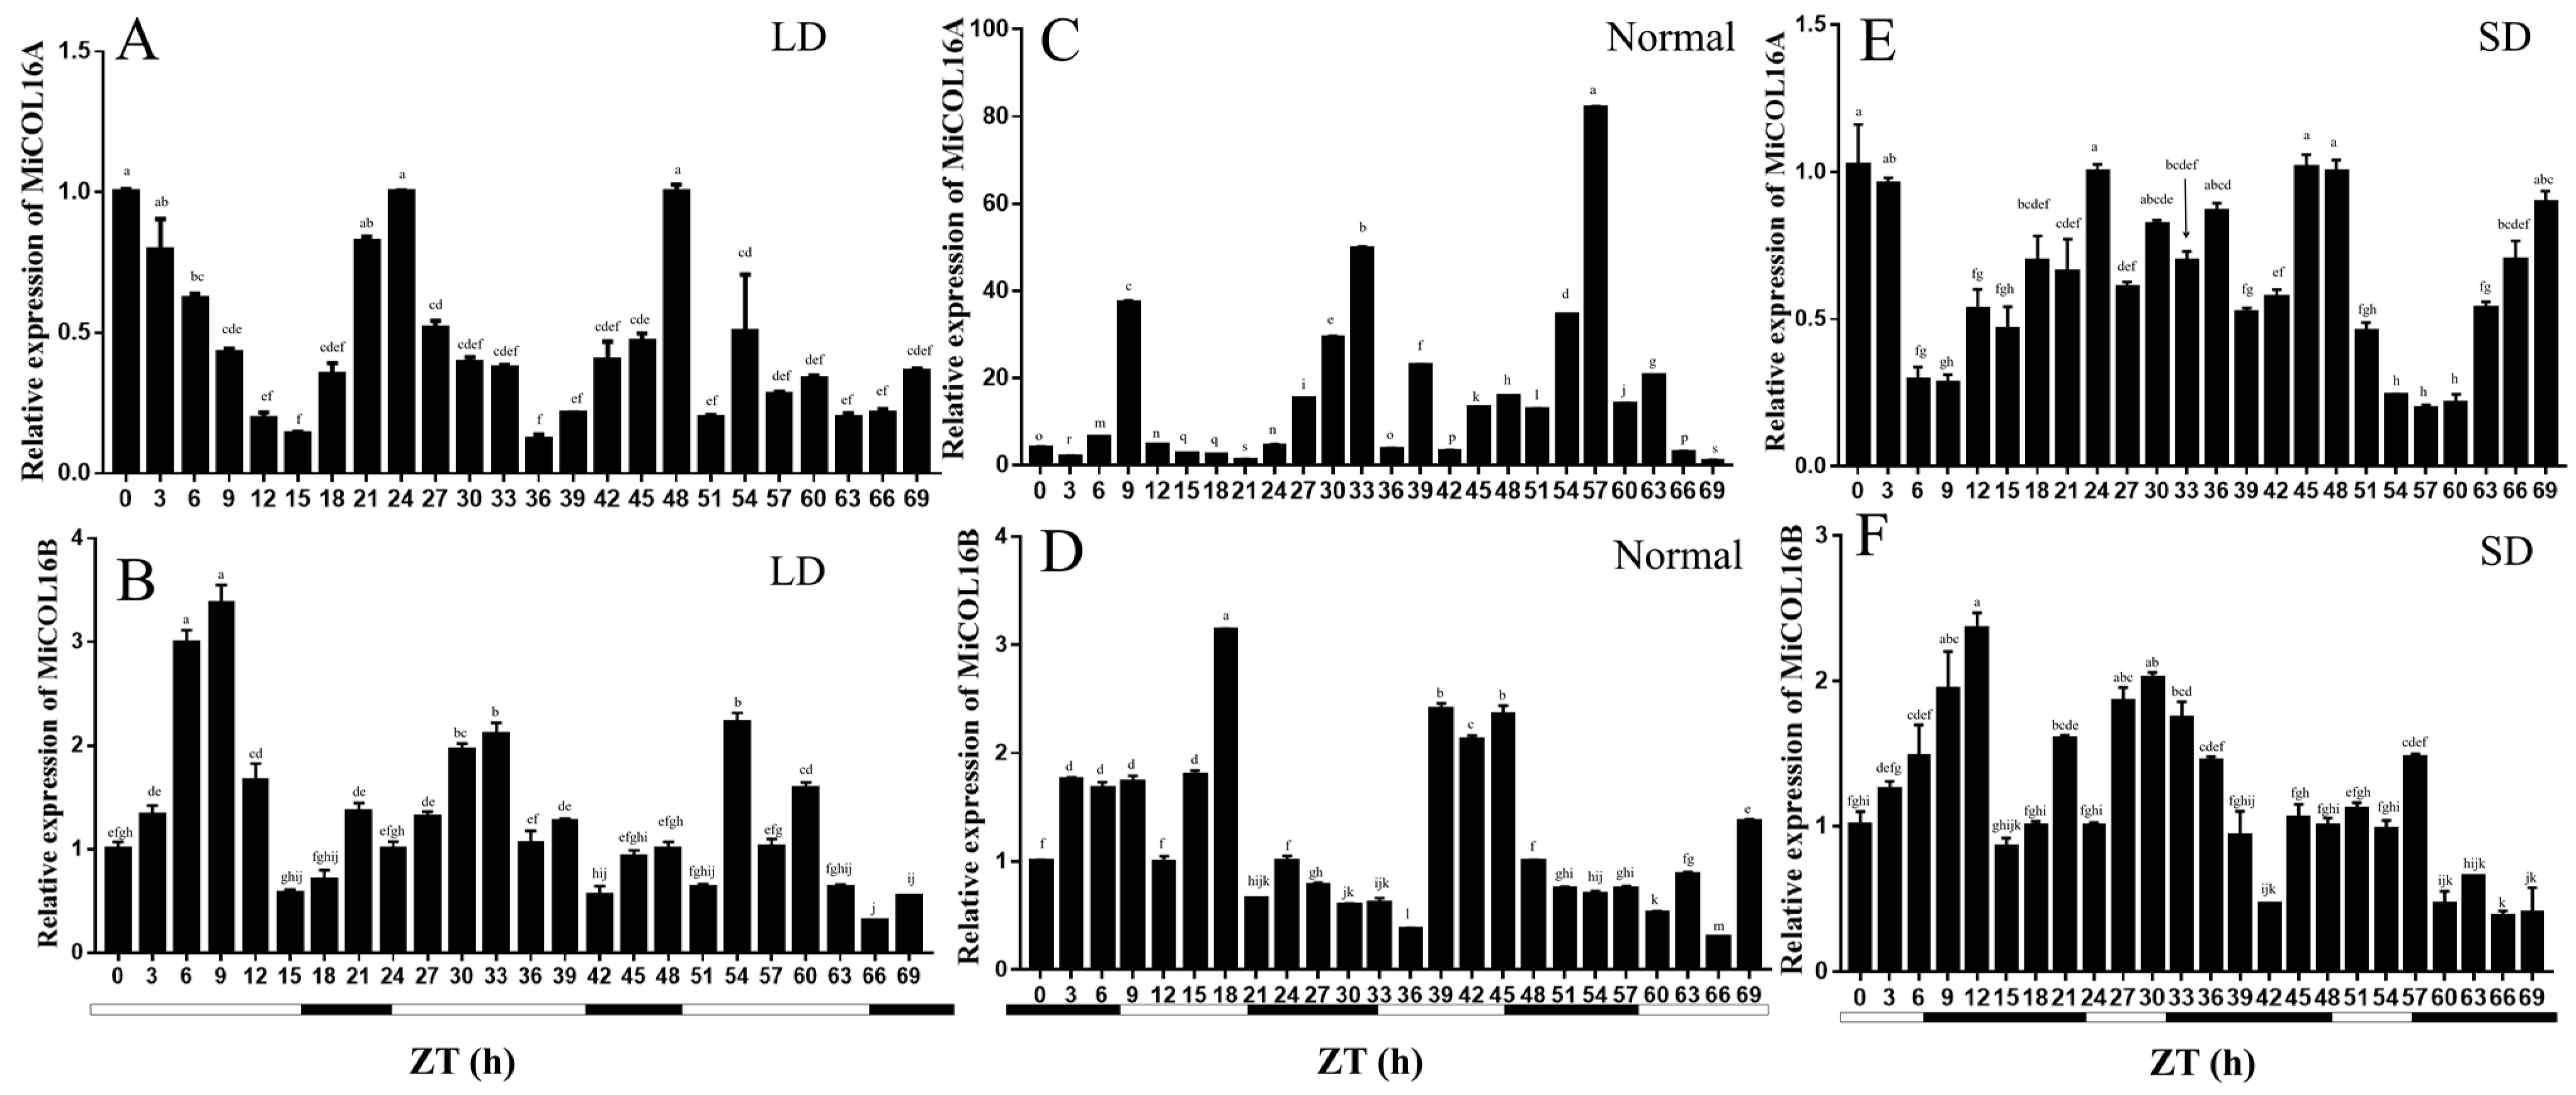
2.2. Expression of MiCOL16A and MiCOL16B in Mango

For the tissue-specific expression tests, qRT–PCR was performed. The results showed that MiCOL16A and MiCOL16B were expressed in all the tested tissues. On different branches, the expression levels of MiCOL16A and MiCOL16B in the leaves were always higher than those in the stems, buds or flowers, and the lowest expression levels of MiCOL16A and MiCOL16B were detected in the buds and flowers. In contrast, the expression level of MiCOL16A in the leaves of nonflowering branches was higher than that in the leaves of flowering branches (Figure 2A), but MiCOL16B expression was lower in the leaves of nonflowering branches than in those of flowering branches (Figure 2B).
To analyze the temporal expression patterns of MiCOL16A and MiCOL16B, qRT–PCR was performed. The results suggested that the two target genes were expressed in the leaves of mango at all tested periods. The expression pattern of MiCOL16A gradually increased from vegetative growth to the late floral induction period and then decreased (Figure 2C). However, MiCOL16B gene expression increased from the vegetative growth period to the early floral induction period and then decreased (Figure 2D).
The circadian-driven expression of MiCOL16A and MiCOL16B was determined using total RNA isolated from ‘SiJiMi’ mango leaves, which were collected every 3 h for three days. The results suggested that under LD conditions, the expression level of MiCOL16A started to increase after dusk, peaked 6 h after dusk and decreased rapidly thereafter before beginning to increase again after dusk (Figure 3A). Interestingly, this pattern also appeared under MD and SD conditions, and this result proved that MiCOL16A expression may be induced by night treatment and is not affected by the length of light (Figure 3C,E). The expression level of MiCOL16B fluctuated with time under different conditions, but there was no regularity. These results suggest that MiCOL16A expression exhibits a diurnal oscillation rhythm, but MiCOL16B expression is not affected by a diurnal rhythm (Figure 3B,D,F).

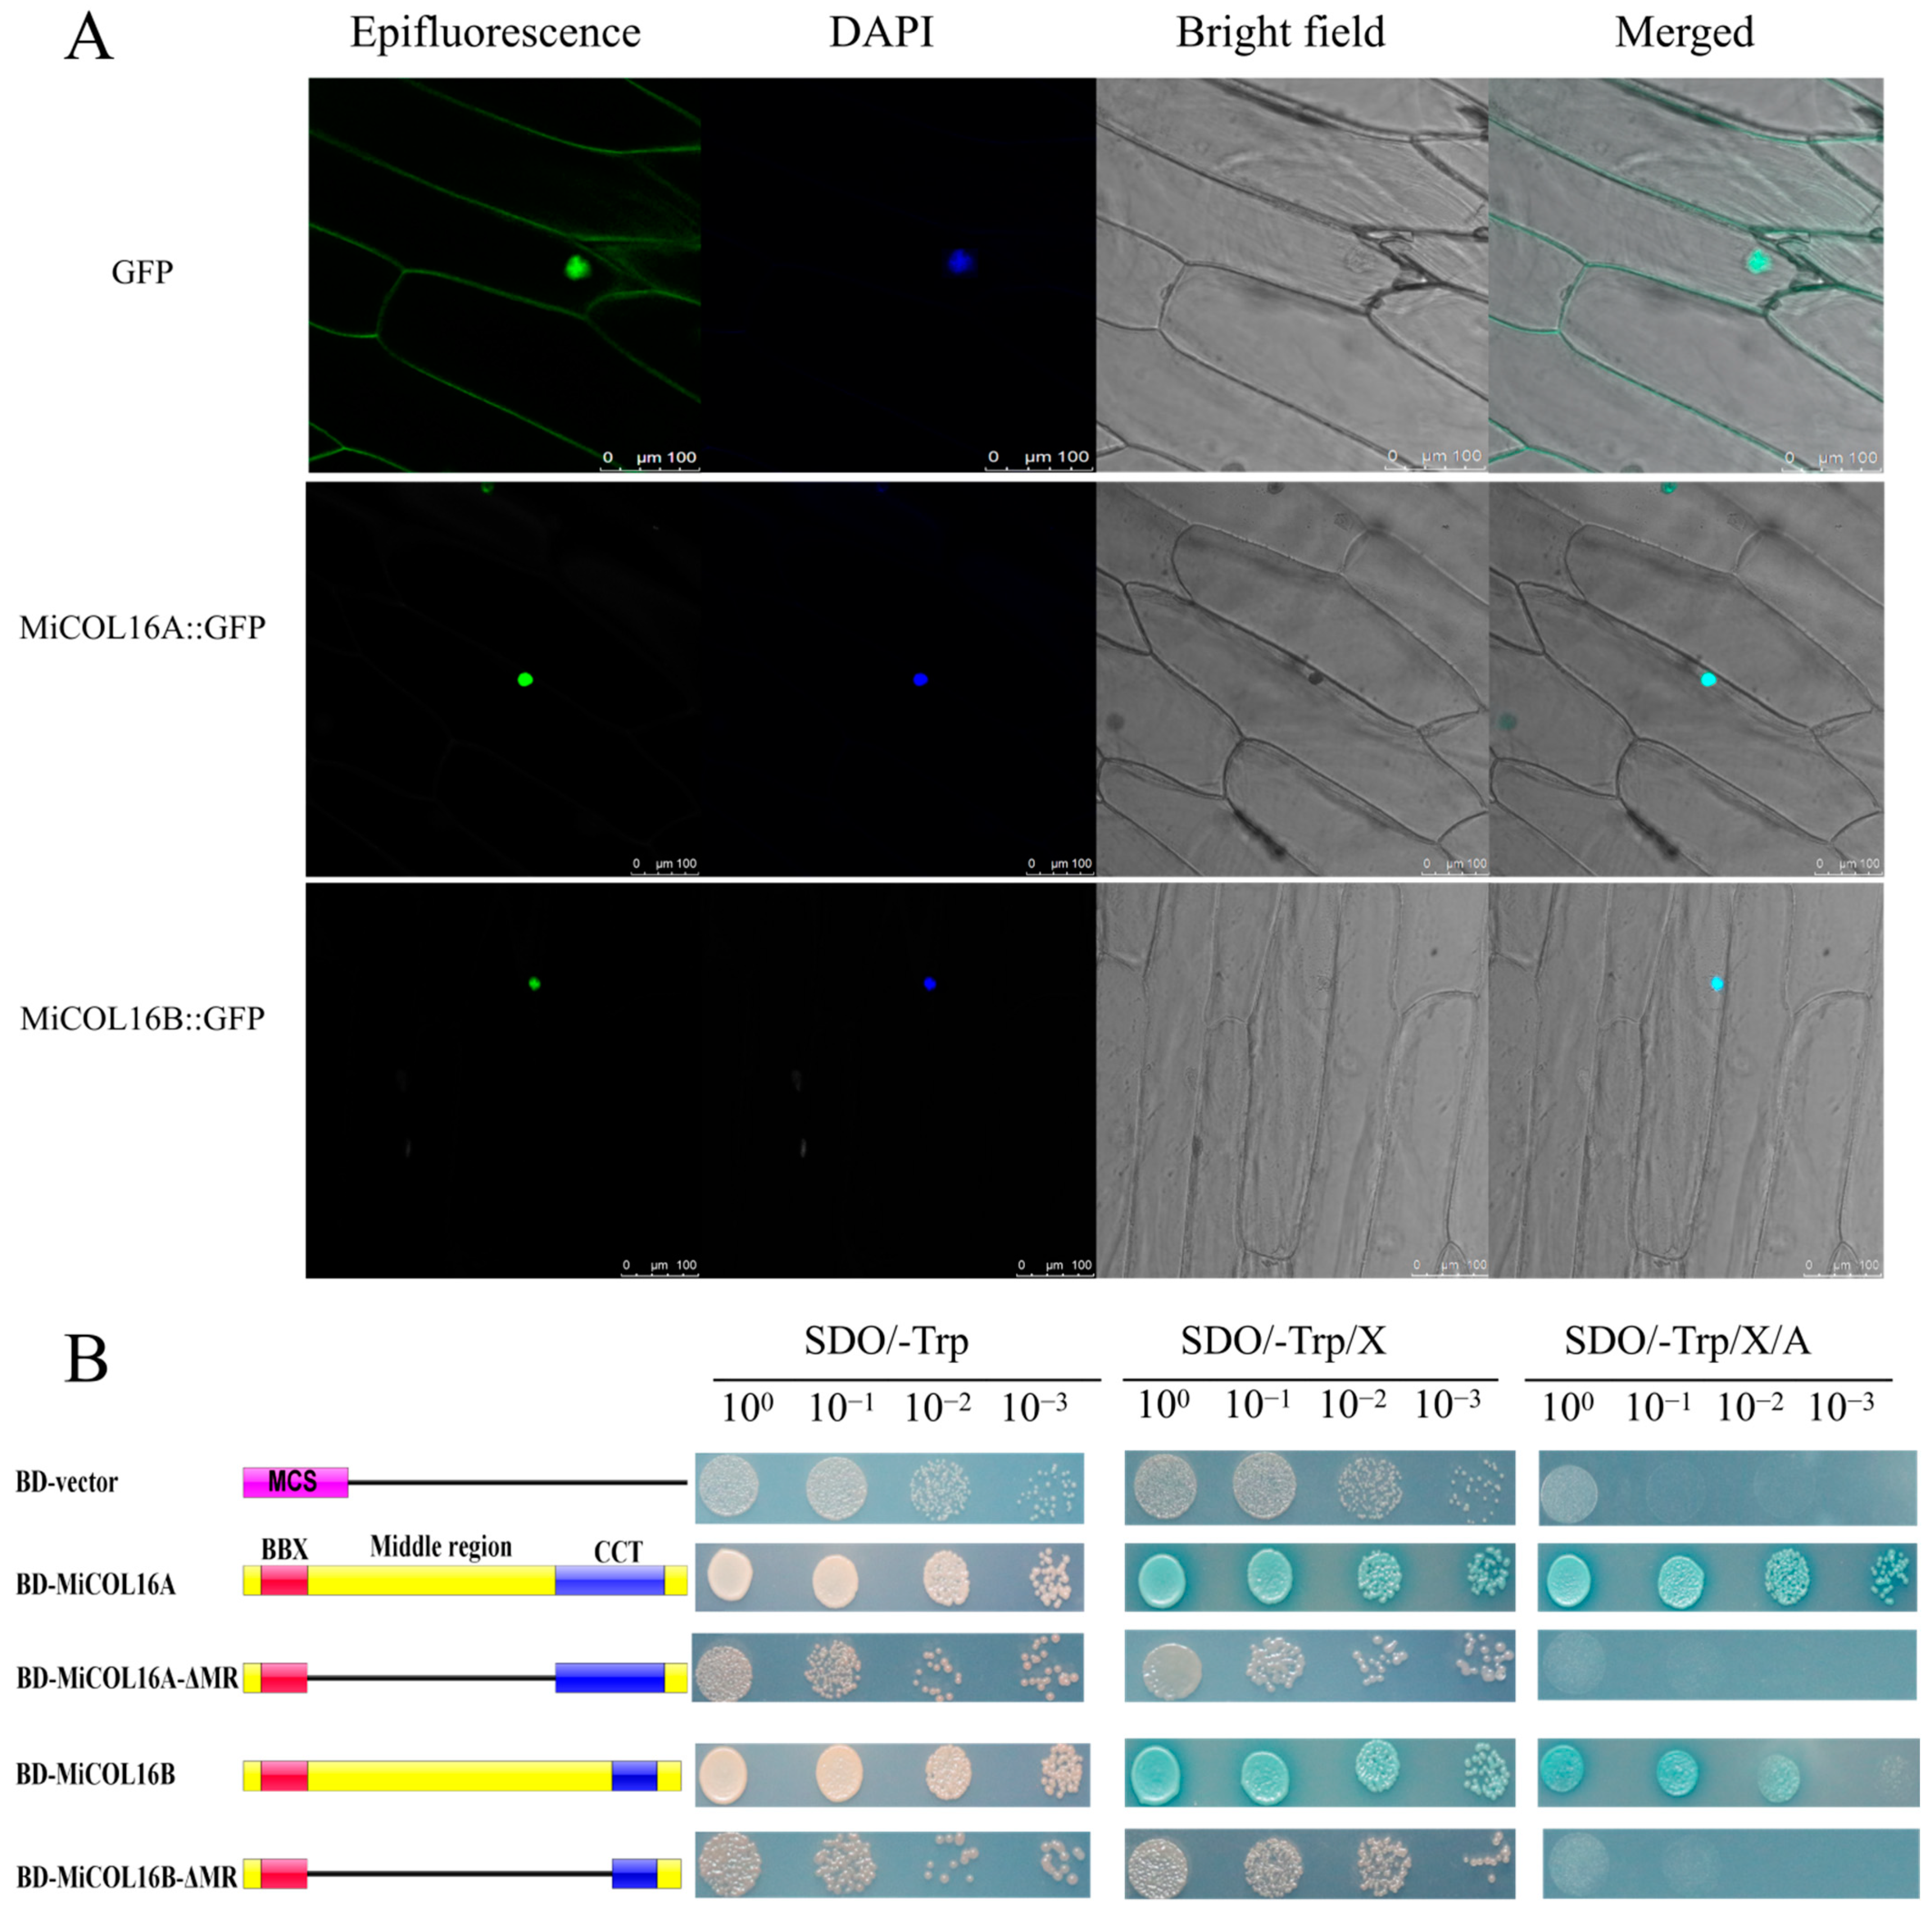
2.3. Both MiCOL16A and MiCOL16B Are Nuclear Proteins with Transcriptional Activation Activity

MiCOL16A and MiCOL16B protein-linked GFP fusion constructs driven by the CaMV 35S promoter were developed for molecular function assays. The GFP fusion constructs were inserted into vectors, which were transferred into onion inner epidermal cells. Single-strand analysis indicated that free GFP localized to the nucleus and cytomembrane, and both the MiCOL16A and MiCOL16B proteins localized to the nucleus (Figure 4A).
A transcriptional activity assay was performed in yeast cells to demonstrate whether MiCOL16A or MiCOL16B had transcriptional activation activity. According to a previous study, the MR between the B-BOX and CCT domains is required for CO transcriptional activity [24,32,33]. Thus, MiCOL16A, MiCOL16B, MiCOL16A-ΔMR and MiCOL16B-ΔMR were fused into a pGBKT7 vector, and an empty pGBKT7 vector was used as a control. The five different plasmids were transferred into yeast cells, which were then transferred onto different plates. Three days later, all the transformants grew equally well on selective SD/-Trp media. On these three selective media, the BD-MiCOL16A and BD-MiCOL16B transformants grew well and turned blue, but the yeast transformed with the BD-vector, BD-MiCOL16A-ΔMR and BD-MiCOL16B-ΔMR grew only on SD/-Trp/X-α-gal plates and did not turn blue (Figure 4B). Together, α-gal activity could not be detected when the MR region was deleted. These results showed that through their MR domains, MiCOL16A and MiCOL16B have transcriptional activation activity in yeast.

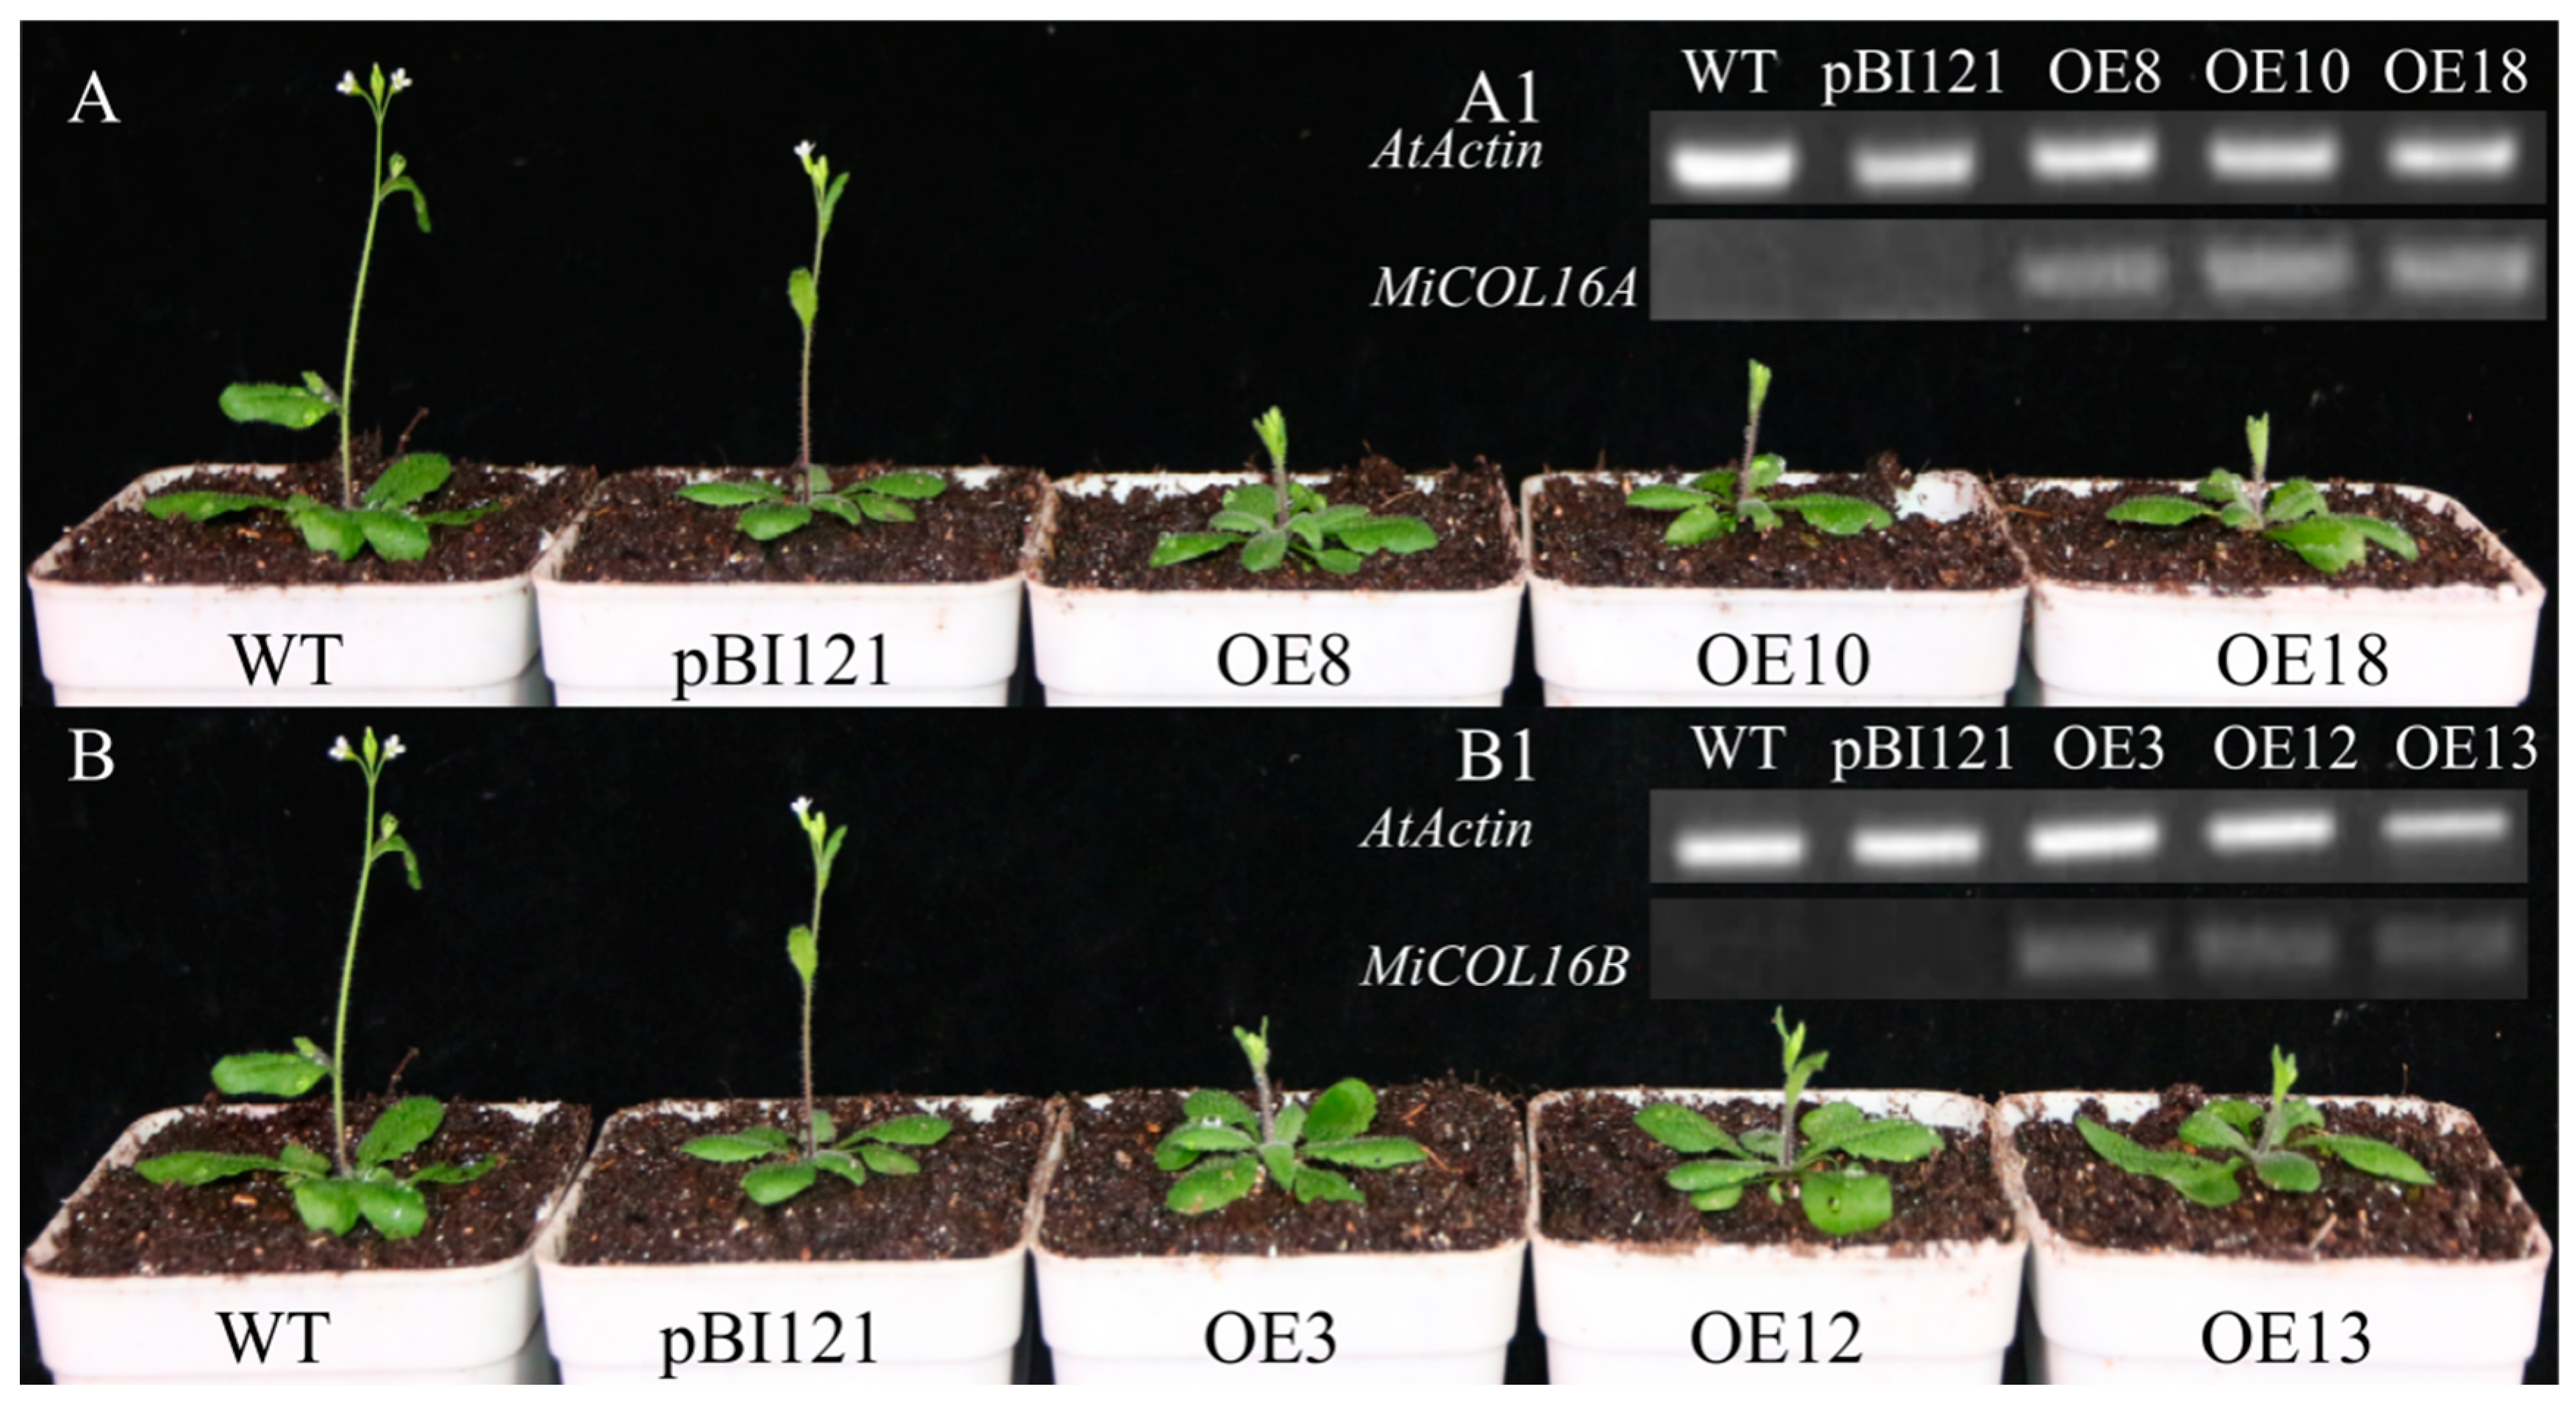
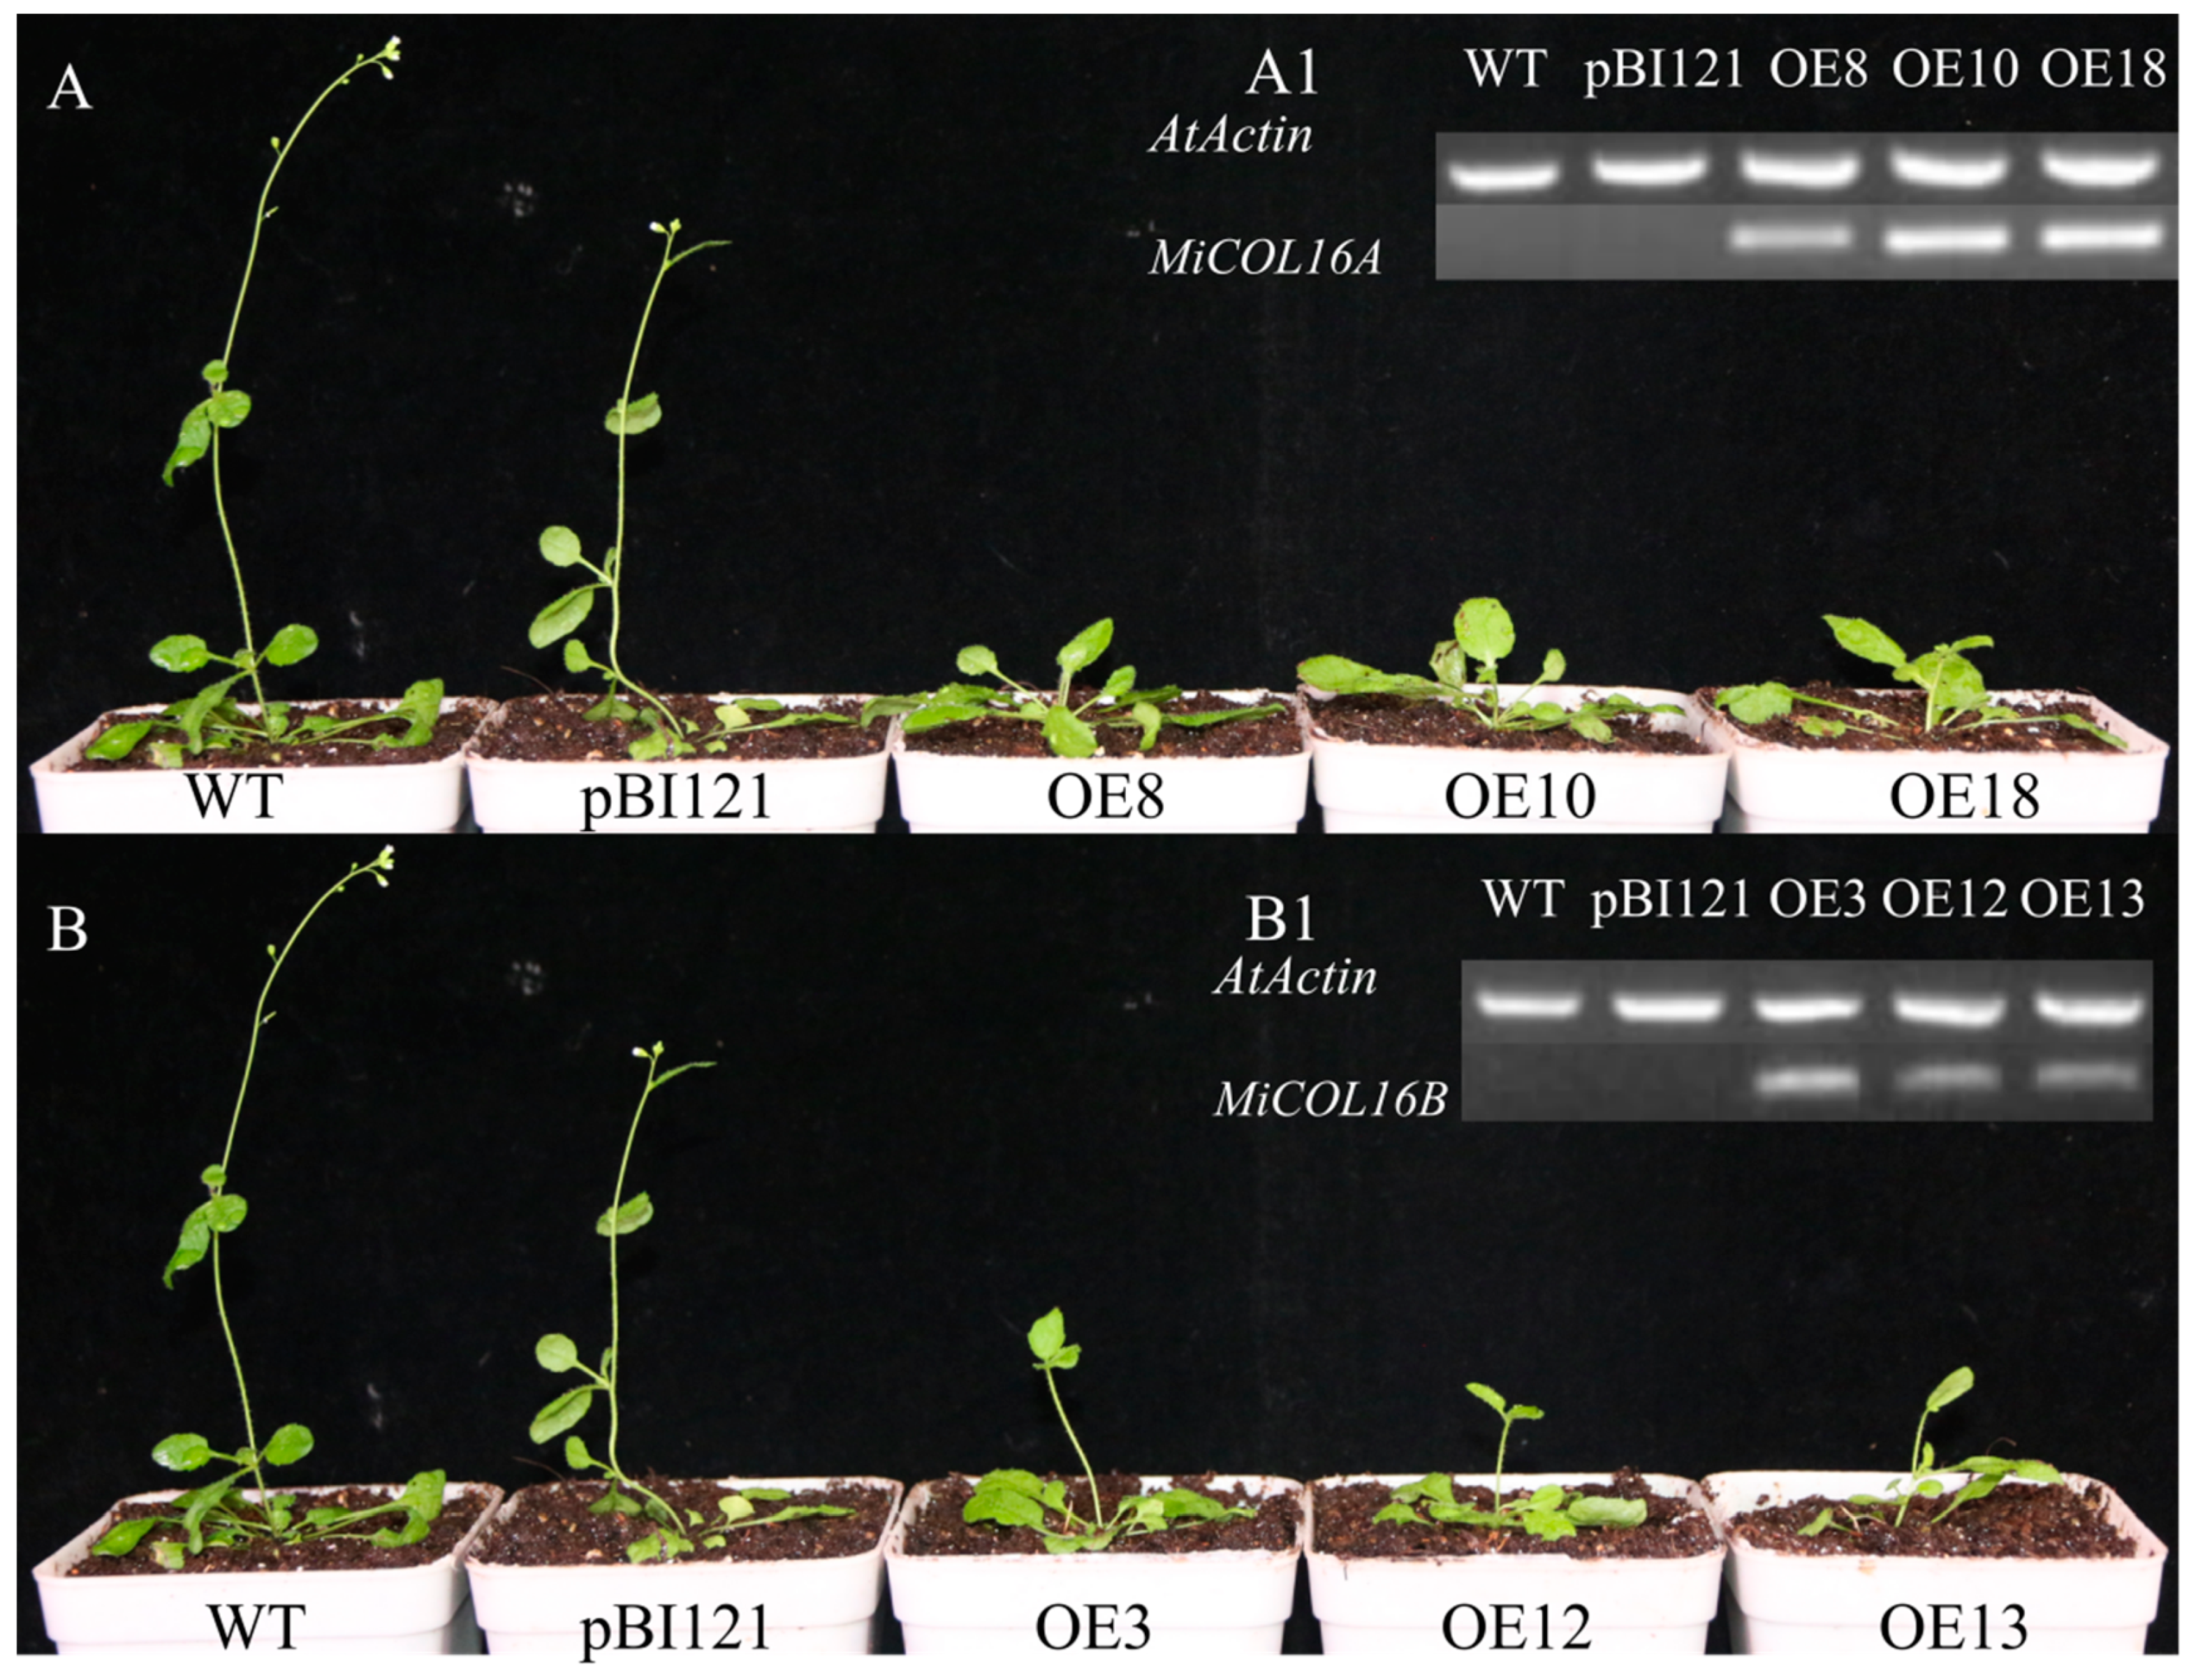
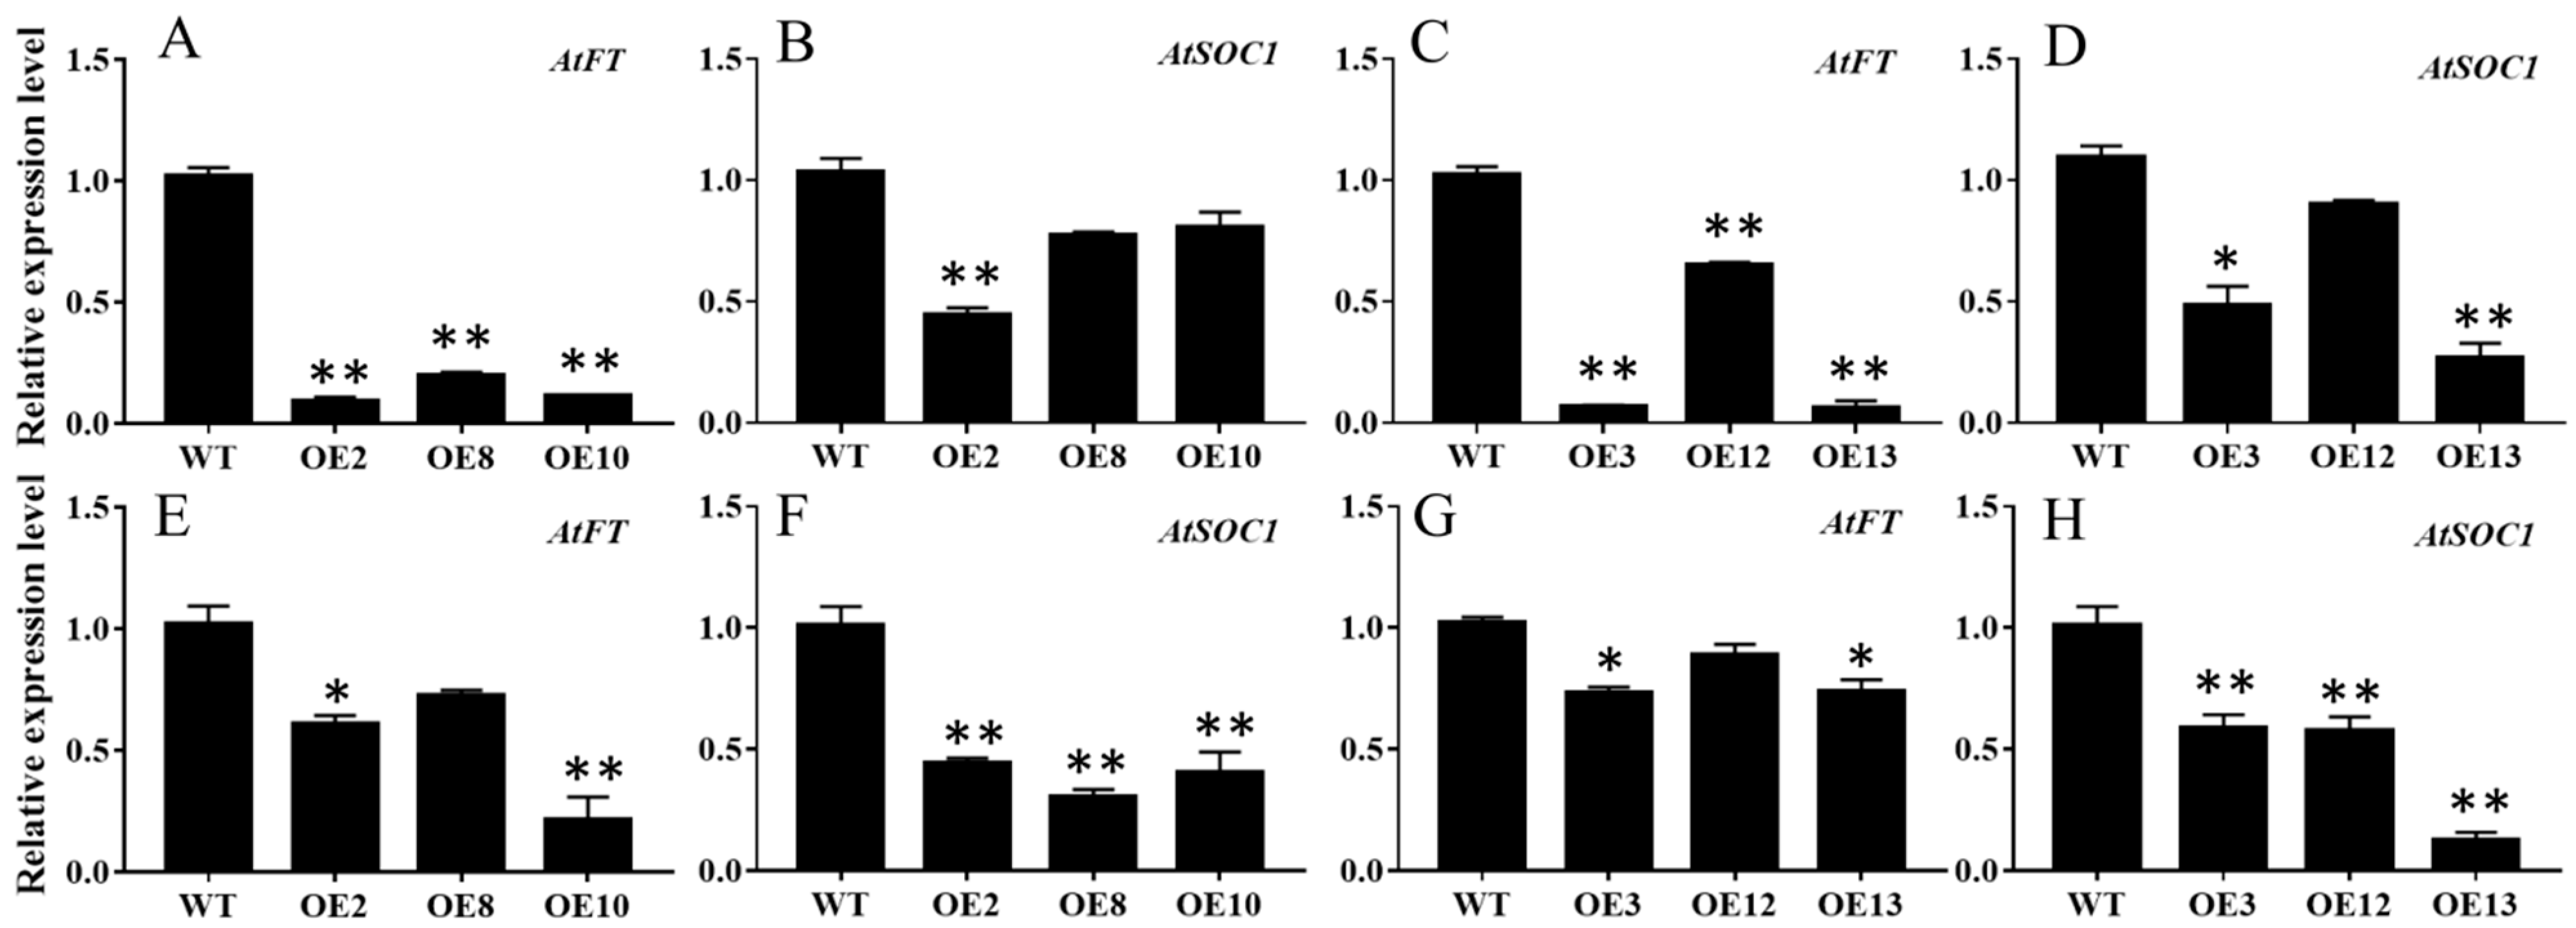
2.4. Overexpression of MiCOL16A and MiCOL16B Delayed Flowering in Arabidopsis

To determine whether MiCOL16A and MiCOL16B are involved in the regulation of flowering time, they were overexpressed in Arabidopsis (under the control of the CaMV 35S promoter). We obtained 15 and 10 independent transgenic lines of MiCOL16A and MiCOL16B, respectively, and we selected three homozygous lines for each construct from within the T3 generation and planted them under LD or SD conditions. The PCR analysis results showed that MiCOL16A and MiCOL16B were expressed in the transgenic plants but not in the WT or empty vector-transformed Arabidopsis plants under LD (Figure 5(A1,B1)) or SD conditions (Figure 6(A1,B1)). Under LD and SD conditions, both the MiCOL16A and MiCOL16B transgenic lines flowered later than the WT and empty vector-transformed plants. At flowering, compared with the WT and empty vector-transformed plants, the MiCOL16A and MiCOL16B transgenic plants had more rosette leaves (Figure 5 and Figure 6) (Table 1).
To further dissect the expression patterns of the floral integrator genes in the MiCOL16A and MiCOL16B overexpression lines, the transcript levels of AtFT and AtSOC1 were measured in the WT and overexpression plants under LD or SD conditions (Figure 7). The results showed that both MiCOL16A and MiCOL16B significantly repressed the expression of AtSOC1 and AtFT in Arabidopsis under LD and SD conditions.

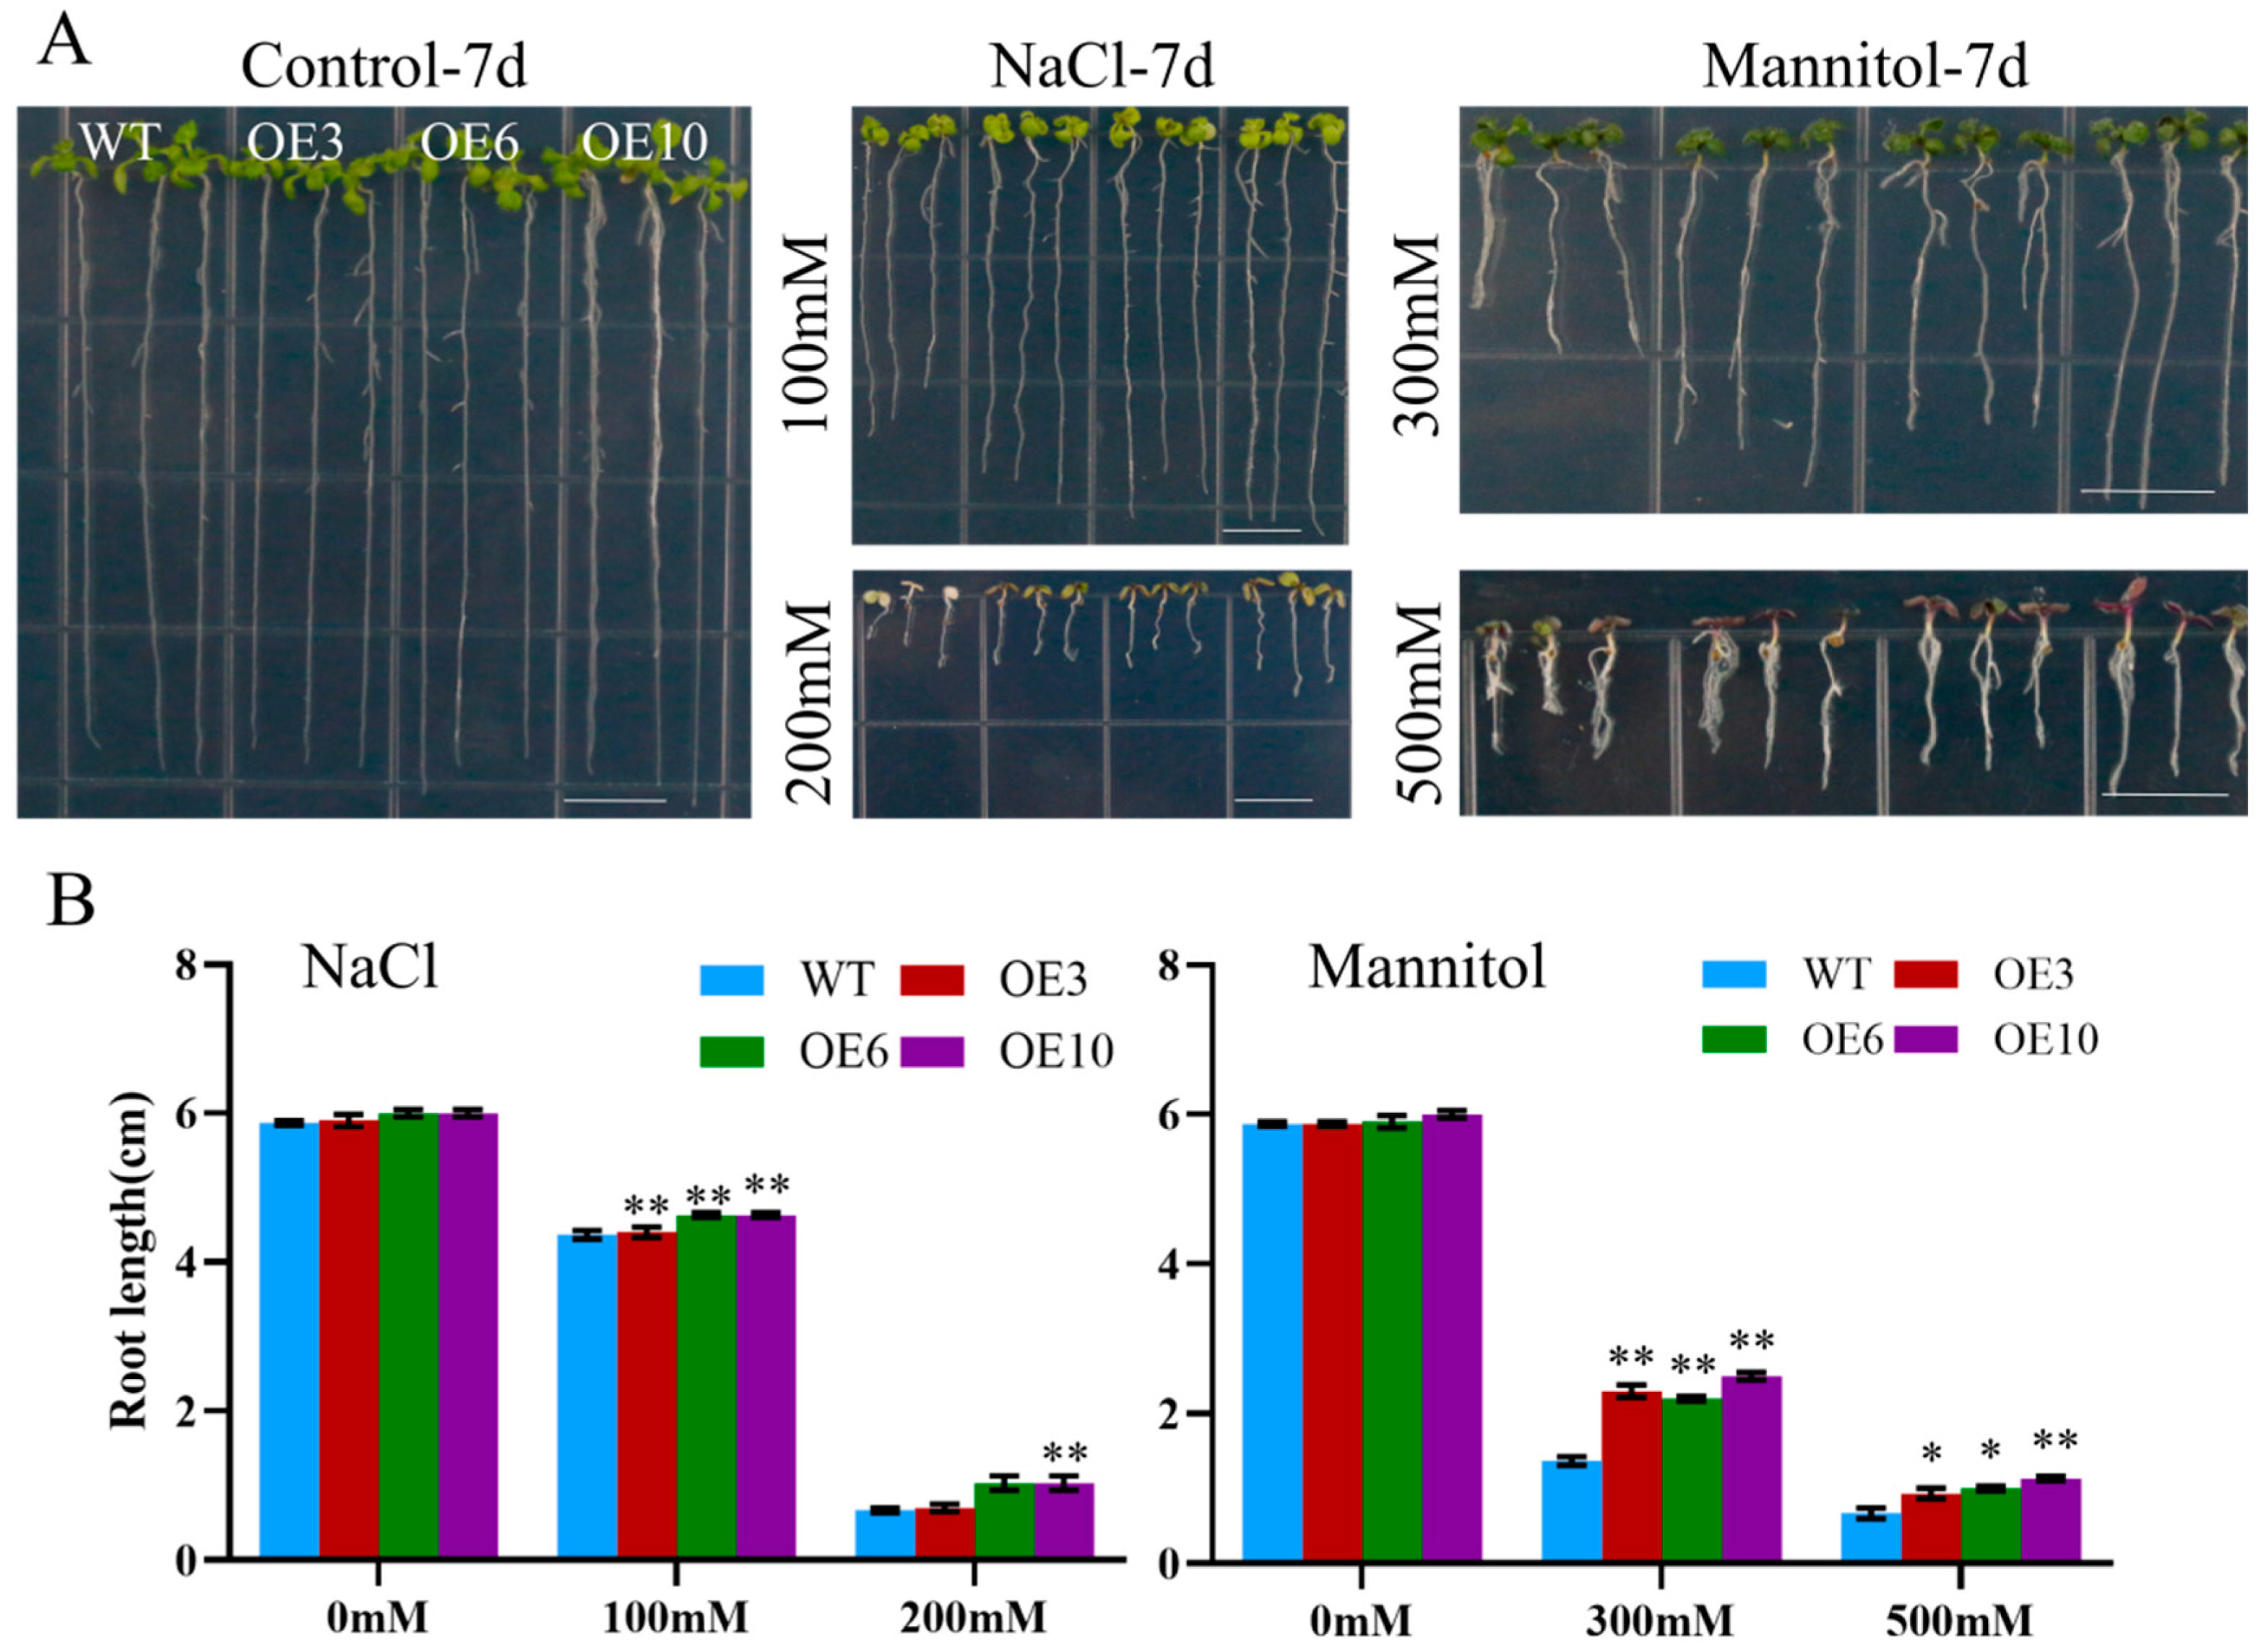
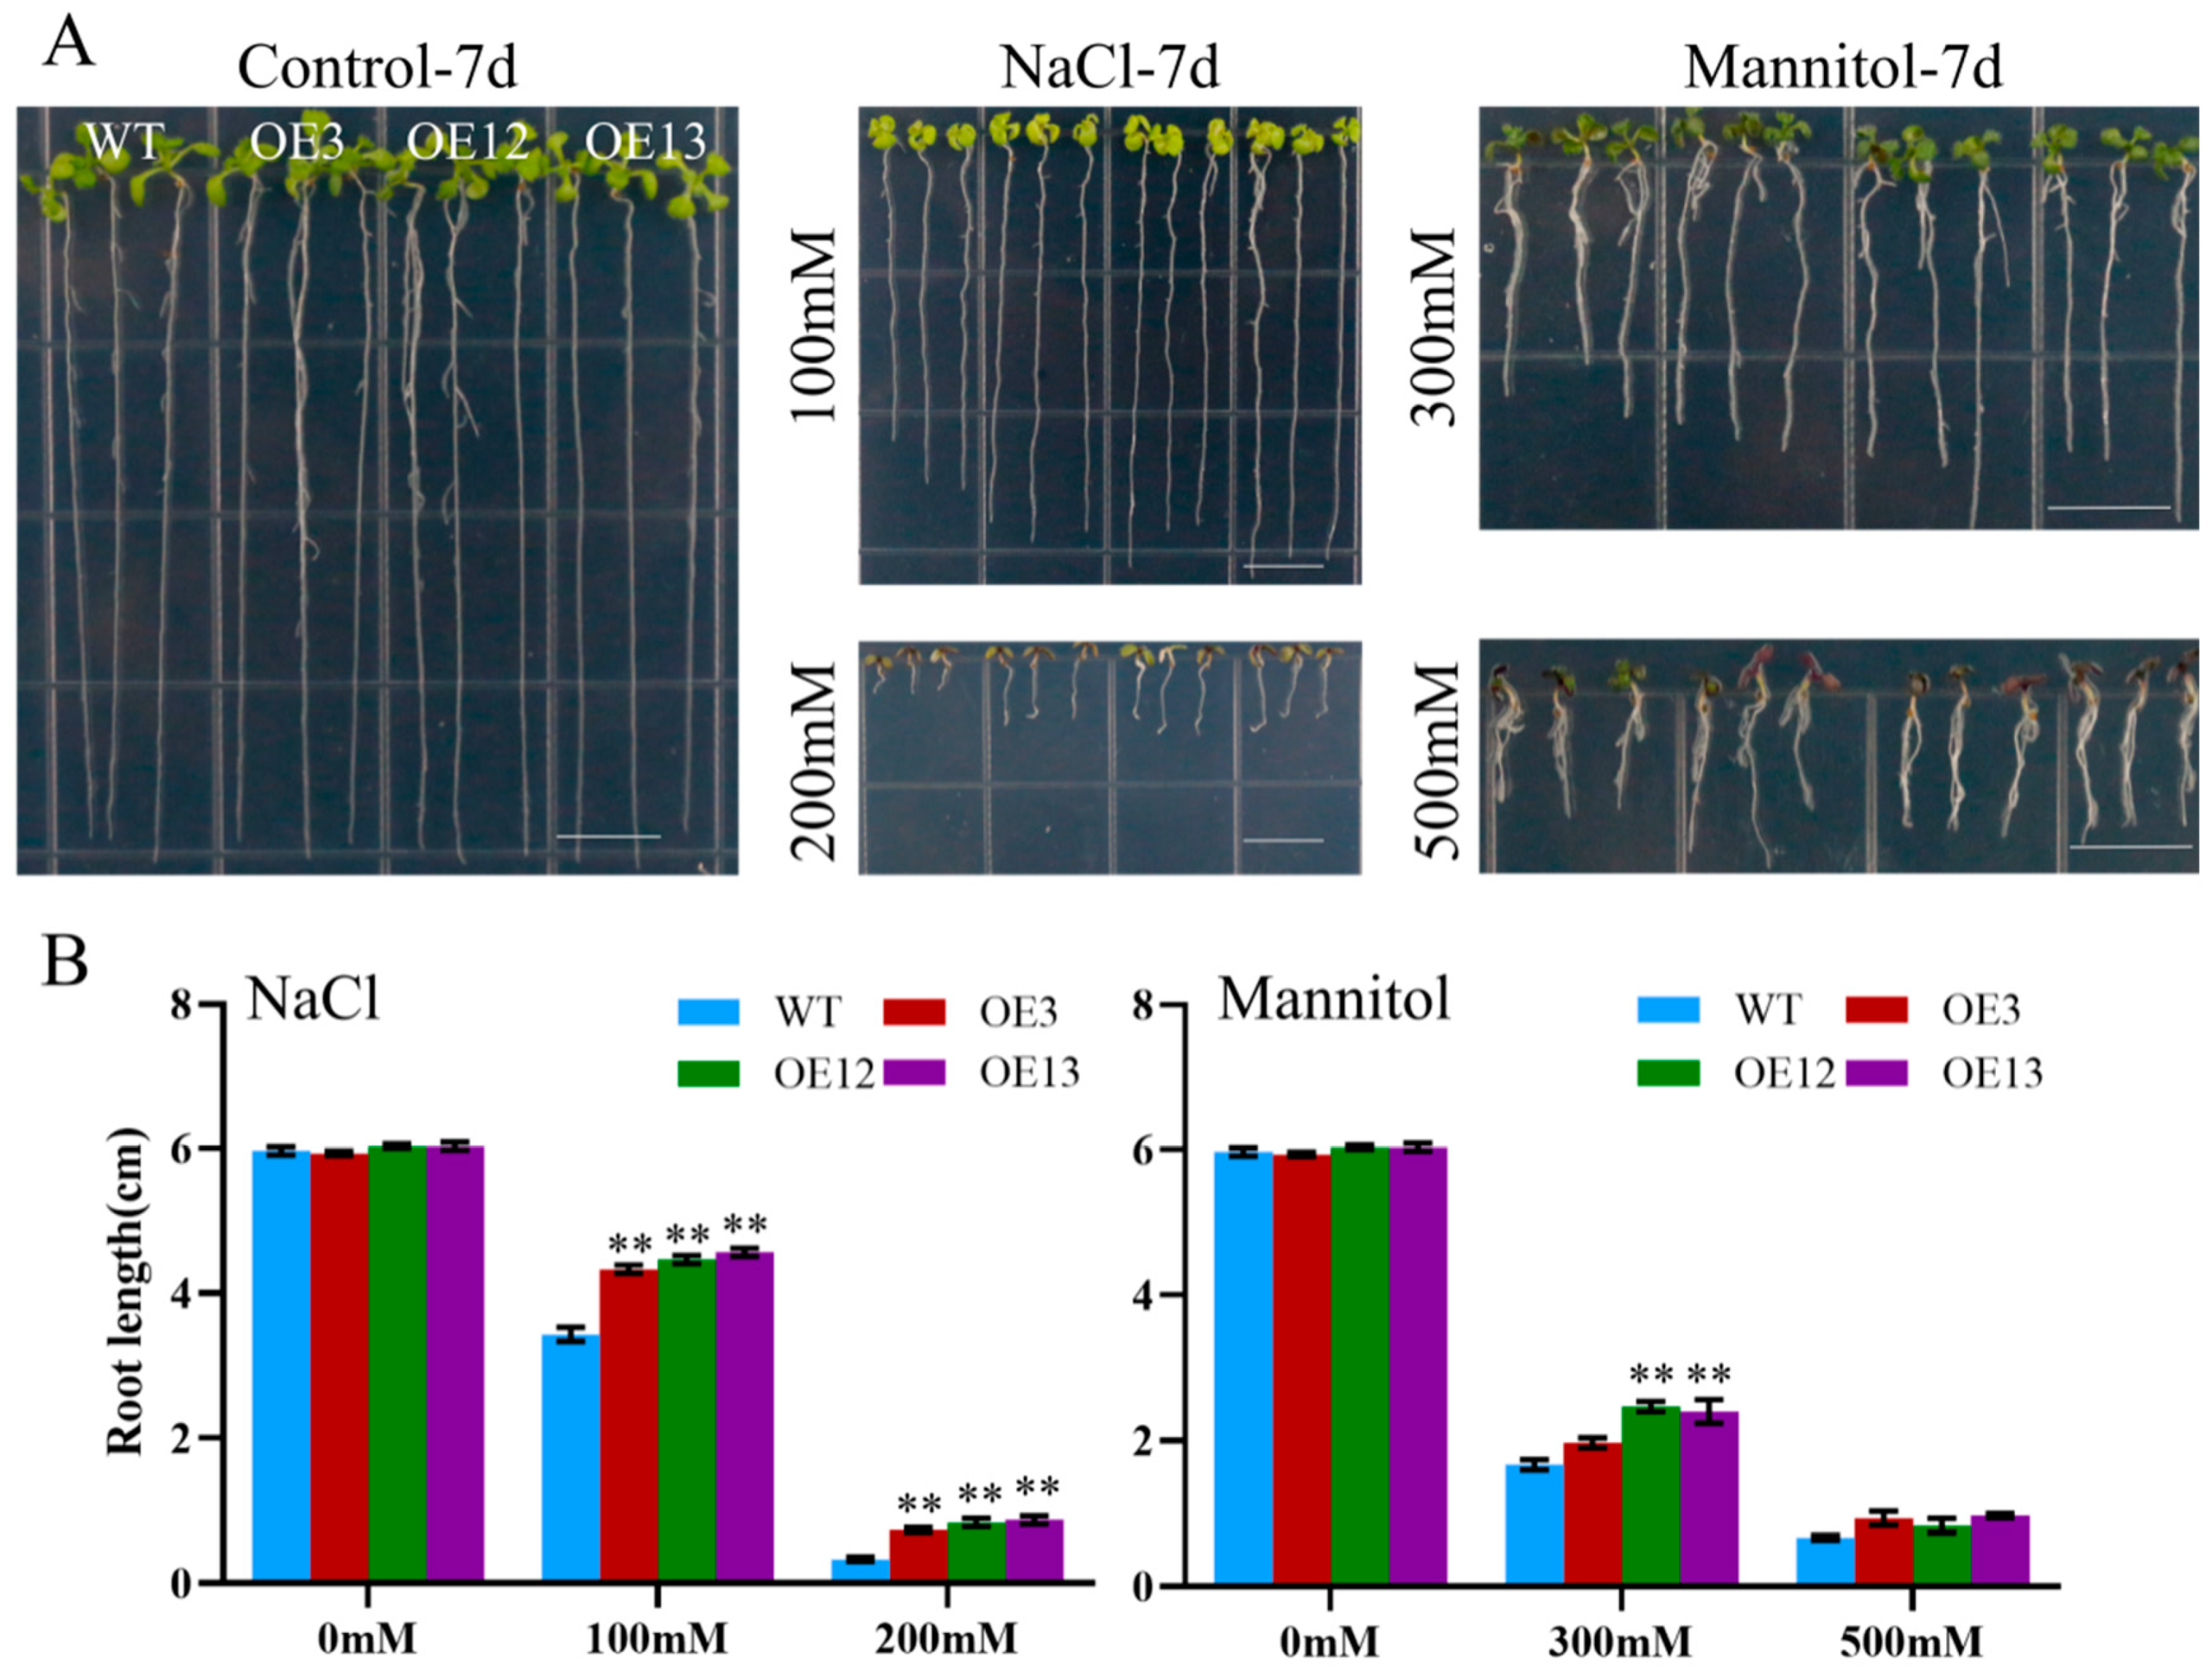
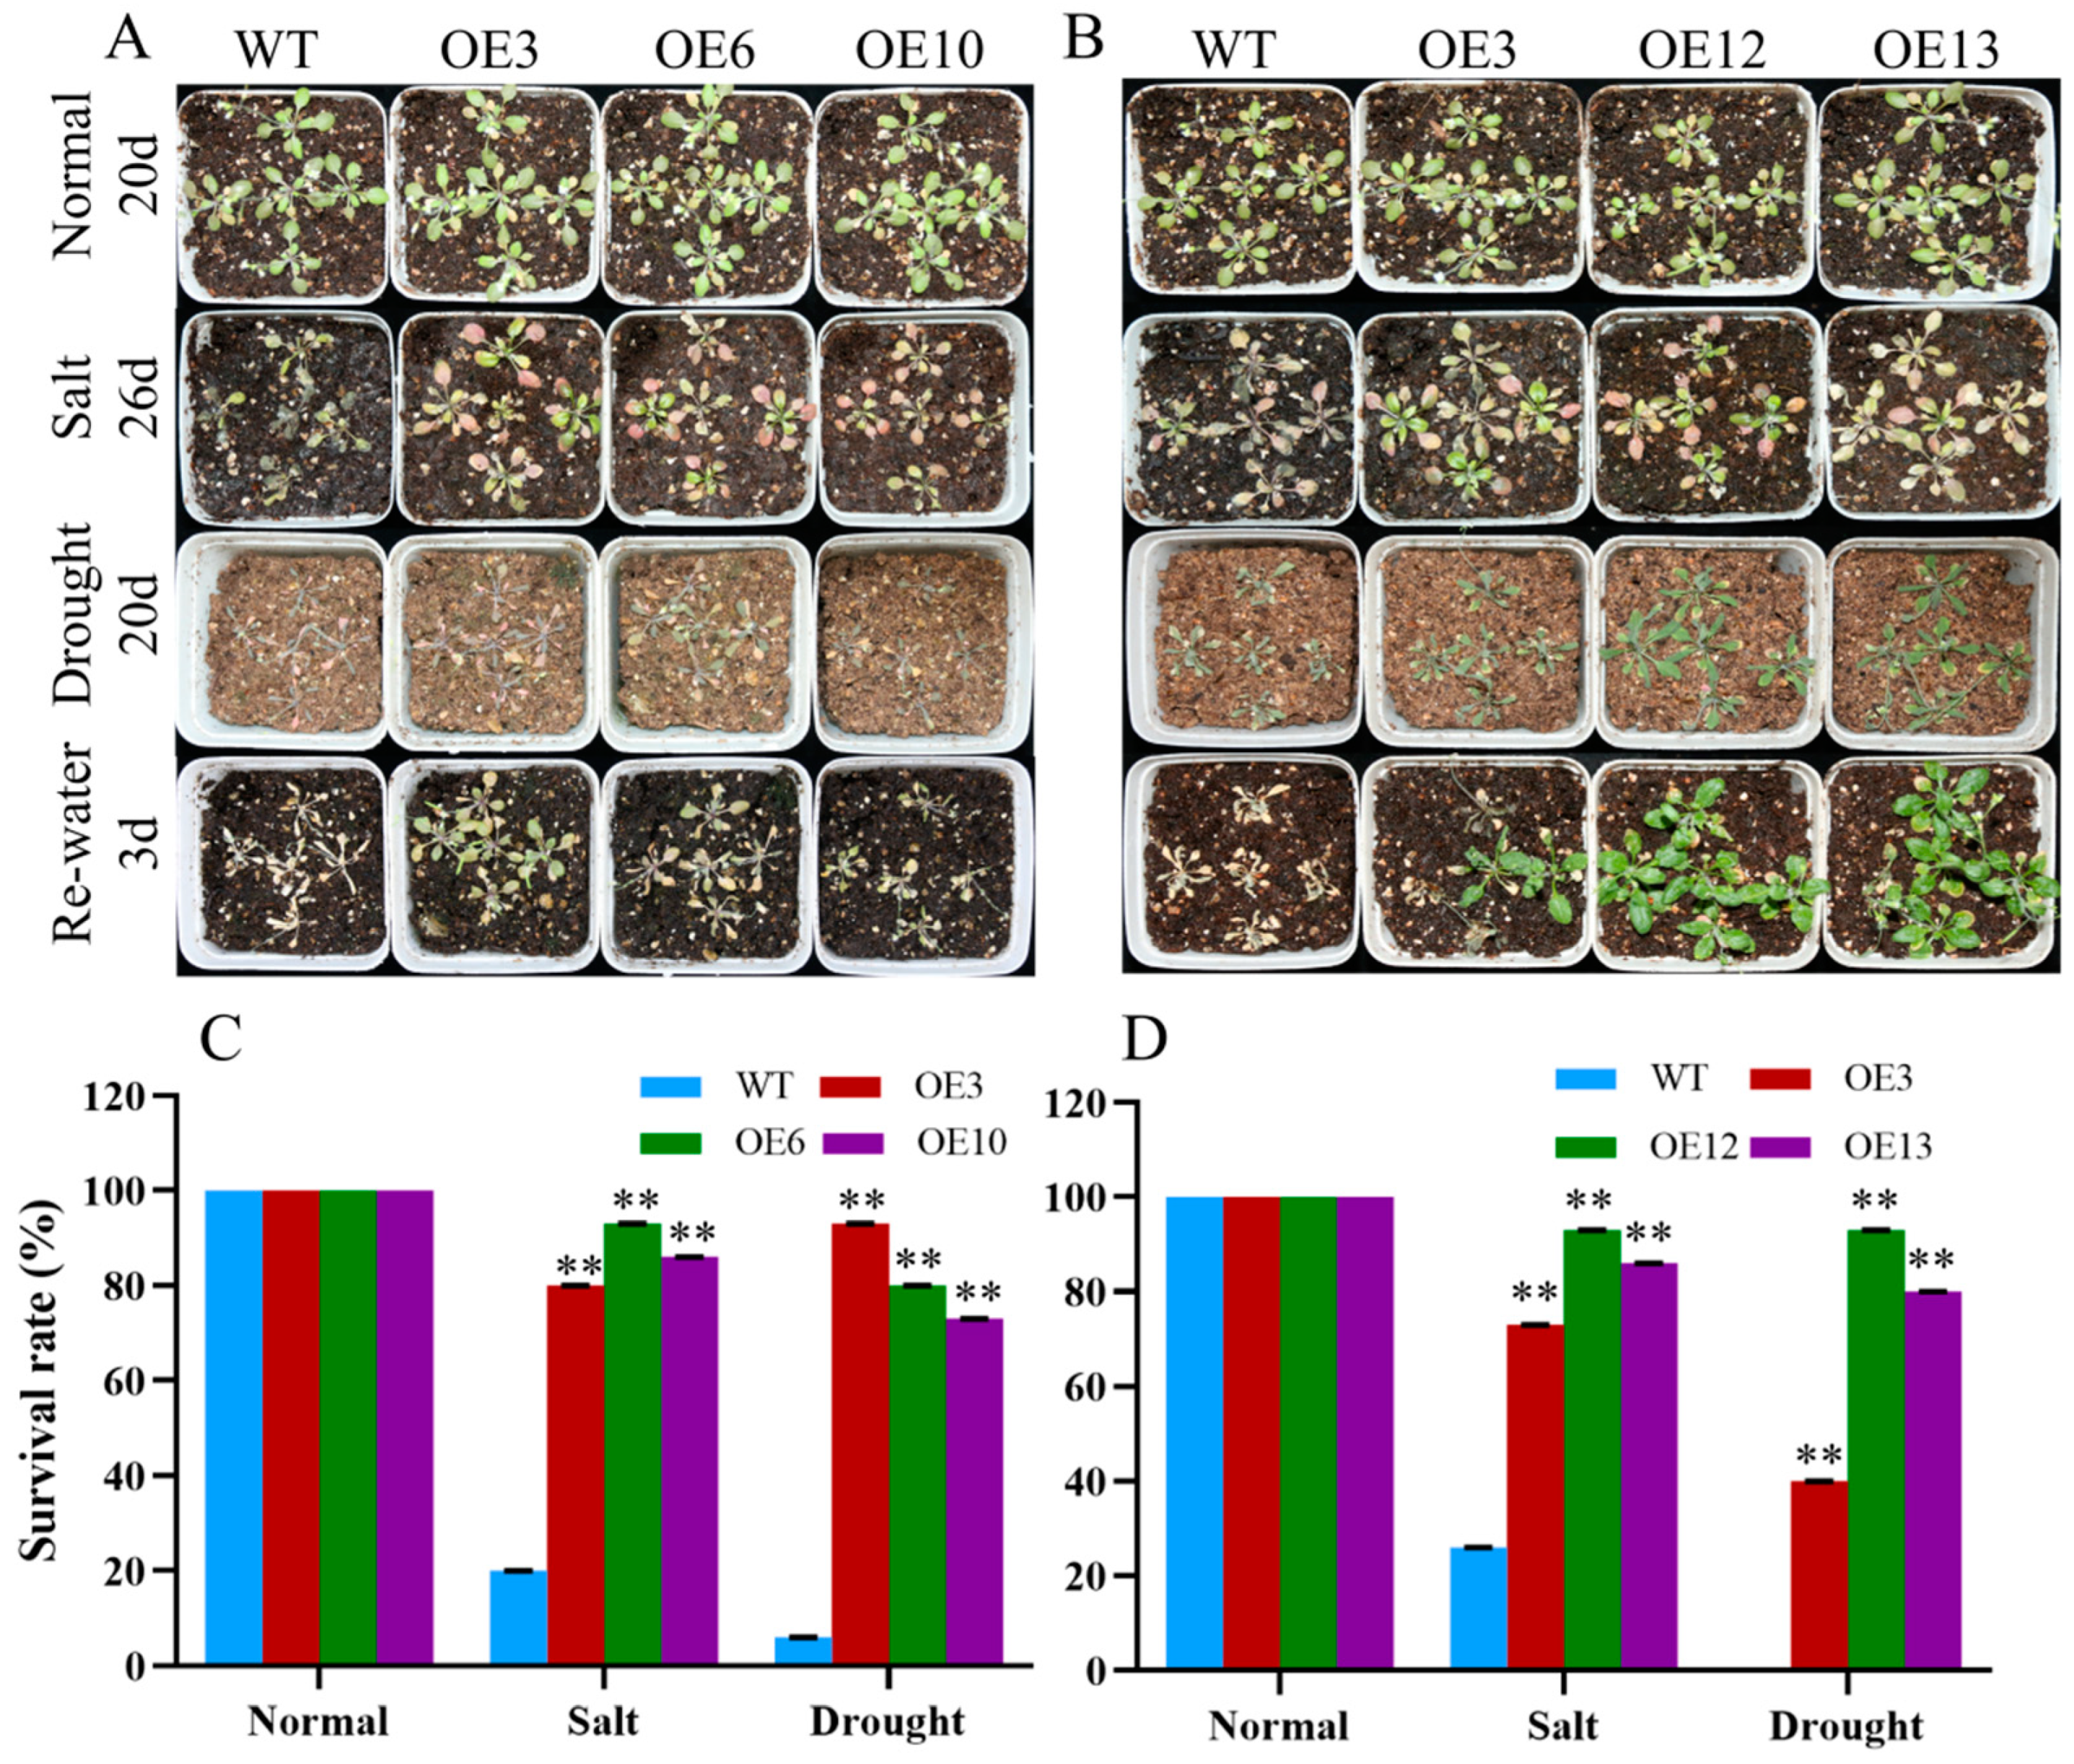
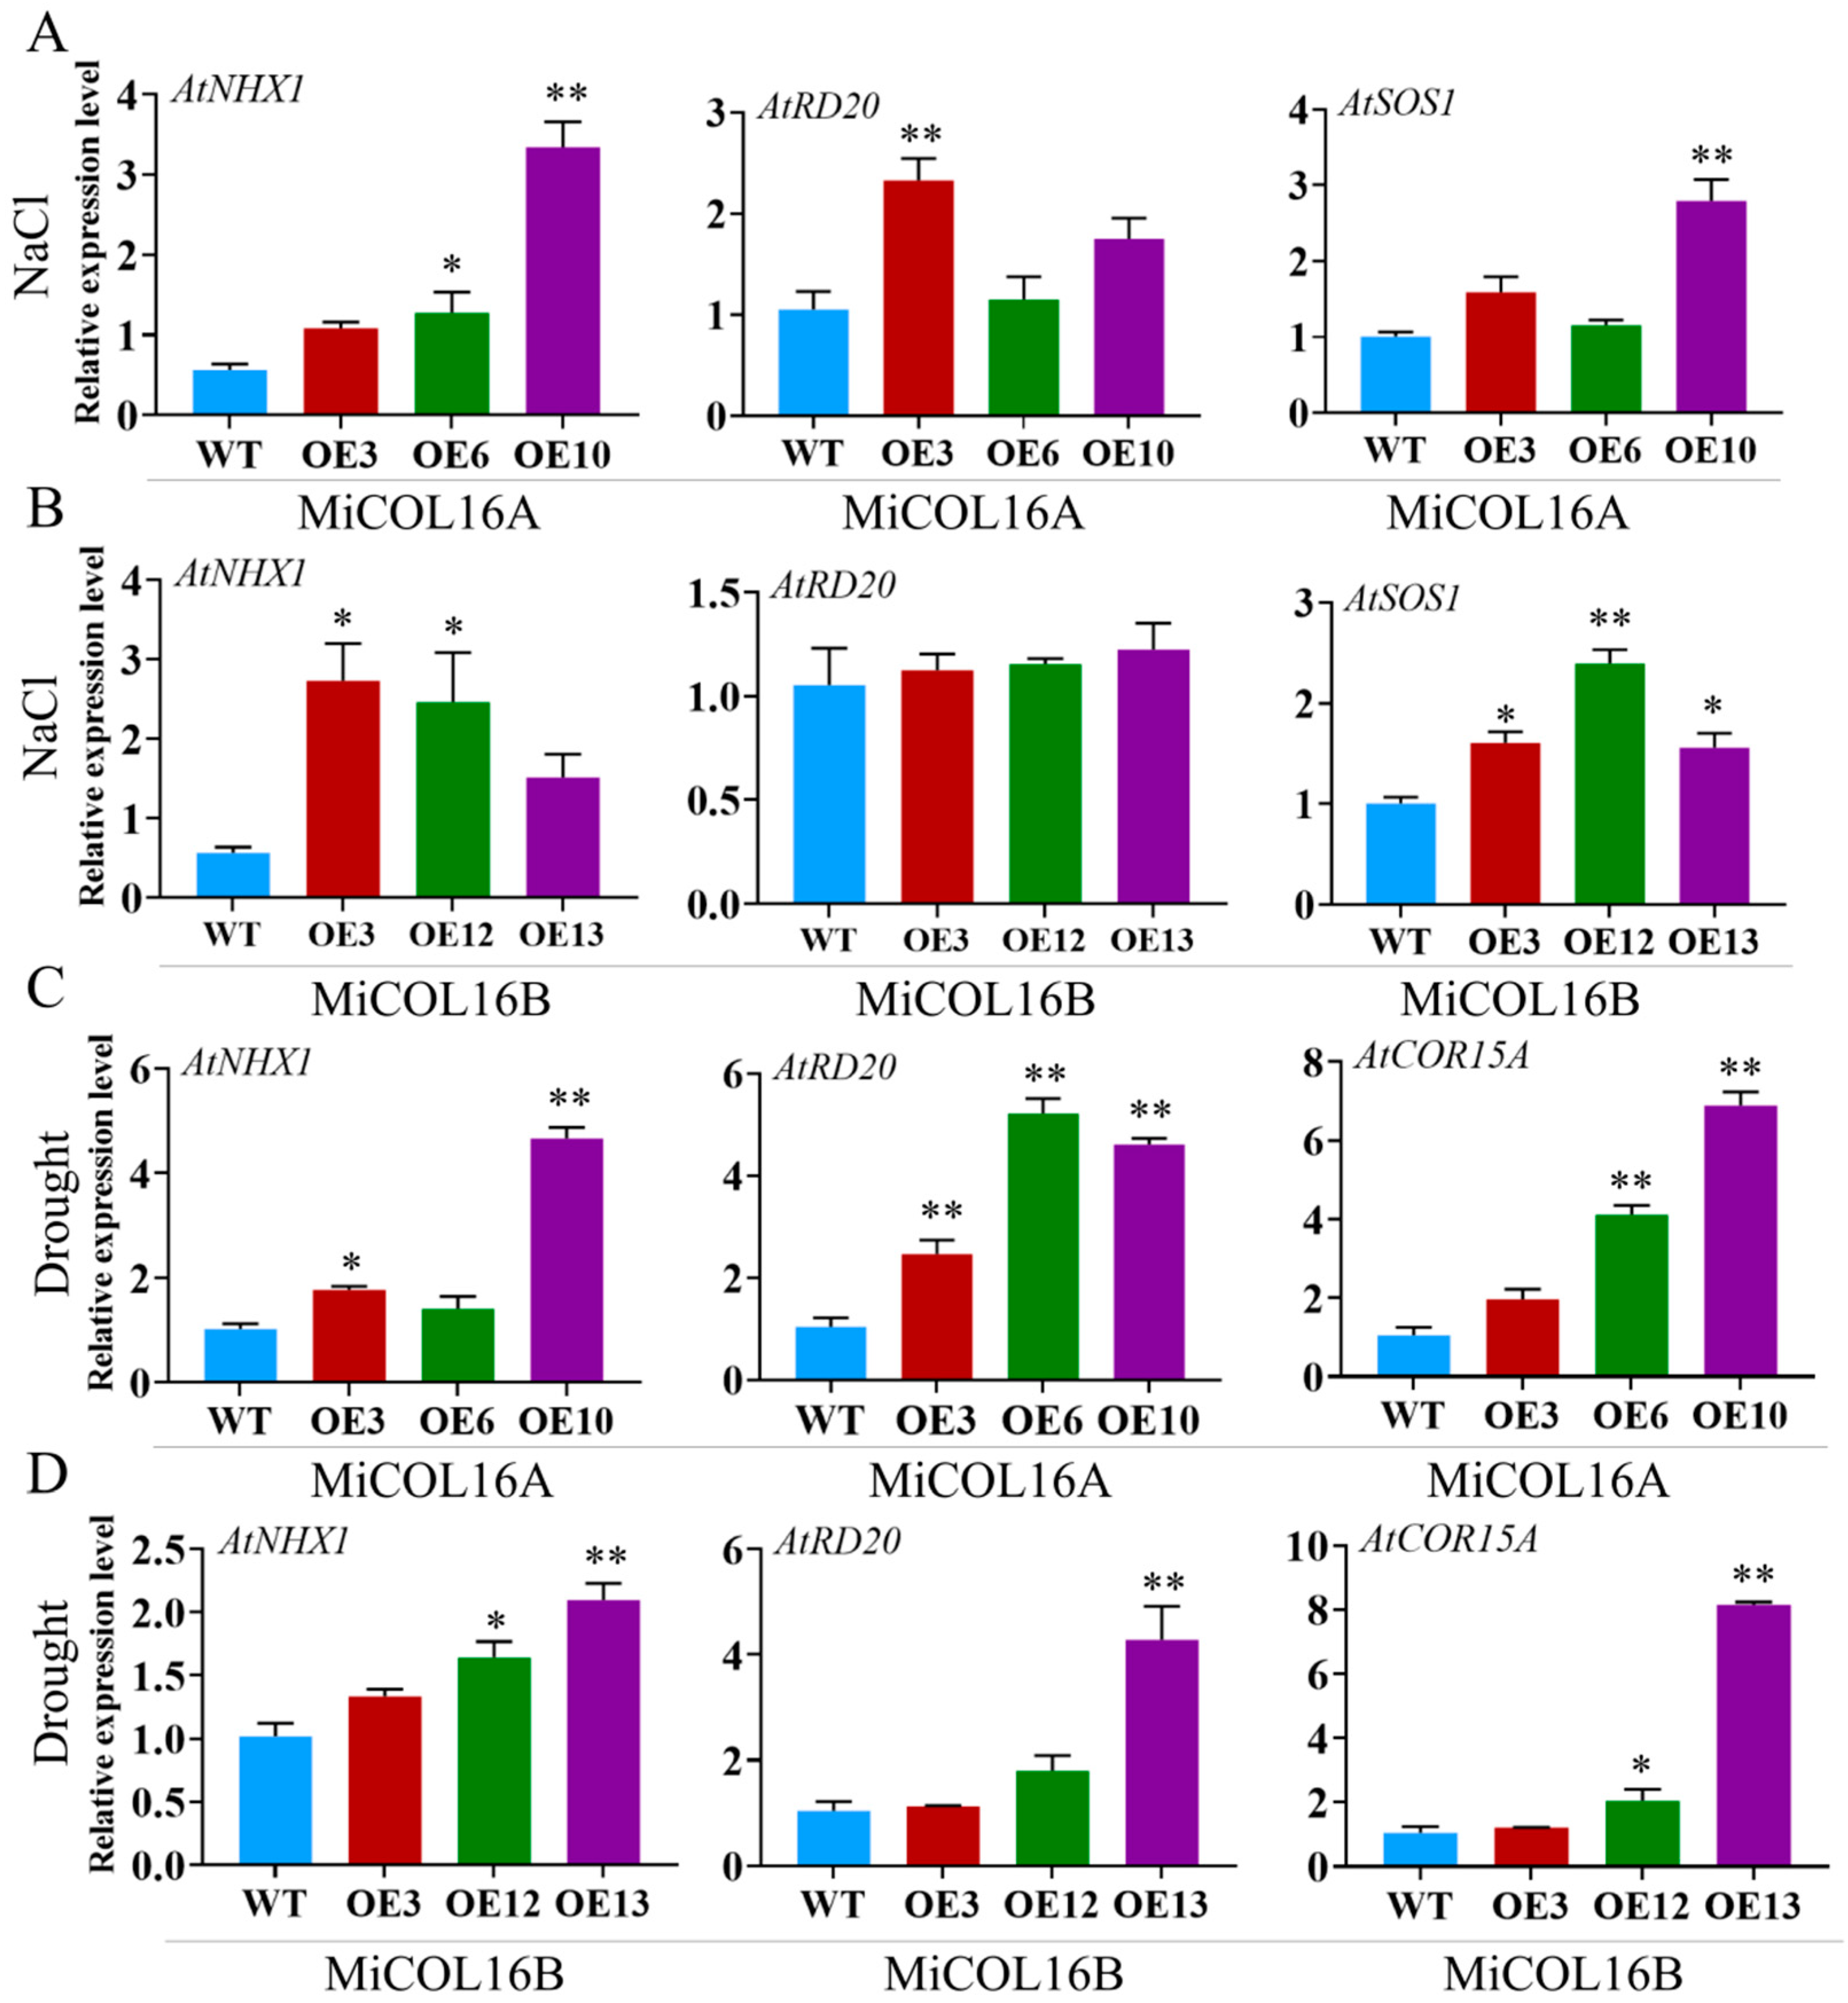
2.5. MiCOL16A and MiCOL16B Enhance Tolerance to Abiotic Stress

To assess the effect of ectopic MiCOL16A and MiCOL16B expression in response to abiotic stress, three homozygous lines (T3 generation) were selected. Three-day-old seedlings of the overexpression and WT plants were transplanted onto half-strength MS media supplemented with mannitol and NaCl. The length of their roots was measured after 7 days of stress treatment. The untreated WT and overexpression plants did not significantly differ, but compared with the WT plants, both MiCOL16A and MiCOL16B overexpression plants grew better and had longer roots under all stress conditions (Figure 8 and Figure 9). Together, these results showed that, compared with WT plants, MiCOL16A and MiCOL16B transgenic plants had improved tolerance to drought and salt stress.
To further determine the response of MiCOL16A and MiCOL16B transgenic plants to abiotic stress, 7-day-old seedlings were transplanted into square pots. After the seedlings were allowed to recover, they were watered with 300 mM NaCl every 2 days, and regular water was withheld (Figure 10A,B). For salt treatment, the survival rate was measured when obvious phenotypic differences occurred. Approximately 20.0% of WT plants, 80.0% of OEMiCOL16A#3 plants, 93.3% of OEMiCOL16A#6 plants and 86.7% of OEMiCOL16A#10 plants survived (Figure 10C). Similarly, approximately 26.7% of WT plants survived, but 73.3% of OEMiCOL16B#3, 93.3% of OEMiCOL16B#12 and 86.7% of OEMiCOL16B#13 plants survived (Figure 10D). With respect to the drought treatment, the survival rate was measured after the plants had been rewatered for 3 days: a total of 6.7% of WT plants survived, but 93.3% of OEMiCOL16A#3, 80.0% of OEMiCOL16A#6 and 73.3% of OEMiCOL16A#10 plants survived (Figure 10C). Similarly, no WT survived, but 40.0% of OEMiCOL16B#3, 93.3% of OEMiCOL16B#12 and 80.0% of OEMiCOL16B#13 lines survived (Figure 10D). Together, these results showed that overexpression of MiCOL16A and MiCOL16B in Arabidopsis improved salt and drought tolerance.
To explore the molecular mechanism underlying these phenomena in the transgenic lines in response to salt or drought, four stress-related genes were selected: AtNHX1, AtRD20, AtSOS1 and AtCOR15A (Figure 11). Under salt stress, the expression levels of AtNHX1, AtRD20 and AtSOS1 were significantly higher in the three transgenic lines of MiCOL16A than in the WT, but in the MiCOL16B transgenic lines, the expression level of AtRD20 was not significantly higher (Figure 11A,B). Under drought conditions, the expression levels of AtCOR15A, AtRD20 and AtNHX1 in the MiCOL16A and MiCOL16B transgenic lines were significantly higher than those in the WT (Figure 11C,D). These findings showed that by regulating the expression of stress-responsive genes, the MiCOL16A and MiCOL16B genes might increase the stress tolerance of transgenic plants under drought or salt stress.

3. Discussion

Flowering is an important event in the life cycle of plants. Mango, a typical perennial and economically important fruit tree species, is distributed mainly in tropical and subtropical areas, and its economic benefits are greatly affected by flowering time. Therefore, successfully controlling flowering time is critically important in mango production. The CO gene plays an indispensable role in the photoperiodic pathway and regulates the flowering time of plants [34]. In a previous study, more than 36 CO homologs were identified from mango transcriptomic data [27]. Here, we identified and characterized two zinc finger COL16 protein orthologs, MiCOL16A and MiCOL16B, in mango. Bioinformatic analysis indicated that both MiCOL16 proteins are highly homologous to AtCOL16 and have only one CCT and one B-box domain, thus belonging to group II of the CO gene family.
CO/COL genes are the key genes controlling flowering in plants. These genes are regulated by the upstream gene GI [23,35] and control the downstream gene FT, thereby inducing flowering in plants [36]. Studies have shown that the leaves are the plant organs that initially perceive photoperiodic signals [37], and the synthesis of FT proteins controlled by the CO gene is also observed to occur in the leaves [38,39]. In this study, the expression patterns of the MiCOL16A and MiCOL16B genes in SiJiMi showed that both genes were highly expressed in the leaves, especially during the vegetative phase, but were expressed at low levels in the flowers (Figure 2). Similarly, the GbCOL16 gene in Ginkgo biloba is most highly expressed in the leaves [40], and the BvCOL1 gene in Beta vulgaris is most highly expressed in cauline leaves and less so in the buds and roots [41]. In petunia, PhCOL16 homologs are involved in chlorophyll accumulation and have higher expression levels in leaves [42]. Moreover, OsCOL16 in rice is expressed mainly in the youngest leaf blade, and the VviCOL16a genes in Vitis vinifera were expressed the most in the leaves [24,43]. In contrast, the highest expression level of MiCOL16A was found in the leaves of nonflowering branches and during the late floral induction period, but the MiCOL16B gene was expressed mainly in the leaves of flowering branches and during the early floral induction period.
In general, CO genes are affected by the circadian rhythm. In Arabidopsis, the expression level of AtCO peaks at dusk under LD conditions but peaks at night under SD conditions [44]. In Cymbidium goeringii, CgCOL is expressed at higher levels in the light than in the dark under LD conditions but at lower levels in the light than in the dark under SD conditions [45]. In Chrysanthemum morifolium, CmCOL expression peaks at 4:00 and 16:00 under both SD and LD conditions. Moreover, the expression level of the OsCOL16 gene in rice increases after decreasing under both SD and LD conditions but peaks at 6 h or 14 h after dusk [24]. In the present study, the expression of MiCOL16A increased in the dark and decreased in the light. However, MiCO gene expression was greatest at 9:00 but then decreased under normal light conditions [31]. This result may be related to the structural differences of the genes. In the present study, the MiCOL16A gene was found to be involved in the circadian rhythm, but the MiCOL16B gene did not exhibit any regularity. The difference in the expression levels of these two genes may be caused by homologous differences.
According to the results, the MiCOL16A and MiCOL16B proteins localized to the nucleus of onion cells, and both have transcriptional activation activity through their MR domains. In rice, OsCOL10, OsCOL15 and OsCOL16 have one CCT and one B-box domain; they localize to the nucleus and display transcriptional activity through their MR domain [24,32,33]. Moreover, the protein encoded by AtCOL7 in Arabidopsis, which has one B-BOX and one CCT domain, has been reported to be the key segment exhibiting transcriptional activity between the B-box and CCT domains [46]. The results in this report also confirmed the results of the present experiment.
CO acts at the center of the coordinate input mechanism that responds to light. The flowering time-controlling molecular mechanisms in Arabidopsis and rice have been studied extensively [47]. In Arabidopsis, the CO gene promotes flowering under LD conditions but inhibits flowering under SD conditions [8], and overexpression of the COL16 gene can lead to slightly early flowering under LD conditions [20]. In addition, the COL4 gene represses flowering under LD or SD conditions [48]; the structure of both COL7 and COL8 is similar to that of MiCOL16, and these genes delay flowering under LD conditions [21,22]. In rice, OsHd1 represses flowering only under LD conditions [8], OsCO3 delays flowering time under SD conditions [49], and OsCOL16 inhibits flowering under both SD and LD conditions [24]. In the present experiment, both MiCOL16A and MiCOL16B inhibited the flowering of the transgenic plants under SD and LD conditions. These results are similar to those for the OsCOL16 gene in rice.
CO controls flowering by inducing the expression of the downstream gene FT [36,50]. In Arabidopsis, CO promotes flowering by upregulating the expression of FT genes under LD conditions and delays flowering by decreasing FT gene expression [51]. CO homologs, such as the COL8 and COL9 genes, repress FT expression and repress flowering only under LD conditions [22,52]. In bamboo, PvCO1 decreases the expression of FT to control flowering time [53]. The OsCOL9 gene delays flowering by repressing the downstream flowering-promoting gene Ehd1 [54]. In the present experiment, both the MiCOL16A and MiCOL16B genes repressed flowering by decreasing the expression of AtSOC1 and AtFT under SD and LD conditions (Figure 7). Similarly, the MiCO gene also represses flowering by decreasing AtFT and AtSOC1 expression [31]. Together, our findings suggest that the MiCOL16A and MiCOL16B genes regulate flowering time by affecting the expression levels of SOC1 and FT.
The molecular responses of plants to abiotic stresses are complex and dynamic [55,56], and they involve interactions with many molecular pathways [57]. Similarly, plant responses to these stresses are also complex [58]. CO is universally known as a photoperiod-responsive gene [5]. In recent years, some experiments have indicated that CO and CO homologs have a certain impact on the responses of plants to abiotic stresses. In Arabidopsis, the expression of the AtCOL4 gene is significantly upregulated under high-salt and osmotic stress, and the survival rate of AtCOL4 transgenic plants is higher than that of atcol4 and WT plants [59]. The expression level of GhCOL16, a CO homolog in cotton, was also upregulated 12 h after NaCl or polyethylene glycol (PEG) 6000 treatment [60]. In the present study, the lengths of the roots and survival rates of the MiCOL16A and MiCOL16B transgenic plants were all greater than those of the WT plants under salt or drought conditions. This result shows that MiCOL16A and MiCOL16B enhance the tolerance of the transgenic plants to abiotic stress. However, BnCOL2 increases sensitivity to drought conditions in Arabidopsis plants, and BnCOL2 overexpression results in a survival rate that is lower than that of the WT plants [61]. These results are different from the results of the present experiment and may be caused by the presence of different domains.
To some extent, the transcript levels of stress-related genes also indicate the tolerance of plants to abiotic stresses [62]. For example, stress-responsive gene expression was reduced, resulting in a decrease in the stress tolerance of BnCOL2 transgenic lines [61]. In our study, all of the MiCOL16A and MiCOL16B transgenic plants were tolerant to drought and salt stress; the expression levels of AtNHX1, AtRD20 and AtSOS1 increased under salt treatment; and the expression levels of AtCOR15A, AtRD20 and AtNHX1 increased under drought treatment. AtNHX1 and AtRD20 play vital roles in the response to salt and drought stress [63,64,65], AtSOS1 transcript levels substantially increase upon NaCl treatment [66], and the AtCOR15A gene is known as a marker of drought stress [67]. In summary, it can be hypothesized that by regulating stress-responsive genes, the MiCOL16A and MiCOL16B genes positively regulate the salt and drought stress tolerance of Arabidopsis.

4. Material and Methods

4.1. Materials

The samples (M. indica L. cv. SiJiMi) were collected from an orchard at Guangxi University, Nanning, Guangxi, China. The leaves, buds and stems of nonflowering and flowering branches were collected on 4 January 2019. Leaves were collected on 5 November 2018, 5 December 2018, 4 January 2019, 29 January 2019 and 6 March 2019. Leaves were collected every three hours on three separate days from 2-year-old mango trees grown under different conditions for diurnal rhythmic expression analysis (LD (16 h light/8 h dark), MD (12 h light/12 h dark) and SD (8 h light/16 h dark)). The plant samples were frozen in liquid nitrogen and kept at −80 °C. Wild-type (WT) Arabidopsis ecotype Columbia (Col-0) plants were used to study gene function and were grown in the laboratory.

4.2. Identification and Sequence Analysis

Total RNA of SiJiMi mango plants was extracted by using an RNAprep Pure Kit (for polysaccharide- and polyphenolic-rich plants, DP441) (Tiangen, Beijing, China). cDNA was reverse transcribed with 1 µg of total RNA with PrimeScript™ Reverse Transcriptase M-MLV (Takara, Dalian, China) and Oligo(dT)18 primers (TTTTTTTTTT TTTTTTTTTTTT). The cetyl-trimethylammonium bromide (CTAB) method was used to isolate genomic DNA from mango leaves [68]. The MiCOL16 gene was isolated from the transcriptomic data of SiJiMi mango (unpublished data), after which the sequence was verified. The primers designed for cloning included SCOL16Au (5′-GCCTTTGCAA AATGATCACCGG-3′), SCOL16Ad (5′-GCGCCATTTATTTCTTGAGG-3′), SCOL16Bu (5′-GTCTTTGCGGTATGATCACTG-3′) and SCOL16Bd (5′-CGGCCATCACCATTTAT TTC-3′). The PCR conditions were as follows: 95 °C for 3 min; 38 cycles of 95 °C for 30 s, 53 °C/52 °C for 30 s and 72 °C for 1 min 30 s; and 72 °C for 10 min. The final products were inserted into a pMD18-T vector and sequenced.
The amino acid sequences of MiCOL16A and MiCOL16B were analyzed with the BLAST search tool (https://0-www-ncbi-nlm-nih-gov.brum.beds.ac.uk/BLAST/, accessed on 20 May 2019). CO homologous sequences were downloaded from the NCBI database (https://www.ncbi.nlm.nih.gov, accessed on 25 May 2019). Sequence alignment was subsequently performed using DNAMAN 7 software (Lynnon Corporation, Pointe-Claire, QC, Canada). A neighbor-joining tree based on the CO gene family in Arabidopsis and several other tree species was constructed via MEGA 6.06, with 1000 bootstrap replicates.

4.3. qRT–PCR Analysis

First-strand cDNA of each sample was synthesized, and MiActin1 (qMiACTu, 5′-CCGAGACATGAAGGAGAAGC-3′; qMiACTd, 5′-GTGGTCTCATGGATACCAGCA- 3′) was used as an internal control gene for data processing [69]. The gene-specific primers used for MiCOL16A and MiCOL16B were qCOL16Au (5′-TGAATCACCACTG GCAGCTGA-3′) and qCOL16Ad (5′-GGGGTTCCTGTTGTCCATGGA-3′) as well as qCOL16Bu (5′-ACTTCGGAGACAGCACAGTGA-3′) and qCOL16Bd (5′-TTGCATTCGG TGTTCGCCATT-3′). qRT–PCR was performed with an ABI 7500 Real-Time PCR System (Applied Biosystems, Foster City, CA, USA) in conjunction with SYBR Premix Ex Taq II (Takara, Dalian, China). The expression data were normalized according to the 2−ΔΔCt method [70].

4.4. Subcellular Localization

The MiCOL16A and MiCOL16B coding DNA sequence (CDS) regions were cloned into a green fluorescent protein (GFP)-encoding gene via the cauliflower mosaic virus (CaMV) 35S promoter. GFP fusions were transferred into Agrobacterium tumefaciens EH105, which were then transiently injected into onion inner epidermal cells. Fluorescent cells were observed via laser confocal microscopy. An empty vector with only GFP was used as the control, and 4′,6-diamidino-2-phenylindole (DAPI) was used to visualize the location of the nucleus.

4.5. Analysis of Transcriptional Activity of MiCOL16A and MiCOL16B

To determine the transcriptional activation domains, BD-MiCOL16A, BD-MiCOL16B, BD-MiCOL16A-ΔMR and BD-MiCOL16B-ΔMR constructs were generated, and the full-length CDS and middle region (MR) deletion of MiCOL16A and MiCOL16B were amplified via PCR and inserted into the pGBKT7 expression vector (Clontech, Dalian, China). An empty pGBKT7 vector was used as a control (BD-vector). These four plasmids and empty pGBKT7 vectors were subsequently transferred into Y2H Gold yeast cells. The seedlings were subsequently grown on sucrose–dextran (SD) media lacking tryptophan for 3 days. The yeast strains that grew successfully were then transferred onto SD/-Trp, SD/-Trp/X-α-gal and SD/-Trp/X-α-gal/AbA media and grown for another 3 days.

4.6. Vector Construction and Arabidopsis Plant Transformation

The complete CDSs of MiCOL16A and MiCOL16B were amplified and inserted into a pBI121 vector. The gene-specific primers used were as follows: ZCOL16Au (5′-TCTAGAATGATCACCGGAAAG-3′; the Xba I site is underlined), ZCOL16Ad (5′-CCCGGGTTATTTCTTGAGGTAAGG-3′; the Xma I site is underlined), ZCOL16Bu (5′-GCGGTTCTAGAATGATCTCTG-3′; the Xba I site is underlined) and ZCOL16Bd (5′-CCCGGGTTATTTCTTCAGGTAGGG-3′; the Xma I site is underlined). The pBI121 vector was subsequently digested by Xba I and Xma I restriction enzymes. Positive recombinant pBI121-MiCOL16A and pBI121-MiCOL16B plasmids were then transformed into Agrobacterium tumefaciens EH105. The primers JCOL16Au (5′-GCCTTTGCAAAATGATCACCGG-3′), JCOL16Bu (5′-GTCTTTGCGGTATGATCAC TG-3′) and 121GUSd (5′-TTGGGACAACTCCAGTGAAAAG-3′) were used to assess the target bacterial colonies. Arabidopsis plants were subsequently transformed with the floral-dip method [71]. Transgenic Arabidopsis plants growing on half-strength Murashige and Skoog (MS) media supplemented with 50 mg/L kanamycin were identified and then transplanted into square pots filled with a mixture of organic substrate, peat moss and vermiculite (2:2:1), after which they were allowed to grow unabated for 7 days. Seeds of T3-generation homozygous plants were sown at 22 °C under SD conditions (8 h light/16 h darkness) or LD conditions (16 h light/8 h darkness) to measure flowering time, plant height and rosette leaves. Two-week-old WT and transgenic plants were sampled for qRT–PCR analysis. The flowering-related genes AtSOC1 (No. AY007726; primers F, 5′-CGAGCAAGAAAGACTCAAGTGTTTAAGG-3′; R, 5′-TTCATGAGATCCCCA CTTTTCAGAGAG-3′) and AtFT (No. AB027504; primers, 5′-CTTGGCAGGCAAACAGTGTATGCAC-3′; R, 5′-GCCACTCTCCCTCTGACAATTG TAGA-3′) were used for qRT–PCR analysis.

4.7. Stress Treatments of Transgenic and WT Plants

Seeds of the transgenic lines and WT were sown evenly on the surface of half-strength MS media without antibiotics and stored at 4 °C for 3 days for vernalization.
For root growth assays, WT and MiCOL16A and MiCOL16B transgenic lines were subjected to stress, and 3 days later, all the plants were transferred to vertically oriented square-shaped containers filled with half-strength MS agar media supplemented with NaCl (0, 100 and 200 mM) or mannitol (0, 300 and 500 mM) [72,73]. The plants were then grown upright in an artificial climate chamber under LD conditions at 22 °C. Seven days later, the length of the primary roots of all lines was measured.
To assess the stress tolerance of transgenic Arabidopsis, 7-day-old seedlings were transplanted into square pots. For salt stress, the WT and transgenic lines were treated with 300 mM NaCl solution every 2 days until obvious phenotypic differences occurred, and then the survival rate was determined. For drought treatment, water was withheld from the transgenic lines and WT plants until obvious phenotypic differences occurred. After rewatering for 3 days, the survival rates of the overexpression lines and WT plants were measured.
To investigate the expression patterns of related genes in transgenic Arabidopsis plants in response to stress, seeds of the transgenic lines and WT were sown on half-strength MS media supplemented with NaCl or mannitol. Fifteen days later, total RNA was extracted. The specific primers used for the stress-related genes AtNHX1 (No. AT5G27150; F, 5′-AGCCTTCAGGGAACCACAAT-3′; R, 5′-CTCCAAAGACGGGTCGC ATG-3′) [64], AtRD20 (No. AT2G33380; F, 5′-ATCGACAACATACACAAAGCCAA-3′; R, 5′-TCCATCAA AGCAACCTCTCACAG-3′) [63], AtSOS1 (No. AT2G01980; F, 5′-AGTGTAAGTTTCGGTGGGATC-3′; R, 5′-CACGCATGTTTACGGGTTTC-3′) [74], and AtCOR15A (No. AT2G42540; F, 5′-TTCCACAGCGGAGCCAAGCA-3′; R, 5′-AGCGGCGTAGATCAACGACTTC-3′) [67] were used to perform qRT–PCR, and AtActin2 (No. At3g18780; F, 5′-CACTGTGCCAATCTACGAGGGT-3′; R, 5′-GCTGGAA TGTGCTGAGGGAAG-3′) was used as a reference control.

4.8. Statistical Analysis

All experiments were repeated at least three times. The standard deviations (SDs) are represented by error bars in the figures. All statistical analyses were performed by SPSS 17.0, and significance was tested at the p < 0.05 (* in the figures) and p < 0.01 (** or Lowercase letters in the figures) levels. Bar charts were generated with GraphPad Prism 7 software.

5. Conclusions

In this study, we isolated the MiCOL16A and MiCOL16B genes from SiJiMi mango. Both the MiCOL16A and MiCOL16B proteins localize to the nucleus and have transcriptional activity through their MR domain. Overexpression of MiCOL16A and MiCOL16B repressed flowering in Arabidopsis under SD and LD conditions and improved tolerance to drought and salt stress conditions. Overall, our results clearly demonstrated that the MiCOL16A and MiCOL16B genes play key roles in mango flowering and abiotic stress responses.

Supplementary Materials

The following supporting information can be downloaded at: https://www.mdpi.com/article/10.3390/ijms23063075/s1.

Author Contributions

X.H. and C.L. conceived and designed the experiments; Y.L., Y.G. and R.L. performed this experiment; C.L., H.Y. and X.M. provided technical assistance; S.C. and X.Y. collected and analyzed the data; Y.L. wrote the manuscript; C.L. and X.H. revised the manuscript. All authors have read and agreed to the published version of the manuscript.

Funding

This research was supported by the National Natural Science Foundation of China (31860541), State Key Laboratory for Conservation and Utilization of Subtropical Agro-bioresources (SKLCUSA-a201906, SKLCUSA-c201901), Innovation Team of Guangxi Mango Industry Project (nycytxgxcxtd-2021-06-02), the sixth special action of “strengthening agriculture and enriching people” by science and technology Vanguard (Guangxi Agricultural Science and technology League 202204).

Institutional Review Board statement

Not applicable.

Informed Consent Statement

Not applicable.

Conflicts of Interest

The authors declare no conflict of interest.

References

  1. Okamuro, J.K.; Szeto, W.; Lotys-Prass, C.; Jofuku, K.D. Photo and hormonal control of meristem identity in the Arabidopsis flower mutants apetala2 and apetala1. Plant Cell 1997, 9, 37–47. [Google Scholar] [PubMed] [Green Version]
  2. Wu, G.; Park, M.Y.; Conway, S.R.; Wang, J.W.; Weigel, D.; Poethig, R.S. The sequential action of miR156 and miR172 regulates developmental timing in Arabidopsis. Cell 2009, 138, 750–759. [Google Scholar] [CrossRef] [PubMed] [Green Version]
  3. Blazquez, M.A.; Green, R.; Nilsson, O.; Sussman, M.R.; Weigel, D. Gibberellins promote flowering of Arabidopsis by activating the LEAFY promoter. Plant Cell 1998, 10, 791–800. [Google Scholar] [CrossRef] [Green Version]
  4. Huang, G.W.; Ma, J.H.; Han, Y.Z.; Chen, X.J.; Fu, Y.F. Cloning and expression analysis of the soybean CO-like gene GmCOL9. Plant Mol. Biol. Rep. 2010, 29, 352–359. [Google Scholar] [CrossRef]
  5. Komeda, Y. Genetic regulation of time to flower in Arabidopsis thaliana. Annu. Rev. Plant Biol. 2004, 55, 521–553. [Google Scholar] [CrossRef] [Green Version]
  6. Putterill, J.; Robson, F.; Lee, K.; Simon, R.; Coupland, G. The CONSTANS gene of Arabidopsis promotes flowering and encodes a protein showing similarities to zinc finger transcription factors. Cell 1995, 80, 847–857. [Google Scholar] [CrossRef] [Green Version]
  7. Griffiths, S.; Dunford, R.P.; Coupland, G.; Laurie, D.A. The evolution of CONSTANS-like gene families in barley, rice, and Arabidopsis. Plant Physiol. 2003, 131, 1855–1867. [Google Scholar] [CrossRef] [Green Version]
  8. Yano, M.; Katayose, Y.; Ashikari, M.; Yamanouchi, U.; Monna, L.; Fuse, T.; Baba, T.; Yamamoto, K.; Umehara, Y.; Nagamura, Y.; et al. Hd1, a major photoperiod sensitivity quantitative trait locus in rice, is closely related to the Arabidopsis flowering time gene CONSTANS. Plant Cell 2000, 12, 2473–2484. [Google Scholar] [CrossRef] [Green Version]
  9. Serrano, G.; Herrera-Palau, R.; Romero, J.M.; Serrano, A.; Coupland, G.; Valverde, F. Chlamydomonas CONSTANS and the evolution of plant photoperiodic signaling. Curr. Biol. 2009, 19, 359–368. [Google Scholar] [CrossRef]
  10. Imaizumi, T.; Schultz, T.F.; Harmon, F.G.; Ho, L.A.; Kay, S.A. FKF1 F-box protein mediates cyclic degradation of a repressor of CONSTANS in Arabidopsis. Science 2005, 309, 293–297. [Google Scholar] [CrossRef]
  11. Sawa, M.; Nusinow, D.A.; Kay, S.A.; Imaizumi, T. FKF1 and GIGANTEA complex formation is required for day-length measurement in Arabidopsis. Science 2007, 318, 261–265. [Google Scholar] [CrossRef] [PubMed] [Green Version]
  12. Imaizumi, T.; Kay, S.A. Photoperiodic control of flowering: Not only by coincidence. Trends Plant Sci. 2006, 11, 550–558. [Google Scholar] [CrossRef] [PubMed]
  13. Wigge, P.A.; Kim, M.C.; Jaeger, K.E.; Busch, W.; Schmid, M.; Lohmann, J.U.; Weigel, D. Integration of spatial and temporal information during floral induction in Arabidopsis. Science 2005, 309, 1056–1059. [Google Scholar] [CrossRef] [PubMed]
  14. Shogo, I.; Young, H.S.; Anna, R.J.; Ryan, J.M.; Ghislain, B.; Richard, G.O.; Takato, I. FLOWERING BHLH transcriptional activators control expression of the photoperiodic flowering regulator CONSTANS in Arabidopsis. Proc. Natl. Acad. Sci. USA 2012, 109, 3582–3587. [Google Scholar]
  15. Sun, J.J.; Lu, J.; Bai, M.J.; Chen, Y.Q.; Wang, W.N.; Fan, C.G.; Liu, J.Y.; Ning, G.G.; Wang, C.Q. Phytochrome-interacting factors interact with transcription factor CONSTANS to suppress flowering in rose. Plant Physiol. 2021, 186, 1186–1201. [Google Scholar] [CrossRef]
  16. Ana, L.; Federico, V.; Manuel, P.; Jose, A.J. The Arabidopsis E3 ubiquitin ligase HOS1 negatively regulates CONSTANS abundance in the photoperiodic control of flowering. Plant Cell 2012, 24, 982–999. [Google Scholar]
  17. Liu, L.J.; Zhang, Y.C.; Li, Q.H.; Sang, Y.; Mao, J.; Lian, H.L.; Wang, L.; Yang, H.Q. COP1-Mediated ubiquitination of CONSTANS is implicated in cryptochrome regulation of flowering in Arabidopsis. Plant Cell 2008, 20, 292–306. [Google Scholar] [CrossRef]
  18. Yang, N.; Cong, Q.; Cheng, L.J. BBX transcriptional factors family in plants-a review. Chin. J. Biotechnol. 2019, 36, 666–677. [Google Scholar]
  19. Ledger, S.; Strayer, C.; Ashton, F.; Kay, S.A.; Putterill, J. Analysis of the function of two circadian-regulated CONSTANS-LIKE genes. Plant J. 2001, 26, 15–22. [Google Scholar] [CrossRef]
  20. Graeff, M.; Straub, D.; Eguen, T.; Dolde, U.; Rodrigues, V.; Brandt, R.; Wenkel, S. Microprotein-mediated recruitment of CONSTANS into a topless trimeric complex represses flowering in Arabidopsis. PLoS Genet. 2016, 12, e1005959. [Google Scholar] [CrossRef] [Green Version]
  21. Wang, H.G.; Zhang, Z.L.; Li, H.Y.; Zhao, X.Y.; Liu, X.M.; Ortiz, M.; Lin, C.T.; Liu, B. CONSTANS-LIKE 7 regulates branching and shade avoidance response in Arabidopsis. J. Exp. Bot. 2013, 64, 1017–1024. [Google Scholar] [CrossRef] [PubMed] [Green Version]
  22. Takase, T.; Kakikubo, Y.; Nakasone, A.; Nishiyama, Y.; Yasuhara, M.; Yoko, T.; Kiyosue, T. Characterization and transgenic study of CONSTANS-LIKE8 (COL8) gene in Arabidopsis thaliana: Expression of 35S:COL8 delays flowering under long-day conditions. Plant Biotechnol. 2011, 28, 439–446. [Google Scholar] [CrossRef] [Green Version]
  23. Tsuji, H.; Taoka, K.; Shimamoto, K. Regulation of flowering in rice: Two florigen genes, a complex gene network, and natural variation. Curr. Opin. Plant Biol. 2011, 14, 45–52. [Google Scholar] [CrossRef]
  24. Wu, W.X.; Zheng, X.M.; Chen, D.B.; Zhang, Y.X.; Ma, W.W.; Zhang, H.; Sun, L.P.; Yang, Z.F.; Zhao, C.D.; Zhan, X.D.; et al. OsCOL16, encoding a CONSTANS-like protein, represses flowering by upregulating Ghd7 expression in rice. Plant Sci. 2017, 260, 60–69. [Google Scholar] [CrossRef] [PubMed]
  25. Gonzalez-Schain, N.D.; Dıaz-Mendoza, M.; Zurczak, M.; Suárez-López, P. Potato CONSTANS is involved in photoperiodic tuberization in a graft-transmissible manner. Plant J. 2012, 70, 678–690. [Google Scholar] [CrossRef] [PubMed]
  26. Jeong, D.H.; Sung, S.K.; An, G. Molecular cloning and characterization of CONSTANS-like cDNA clones of the Fuji apple. J Plant Biol. 1999, 42, 23–31. [Google Scholar] [CrossRef]
  27. Luo, C.; Yu, H.X.; Fan, Y.; Zhang, X.J.; He, X.H. Research advance on the flowering mechanism of mango. Acta Hortic. 2019, 1244, 2. [Google Scholar] [CrossRef]
  28. Fan, Z.Y.; He, X.H.; Fan, Y.; Yu, H.X.; Wang, Y.H.; Xie, X.J.; Liu, Y.; Mo, X.; Wang, J.Y.; Luo, C. Isolation and functional characterization of three MiFTs genes from mango. Plant Physiol. Biochem. 2020, 155, 169–176. [Google Scholar] [CrossRef]
  29. Wei, J.Y.; Liu, D.B.; Liu, G.Y.; Tang, J.; Chen, Y.Y. Molecular cloning, characterization, and expression of MiSOC1: A homolog of the flowering gene SUPPRESSOR OF overexpression OF CONSTANS1 from mango (Mangifera indica L). Front. Plant Sci. 2016, 7, 1758. [Google Scholar] [CrossRef] [Green Version]
  30. Yu, H.X.; Luo, C.; Fan, Y.; Zhang, X.J.; Huang, F.; Li, M.; He, X.H. Isolation and characterization of two APETALA1-Like genes from mango (Mangifera indica L.). Sci. Hortic. 2020, 259, 108814. [Google Scholar] [CrossRef]
  31. Liu, Y.; Luo, C.; Zhang, X.J.; Lu, X.X.; Yu, H.X.; Xie, X.J.; Fan, Z.Y.; Mo, X.; He, X.H. Overexpression of the mango MiCO gene delayed flowering time in transgenic Arabidopsis. Plant Cell Tissue Organ Cult. 2020, 143, 219–228. [Google Scholar] [CrossRef]
  32. Tan, J.J.; Jin, M.N.; Wang, J.C.; Wu, F.Q.; Sheng, P.K.; Cheng, Z.J.; Wang, J.L.; Zheng, X.M.; Chen, L.P.; Wang, M.; et al. OsCOL10, a CONSTANS-Like gene, functions as a flowering time repressor downstream of Ghd7 in rice. Plant Cell Physiol. 2016, 57, 798–812. [Google Scholar] [CrossRef] [PubMed] [Green Version]
  33. Wu, W.X.; Zhang, Y.X.; Zhang, M.; Zhan, X.D.; Shen, X.H.; Yu, P.; Chen, D.B.; Liu, Q.E.; Sinumporn, S.; Hussain, K.; et al. The rice CONSTANS-like protein OsCOL15 suppresses flowering by promoting Ghd7 and repressing RID1. Biochem. Biophys. Res. Commun. 2018, 495, 1349–1355. [Google Scholar] [CrossRef]
  34. Valverde, F. CONSTANS and the evolutionary origin of photoperiodic timing of flowering. J. Exp. Bot. 2011, 62, 2453–2463. [Google Scholar] [CrossRef] [PubMed] [Green Version]
  35. Yan, J.; Mao, D.; Liu, X.M.; Wang, L.L.; Xu, F. Isolation and functional characterization of a circadian-regulated CONSTANS homolog (GbCO) from Ginkgo biloba. Plant Cell Rep. 2017, 36, 1387–1399. [Google Scholar] [CrossRef]
  36. Samach, A.; Onouchi, H.; Gold, S.E.; Ditta, G.S.; Schwarz-Sommer, Z.; Yanofsky, M.F.; Coupland, G. Distinct roles of CONSTANS target genes in reproductive development of Arabidopsis. Science 2000, 288, 1613–1616. [Google Scholar] [CrossRef] [Green Version]
  37. Sawa, M.; Kay, S.A. GIGANTEA directly activates FLOWERING LOCUS T in Arabidopsis thaliana. Proc. Natl. Acad. Sci. USA 2011, 108, 11698–11703. [Google Scholar] [CrossRef] [Green Version]
  38. Turck, F.; Fornara, F.; Coupland, G. Regulation and identity of florigen: FLOWERING LOCUS T moves center stage. Annu. Rev. Plant Biol. 2008, 59, 573–594. [Google Scholar] [CrossRef] [Green Version]
  39. Bohlenius, H.; Huang, T.; Charbonnelcampaa, L.; Brunner, A.M.; Jansson, S.; Strauss, S.H.; Nilsson, O. CO/FT regulatory module controls timing of flowering and seasonal growth cessation in trees. Science 2006, 312, 1040–1043. [Google Scholar] [CrossRef] [Green Version]
  40. Wang, L.L.; Yan, J.P.; Meng, X.X.; Ye, J.B.; Zhang, W.W.; Xu, F. Cloning and expression analysis of CONSTANS-like 16 (GbCOL16) gene from Ginkgo biloba. BMC Biotechnol. 2017, 16, 92–99. [Google Scholar] [CrossRef]
  41. Chia, T.Y.P.; Muller, A.; Jung, C.; Mutasa-Gottgens, E.S. Sugar beet contains a large CONSTANS-like gene family including a CO homologue that is independent of the early-bolting (B) gene locus. J. Exp. Bot. 2008, 59, 2735–2748. [Google Scholar] [CrossRef] [PubMed] [Green Version]
  42. Akemi, O.; Chihiro, O.Y.; Sanae, K. Overexpression of CONSTANS-like 16 enhances chlorophyll accumulation in petunia corollas. Plant Sci. 2019, 280, 90–96. [Google Scholar]
  43. Wang, L.; Xue, J.; Dai, W.; Tang, Y.; Gong, P.; Wang, Y.; Zhang, C. Genome-wide identification, phylogenetic analysis, and expression profiling of CONSTANS-like (COL) genes in vitis vinifera. J. Plant Growth Regul. 2019, 38, 631–643. [Google Scholar] [CrossRef]
  44. Suarez-Lopez, P.; Wheatley, K.; Robson, F. CONSTANS mediates between the circadian clock and the control of flowering in Arabidopsis. Nature 2001, 410, 1116–1120. [Google Scholar] [CrossRef] [PubMed]
  45. Zhang, J.X.; Zhao, X.L.; Tian, R.X.; Zeng, S.J.; Wu, K.L.; Silva, J.A.; Duan, J. Molecular cloning and functional analysis of three CONSTANS-Like genes from Chinese Cymbidium. J. Plant Growth Regul. 2019, 39, 1061–1074. [Google Scholar] [CrossRef]
  46. Zhang, Z.; Ji, R.; Li, H.; Tao, Z.; Liu, J.; Lin, C.; Liu, B. CONSTANS-LIKE 7 (COL7) is involved in phytochrome B (phyB)-mediated light-quality regulation of auxin homeostasis. Mol. Plant 2014, 7, 1674–2052. [Google Scholar] [CrossRef] [PubMed] [Green Version]
  47. Song, Y.H.; Shim, J.S.; Kinmonth-Schultz, H.A.; Imaizumi, T. Photoperiodic flowering: Time measurement mechanisms in leaves. Annu. Rev. Plant Biol. 2015, 66, 441–464. [Google Scholar] [CrossRef] [PubMed] [Green Version]
  48. Steinbach, Y. The Arabidopsis thaliana CONSTANS-LIKE 4 (COL4) a modulator of flowering time. Front. Plant Sci. 2019, 10, 651. [Google Scholar] [CrossRef] [Green Version]
  49. Kim, S.K.; Yun, C.H.; Lee, J.H.; Jang, Y.H.; Park, H.Y.; Kim, J.K. OsCO3, a CONSTANS-LIKE gene, controls flowering by negatively regulating the expression of FT-like genes under SD conditions in rice. Planta 2008, 228, 355–365. [Google Scholar] [CrossRef]
  50. Kardailsky, I.; Shukla, V.K.; Ahn, J.H.; Dagenais, N.; Christensen, S.K.; Nguyen, J.T.; Chory, J.; Harrison, M.J.; Weigel, D. Activation tagging of the floral inducer FT. Science 1999, 286, 1962–1965. [Google Scholar] [CrossRef] [Green Version]
  51. Luccioni, L.; Krzymuski, M.; Sanchez-Lamas, M.; Karayekov, E.; Cerdan, P.D.; Casal, J.J. CONSTANS delays Arabidopsis flowering under short days. Plant J. 2019, 97, 923–932. [Google Scholar] [CrossRef] [PubMed]
  52. Cheng, X.F.; Wang, Z.Y. Overexpression of COL9, a CONSTANS-LIKE gene, delays flowering by reducing expression of CO and FT in Arabidopsis thaliana. Plant J. 2005, 43, 758–768. [Google Scholar] [CrossRef] [PubMed]
  53. Xiao, G.H.; Li, B.J.; Chen, H.J.; Wang, Z.Y.; Mao, B.Z.; Gui, R.Y.; Guo, X.Q. Overexpression of PvCO1, a bamboo CONSTANS-LIKE gene, delays flowering by reducing expression of the FT gene in transgenic Arabidopsis. BMC Plant Biol. 2018, 18, 232. [Google Scholar] [CrossRef] [Green Version]
  54. Liu, H.; Gu, F.W.; Dong, S.Y.; Liu, W.; Wang, H.; Chen, Z.Q.; Wang, J.F. CONSTANS-like 9 (COL9) delays the flowering time in Oryza sativa by repressing the Ehd1 pathway. Biochem. Biophys. Res. Commun. 2016, 479, 173–178. [Google Scholar] [CrossRef] [Green Version]
  55. Cramer, G.R. Abiotic stress & plant responses from the whole vine to the genes. Aust. J. Grape Wine Res. 2010, 16, 86–93. [Google Scholar]
  56. Skirycz, A.; Inze, D. More from less: Plant growth under limited water. Curr. Opin. Biotechnol. 2010, 21, 197–203. [Google Scholar] [CrossRef] [PubMed]
  57. Takahashi, S.; Seki, M.; Ishida, J.; Satou, M.; Sakurai, T.; Narusaka, M.; Kamiya, A.; Nakajima, M.; Enju, A.; Akiyama, K.; et al. Monitoring the expression profiles of genes induced by hyperosmotic, high salinity, and oxidative stress and abscisic acid treatment in Arabidopsis cell culture using a full-length cDNA microarray. Plant Mol. Biol. 2004, 56, 29–55. [Google Scholar] [CrossRef] [PubMed]
  58. Cramer, G.R.; Urano, K.; Delrot, S.; Pezzotti, M.; Shinozaki, K. Effects of abiotic stress on plants: A systems biology perspective. BMC Plant Biol. 2011, 11, 163. [Google Scholar] [CrossRef] [Green Version]
  59. Min, J.H.; Chung, J.S.; Lee, K.H.; Kim, C.S. The CONSTANS-like 4 transcription factor, AtCOL4, positively regulates abiotic stress tolerance through an abscisic acid-dependent manner in Arabidopsis. J. Integr. Plant Biol. 2015, 57, 313–324. [Google Scholar] [CrossRef]
  60. Qin, W.Q.; Yu, Y.; Jin, Y.Y.; Wang, X.D.; Liu, J.; Xi, J.P.; Li, Z.; Li, H.Q.; Zhao, G.; Hu, W.; et al. Genome-wide analysis elucidates the role of CONSTANS-like genes in stress responses of cotton. Int. J. Mol. Sci. 2018, 19, 2658. [Google Scholar] [CrossRef] [Green Version]
  61. Liu, L.D.; Ding, Q.Y.; Liu, J.; Yang, C.L.; Chen, Y.; Zhang, S.F.; Zhu, J.C.; Wang, D.J. Brassica napus COL transcription factor BnCOL2 negatively affects the tolerance of transgenic Arabidopsis to drought stress Environ. Exp. Bot. 2020, 178, 104171. [Google Scholar] [CrossRef]
  62. Xiong, L.; Schumaker, K.S.; Zhu, J.K. Cell signaling during cold, drought, and salt stress. Plant Cell 2002, 14, S165–S183. [Google Scholar] [CrossRef] [PubMed] [Green Version]
  63. Aubert, Y.; Vile, D.; Pervent, M.; Aldon, D.; Ranty, B.; Simonneau, T.; Vavasseur, A.; Galau, J.P. RD20, a stress-inducible caleosin, participates in stomatal control, transpiration and drought tolerance in Arabidopsis thaliana. Plant Cell Physiol. 2010, 51, 1975–1987. [Google Scholar] [CrossRef] [PubMed] [Green Version]
  64. Asif, M.A.; Zafar, Y.; Iqbal, J.; Iqbal, M.M.; Rashid, U.; Ali, G.M.; Arif, A.; Nazir, F. Enhanced expression of AtNHX1, in transgenic groundnut (Arachis hypogaea L.) improves salt and drought tolerence. Mol. Biotechnol. 2011, 49, 250–256. [Google Scholar] [CrossRef] [PubMed]
  65. Wright, J. RD20/CLO3, a Stress-Induced Calcium-Binding Protein, Acts as a Negative Regulator of GPA1 in Arabidopsis through GAP Activity. Ph.D. Thesis, Concordia University, Montreal, QC, Canada, 2014. [Google Scholar]
  66. Shi, H.; Lee, B.H.; Wu, S.J.; Zhu, J.K. Overexpression of a plasma membrane Na+/H+ antiporter gene improves salt tolerance in Arabidopsis thaliana. Nat. Biotechnol. 2003, 21, 81–85. [Google Scholar] [CrossRef]
  67. Meng, L.S.; Wang, Z.B.; Yao, S.Q.; Liu, A. The ARF2-ANT-COR15A gene cascade regulates ABA-signaling-mediated resistance of large seeds to drought in Arabidopsis. J. Cell Sci. 2015, 128, 3922–3932. [Google Scholar] [PubMed] [Green Version]
  68. Yu, H.X.; Luo, C.; Xu, C.; He, X.H. A simple and efcient method for high quality DNA extraction from transgenic Arabidopsis and Tobacco. Mol. Plant Breed. 2016, 14, 1436–1440. [Google Scholar]
  69. Luo, C.; He, X.H.; Chen, H.; Hu, Y.; Ou, S.J. Molecular cloning and expression analysis of four action genes (MiACT) from mango. Biol. Plantarum. 2013, 57, 238–244. [Google Scholar] [CrossRef]
  70. Libak, K.J.; Schmittgen, T.D. Analysis of relative gene expression data using real-time quantitative PCR and the 2△△Ct method. Methods 2001, 25, 402–408. [Google Scholar]
  71. Clough, S.J.; Bent, A.F. Floral dip: A simplifed method for Agrobacterium-mediated transformation of Arabidopsis thaliana. Plant J. 1998, 16, 735–743. [Google Scholar] [CrossRef] [Green Version]
  72. Lu, X.; Zhang, X.F.; Duan, H.; Lian, C.L.; Liu, C.; Yin, W.L.; Xia, X.L. Three stress-responsive NAC transcription factors from Populus euphratica differentially regulate salt and drought tolerance in transgenic plants. Physiol. Plantarum. 2017, 162, 73–97. [Google Scholar] [CrossRef] [Green Version]
  73. Pla, M.; Vilardell, J.; Guiltinan, M.J.; Marcotte, W.R.; Niogret, M.F.; Quatrano, R.S.; Pages, M. The cis-regulatory element CCACGTGG is involved in ABA and water-stress responses of the maize gene rab28. Plant Mol. Biol. 1993, 21, 259–266. [Google Scholar] [CrossRef]
  74. Li, S.X.; Liu, J.L.; An, Y.R.; Cao, Y.M.; Liu, Y.S.; Zhang, J.; Geng, J.C.; Hu, T.M.; Yang, P.Z. MsPIP2;2, a novel aquaporin gene from Medicago sativa, confers salt tolerance in transgenic Arabidopsis. Environ. Exp. Bot. 2019, 165, 39–52. [Google Scholar] [CrossRef]
Figure 1. Sequence analysis of MiCOL16A and MiCOL16B. (A) Genomic structures of MiCOL16A and MiCOL16B. Exons are represented by black squares, and introns are represented by black lines. The numbers indicate the lengths of the corresponding regions. (B) Alignment of the predicted amino acid sequences of AtCOL6–8 and AtCOL16 in Arabidopsis and of MiCOL16A and MiCOL16B in mango. The conserved CCT and B-box domain regions are indicated with red boxes. The dark color indicates that the amino acids are 100% conserved. The genes and their accession numbers are shown in Supplementary Table S1. (C) Phylogenetic relationship of CO/COL proteins in Arabidopsis and mango. MiCOL16A and MiCOL16B are represented by black solid circles.
Ijms 23 03075 g001
Figure 2. Tissue-specific and temporal expression analysis of the MiCOL16A and MiCOL16B genes. (A,B) Expression patterns of the MiCOL16A and MiCOL16B genes in different tissues of SiJiMi mango. (C,D) Expression patterns of the MiCOL16A and MiCOL16B genes at different time points.
Ijms 23 03075 g002
Figure 3. Expression analysis of the MiCOL16A and MiCOL16B genes in terms of circadian rhythm. (A,C,E) Expression patterns of MiCOL16A under LD (A), normal (C) and SD (E) conditions. (B,D,F) Expression patterns of MiCOL16B under LD (B), normal (D) and SD (F) conditions.
Ijms 23 03075 g003
Figure 4. (A) Subcellular localization. Scale bars = 100 µm. (B) Transcriptional activation activity. The left diagram shows various constructs. MCS, multiple cloning sites; BD, GAL4-DNA binding domain; BBX, B-box; CCT, CO, CO-like, TOC1; MR, middle region.
Ijms 23 03075 g004
Figure 5. Ectopic expression of MiCOL16A and MiCOL16B delayed flowering under LD conditions. (A1,B1) Expression of MiCOL16A (A1) and MiCOL16B (B1) in the WT, empty vector-transformed and overexpression plants. (A) MiCOL16A transgenic Arabidopsis plants under LD conditions. (B) MiCOL16B transgenic Arabidopsis plants under LD conditions.
Ijms 23 03075 g005
Figure 6. Ectopic expression of MiCOL16A and MiCOL16B delayed flowering under SD conditions. (A1,B1) Expression of MiCOL16A (A1) and MiCOL16B (B1) in the WT, empty vector-transformed and overexpression plants. (A) MiCOL16A transgenic Arabidopsis plants under SD conditions. (B) MiCOL16B transgenic Arabidopsis plants under SD conditions.
Ijms 23 03075 g006
Figure 7. Expression patterns of flowering-related genes. (AD) Expression patterns of AtFT and AtSOC1 in the WT and the MiCOL16A (A,B) or MiCOL16B (C,D) overexpression plants under LD conditions. (EH) Expression levels of AtFT and AtSOC1 in the WT and the MiCOL16A (E,F) or MiCOL16B (G,H) overexpression plants under SD conditions. Significant differences among the samples were assessed at the p < 0.05 (*) and p < 0.01 (**) levels by Student’s t tests.
Ijms 23 03075 g007
Figure 8. Assays of the length of the primary roots of WT and MiCOL16A transgenic lines under abiotic stress. (A) Seeds of the WT and three transgenic lines grown on half-strength MS media and subjected to various stresses. The bars represent 1.0 cm. (B) Lengths of the roots of all the lines under salt and drought treatment. Significant differences among the samples were assessed at the p < 0.05 (*) and p < 0.01 (**) levels by Student’s t tests.
Ijms 23 03075 g008
Figure 9. Assays of the length of the primary roots of the WT and MiCOL16B transgenic lines under abiotic stress. (A) Seeds of the WT and three transgenic lines grown on half-strength MS media and subjected to various stresses. The bars represent 1.0 cm. (B) Lengths of the roots of all the lines under salt and drought treatment. Significant differences among the samples were assessed at the p < 0.01 (**) levels by Student’s t tests.
Ijms 23 03075 g009
Figure 10. Phenotypes of WT and MiCOL16A and MiCOL16B transgenic plants under abiotic stresses. Normal, control; salt, 300 mM NaCl solution applied every 2 days; drought, withholding of water. (A) WT and MiCOL16A transgenic plants under different stresses. (B) WT and MiCOL16B transgenic lines under different stresses. (CD) Survival rates of the WT and the MiCOL16A (C) and MiCOL16B (D) transgenic lines under different stresses. Significant differences among the samples were assessed at the p < 0.01 (**) levels by Student’s t tests.
Ijms 23 03075 g010
Figure 11. Expression patterns of stress-responsive genes in WT and MiCOL16A and MiCOL16B transgenic lines. (A,B) Salt stress conditions. Expression levels of the AtNHX1, AtRD20 and AtSOS1 genes in MiCOL16A (A) and MiCOL16B (B) transgenic lines. (C,D) Drought stress conditions. Expression levels of the AtNHX1, AtRD20 and AtCOR15A genes in the MiCOL16A (C) and MiCOL16B (D) transgenic lines. Significant differences among the samples were assessed at the p < 0.05 (*) and p < 0.01 (**) levels by Student’s t tests.
Ijms 23 03075 g011
Table 1. Overexpression of MiCOL16A and MiCOL16B repressed flowering in Arabidopsis.
IDDays to FloweringNo. Rosette LeavesPlant Height a (cm)
LDSDLDSDLDSD
WT24.8 ± 0.650.1 ± 0.85.5 ± 0.57.2 ± 0.36.4 ± 0.811.4 ± 0.6
pBI12125.6 ± 0.449.6 ± 0.77.6 ±0.67.0 ± 0.56.7 ± 0.411.7 ± 0.4
MiCOL16A
OE228.0 ± 0.3 *51.3 ± 0.86.3 ± 0.47.6 ± 0.34.6 ± 1.1 *14.2 ± 0.9 *
OE828.0 ± 0.5 *52.8 ± 0.2 *6.8 ± 0.6 *7.3 ± 0.74.5 ± 0.6 *14.2 ± 0.8 *
OE1028.1 ± 0.8 *52.8 ± 0.3 *7.5 ± 1.0 *7.3 ± 0.56.2 ± 1.113.0 ± 0.3 *
MiCOL16B
OE327.6 ± 0.5 *53.0 ± 0.4 *6.6 ± 0.7 *7.4 ± 0.64.7 ± 1.0 *17.7 ± 1.1 *
OE1226.9 ± 0.8 *51.2 ± 0.97.1 ± 0.5 *7.3 ± 0.45.2 ± 1.1 *17.1 ± 1.0 *
OE1328.4 ± 0.5 *51.5 ± 0.4 *6.7 ± 0.7 *6.6 ± 0.64.3 ± 0.8 *13.4 ± 0.2 *
a Plant height was measured at the time of flowering. Significant differences among the samples were assessed at the p < 0.05 (*) level by Student’s t tests.
Publisher’s Note: MDPI stays neutral with regard to jurisdictional claims in published maps and institutional affiliations.

