
Glutathione Modulation in PVYNTN Susceptible and Resistant Potato Plant Interactions

 ,
,  , , and
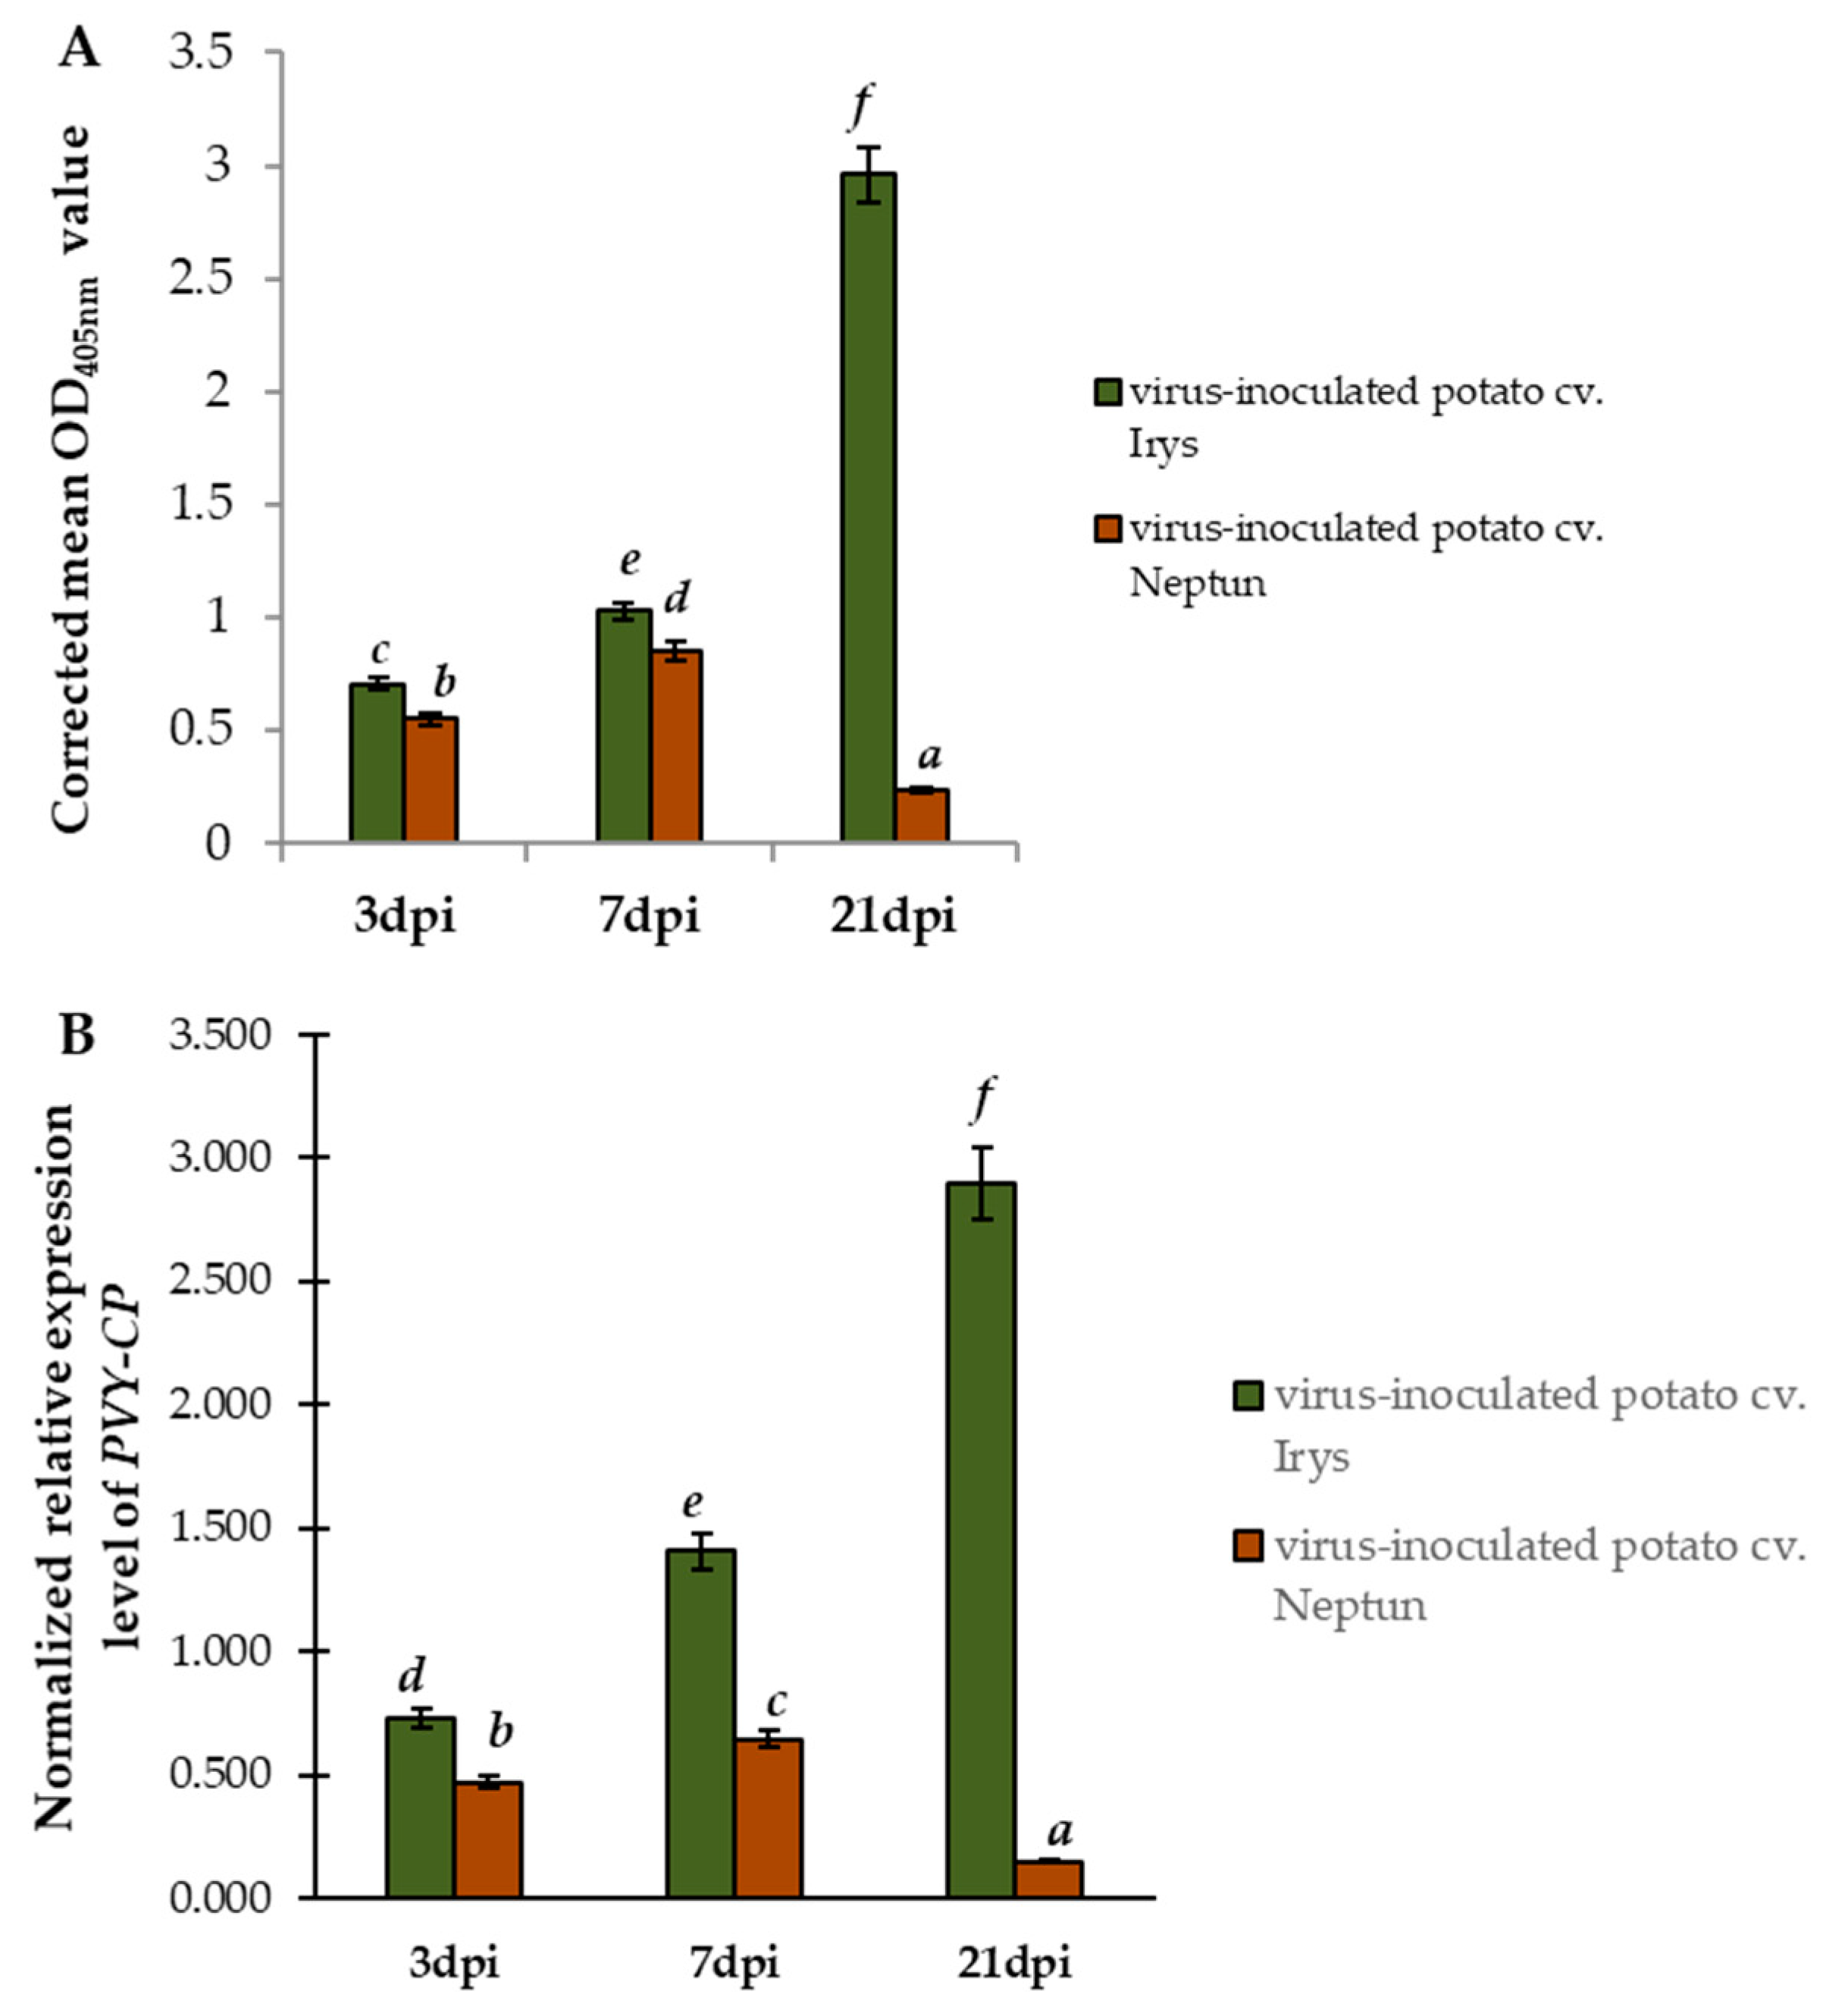
Abstract
:1. Introduction
2. Results
2.1. Changes in Concentration of PVYNTN in Leaves of Susceptible Irys and Hypersensitive Neptun Potato Plants
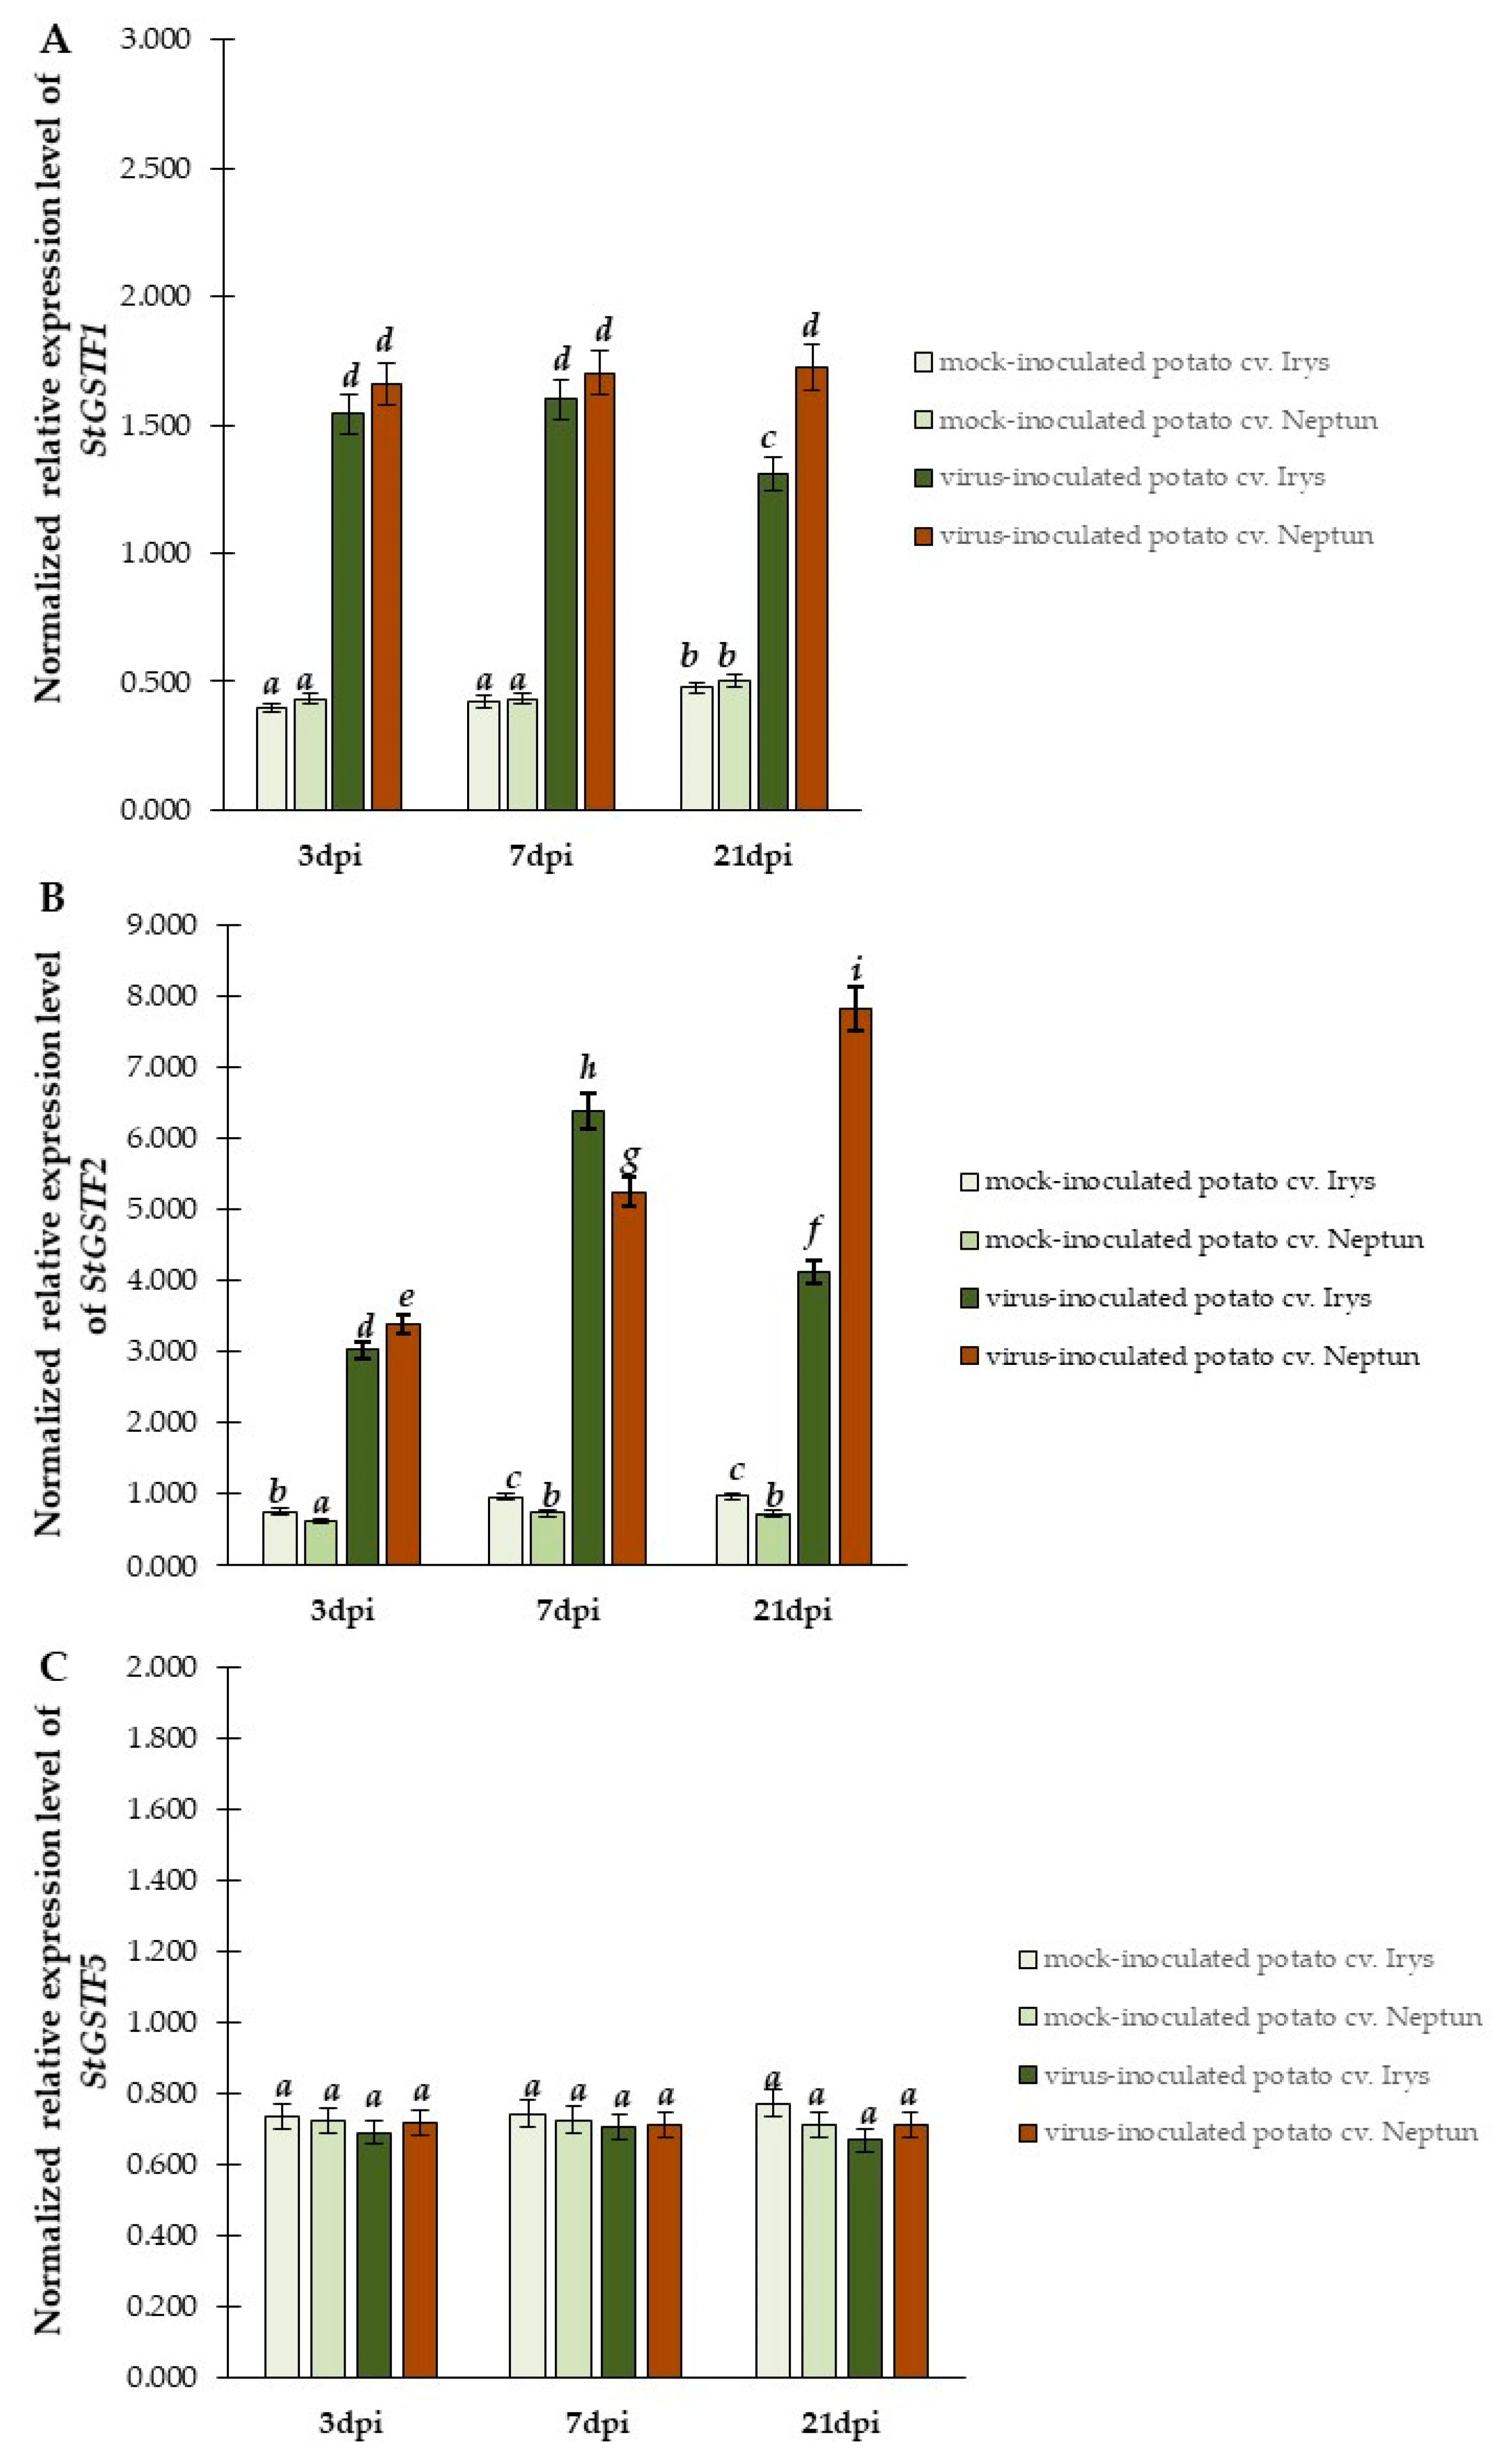
2.2. Relative Expression of Selected GST Genes in PVYNTN Differs the Infected Susceptible and Resistance Potato Plants
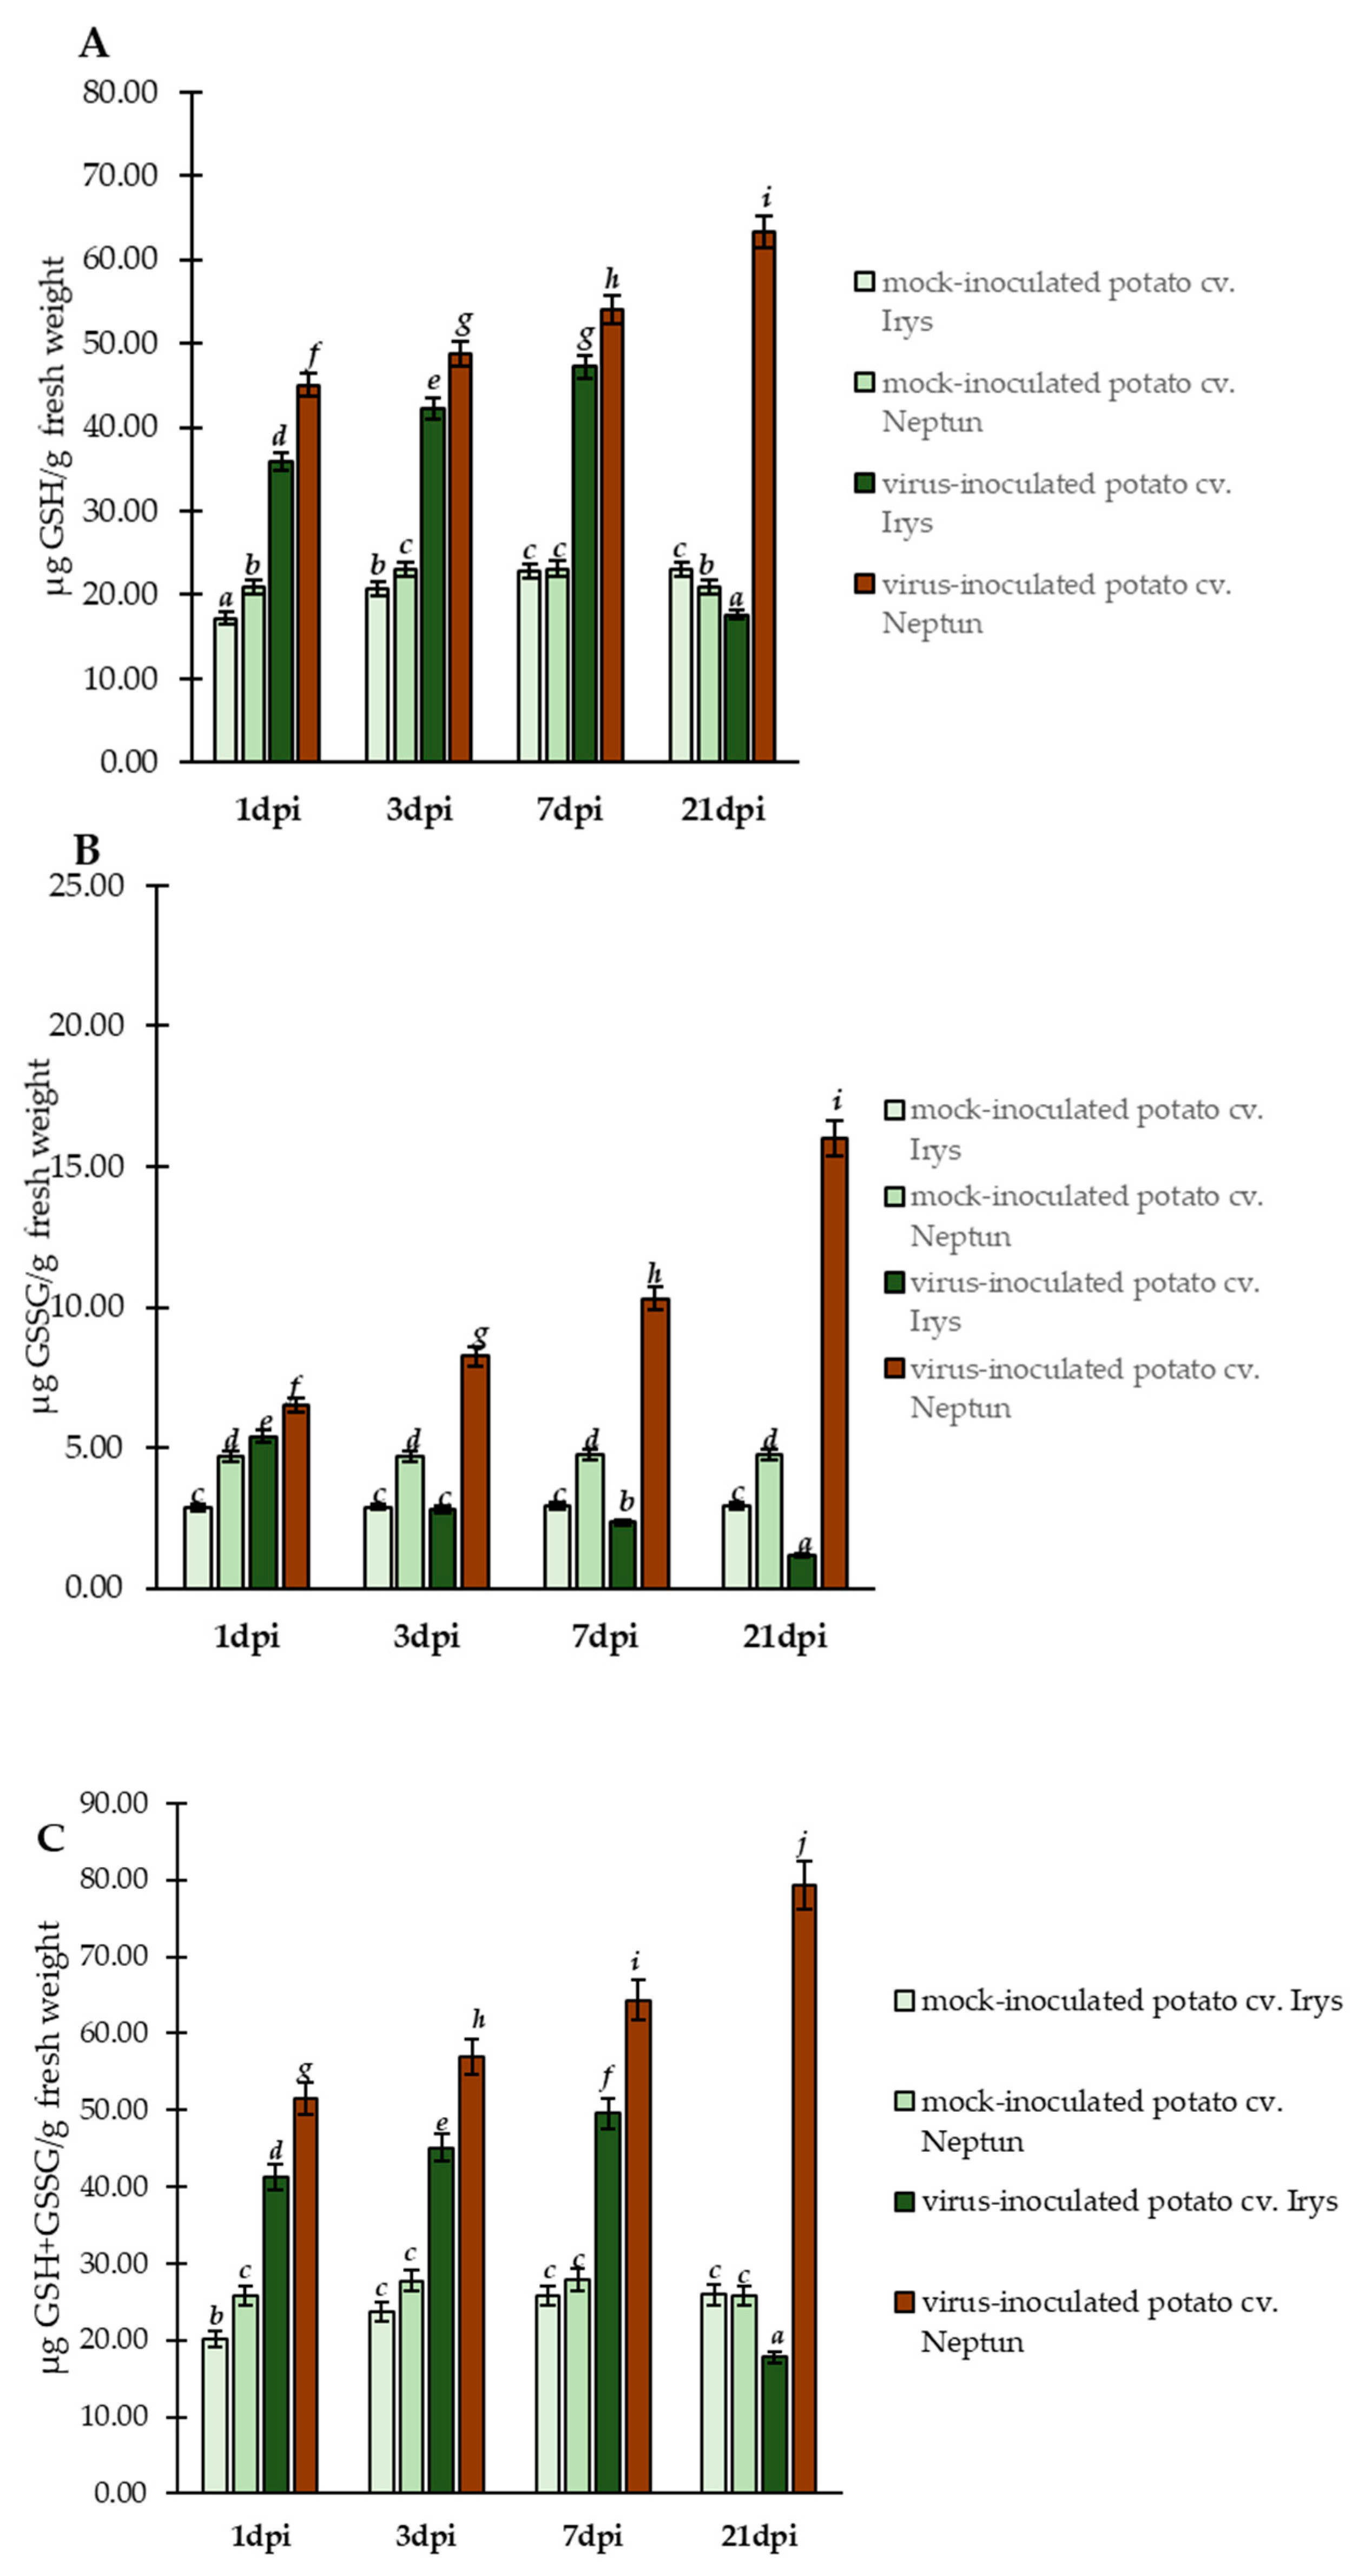
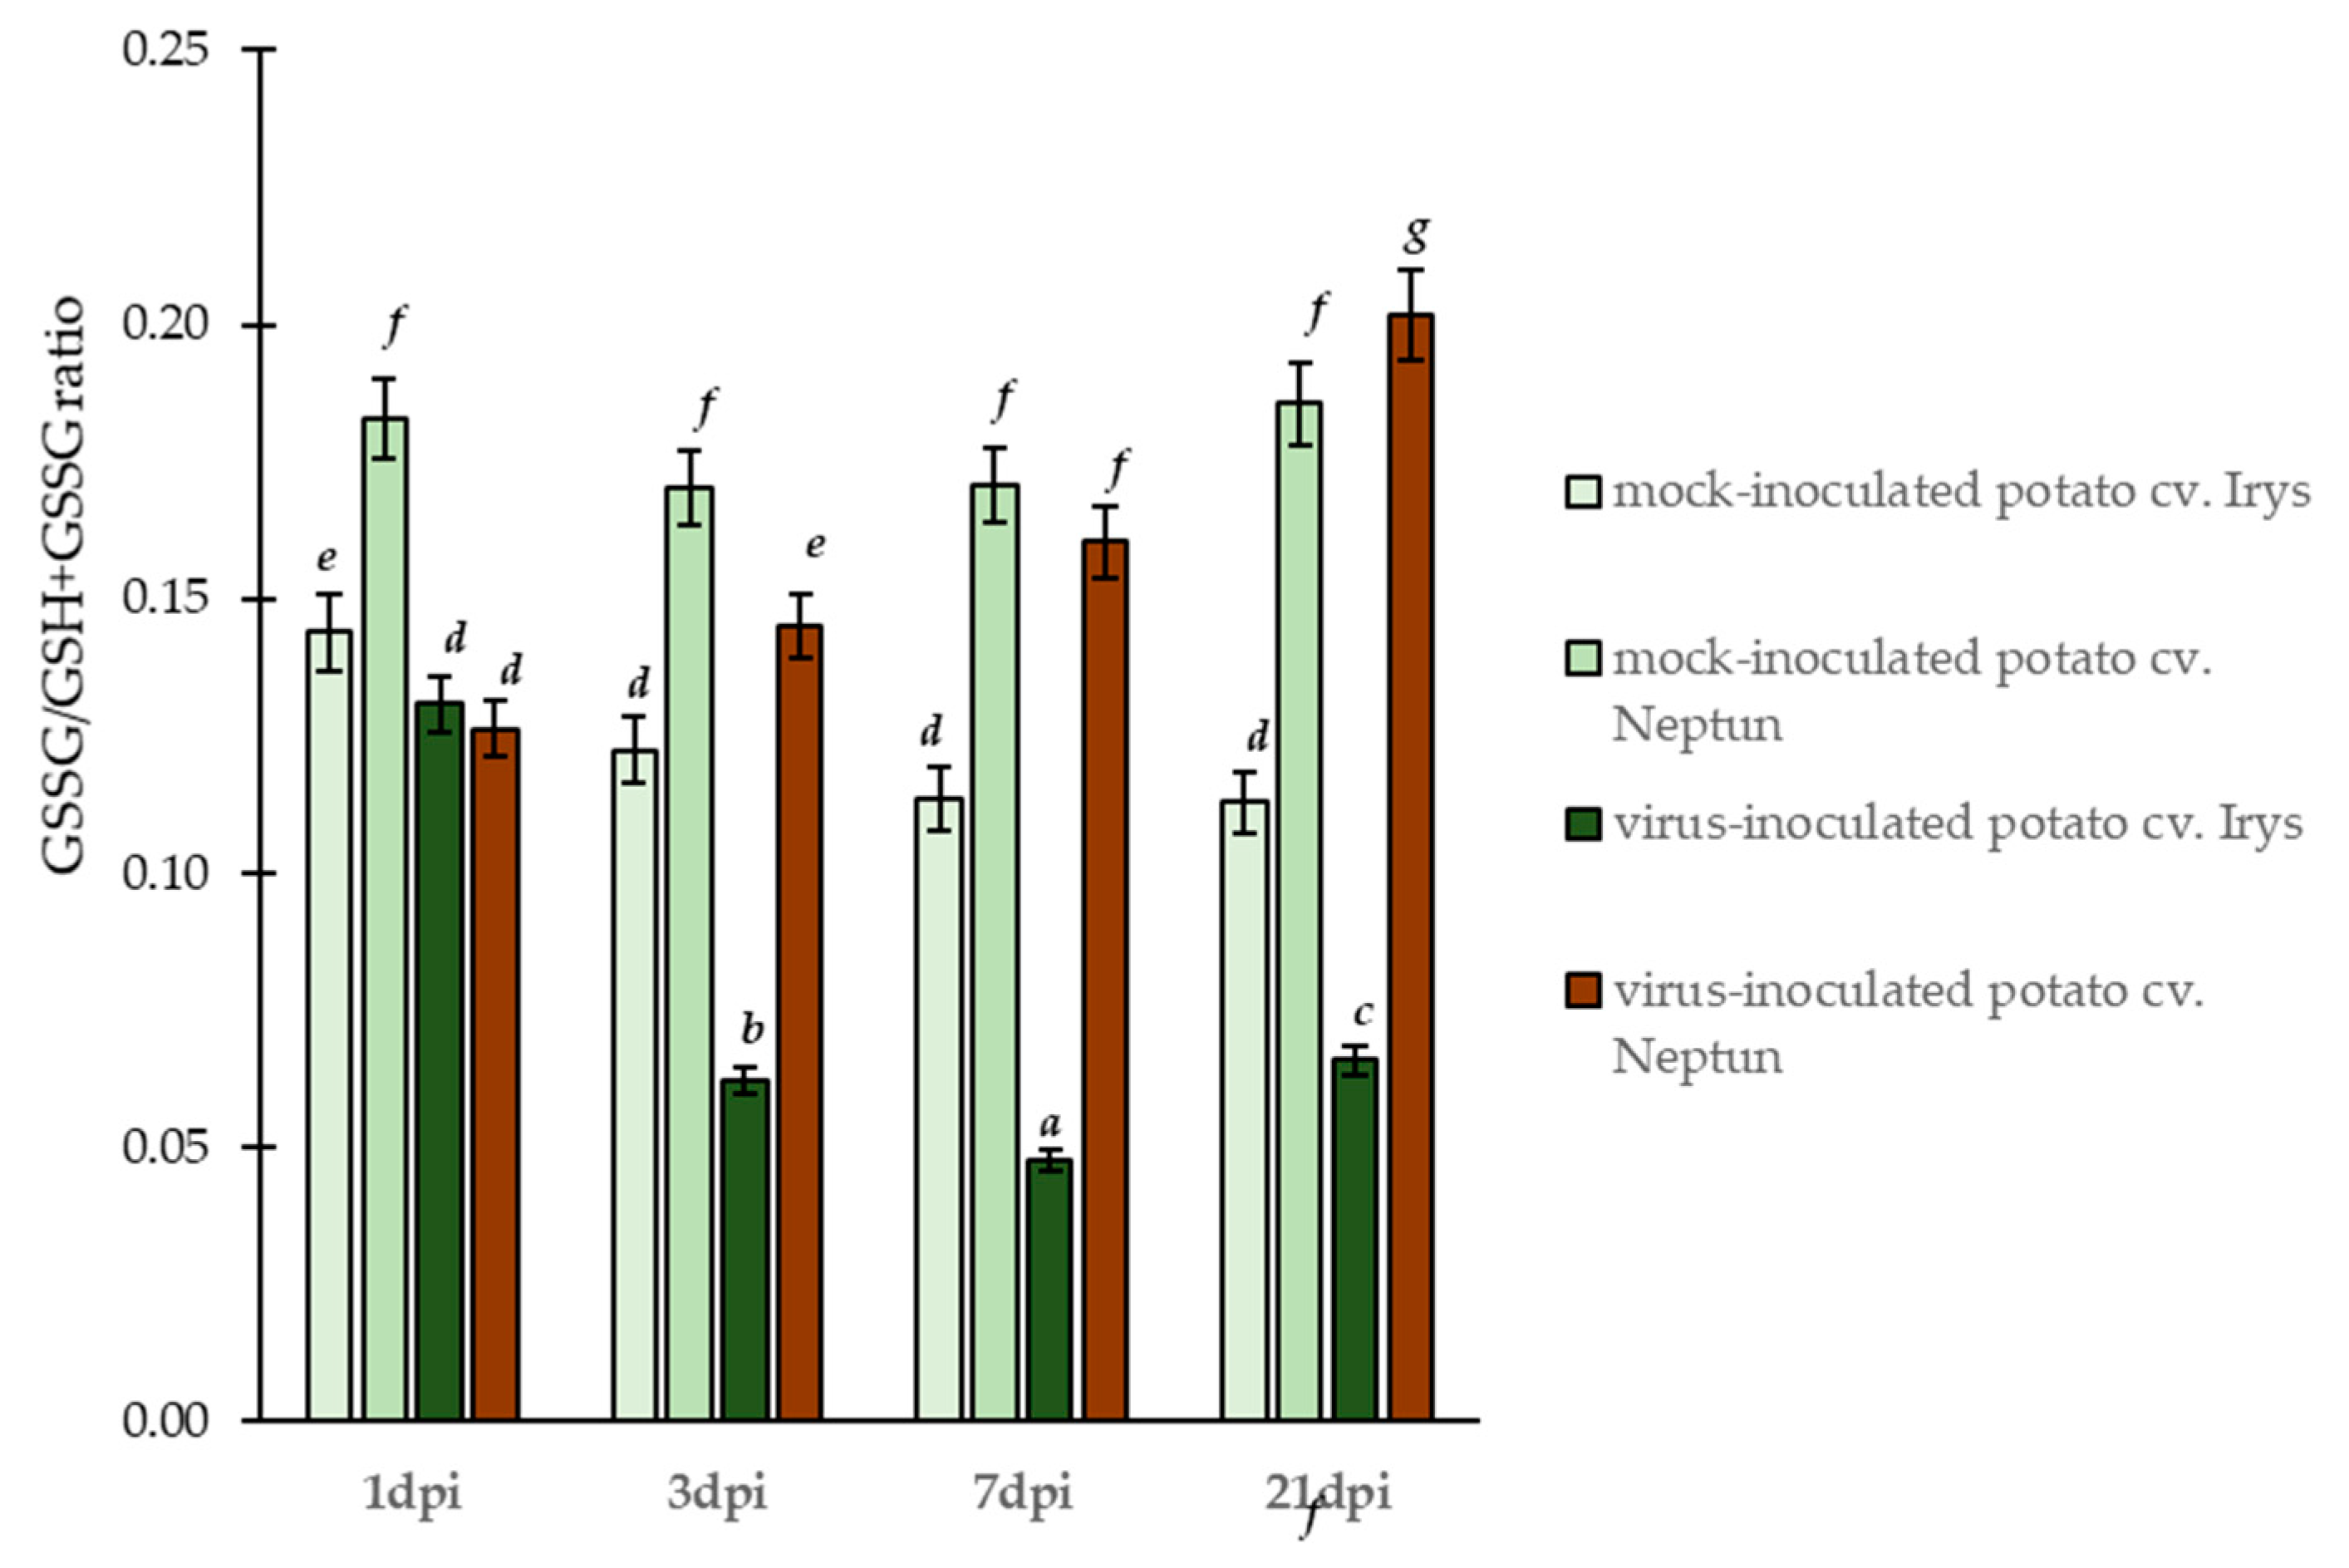
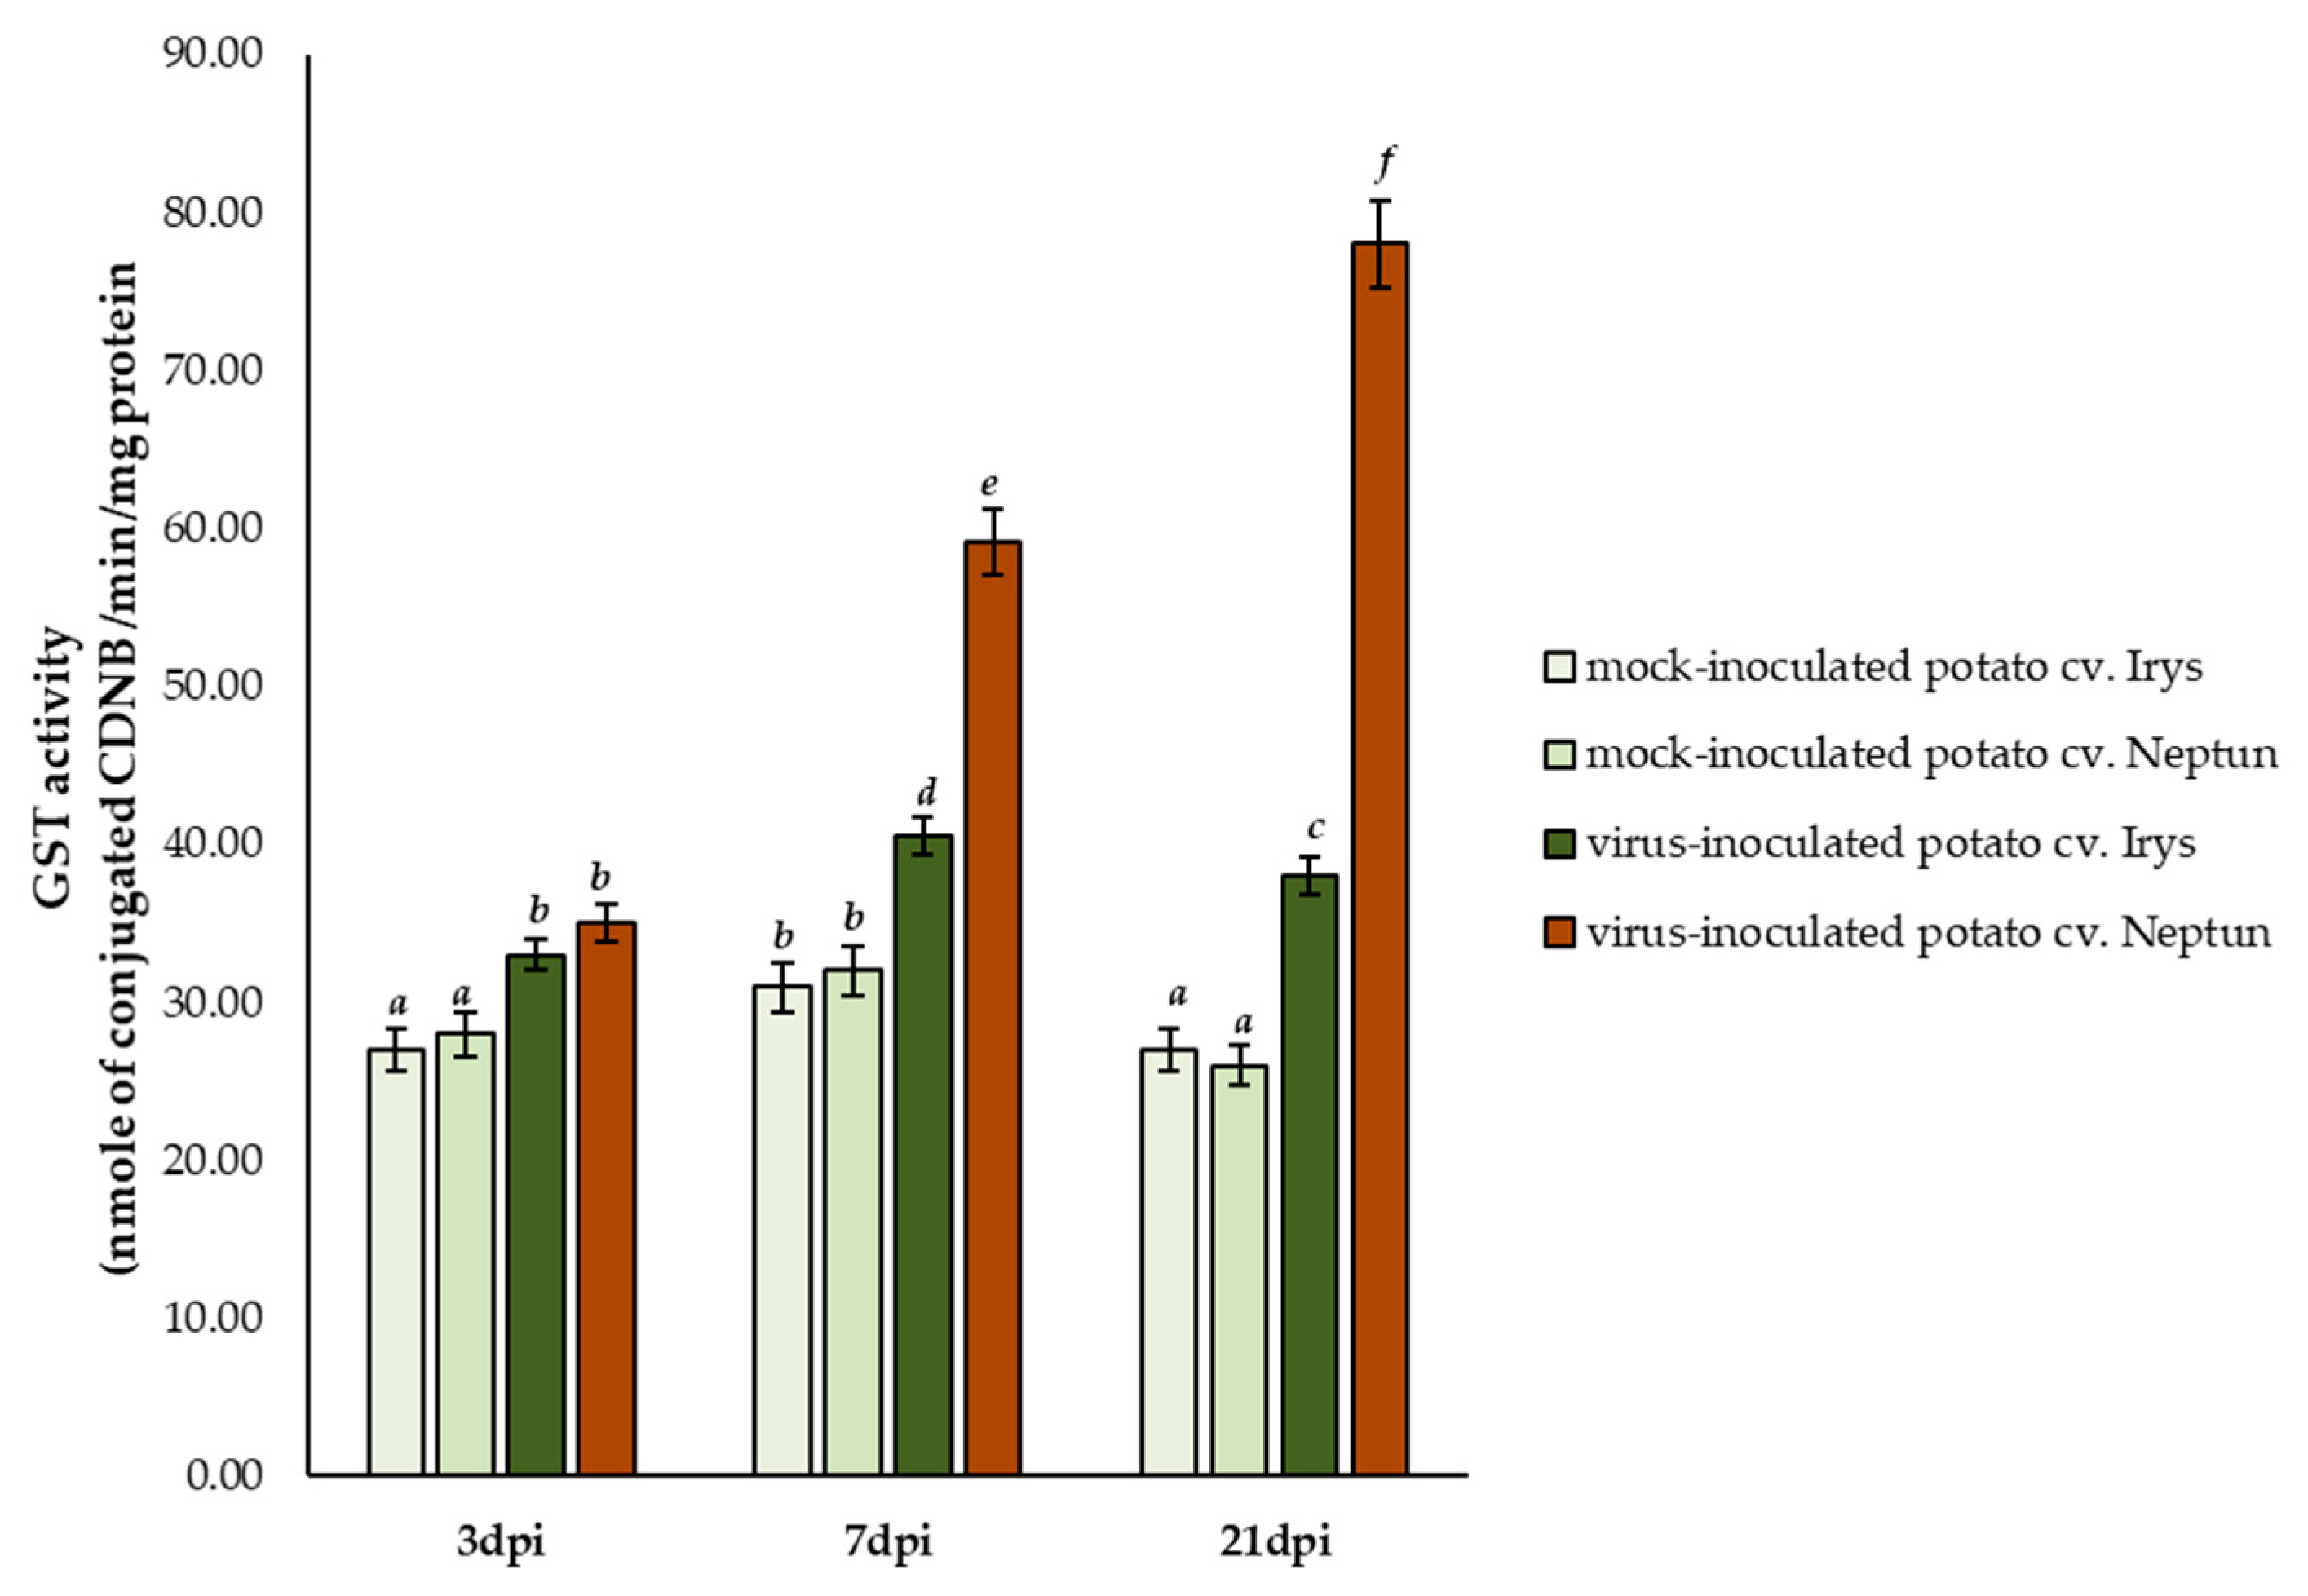
2.3. Significant Changes in the Concentration of Reduced (GSH) and Oxidized (GSSG) Forms and GST Activity as Differentiating Factor of Susceptibility and Resistance to PVYNTN
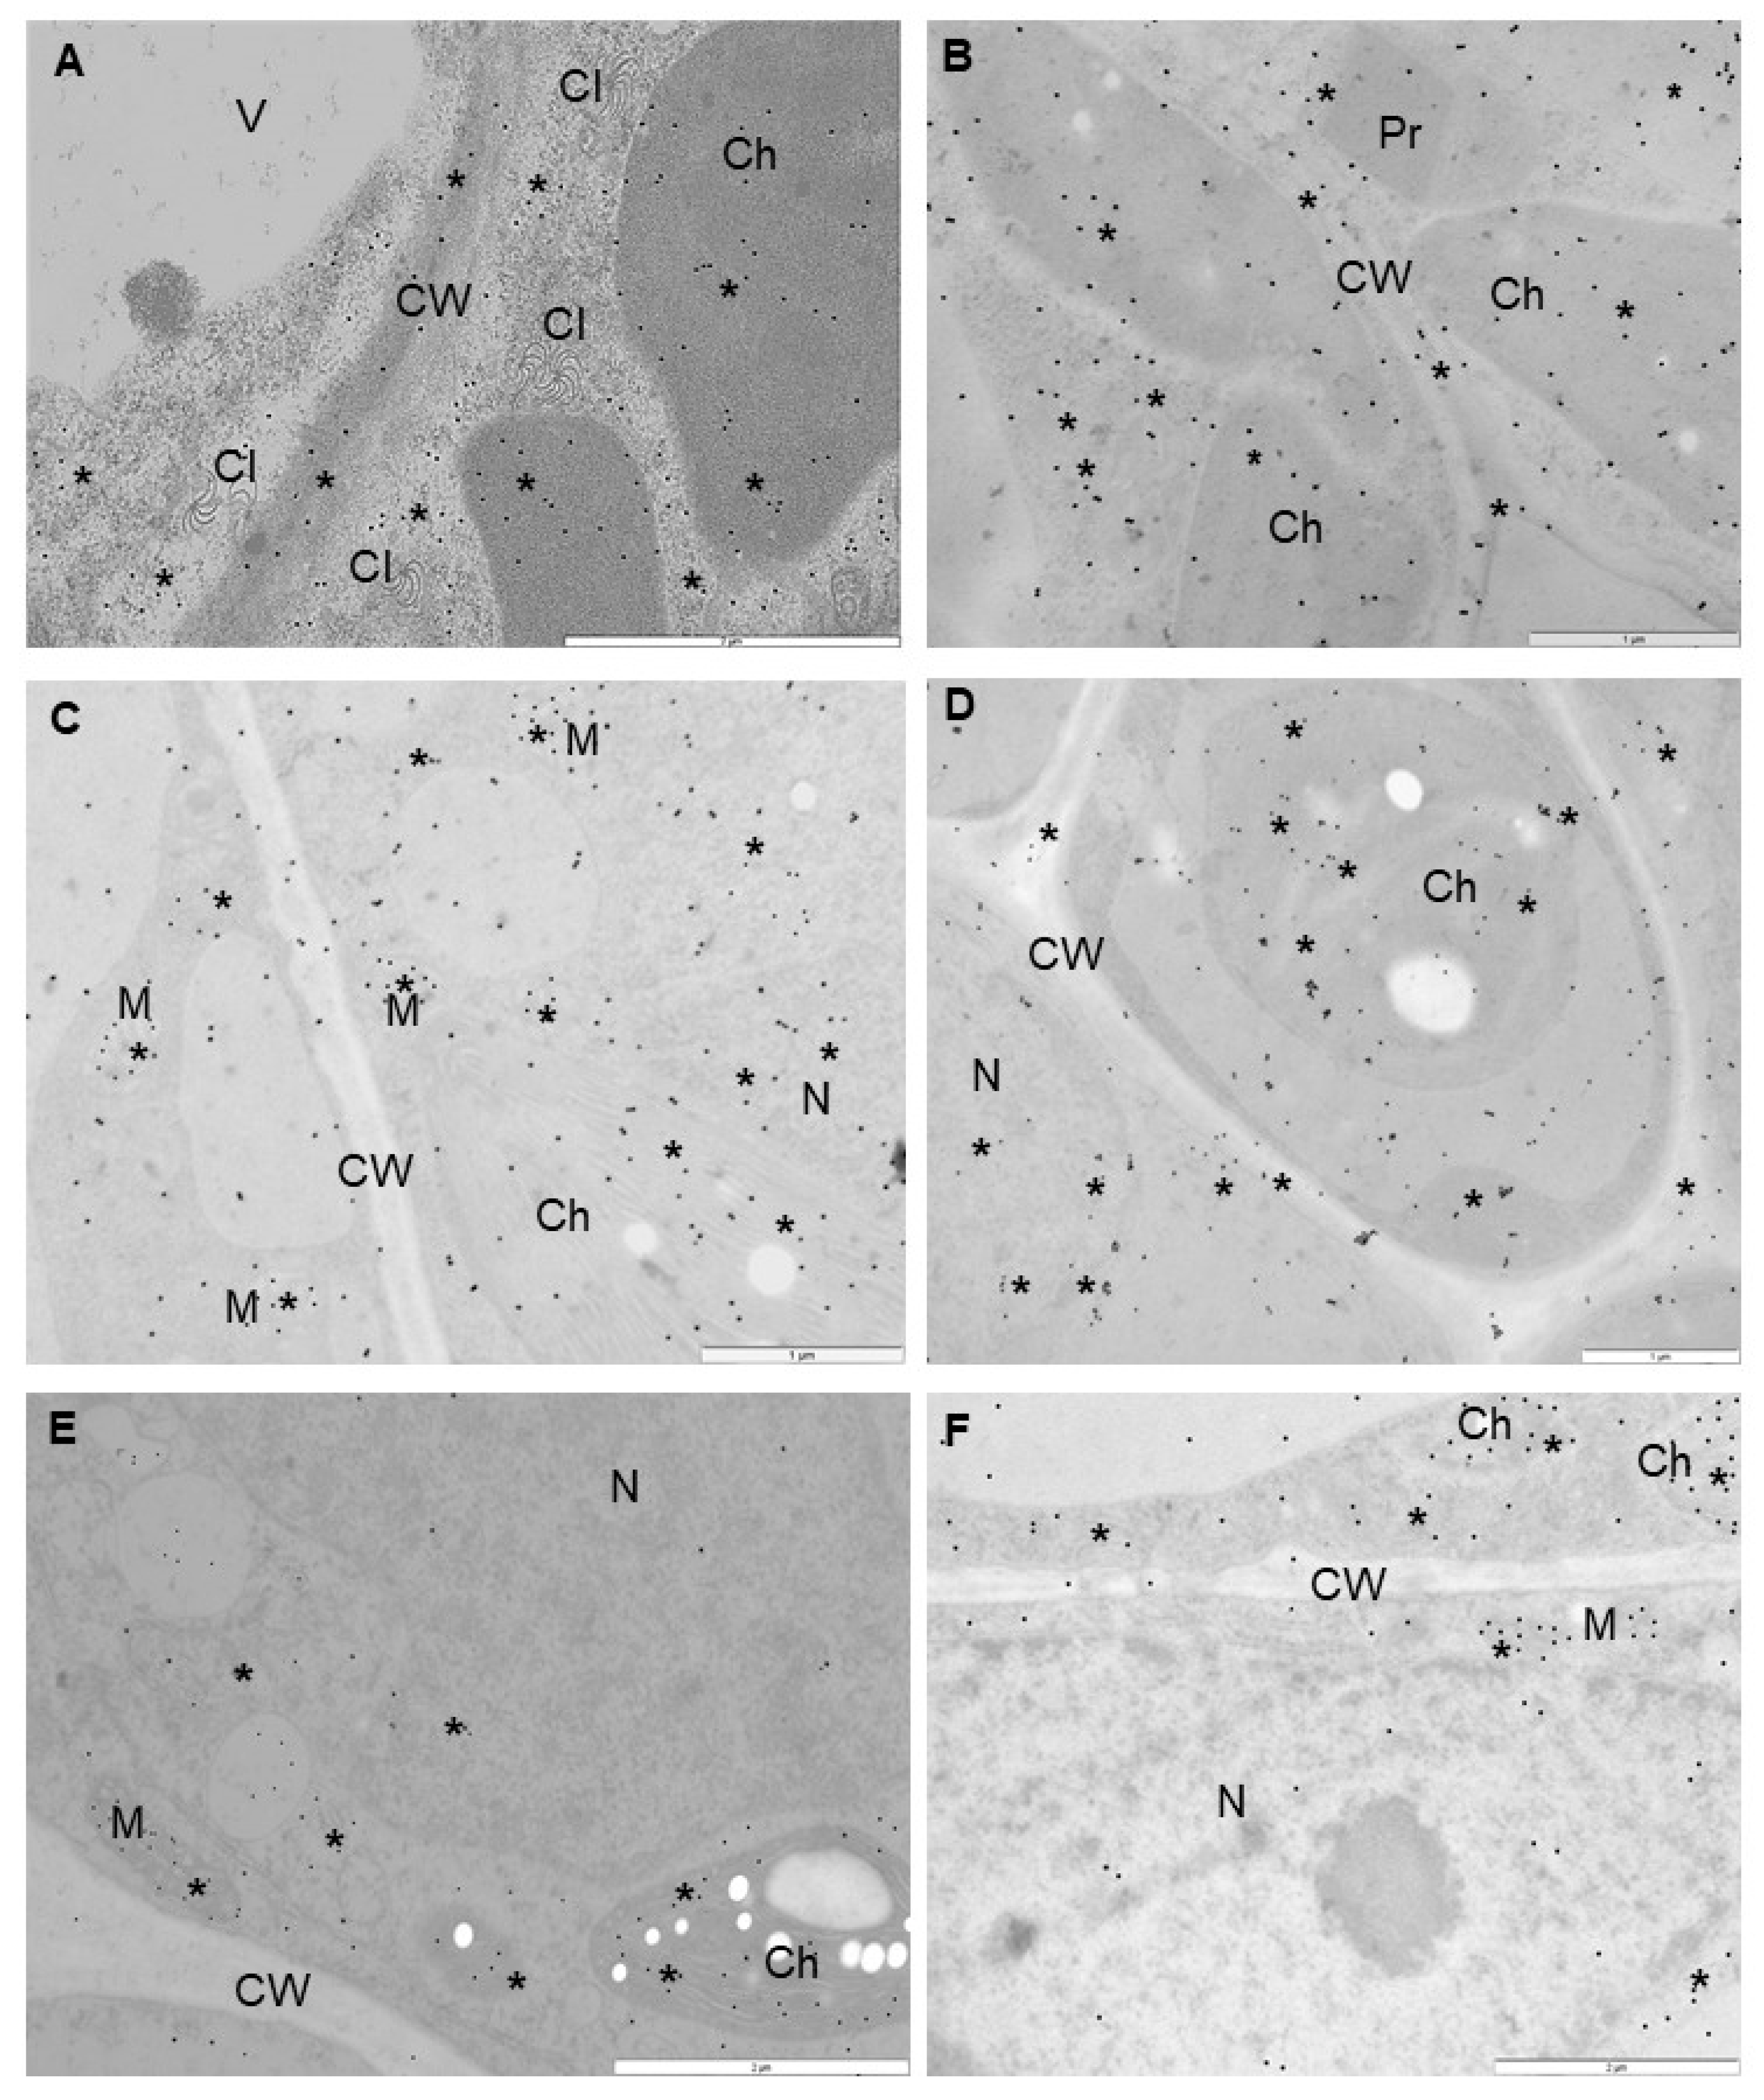
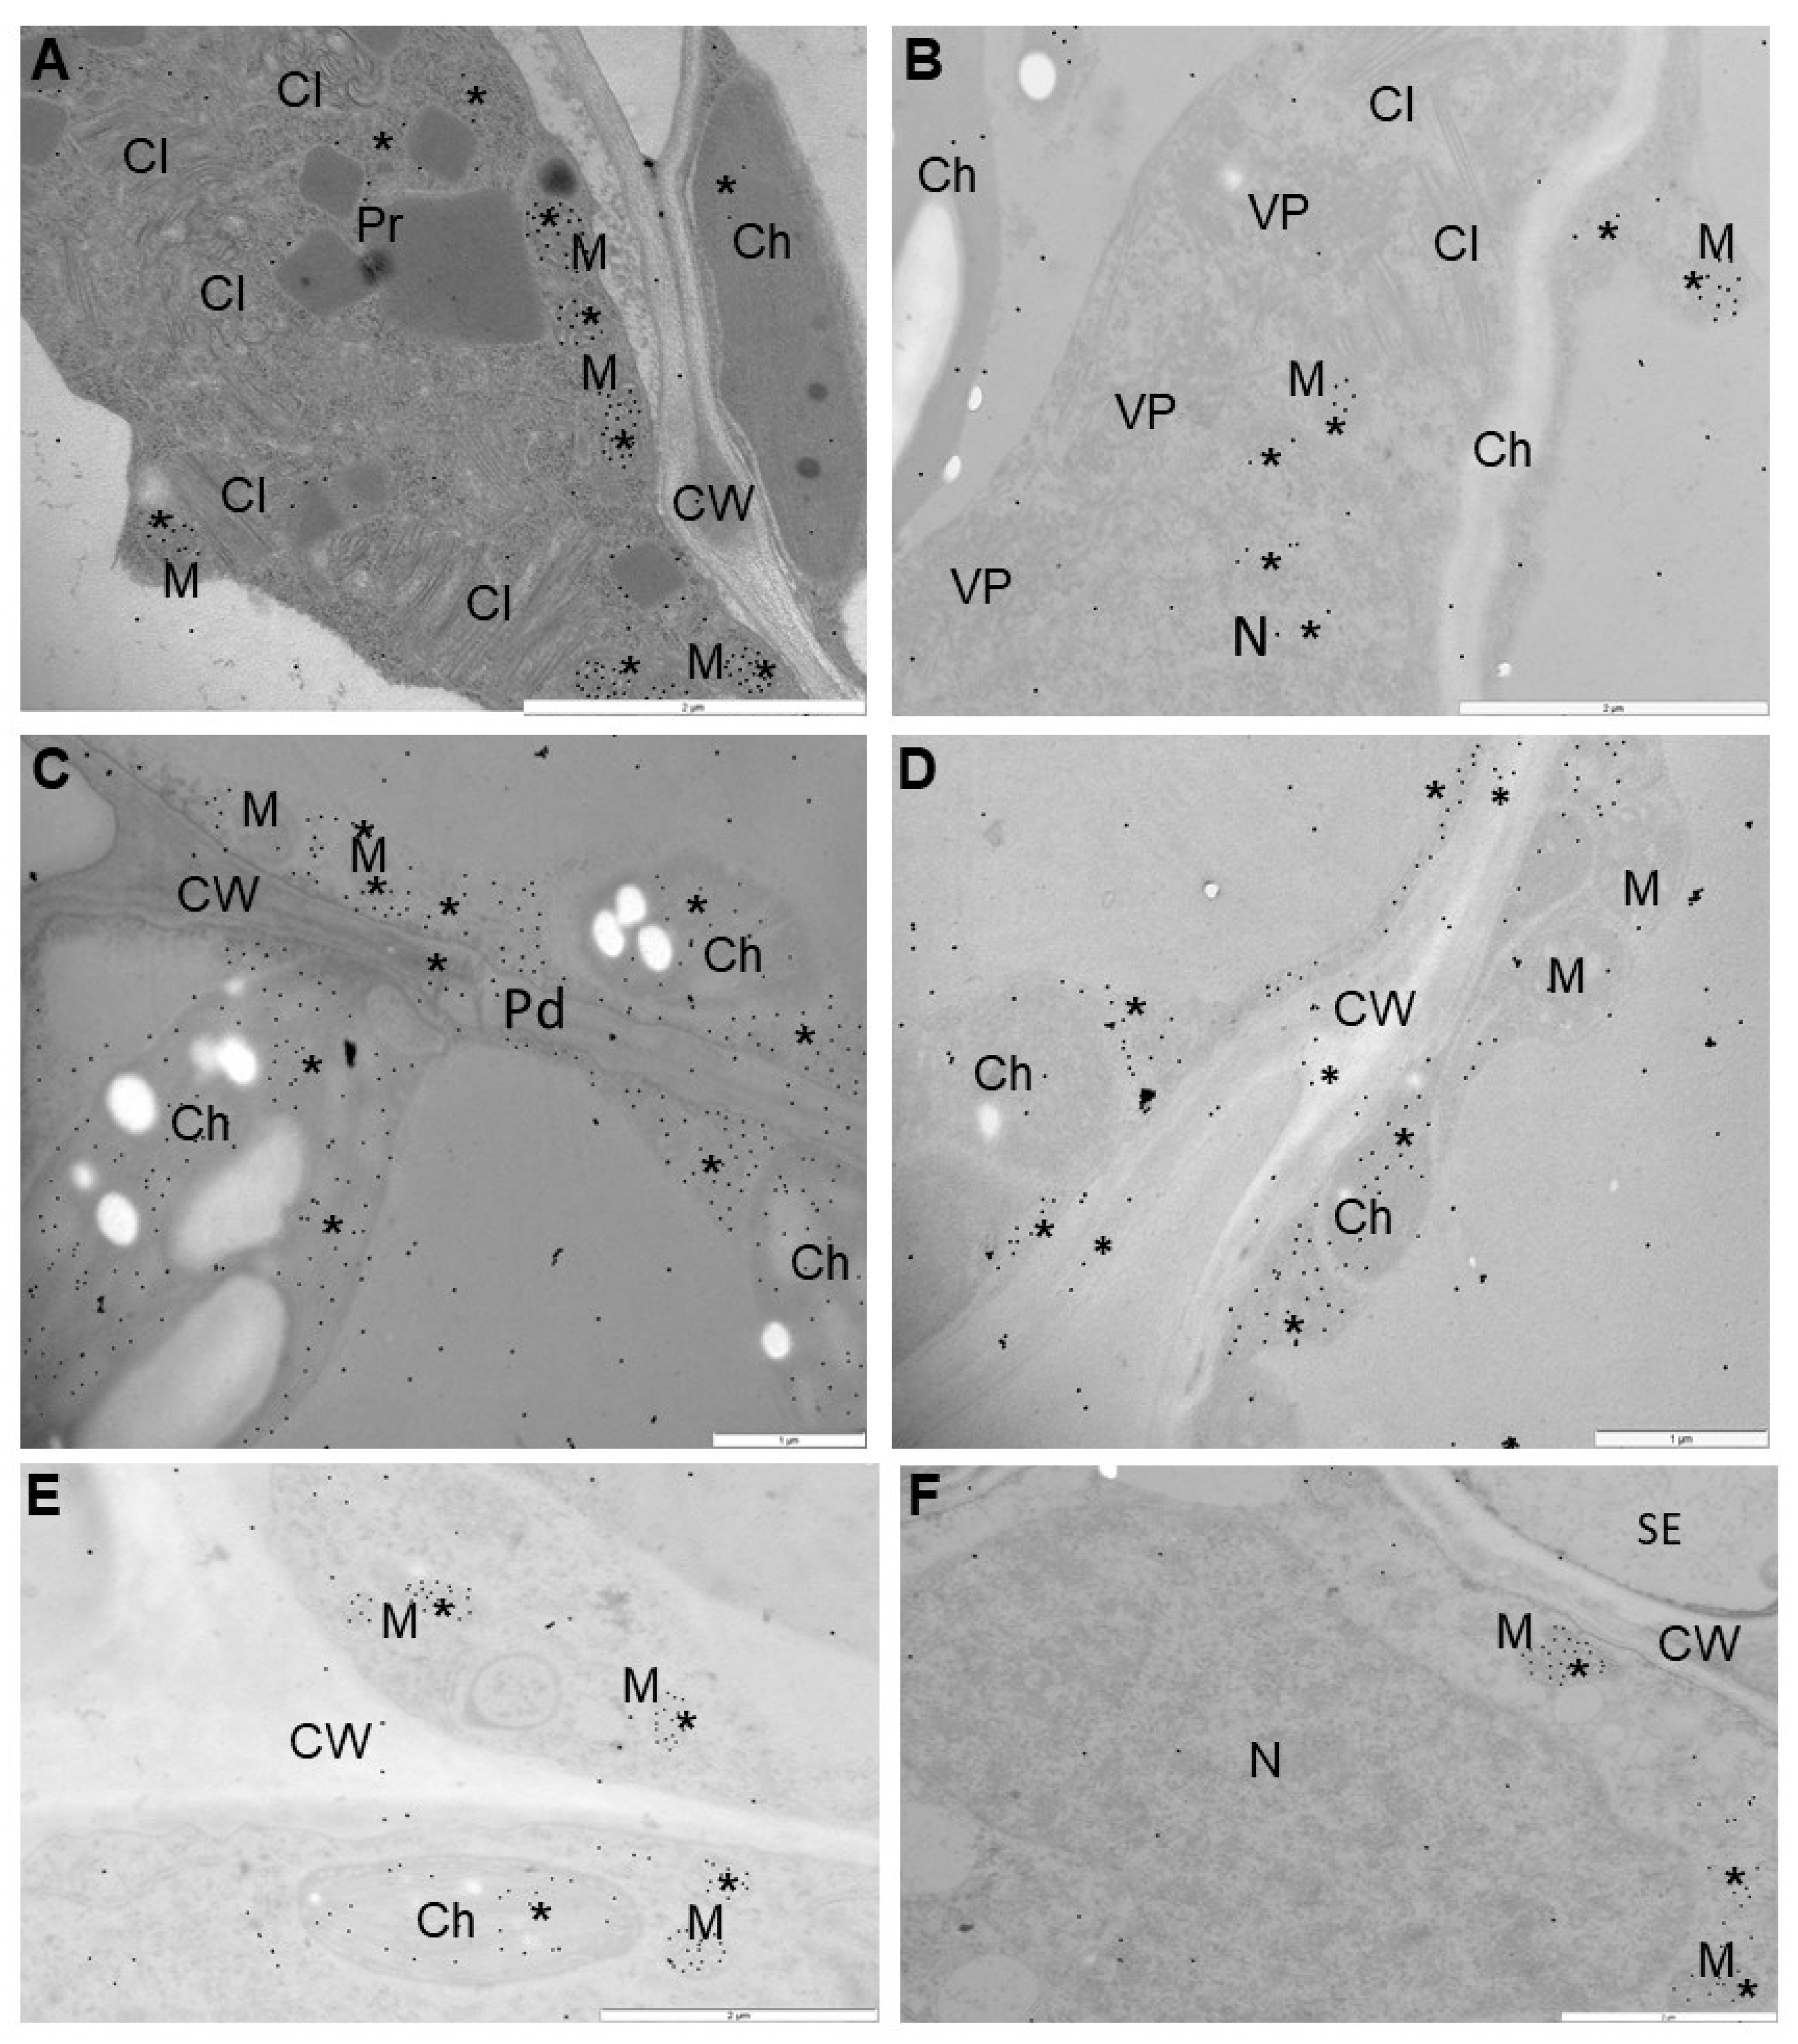
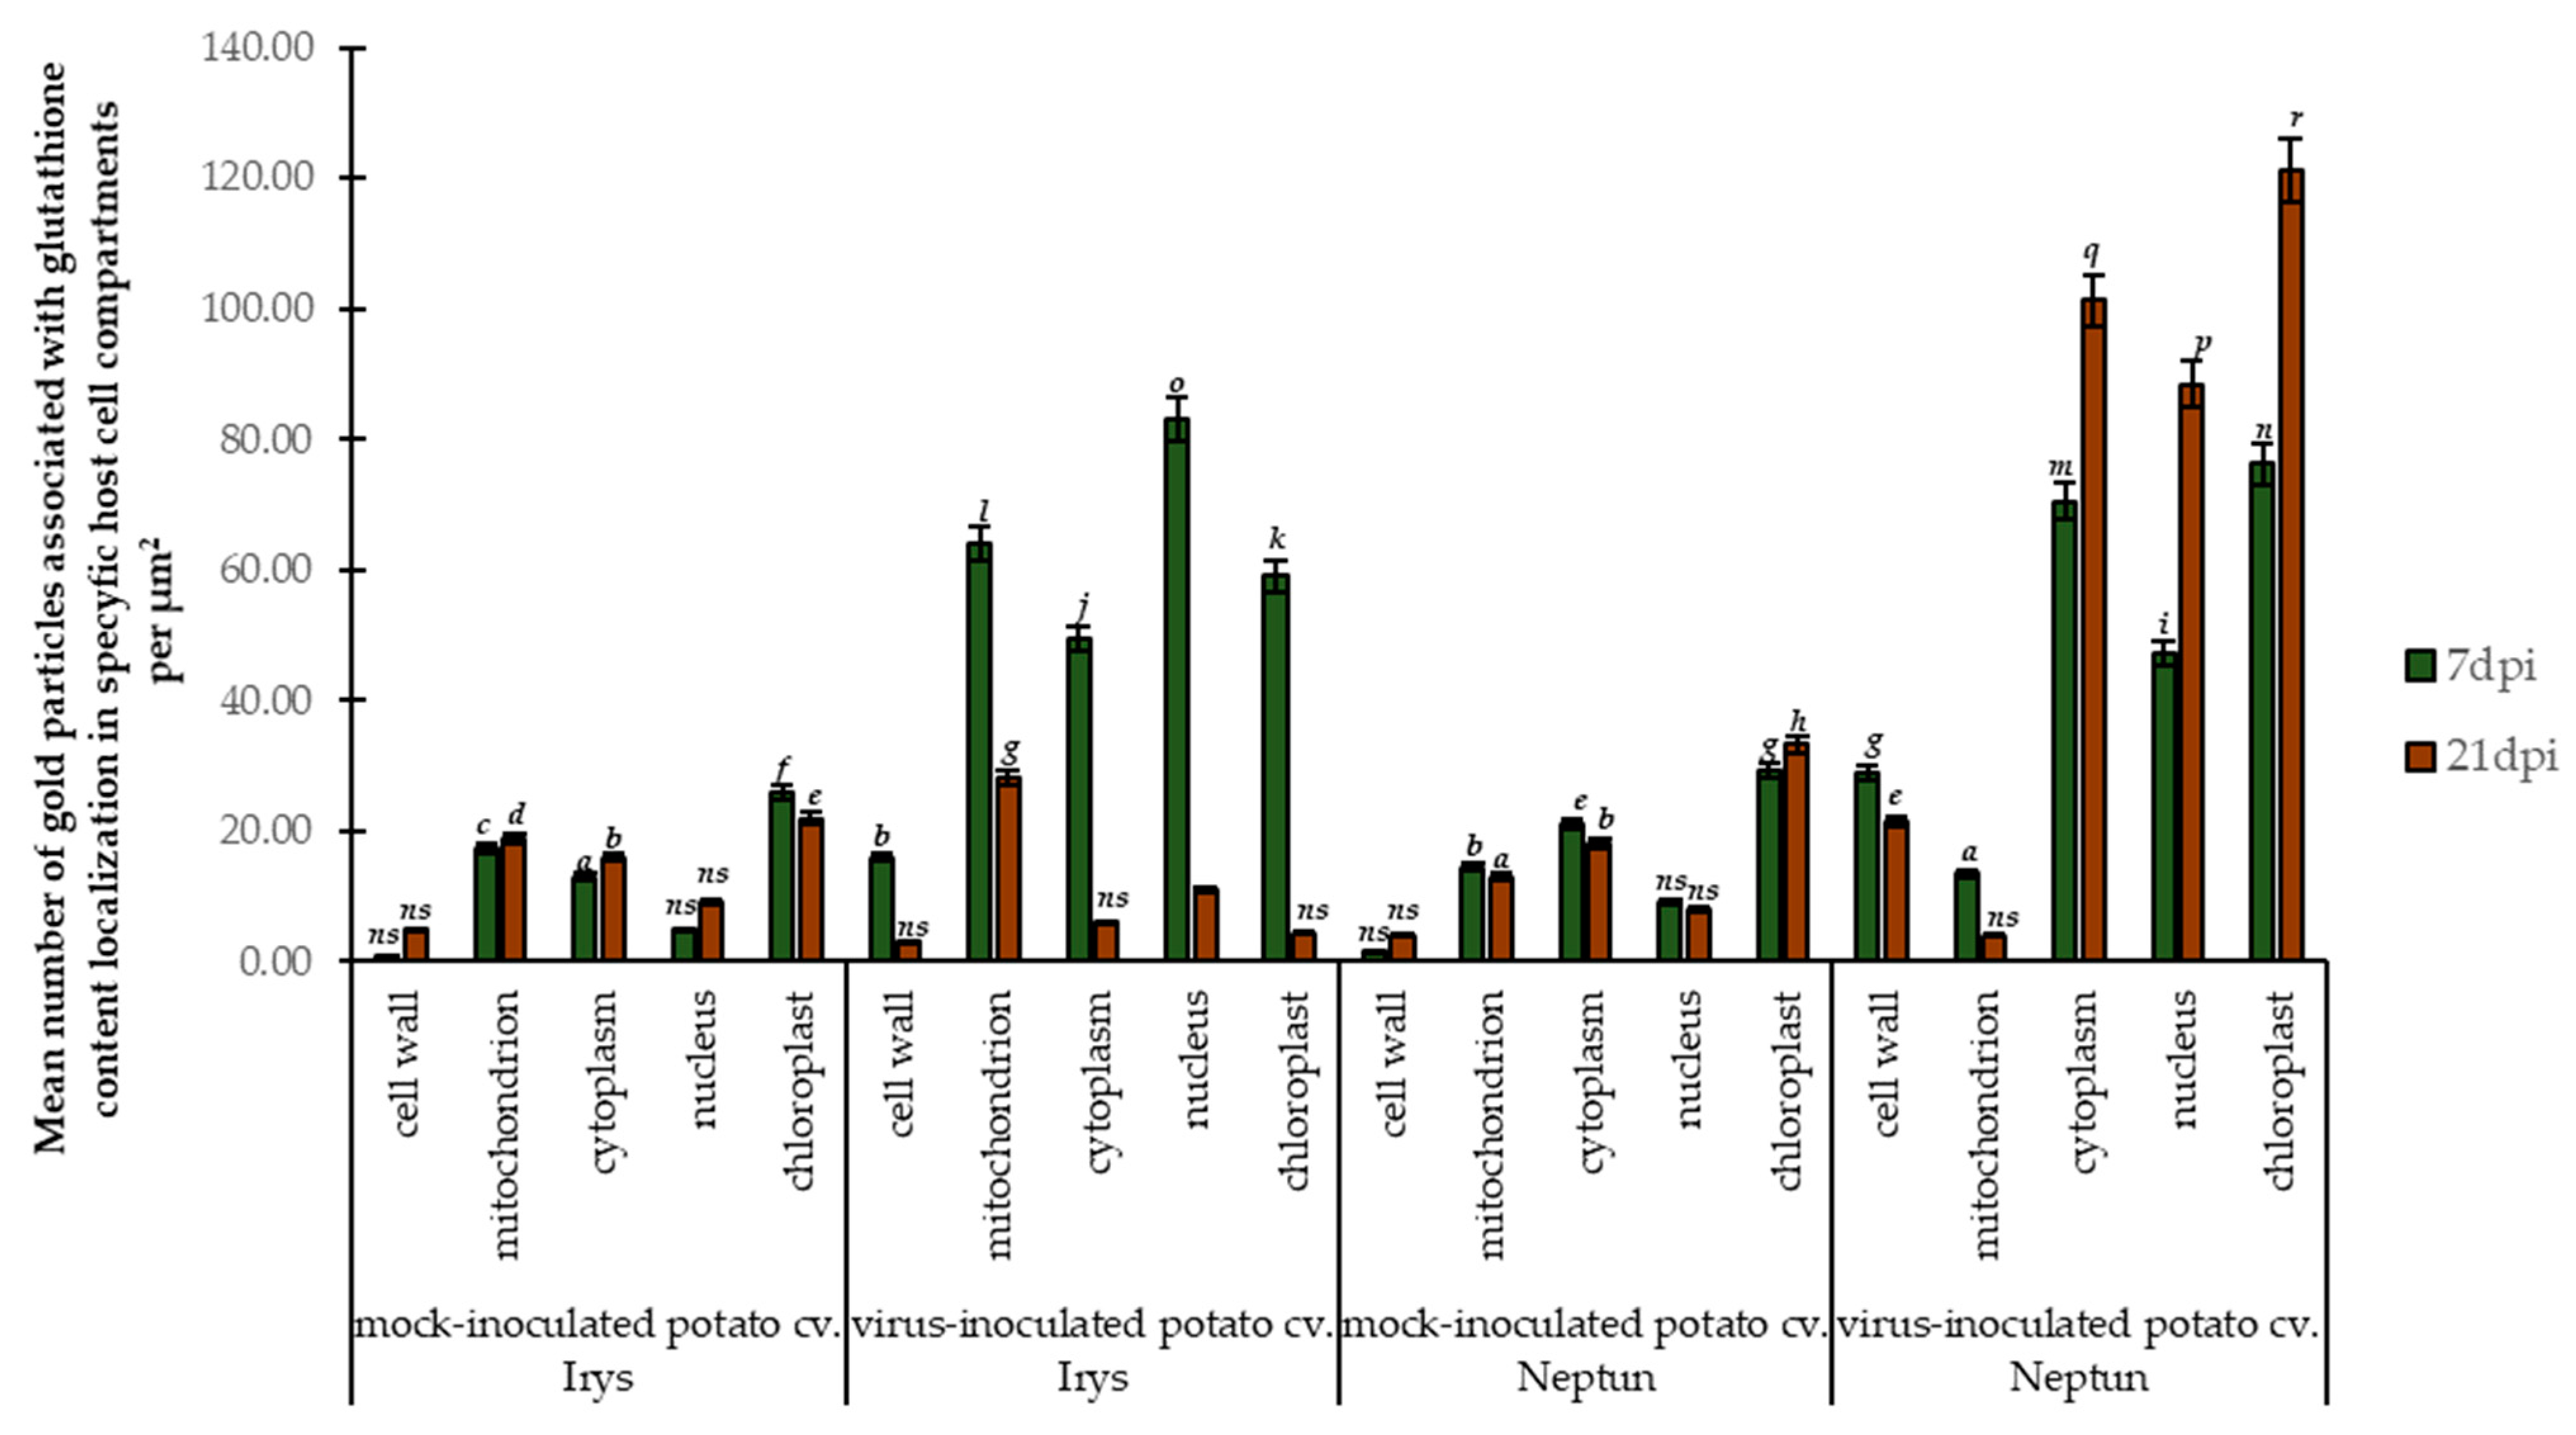
2.4. Subcellular Protection of Cell Organelles by Significant Redistribution Effect of Glutathione (GSH + GSSG) in Resistance to PVYNTN
3. Discussion
4. Materials and Methods
4.1. Plant Material, Virus Inoculation, DAS-ELISA and PVY Concentration
4.2. Isolation of RNA and Genomic DNA (gDNA) for GST Gene in PVYNTN-Infected Potato Plants
4.3. Analysis of Expression of Selected GSTF Genes in PVYNTN-Infected Potato Plants Using qPCR
4.4. High-Performance Liquid Chromatography (HPLC) Analysis of Reduced (GSH) and Oxidized (GSSG) Forms and Summary Glutathione Content
4.5. Validation of GSTs Activity in Leaves of PVYNTN-Infected Potato Plants
4.6. Immunogold Localization of Glutathione Content Changes in PVYNTN-Infected Potato Plants
4.7. Pearson’s Correlation Coefficients (PCCs) for Analyses
5. Conclusions
Supplementary Materials
Author Contributions
Funding
Institutional Review Board Statement
Informed Consent Statement
Acknowledgments
Conflicts of Interest
References
- Noctor, G.; Foyer, C.H. Ascorbate and glutathione: Keeping active oxygen under control. Annu. Rev. Plant Physiol. Plant Mol. Biol. 1998, 49, 249–279. [Google Scholar] [CrossRef] [PubMed]
- Sabetta, W.; Paradiso, A.; Paciolla, C.; de Pinto, M.C. Chemistry, biosynthesis, and antioxidative function of glutathione in plants. In Glutathione in Plant Growth, Development, and Stress Tolerance, 1st ed.; Hossain, M.A., Mostofa, M.G., Diaz-Vivancos, P., Burritt, D.J., Fujita, M., Tran, S.L.P., Eds.; Springer Nature: Cham, Switzerland, 2017; Volume 1, pp. 1–28. [Google Scholar]
- Martin, M.N.; Slovin, J.P. Purified γ-glutamyl transpeptidases from tomato exhibit high affinity for glutathione and glutathione s-conjugates. Plant Physiol. 2000, 122, 1417–1426. [Google Scholar] [CrossRef] [PubMed] [Green Version]
- Klapheck, S. Homoglutathione: Isolation, quantification and occurrence in legumes. Physiol. Plant. 1988, 74, 727–732. [Google Scholar] [CrossRef]
- Klapheck, S.; Chrost, B.; Starke, J.; Zimmermann, H. y-Glutamylcysteinylserine—A new homologue of glutathione in plants of the family Poaceae. Bot. Acta 1992, 105, 174–179. [Google Scholar] [CrossRef]
- Wonisch, W.; Schaur, R. Chemistry of glutathione. In Significance of Glutathione to Plant Adaptation to the Environment, 1st ed.; Grill, D., Tausz, M., De Kok, L.J., Eds.; Dordrecht: Kluwer, Germany, 2001; pp. 13–26. [Google Scholar]
- Dixon, D.P.; Edwards, R. Glutathione transferases. Arab. Book 2010, 8, 1–15. [Google Scholar] [CrossRef] [Green Version]
- Foyer, C.H.; Noctor, G. Oxidant and antioxidant signaling in plants: A re-evaluation of the concept of oxidative stress in a physiological context. Plant Cell Environ. 2005, 28, 1056–1071. [Google Scholar] [CrossRef]
- Foyer, C.H.; Theodoulou, F.L.; Delrot, S. The functions of intercellular and intracellular glutathione transport systems in plants. Trends Plant Sci. 2001, 6, 486–492. [Google Scholar] [CrossRef]
- Cairns, N.G.; Pasternak, M.; Wachter, A.; Cobbett, C.S.; Meyer, A.J. Maturation of arabidopsis seeds is dependent on glutathione biosynthesis within the embryo. Plant Physiol. 2006, 141, 446–455. [Google Scholar] [CrossRef] [Green Version]
- Gulyás, Z.; Boldizsár, A.; Novák, A.; Szalai, G.; Pál, M.; Galiba, G.; Kocsy, G. Central role of the flowering repressor ZCCT2 in the redox control of freezing tolerance and the initial development of flower primordia in wheat. BMC Plant Biol. 2014, 14, 91. [Google Scholar] [CrossRef] [Green Version]
- Diaz-Vivancos, P.; Wolff, T.; Markovic, J.; Pallardó, F.V.; Foyer, C.H. A nuclear glutathione cycle within the cell cycle. Biochem. J. 2010, 431, 169–178. [Google Scholar] [CrossRef] [Green Version]
- Cummins, I.; Dixon, D.P.; Freitag-Pohl, S.; Skipsey, M.; Edwards, R. Multiple roles for plant glutathione transferases in xenobiotic detoxification. Drug Metab. Rev. 2011, 43, 266–280. [Google Scholar] [CrossRef]
- Freeman, J.L.; Persans, M.W.; Nieman, K.; Albrecht, C.; Peer, W.; Pickering, I.J.; Salt, D.E. Increased glutathione biosynthesis plays a role in nickel tolerance in Thlaspi nickel hyperaccumulators. Plant Cell 2004, 16, 2176–2191. [Google Scholar] [CrossRef] [PubMed] [Green Version]
- Foyer, C.H.; Noctor, G. Stress-Triggered redox signalling: What’s in pROSpect? Plant Cell Environ. 2016, 39, 951–964. [Google Scholar] [CrossRef] [PubMed]
- Ghanta, S.; Chattopadhyay, S. Glutathione as a signaling molecule—Another challenge to pathogens: Another challenge to pathogens. Plant Signal Behav. 2011, 6, 783–788. [Google Scholar] [CrossRef] [PubMed] [Green Version]
- Wingate, V.P.M.; Lawton, M.A.; Lamb, C.J. Glutathione causes a massive and selective induction of plant defense genes. Plant Physiol. 1988, 87, 206–210. [Google Scholar] [CrossRef] [Green Version]
- Kuźniak, E.; Skłodowska, M. Compartment-Specific role of the ascorbate-glutathione cycle in the response of tomato leaf cells to Botrytis cinerea infection. J. Exp. Bot. 2005, 56, 921–933. [Google Scholar] [CrossRef] [Green Version]
- Clemente-Moreno, M.J.; Diaz Vivancos, P.; Rubio, M.; Fernández-García, N.; Hernández, J.A. Chloroplast protection in plum pox virus-infected peach plants by L-2-oxo-4-thiazolidine-carboxylic acid treatments: Effect in the proteome. Plant Cell Environ. 2013, 36, 640–654. [Google Scholar] [CrossRef] [Green Version]
- Vanacker, H.; Foyer, C.H.; Carver, T.L.W. Changes in apoplastic antioxidants induced by powdery mildew attack in oat genotypes with race non-specific resistance. Planta 1998, 208, 444–452. [Google Scholar] [CrossRef]
- Vanacker, H.; Carver, T.L.W.; Foyer, C.H. Pathogen-induced changes in the antioxidant status of the apoplast in barley leaves. Plant Physiol. 1998, 117, 1103–1114. [Google Scholar] [CrossRef] [Green Version]
- Gonnen, M.V.; Schlösser, E. Oxidative stress in interaction between Avena sativa L. and Drechslera spp. Physiol. Mol. Plant Pathol. 1993, 42, 221–234. [Google Scholar] [CrossRef]
- Fodor, J.; Gullner, G.; Ádám, A.L.; Barna, B.; Kömives, T.; Király, Z. Local and systemic responses of antioxidants to tobacco mosaic virus infection and to salicylic acid in tobacco. Role in systemic acquired resistance. Plant Physiol. 1997, 114, 1443–1451. [Google Scholar] [CrossRef] [PubMed] [Green Version]
- Riedle-Bauer, M. Role of reactive oxygen species and antioxidant enzymes in systemic virus infections of plants. J. Phytopatol. 2000, 148, 297–302. [Google Scholar] [CrossRef]
- Chronopopulou, E.; Ataya, F.S.; Pauliou, F.; Perperopoulou, F.; Georgakis, N.; Nianiou-Obeidat, I.; Madesis, P.; Ioannou, E.; Labrou, N.E. Structure, evolution and functional roles of plant gluthatione transferases. In Glutathione in Plant Growth, Development, and Stress Tolerance, 1st ed.; Hossain, M.A., Mostofa, M.G., Diaz-Vivancos, P., Burritt, D.J., Fujita, M., Tran, S.L.P., Eds.; Springer Nature: Cham, Switzerland, 2017; Volume 1, pp. 195–213. [Google Scholar]
- Liu, Y.J.; Han, X.M.; Ren, L.L.; Yang, H.L.; Zeng, Q.Y. Functional divergence of the glutathione s-transferase supergene family in Physcomitrella patens reveals complex patterns of large gene family evolution in land plants. Plant Physiol. 2013, 161, 773–786. [Google Scholar] [CrossRef] [Green Version]
- Lallement, P.A.; Brouwer, B.; Keech, O.; Hecker, A.; Rouhier, N. The still mysterious roles of cysteine-containing glutathione transferases in plants. Front. Pharmacol. 2014, 5, 192. [Google Scholar] [CrossRef] [PubMed] [Green Version]
- Frova, C. The plant glutathione transferase gene family: Genomic structure, functions, expression and evolution. Physiol. Plant 2003, 119, 469–479. [Google Scholar] [CrossRef]
- Góngora-Castillo, E.; Ibarra-Laclette, E.; Trejo-Saavedra, D.L.; Rivera-Bustamante, R.F. Transcriptome analysis of symptomatic and recovered leaves of geminivirus-infected pepper (Capsicum annuum). Virol. J. 2012, 9, 295. [Google Scholar] [CrossRef] [Green Version]
- Sun, F.; Fang, P.; Li, J.; Du, L.; Lan, Y.; Zhou, T.; Fan, Y.; Shen, W.; Zhou, Y. RNA-seq-based digital gene expression analysis reveals modification of host defense responses by rice stripe virus during disease symptom development in Arabidopsis. Virol. J. 2016, 13, 202. [Google Scholar] [CrossRef] [Green Version]
- Li, X.; An, M.; Xia, Z.; Bai, X.; Wu, Y. Transcriptome analysis of watermelon (Citrullus lanatus) fruits in response to Cucumber green mottle mosaic virus (CGMMV) infection. Sci. Rep. 2017, 7, 16747. [Google Scholar] [CrossRef] [Green Version]
- Islam, S.; Choudhury, M.; Majlish, A.K.; Islam, T.; Ghosh, A. Comprehensive genome-wide analysis of Glutathione S-transferase gene family in potato (Solanum tuberosum L.) and their expression profiling in various anatomical tissues and perturbation conditions. Gene 2018, 639, 149–162. [Google Scholar] [CrossRef]
- Szajko, K.; Strzelczyk-Żyta, D.; Marczewski, W. Ny-1 and Ny-2 genes conferring hypersensitive response to Potato virus Y (PVY) in cultivated potatoes: Mapping and marker-assisted selection validation for PVY resistance in potato breeding. Mol. Breed. 2014, 34, 267–271. [Google Scholar] [CrossRef] [Green Version]
- Zimoch-Guzowska, E.; Yin, Z.; Chrzanowska, M.; Flis, B. Sources and effectiveness of potato PVY resistance in IHAR’s breeding research. Am. J. Potato Res. 2013, 90, 21–27. [Google Scholar] [CrossRef] [Green Version]
- The European Cultivated Potato Database. Available online: https://www.europotato.org/quick_search.php (accessed on 1 March 2022).
- Sheehan, D.; Meade, G.; Foley, V.M.; Dowd, C.A. Structure, function and evolution of glutathione transferases: Implications for classification of non-mammalian members of an ancient enzyme superfamily. Biochem. J. 2001, 15, 1–16. [Google Scholar] [CrossRef]
- Senda, K.; Ogawa, K. Induction of PR-1 accumulation accompanied by runaway cell death in the lsd1 mutant of Arabidopsis is dependent on glutathione levels but independent of the redox state of glutathione. Plant Cell Physiol. 2004, 45, 1578–1585. [Google Scholar] [CrossRef] [PubMed]
- Otulak-Kozieł, K.; Kozieł, E.; Bujarski, J.J.; Frankowska-Łukawska, J.; Torres, M.A. Respiratory burst oxidase homologs rbohd and rbohf as key modulating components of response in Turnip mosaic Virus—Arabidopsis thaliana (L.) Heyhn System. Int. J. Mol. Sci. 2020, 21, 8510. [Google Scholar] [CrossRef]
- Otulak-Kozieł, K.; Kozieł, E.; Lockhart, B.E.L.; Bujarski, J.J. The Expression of potato expansin A3 (StEXPA3) and extensin4 (StEXT4) genes with distribution of StEXPAs and HRGPs-extensin changes as an effect of cell wall rebuilding in two types of PVYNTN–Solanum tuberosum interactions. Viruses 2020, 12, 66. [Google Scholar] [CrossRef] [Green Version]
- Singh, Y.J.; Grewal, S.K.; Gill, R.K. Role of glutathione in methylglyoxal detoxification pathway during yellow mosaic virus (YMV) infection in black gram (Vigna mungo (L.) Hepper). Physiol. Mol. Plant Pathol. 2020, 111, 101513. [Google Scholar] [CrossRef]
- Hernández, J.A.; Barba, E.; Diaz-Vivancos, P. Glutathione-Mediated biotic stress tolerance. In Glutathione in Plant Growth, Development, and Stress Tolerance, 1st ed.; Hossain, M.A., Mostofa, M.G., Diaz-Vivancos, P., Burritt, D.J., Fujita, M., Tran, S.L.P., Eds.; Springer Nature: Cham, Switzerland, 2017; Volume 1, pp. 309–329. [Google Scholar]
- Hakmaoui, A.; Pérez-Bueno, M.L.; García-Fontana, B.; Camejo, D.; Jiménez, A.; Sevilla, S.; Barón, M. Analysis of the antioxidant response of Nicotiana benthamiana to infection with two strains of Pepper mild mottle virus. J. Exp. Bot. 2012, 63, 5487–5496. [Google Scholar] [CrossRef] [Green Version]
- Gullner, G.; Tobia, I.; Fodor, J.; Komives, T. Elevation of glutathione level and activation of glutathione-related enzymes affect virus infection in tobacco. Free Radic. Res. 1999, 31, 155–161. [Google Scholar] [CrossRef]
- Zechmann, B.; Zellnig, G.; Müller, M. Changes in the subcellular distribution of glutathione during virus infection in Cucurbita pepo (L.). Plant Biol. 2005, 7, 49–57. [Google Scholar] [CrossRef]
- Zechmann, B.; Zellnig, G.; Urbanek-Krajnc, A.; Müller, M. Artificial elevation of glutathione affects symptom development in ZYMV-infected Cucurbita pepo L. plants. Arch. Virol. 2007, 152, 747–762. [Google Scholar] [CrossRef]
- Király, L.; Künstler, A.; Fattinger, M.; Höller, K.; Juhász, C.; Müller, M.; Gullner, G.; Zechmann, B. Sulfate supply influences compartment specific glutathione metabolism and confers enhanced resistance to tobacco mosaic virus during a hypersensitive response. Plant Physiol. Biochem. 2012, 59, 44–54. [Google Scholar] [CrossRef] [PubMed] [Green Version]
- Han, Y.; Chaouch, S.; Mhamdi, A.; Queval, G.; Zechmann, B.; Noctor, G. Functional analysis of Arabidopsis mutants points to novel roles for glutathione in coupling H2O2 to activation of salicylic acid accumulation and signalling. Antioxid. Redox Signal. 2013, 18, 2106–2121. [Google Scholar] [CrossRef] [PubMed] [Green Version]
- Király, Z.; Barna, B.; Kecskés, A.; Fodor, J. Down-regulation of antioxidative capacity in a transgenic tobacco which fails to develop acquired resistance to necrotization caused by tobacco mosaic virus. Free Radic. Res. 2002, 36, 981–991. [Google Scholar] [CrossRef] [PubMed]
- Künstler, A.; Király, L.; Kátay, G.; Enyedi, A.J.; Gullner, G. Glutathione can compensate for salicylic acid deficiency in tobacco to maintain resistance to tobacco mosaic virus. Front. Plant Sci. 2019, 10, 1115. [Google Scholar] [CrossRef] [Green Version]
- Mateo, A.; Funck, D.; Mühlenbock, P.; Kular, B.; Mullineaux, P.M.; Karpinski, S. Controlled levels of salicylic acid are required for optimal photosynthesis and redox homeostasis. J. Exp. Bot. 2006, 57, 1795–1807. [Google Scholar] [CrossRef] [Green Version]
- Höller, K.; Király, L.; Künstler, A.; Müller, M.; Gullner, G.; Fattinger, M.; Zechmann, B. Enhanced glutathione metabolism is correlated with sulfur induced resistance in tobacco mosaic virus-infected genetically susceptible Nicotiana tabacum plants. Mol. Plant-Microbe Interact. 2010, 23, 1448–1459. [Google Scholar] [CrossRef] [Green Version]
- Zechmann, B. Subcellular roles of glutathione in mediating plant defense during biotic stress. Plants 2020, 9, 1067. [Google Scholar] [CrossRef]
- Simon, K.U.; Polanschütz, L.M.; Koffler, B.E.; Zechmann, B. High resolution imaging of temporal and spatial changes of subcellular ascorbate, glutathione and H2O2 distribution during Botrytis cinerea infection in Arabidopsis. PLoS ONE 2010, 8, e65811. [Google Scholar] [CrossRef] [Green Version]
- Wagner, S.; Van Aken, O.; Elsässer, M.; Schwarzländer, M. Mitochondrial energy signaling and its role in the low-oxygen stress response of plants. Plant Physiol. 2018, 176, 1156–1170. [Google Scholar] [CrossRef] [Green Version]
- Noctor, G.; Mhamdi, A.; Queval, G.; Foyer, C.H. Regulating the redox gatekeeper: Vacuolar sequestration puts glutathione disulfide in its place. Plant Physiol. 2013, 163, 665–671. [Google Scholar] [CrossRef] [Green Version]
- Clemente-Moreno, M.J.; Hernández, J.A.; Diaz-Vivancos, P. Sharka: How do plants respond to Plum pox virus infection? J. Exp. Bot. 2015, 66, 25–35. [Google Scholar] [CrossRef] [PubMed] [Green Version]
- Zechmann, B.; Müller, M. Effects of zucchini yellow mosaic virus infection on the subcellular distribution of glutathione and its precursors in a highly tolerant Cucurbita pepo cultivar. Botany 2008, 86, 1092–1100. [Google Scholar] [CrossRef]
- Zechmann, B.; Zellnig, G.; Müller, M. Virus-Induced Changes in the Subcellular Distribution of Glutathione Precursors in Cucurbita pepo (L.). Plant Boil. 2007, 9, 427–434. [Google Scholar] [CrossRef] [PubMed]
- Zaffagnini, M.; De Mia, M.; Morisse, S.; Di Giacinto, N.; Marchand, C.H.; Maes, A.; Lemaire, S.; Trost, P. Protein S-nitrosylation in photosynthetic organisms: A comprehensive overview with future perspectives. Biochim. Biophys. Acta Proteins Proteom. 2016, 1864, 952–966. [Google Scholar] [CrossRef] [PubMed]
- Ball, L.; Accotto, G.P.; Bechtold, U.; Creissen, G.; Funck, D.; Jiménez, A.; Kular, B.; Leyland, N.; Mejia-Carranza, J.; Reynolds, H.; et al. Evidence for a direct link between glutathione biosynthesis and stress defense gene expression in Arabidopsis. Plant Cell 2004, 16, 2448–2462. [Google Scholar] [CrossRef] [PubMed] [Green Version]
- Tolin, S.; Arrigoni, G.; Trentin, A.R.; Veljovic-Jovanovic, S.; Pivato, M.; Zechman, B.; Masi, A. Biochemical and quantitative proteomics investigations in Arabidopsis ggt1 mutant leaves reveal a role for the gamma-glutamyl cycle in plant’s adaptation to environment. Proteomics 2013, 13, 2031–2045. [Google Scholar] [CrossRef]
- Vanacker, H.; Carver, T.L.; Foyer, C.H. Early H2O2 accumulation in mesophyll cells leads to induction of glutathione during the hyper-sensitive response in the Barley-Powdery Mildew interaction. Plant Physiol. 2000, 123, 1289–1300. [Google Scholar] [CrossRef] [Green Version]
- Kalapos, B.; Juhász, C.; Balogh, E.; Kocsy, G.; Tóbiás, I.; Gullner, G. Transcriptome profiling of pepper leaves by RNA-Seq during an incompatible and a compatible pepper-tobamovirus interaction. Sci. Rep. 2021, 11, 20680. [Google Scholar] [CrossRef]
- Sappl, P.G.; Carroll, A.J.; Clifton, R.; Lister, R.; Whelan, J.; Millar, A.H.; Singh, K.B. The Arabidopsis glutathione transferase gene family displays complex stress regulation and co-silencing multiple genes results in altered metabolic sensitivity to oxidative stress. Plant J. 2009, 588, 53–68. [Google Scholar] [CrossRef]
- Kogovšek, P.; Pompe, N.; Baebler, S.; Rotter, A.; Gow, L.; Gruden, K.; Foster, G.D.; Boonham, N.; Ravnikar, M. Aggressive and mild Potato virus Y isolates trigger different specific responses in susceptible potato plants. Plant Pathol. 2010, 59, 1121–1132. [Google Scholar] [CrossRef] [Green Version]
- Ishihara, T.; Sakurai, N.; Sekine, K.T.; Hase, S.; Ikegami, M.; Shibata, D.; Takahashi, H. Comparative analysis of expressed sequence tags in resistant and susceptible ecotypes of Arabidopsis thaliana infected with cucumber mosaic virus. Plant Cell Physiol. 2004, 45, 470–480. [Google Scholar] [CrossRef] [PubMed] [Green Version]
- Brizard, J.P.; Carapito, C.; Delalande, F.; Van Dorsselaer, A.; Brugidou, C. Proteome analysis of plant-virus interactome. Comprehensive data for virus multiplication inside their hosts. Mol. Cell. Proteom. 2006, 5, 2279–2297. [Google Scholar] [CrossRef] [PubMed] [Green Version]
- Larson, R.L.; Wintermantel, W.M.; Hill, A.; Fortis, L.; Nunez, A. Proteome changes in sugar beet in response to Beet necrotic yellow vein virus. Physiol. Mol. Plant Pathol. 2008, 72, 62–72. [Google Scholar] [CrossRef]
- Gullner, G.; Komives, T.; Gáborjányi, R. Differential alterations of glutathione S-transferase enzyme activities in three sorghum varieties following viral infection. Z. Naturforsch. C. 1995, 50, 459–460. [Google Scholar] [CrossRef]
- Satoh, K.; Kondoh, H.; De Leon, T.B.; Macalalad, R.J.A.; Cabunagan, R.C.; Cabauatan, P.Q.; Mauleon, R.; Kichuchi, S.; Choi, I.R. Gene expression responses to Rice tungro spherical virus in susceptible and resistant near-isogenic rice plants. Virus Res. 2013, 171, 111–120. [Google Scholar] [CrossRef]
- Love, A.J.; Yun, B.W.; Laval, V.; Loake, G.J.; Milner, J.J. Cauliflower mosaic virus, a compatible pathogen of Arabidopsis, engages three distinct defense-signaling pathways and activates rapid systemic generation of reactive oxygen species. Plant Physiol. 2005, 139, 935–948. [Google Scholar] [CrossRef] [Green Version]
- Chen, I.H.; Chiu, M.H.; Cheng, S.F.; Hsu, Y.H.; Tsai, C.H. The glutathione transferase of Nicotiana benthamiana NbGSTU4 plays a role in regulating the early replication of Bamboo mosaic virus. New Phytol. 2013, 199, 749–757. [Google Scholar] [CrossRef] [Green Version]
- Szajko, K.; Chrzanowska, M.; Witek, K.; Strzelczyk-Żyta, D.; Zagórska, H.; Gebhart, C.; Hennig, J.; Marczewski, W. The novel gene Ny-1 on potato chromosome IX confers hypersensitive resistance to Potato virus Y and is an alternative to Ry genes in potato breeding for PVY resistance. Theor. Appl. Genes 2008, 116, 297–303. [Google Scholar] [CrossRef] [Green Version]
- Otulak, K.; Garbaczewska, G. Ultrastructural events during hypersensitive response of potato cv. Rywal infected with necrotic strains of Potato virus Y. Acta Physiol. Plant. 2010, 32, 635–644. [Google Scholar] [CrossRef]
- Kozieł, E.; Otulak-Kozieł, E.; Bujarski, J.J. Modifications in tissue and cell ultrastructure as elements of immunity-like reaction in Chenopodium quinoa against Prune Dwarf Virus (PDV). Cells 2020, 9, 148. [Google Scholar] [CrossRef] [Green Version]
- Clark, M.F.; Adams, A.N. Characteristics of the microplate method of enzyme-linked immunosorbent assay for the detection of plant viruses. J. Gen. Virol. 1977, 34, 475–483. [Google Scholar] [CrossRef] [PubMed]
- Bioreba Company Site. Available online: http://www.bioreba.ch/saas/CustomUpload/374O357O340O370O356O369O350O321O360O366O369O356O353O352O350O320O326O/Simple_ELISA_Data_Analysis.pdf (accessed on 1 March 2022).
- Abdalla, O.A.; Eraky, A.I.; Mohamed, S.A.; Fahmy, F.G. Phylogenetic Analysis of Potato virus Y (PVY) isolate from upper Egypt proves the widespread of PVY-NTN strain causing PTNRD disease in Egypt. Ann. Virol. Res. 2016, 2, 1020. [Google Scholar]
- Kozieł, E.; Surowiecki, P.; Przewodowska, A.; Bujarski, J.J.; Otulak-Kozieł, K. Modulation of Expression of PVYNTN RNA-Dependent RNA Polymerase (NIb) and Heat Shock Cognate Host Protein HSC70 in Susceptible and Hypersensitive Potato Cultivars. Vaccines 2021, 9, 1254. [Google Scholar] [CrossRef]
- Tang, X.; Zhang, N.; Si, H.; Calderón-Urrea, A. Selection and validation of reference genes for RT-qPCR analysis in potato under abiotic stress. Plant Methods 2017, 13, 85. [Google Scholar] [CrossRef]
- SpudDB Potato Genomic Resource. Available online: http://spuddb.uga.edu/ (accessed on 1 March 2022).
- Kranner, I. Determination of glutathione, glutathione disulphide and two related enzymes, glutathione reductase and glucose-6-phosphate dehydrogenase, in fungal and plant cells. In Mycorrhiza Manual, 1st ed.; Varma, A., Ed.; Springer Nature: Heidelberg, Germany, 2012; pp. 227–241. [Google Scholar]
- Islam, S.; Das Sajib, S.; Sultana Jui, Z.; Arabia, S.; Islam, T.; Ghosh, A. Genome-Wide identification of glutathione S-transferase gene family in pepper, its classification, and expression profiling under different anatomical and environmental conditions. Sci. Rep. 2019, 9, 9101. [Google Scholar] [CrossRef] [PubMed]
- Bradford, M.M. A rapid and sensitive method for the quantitation of microgram quantities of protein utilizing the principle of protein-dye binding. Annal. Biochem. 1976, 72, 248–254. [Google Scholar] [CrossRef]
- Islam, S.; Rahman, I.A.; Islam, T.; Ghosh, A. Genome-wide identification and expression analysis of GST gene family in tomato: Gaining an insight to their physiological and stress-specific roles. PLoS ONE 2017, 12, e0187504. [Google Scholar] [CrossRef] [Green Version]
- Kolb, D.; Müller, M.; Zellnig, G.; Zechmann, B. Cadmium induced changes in subcellular glutathione contents within glandular trichomes of Cucurbita pepo L. Protoplasma 2010, 243, 87–94. [Google Scholar] [CrossRef] [Green Version]
- Otulak-Kozieł, K.; Kozieł, E.; Lockhart, B.E.L. Plant cell wall dynamics in compatible and incompatible potato response to infection caused by Potato virus Y (PVYNTN). Int. J. Mol. Sci. 2018, 19, 862. [Google Scholar] [CrossRef] [Green Version]
- Luschin-Ebengreuth, N.; Zechmann, B. Compartment-specific investigations of antioxidants and hydrogen peroxide in leaves of Arabidopsis thaliana during dark-induced senescence. Acta Physiol. Plant. 2016, 38, 133. [Google Scholar] [CrossRef] [Green Version]
- Wu, Y.; Eghbali, M.; Ou, J.; Lu, R.; Toro, L.; Stefani, E. Quantitative determination of spatial protein-protein correlations in fluorescence confocal microscopy. Biophys. J. 2010, 98, 493–504. [Google Scholar] [CrossRef] [PubMed] [Green Version]
- Manders, E.M.; Stap, J.; Aten, J.A. Dynamics of three-dimensional replication patterns during the S-phase, analyzed by double labeling of DNA and confocal microscopy. J. Cell Sci. 1992, 103, 857–862. [Google Scholar] [CrossRef] [PubMed]


Publisher’s Note: MDPI stays neutral with regard to jurisdictional claims in published maps and institutional affiliations. |
© 2022 by the authors. Licensee MDPI, Basel, Switzerland. This article is an open access article distributed under the terms and conditions of the Creative Commons Attribution (CC BY) license (https://creativecommons.org/licenses/by/4.0/).
Share and Cite
Otulak-Kozieł, K.; Kozieł, E.; Przewodowski, W.; Ciacka, K.; Przewodowska, A. Glutathione Modulation in PVYNTN Susceptible and Resistant Potato Plant Interactions. Int. J. Mol. Sci. 2022, 23, 3797. https://0-doi-org.brum.beds.ac.uk/10.3390/ijms23073797
Otulak-Kozieł K, Kozieł E, Przewodowski W, Ciacka K, Przewodowska A. Glutathione Modulation in PVYNTN Susceptible and Resistant Potato Plant Interactions. International Journal of Molecular Sciences. 2022; 23(7):3797. https://0-doi-org.brum.beds.ac.uk/10.3390/ijms23073797
Chicago/Turabian StyleOtulak-Kozieł, Katarzyna, Edmund Kozieł, Włodzimierz Przewodowski, Katarzyna Ciacka, and Agnieszka Przewodowska. 2022. "Glutathione Modulation in PVYNTN Susceptible and Resistant Potato Plant Interactions" International Journal of Molecular Sciences 23, no. 7: 3797. https://0-doi-org.brum.beds.ac.uk/10.3390/ijms23073797