Article

Characterization of the Rate-Limiting Steps in the Dark-To-Light Transitions of Closed Photosystem II: Temperature Dependence and Invariance of Waiting Times during Multiple Light Reactions

1
Institute of Plant Biology, Biological Research Centre, 6726 Szeged, Hungary
2
Photosynthesis Research Center, Key Laboratory of Photobiology, Institute of Botany, Chinese Academy of Sciences, Beijing 100093, China
3
Research Institute for Interdisciplinary Science, and Graduate School of Natural Science and Technology, Okayama University, Okayama 700-8530, Japan
4
Faculty of Science, University of Ostrava, 710 00 Ostrava, Czech Republic
*
Author to whom correspondence should be addressed.
Int. J. Mol. Sci. 2023, 24(1), 94; https://0-doi-org.brum.beds.ac.uk/10.3390/ijms24010094
Submission received: 25 November 2022 / Revised: 9 December 2022 / Accepted: 17 December 2022 / Published: 21 December 2022
(This article belongs to the Special Issue Molecular Mechanisms of Natural and Artificial Photosynthesis 2.0)

Abstract

:
Rate-limiting steps in the dark-to-light transition of Photosystem II (PSII) were discovered by measuring the variable chlorophyll-a fluorescence transients elicited by single-turnover saturating flashes (STSFs). It was shown that in diuron-treated samples: (i) the first STSF, despite fully reducing the QA quinone acceptor molecule, generated only an F1(<Fm) fluorescence level; (ii) to produce the maximum (Fm) level, additional excitations were required, which, however, (iii) were effective only with sufficiently long Δτ waiting times between consecutive STSFs. Detailed studies revealed the gradual formation of the light-adapted charge-separated state, PSIIL. The data presented here substantiate this assignment: (i) the Δτ1/2 half-increment rise (or half-waiting) times of the diuron-treated isolated PSII core complexes (CCs) of Thermostichus vulcanus and spinach thylakoid membranes displayed similar temperature dependences between 5 and –80 °C, with substantially increased values at low temperatures; (ii) the Δτ1/2 values in PSII CC were essentially invariant on the Fk−to-Fk+1 (k = 1–4) increments both at 5 and at −80 °C, indicating the involvement of the same physical mechanism during the light-adaptation process of PSIIL. These data are in harmony with the earlier proposed role of dielectric relaxation processes in the formation of the light-adapted charge-separated state and in the variable chlorophyll-a fluorescence of PSII.

1. Introduction

In this paper we investigate special properties of the recently discovered rate-limiting steps in Photosystem II (PSII) [1,2]. PSII is a multi-subunit pigment-protein complex embedded in the thylakoid membranes (TMs) of plants, algae, and cyanobacteria. It uses light energy to catalyze the electron transfer from water to plastoquinone and supplies the reducing equivalents necessary to fix CO2. PSII is probably the most-studied light-induced enzyme, not only for its relevance to biochemistry, being the only water-splitting and O2-producing enzyme, but also because it serves as a source of inspiration for artificial photocatalysis to produce H2.
The structure and the primary photophysical and photochemical functions of PSII are well known [3,4,5,6]. The core complex (CC) of PSII contains the reaction center (RC) incorporated in the D1/D2 proteins, the α and β subunits of cytochrome b559, two integral antenna proteins, CP43 and CP47, and the oxygen-evolving complex (OEC) [7]. The trapping of light energy and its transformation into electrochemical free energy occurs within the RC complex [8]. In open-state PSII (PSIIO), upon illumination, a P680+/Pheo radical pair is formed during the primary photochemical reaction, in several picoseconds due to the electron transfer from the primary electron donor P680 to pheophytin (Pheo). Subsequent electron transfer steps – from Pheo to QA, the first quinone electron acceptor, and from the tyrosine residue (YZ) on the D1 protein to P680+, followed by the oxidation of the Mn4CaO5 cluster, leading to S2 state of the OEC – stabilize the charge separated state. PSII with all QA reduced is considered the closed state of PSII (PSIIC).
The generation of the stable charge separation in PSII is followed by somewhat slower electron and proton transfer reactions at the acceptor and donor sides, between QA and QB, the primary and secondary quinone acceptors, and in the OEC, respectively. In TMs, the linear electron-transport chain, via the cytochrome b6f complex and PSI, supply electrons to the terminal electron acceptor CO2. Evidently, the continual operation of the electron transport requires the repeated generation of charge separation in PSII, which can occur only after re-opening the RC. The re-opening time of the PSII RC is determined by the rates of the secondary electron transfer reactions, which occur on timescales between a hundred microseconds and a millisecond [9,10]. Additional limitations in the operation of the PSII electron transfer reactions, and thus in the re-opening time of the RC, are imposed by the relatively slow (5–10 ms) charge transfer reactions of the cytochrome b6f complex [11]. Because of this rate-limiting step in the electron-transport system, under continuous illumination, PSII RC may be found with a high probability in a closed state, especially at high light intensities. The effective turnover time of the electron-transport system might be further increased under inorganic carbon limiting conditions, which can hinder the operation of the photosynthetic electron transport [12,13]. For this reason, the effect of illumination on PSIIC is of substantial interest.
In recent years, our understanding of the light-induced structural dynamics of PSII advanced substantially. It is now well established that the secondary electron and proton transfer events are associated with well-discernible reorganizations both on the donor and the acceptor sides. Time-resolved serial femtosecond crystallography experiments using X-ray free electron lasers revealed structural changes in PSII CC of Thermostichus (Thermosynecococcus) (T.) vulcanus—around the QB/non-heme iron and the Mn4CaO5 cluster [14,15,16]. Light-induced reorganizations around the QB pocket have also been shown to occur in purple-bacterial reaction centers (bRCs) [17,18,19]. The crystal structure of PSII RC shows large similarities to bRC, its purple-bacterial ancestor [20,21,22,23].
In our recent work [2], using FTIR spectroscopy to monitor the kinetics of charge-recombination S2(+)QA → S1QA in T. vulcanus PSII CC, we observed a three-fold increase in the lifetime of PSIIC upon exposing them to a train of 20 single-turnover saturating flashes (STSFs); PSIIC was generated by the first STSF of the train. The stabilization of the charge-separated state was attributed to the gradual formation of PSIIL, the charge-separated light-adapted state of PSII. Similar, but much more pronounced stabilizations of the charge-separated state were observed earlier in bRCs upon continuous illumination of the RC complexes [24,25,26]. These transitions, which were reminiscent of the Kleinfeld effect [27], were ascribed to conformational memory of bRC proteins and the formation of their light-adapted charge-separated state [28,29,30,31,32].
We also recorded variable chlorophyll-a (Chl-a) fluorescence transients (Fv) elicited by trains of STSFs on diuron-treated isolated plant TMs and PSII CC of T. vulcanus. (Fv = FmFo, where Fm and Fo are the maximum and the minimum fluorescence levels, respectively; Fo is associated with PSIIO; diuron, DCMU, and 3-(3,4-dichlorophenyl)-1,1-dimethylurea inhibits the inter-quinone electron transfer in PSII and allows only one stable charge separation. In accordance with Joliot and Joliot [33], we found that the fluorescence yield after the first STSF, which leads to the reduction of QA, produces only an intermediate F1 level, and additional STSFs were required to reach the maximum fluorescence level (Fm). We also found, however, a peculiar feature of these transients of Fv: to induce sizeable increments from the F1 level to the F2 level, relatively long Δτ waiting times must be allowed between STSFs, revealing rate limitations in this process [1]. It is to be emphasized that the second and consecutive flashes, which induce the F1-to-F2, F2-to-F3 etc. fluorescence increments, do not generate any further stable charge separation, i.e., PSIIC is generated by the first STSF, which produces the F1(<Fm) fluorescence level [1,2,33,34,35]. It has also been clarified that the rate limitations do not arise from gating of the primary photochemistry: in DCMU-treated PSII CC of T. vulcanus, additional excitations, after the generation of the stable charge separation by the first STSF, produce only rapidly recombining P680+Pheo radical pairs, with recombination rates orders of magnitude faster than the Δτ1/2 half-waiting times [36]. Based on these features and the strong similarity of the light-adapted states in bRC and in PSII, we adopted the explanation offered for the light-induced stabilization of the charge-separated state of bRC [37,38]. Accordingly, the light-induced formation of PSIIL was proposed to be associated with conformational changes and dielectric relaxation processes, possibly combined with the effects of local heat packages [1,2].
To understand the nature and physical mechanisms of these waiting-time-related processes, and thus also the origin of Fv, which carries important information on the functional activity and structural dynamics of PSII [39,40,41], systematic investigations are required. We have already examined the effect of the lipidic environment of PSII and revealed the shortening of Δτ1/2, from ~1 ms to ~0.2 ms, upon the addition of plant TM lipids to isolated T. vulcanus PSII CC; Δτ1/2 values in intact T. vulcanus cells were comparable to those in plant TMs [42]. These data have shown that the processes underlying the light-induced transition of PSIIC to PSIIL depend significantly on the lipid content of the RC matrix. In general, these data also suggest the role of physicochemical factors in the RC complexes. Here, we studied the temperature dependence of the Δτ1/2 half-waiting times in isolated PSII CC of T. vulcanus and in spinach TMs. We also tested the possible dependence of Δτ1/2 on the number of STSFs applied. We found that: (i) although the Δτ1/2 values in PSII CC are considerably larger than in TMs, their temperature dependences follow a very similar pattern, with substantially increased Δτ1/2 values at low temperatures; and (ii) Δτ1/2 appeared to be essentially invariant on the Fk-to-Fk+1 fluorescence increments (k = 1–4), indicating the involvement of the same process during the light-adaptation of closed PSII RC.

2. Results and Discussion

To characterize the gradual light-induced formation of the charge-separated light-adapted state (PSIIL) from its closed state (PSIIC) and to gain information on the underlying physical mechanism, we investigated the STSF-induced Chl-a fluorescence increments in isolated PSII CC of T. vulcanus and spinach TMs in the presence of DCMU, which keeps the reaction centers in closed state, being capable of accepting only one electron. Under our experimental conditions, in the temporal interval of interest, the PSIIC-to-PSIIO via charge recombination can be neglected.

2.1. Temperature Dependence of the Variable Chl-a Fluorescence (Fv) Induced by STSFs

Upon the excitation of DCMU-treated dark-adapted PSII containing samples—PSII CC of T. vulcanus and spinach TMs—by trains of STSFs stepwise increments of the Fv Chl-a fluorescence rise were observed (Figure 1), in accordance with our earlier data [1,2]. It is also shown that both the F1 level and the number of STSFs required to reach Fm depended strongly on the temperature: the F1 levels gradually decreased while the required number of STSFs gradually increased upon the stepwise decrease in the temperature. With reasonable agreement with our earlier observations [1], the F1 level in PSII CC at −80 °C did not exceed 25–30% of Fm; at 80 K, this value was <15% [2]. In TMs, the decrease in the F1 level at low temperatures was less marked (at −80 °C ~60% of Fm), but still well discernible. Similar differences between the two samples were seen in the number of STSFs to reach Fm. These differences might originate from variances in the molecular composition between our cyanobacterial and plant PSII samples with different rigidities. In general, proteins from thermophilic organisms possess higher dynamical stiffness than from mesophilic organisms [43]. This might explain the lower conformational adaptation of our PSII CC when compared to TMs obtained from the thermophilic T. vulcanus cells and the mesophilic spinach leaves.

2.2. Temperature Dependence of Δτ1/2

Figure 2 illustrates the peculiar feature of the F1-to-F2 fluorescence increments in dark-adapted DCMU-treated T. vulcanus PSII CC at −80 °C. It shows a strong dependence of the magnitude of the fluorescence increment on the Δτ waiting time between the first and the second STSF. This phenomenon has already been demonstrated on T. vulcanus PSII CC, whole cyanobacterial cells, spinach TMs [1], and in samples with different lipid compositions [42]. As discussed above, in the presence of DCMU, after the first STSF QA is reduced, and the second STSF induces no further stable charge separation. Nevertheless, after a sufficiently long Δτ dark waiting time the fluorescence level elicited by the second STSF increases (Figure 2). While these data are similar to those reported earlier on PSII CC at room temperature [36], they reveal strikingly longer Δτ1/2 values at −80 °C. This prompted us to investigate the temperature dependences of Δτ1/2 in T. vulcanus PSII CC and spinach TMs.
To determine the temperature dependence of ∆τ1/2 half-waiting times between the first and the second STSFs, we investigated the double-STSF induced transients on DCMU-treated PSII CCs of T. vulcanus and spinach TMs at distinct temperatures between 23 and −80 °C, with a broad range of ∆τ waiting times between the two STSFs. Note that in Figure 3, we mark the increment induced by the second-STSF as F1,2, irrespective of whether or not the F1 and F2 fluorescence levels were resolved at the applied time resolution of the fluorimeter (cf. Figure 2). The half-rise (or half-waiting) times (∆τ1/2) of the F1-to-F2 increments were obtained from a logistic-function fit of the dependence of the fluorescence increments on ∆τ (Figure 3). Table 1, in addition to the ∆τ1/2 values, contains data on the P parameters (steepness) of the logistic functions, as well as on the Fv/Fm parameters, which characterize the photochemical activity and structural dynamics of PSII [2]. The Fv/Fm values in PSII CC were very similar to those obtained in our earlier studies [2,36]; in TMs, they were somewhat lower than usual, also in the intact leaves used. Nevertheless, the ∆τ1/2 values at room temperature were very similar in all the TM preparations with similar or higher Fv/Fm values [42].
The effect of rate-limitation can clearly be seen in both samples and at all temperatures. In PSII CC the ∆τ1/2 of ~1.2 ms at room temperature (RT) was comparable to those determined in our earlier studies under similar experimental conditions [42]; the same is true for the ∆τ1/2 (0.2 ms) of TM [42]. Despite the relatively large error bars, due to the small increments and the error of the fits, it is clear that the ∆τ1/2 values are significantly larger at low temperatures both in PSII CC and TMs (Figure 3); this increase in the half-waiting times is 3–5 fold in the two samples (Table 1). These data strongly suggest the involvement of the same process, despite the different values at non-cryogenic temperatures (Table 1). An interesting feature of these ∆τ dependent increments are that, as also reflected by increased P values, the rise appeared to be steeper at −80 °C in PSII CC and at −60 and −80 °C in TM than at higher temperatures. The origin of this difference is unclear; it might be correlated with the fact that the increments at low temperatures originate from different phases of Fv and may contain different elements of the structural dynamics of PSII.
For an easier comparison of the patterns of the changes of Δτ1/2 at different temperatures in PSII CC and TMs, we plotted the temperature dependences of the two samples on different scales (Figure 4). These data show that the variations of Δτ1/2, despite the substantial differences at all temperatures, follow essentially the same pattern—suggesting the involvement of identical or very similar physical mechanism(s). An interesting observation is that both curves appear to possess a “breakpoint”, which can be discerned at −20 °C for PSII CC and −40 °C for TMs. The presence of these breakpoints is proposed to originate from protein phase transitions. To support this hypothesis we invoke the works of Garbers and coworkers, who, by using Mössbauer spectroscopy at cryogenic temperatures on PSII-enriched membranes, observed “the onset of fluctuations between conformational substates of the protein matrix at around 230 K” [44]. Furthermore, Pieper and coworkers, by using neutron scattering, found a “softening” of the protein matrix in the temperature range above 240 K [45,46]. The difference between the breakpoints in PSII CC and TMs can be attributed to their different growth temperatures, which, as pointed out above, might determine the conformational rigidity of the sample.
It is also worth pointing out that the mobility of protein residues might modulate the temperature dependence of the Δτ1/2 half-waiting times. It was shown in hydrated proteins that dielectric relaxation processes occur with different lifetimes and dominance at different temperature intervals [47]. In addition to the roles of protein residues the mobility of different water molecules in the RC matrix [41,48], either on the acceptor side [49] or the donor side [50] of the RC, might also contribute to the temperature-dependent variations of Δτ1/2.

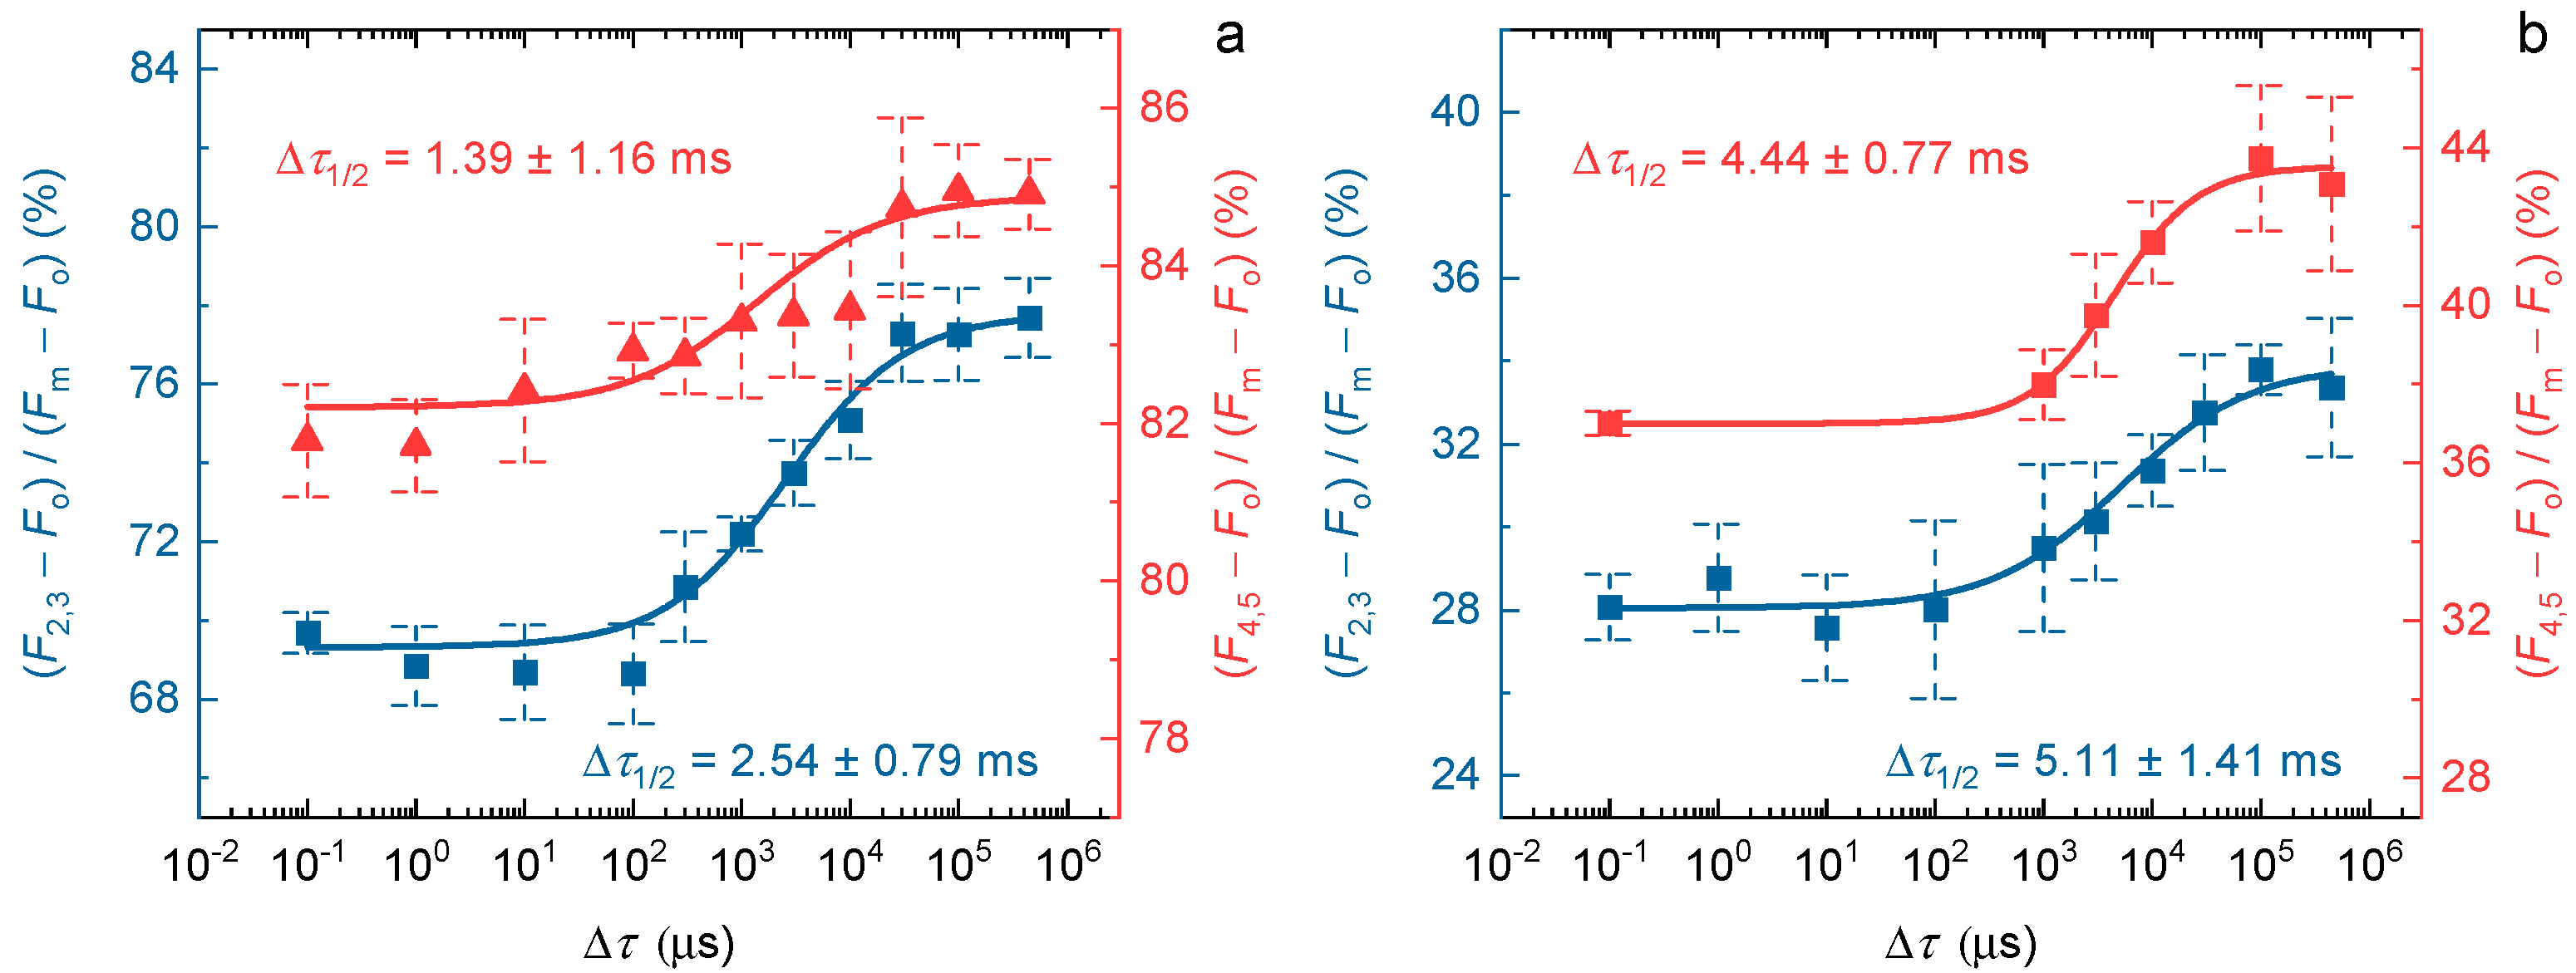
2.3. Temperature Dependence of Δτ1/2 during Multiple Light Reactions

In our earlier work, we have shown that the rate-limiting step was present not only in the F1-to-F2 fluorescence increment but also between later steps [1]. However, it was not clarified whether or not the ∆τ1/2 half-waiting times depend on the number of flashes during the train of STSFs. To answer this question, we determined the ∆τ1/2 values in PSII CC for the F2-to-F3 and the F4-to-F5 increments at 5 and −80 °C (Figure 5). As shown by these measurements, only minor variations of Δτ1/2 can be seen. At 5 °C the half-rise time of the waiting time was ~2.5 ms after the second flash and ~1.4 ms after the fourth flash (for comparison, Δτ1/2 after the first flash was ~1.8 ms). At −80 °C Δτ1/2 values for the F2-to-F3 and F4-to-F5 increased to ~5.1 ms and ~4.4 ms, respectively; for F1-to-F2 Δτ1/2 was ~4 ms. One can notice that the standard deviation of the data points of later steps are higher, which is the consequence of the gradually smaller increments after each flash, thus hampering the determination of the precise fluorescence levels. Nevertheless, it can be safely concluded that the half-waiting times do not differ significantly along the grades of Fv, suggesting the involvement of the same physical mechanism.

3. Materials and Methods

3.1. Growth Conditions

A thermophilic cyanobacterial strain, Thermostichus (Thermosynechococcus) vulcanus, isolated from a hot spring in Yunomine, Japan [51] was grown photoautotrophically in BG11 medium (pH 7.0) as a batch culture. Cells were grown at 50 °C under continuous illumination with a white fluorescent lamp at a photon flux density of 50–100 µmol photons m−2 s−1 [52], and aerated on a gyratory shaker operating at 100 rpm.

3.2. Sample Preparation

TMs were isolated from fresh market spinach (Spinacia oleracea) leaves essentially as described earlier [53], with minor modifications. Briefly, deveined leaves were homogenized in 50 mM Tricine (pH 7.5), 400 mM sorbitol, 5 mM KCl, and 2 mM MgCl2., and then filtered through a nylon mesh, the resulting supernatant was centrifuged then for 7 min at 6000× g. The pellet was resuspended in 50 mM Tricine (pH 7.5), 5 mM KCl, and 5 mM MgCl2, followed by the immediate addition of a buffer containing 50 mM Tricine (pH 7.5), 800 mM sorbitol, 5 mM KCl, and 2 mM MgCl2 before centrifugation for 7 min at 6000× g. The pellet was finally resuspended in 50 mM Tricine (pH 7.5), 400 mM sorbitol, 5 mM KCl, and 2 mM MgCl2 and stored in liquid nitrogen at a Chl concentration of 2–3 mg mL−1, until use.
PSII CCs of T. vulcanus were isolated as described earlier [54,55,56] and were diluted in a reaction buffer containing 5% glycerol, 20 mM MES (pH 6.0), 20 mM NaCl, and 3 mM CaCl2.

3.3. Chl-a Relative Fluorescence Yield Measurements

Relative fluorescence yields were measured using a PAM-101 (Pulse Amplitude Modulation) fluorometer and a Multi-Color (MC) PAM (Walz, Effeltrich, Germany). Fluorescence increments of the samples were induced by STSFs (Xe flashes, Excelitas LS-1130-3 Flashpac with FX-1163 Flashtube with reflector, Wiesbaden, Germany) of 1.5-µs duration at half-peak intensity. When using trains of STSFs, the flashes were applied 500 ms apart. The frequency of the modulated measuring light (low intensity and nonactinic) was 1.6 kHz in the case of PAM-101, while in the case of the MC-PAM it was 1 kHz. To improve the accuracy of the determination of the STSF-induced increments of the fluorescence levels, we increased the signal-to-noise of the measurement by switching the frequency of the measuring light to 100 kHz 10 ms before the flash, for 50 ms with PAM-101, and 2 ms before the flash, for 20 ms with MC-PAM. With this limitation, the actinic effect of the 100 kHz measuring beam, causing a slow rise of the fluorescence level, remained smaller than 5% for the detected intensities; this was corrected by extrapolating the fluorescence level to t = 0 of firing the STSF. The time resolutions applied were ~20 ms and ~0.13 ms, respectively, for PAM-101 and MC-PAM. With these settings, we determined the quasi steady-state fluorescence levels, and did not record the fast-rising components of the variable fluorescence (cf. [57]).
The sample was placed on the sample holder of a thermoluminescence apparatus in order to control the temperature. The timing of the flashes was controlled using a home-designed programmable digital pulse generator. In the case of the PAM-101, the kinetic traces were recorded using a National Instrument data acquisition device (DAQ 6001, Austin, TX, USA) via a custom-designed LabVIEW software; in case of MC-PAM, the program’s own software was used.
For Chl-a fluorescence transient measurements, the Chl concentration of the TMs were diluted to ~20 µg mL−1 in the resuspension buffer, and that of the PSII CC to ~5 µg mL−1 when performing double- or multiple-STSFs with variable time intervals between flashes, and to ~20 µg mL−1 when measuring STSF-induced fluorescence steps. DCMU was dissolved in dimethyl sulfoxide and added to all samples immediately before the fluorescence measurements at a final concentration of 40 µM (the final dimethyl sulfoxide concentration did not exceed 1%). Before the measurements, the samples were dark adapted for 5 min at room temperature, then cooled to the required temperature and were then temperature adapted for 5 more min.

4. Conclusions

The major goal of this study was to provide data to aid the better understanding of the mechanism(s) underlying the gradual formation of the light-adapted state (PSIIL) from the charge-separated (closed) state (PSIIC). As pointed out in the Introduction, this is a physiologically important process: (i) because PSIIC can often receive excitations, and (ii) because the PSIIC-to-PSIIL leads to the stabilization of the charge-separated state; further (iii) as suggested by earlier studies, both in PSII and bRC, the process of light adaptation reflects subtle reorganizations, structural dynamics, and conformational memory in Type II RC matrices [35,41].
Here, we investigated the key features of the variable Chl-a fluorescence (Fv) induced by trains of STSFs in DCMU-treated isolated PSII CC of T. vulcanus and spinach TMs. In particular, we were interested in the basic peculiar characteristics of Fv, its dependence on the waiting times (Δτ) between excitations; to obtain significant magnitudes of consecutive STSF-induced fluorescence increments along Fv, sufficiently long Δτ values are required [1]. Earlier studies have shown that the Δτ1/2 half-waiting times (where the F1-to-F2 fluorescence increment reaches 50% of its maximum) depend on the lipidic environment of the RC matrix [42]—suggesting determining roles of physicochemical factors in Δτ1/2.
Here, we show (i) that the Δτ1/2 values in PSII CC and spinach TMs display a similar pattern of temperature dependences between 5 and −80 °C, with increased values at low temperatures; and (ii) that the Δτ1/2 values in PSII CC are essentially invariant on k (k = 1–4), denoting the Fk-to-Fk+1 increments, both at 5 and at −80 °C. These data strongly suggest that the underlying physical mechanisms are essentially the same during these processes. In line with earlier conclusions [2,38], we propose that the formation of the light-adapted charge-separated states in bRC and PSII depend largely on dielectric relaxation processes. The protein matrix of PSII seems to reach the optimal dielectric environment gradually by additional excitations, a process that is significantly hindered at low temperatures. Recent studies have shown the involvement of a network of hydrogen bonds around some protein residues and bound water molecules in bRC [58]; bound-water containing domains on the donor side of PSII RC might play critical roles in the dielectric relaxation processes, and thus also in the variable Chl-a fluorescence [41].

Author Contributions

Conceptualization, M.M. and G.G.; methodology, M.M. and G.S.; software, G.S.; validation, M.M.; formal analysis, M.M.; investigation, M.M.; resources, M.M., W.H. and X.L.; data curation, M.M. and G.S.; writing—original draft preparation, M.M., G.G. and G.S.; writing—review and editing, P.H.L., J.-R.S. and G.H.; visualization, M.M. and G.S.; supervision, G.G.; Project Administration, G.G. and M.M.; Funding Acquisition, G.G., G.S., P.H.L. and J.-R.S. All authors have read and agreed to the published version of the manuscript.

Funding

The authors acknowledge the support from the Hungarian Ministry of Innovation and Technology, National Research, Development and Innovation Fund (OTKA grants K-128679 to G.G.; PD-138498 to G.S.). P.H.L. used support from the grant 2018-1.2.1-NKP-2018-00009. G.G. also acknowledges the support from the Czech Science Foundation (GA ČR 19-13637S), and the Eötvös Loránd Research Network (ELKH KÖ-36/2021). Studies in the Chinese group are supported from a National Key R&D Program of China (2022YFA0911900, 2022YFC1803400), CAS Project for Young Scientists in Basic Research (YSBR-004), a Strategic Priority Research Program of the Chinese Academy of Sciences (XDA26050402) and a National Natural Science Foundation of China (31470339).

Institutional Review Board Statement

Not applicable.

Informed Consent Statement

Not applicable.

Data Availability Statement

All data supporting the findings of this study are available from the corresponding author upon request.

Conflicts of Interest

The authors declare that they have no conflict of interest.

References

  1. Magyar, M.; Sipka, G.; Kovacs, L.; Ughy, B.; Zhu, Q.J.; Han, G.Y.; Spunda, V.; Lambrev, P.H.; Shen, J.R.; Garab, G. Rate-limiting steps in the dark-to-light transition of Photosystem II—Revealed by chlorophyll-a fluorescence induction. Sci. Rep. 2018, 8, 2755. [Google Scholar] [CrossRef] [PubMed] [Green Version]
  2. Sipka, G.; Magyar, M.; Mezzetti, A.; Akhtar, P.; Zhu, Q.; Xiao, Y.; Han, G.; Santabarbara, S.; Shen, J.-R.; Lambrev, P.H.; et al. Light-Adapted Charge-Separated State of Photosystem II: Structural and Functional Dynamics of the Closed Reaction Center. Plant Cell 2021, 33, 1286–1302. [Google Scholar] [CrossRef] [PubMed]
  3. Nelson, N.; Yocum, C.F. Structure and function of photosystems I and II. Annu. Rev. Plant Biol. 2006, 57, 521–565. [Google Scholar] [CrossRef] [Green Version]
  4. Romero, E.; Novoderezhkin, V.I.; van Grondelle, R. Quantum design of photosynthesis for bio-inspired solar-energy conversion. Nature 2017, 543, 355–365. [Google Scholar] [CrossRef] [PubMed]
  5. Blankenship, R.E. Molecular Mechanisms of Photosynthesis; Wiley: New York, NY, USA, 2021. [Google Scholar]
  6. Shen, J.R. The Structure of Photosystem II and the Mechanism of Water Oxidation in Photosynthesis. Annu. Rev. Plant Biol. 2015, 66, 23–48. [Google Scholar] [CrossRef] [Green Version]
  7. Umena, Y.; Kawakami, K.; Shen, J.R.; Kamiya, N. Crystal structure of oxygen-evolving photosystem II at a resolution of 1.9 angstrom. Nature 2011, 473, 55–60. [Google Scholar] [CrossRef]
  8. Cardona, T.; Sedoud, A.; Cox, N.; Rutherford, A.W. Charge separation in Photosystem II: A comparative and evolutionary overview. BBA-Bioenerg. 2012, 1817, 26–43. [Google Scholar] [CrossRef] [Green Version]
  9. Shlyk-Kerner, O.; Samish, I.; Kaftan, D.; Holland, N.; Sai, P.S.M.; Kless, H.; Scherz, A. Protein flexibility acclimatizes photosynthetic energy conversion to the ambient temperature. Nature 2006, 442, 827–830. [Google Scholar] [CrossRef]
  10. Lubitz, W.; Chrysina, M.; Cox, N. Water oxidation in photosystem II. Photosynth. Res. 2019, 142, 105–125. [Google Scholar] [CrossRef] [Green Version]
  11. Hasan, S.S.; Cramer, W.A. On rate limitations of electron transfer in the photosynthetic cytochrome b6f complex. Phys. Chem. Chem. Phys. 2012, 14, 13853–13860. [Google Scholar] [CrossRef]
  12. Holland, S.C.; Kappell, A.D.; Burnap, R.L. Redox changes accompanying inorganic carbon limitation in Synechocystis sp PCC 6803. BBA-Bioenerg. 2015, 1847, 355–363. [Google Scholar] [CrossRef] [PubMed] [Green Version]
  13. Zavrel, T.; Szabo, M.; Tamburic, B.; Evenhuis, C.; Kuzhiumparambil, U.; Literakova, P.; Larkum, A.W.D.; Raven, J.A.; Cerveny, J.; Ralph, P.J. Effect of carbon limitation on photosynthetic electron transport in Nannochloropsis oculata. J. Photoch. Photobio. B 2018, 181, 31–43. [Google Scholar] [CrossRef] [PubMed] [Green Version]
  14. Suga, M.; Akita, F.; Sugahara, M.; Kubo, M.; Nakajima, Y.; Nakane, T.; Yamashita, K.; Umena, Y.; Nakabayashi, M.; Yamane, T.; et al. Light-induced structural changes and the site of O=O bond formation in PSII caught by XFEL. Nature 2017, 543, 131–135. [Google Scholar] [CrossRef] [PubMed] [Green Version]
  15. Suga, M.; Akita, F.; Yamashita, K.; Nakajima, Y.; Ueno, G.; Li, H.; Yamane, T.; Hirata, K.; Umena, Y.; Yonekura, S.; et al. An oxyl/oxo mechanism for oxygen-oxygen coupling in PSII revealed by an x-ray free-electron laser. Science 2019, 366, 334–338. [Google Scholar] [CrossRef] [PubMed] [Green Version]
  16. Kern, J.; Chatterjee, R.; Young, I.D.; Fuller, F.D.; Lassalle, L.; Ibrahim, M.; Gul, S.; Fransson, T.; Brewster, A.S.; Alonso-Mori, R.; et al. Structures of the intermediates of Kok’s photosynthetic water oxidation clock. Nature 2018, 563, 421–425. [Google Scholar] [CrossRef]
  17. Stowell, M.H.; McPhillips, T.M.; Rees, D.C.; Soltis, S.M.; Abresch, E.; Feher, G. Light-induced structural changes in photosynthetic reaction center: Implications for mechanism of electron-proton transfer. Science 1997, 276, 812–816. [Google Scholar] [CrossRef] [Green Version]
  18. Sugo, Y.; Saito, K.; Ishikita, H. Mechanism of the formation of proton transfer pathways in photosynthetic reaction centers. Proc. Natl. Acad. Sci. USA 2021, 118, e2103203118. [Google Scholar] [CrossRef]
  19. Wei, R.J.; Zhang, Y.; Mao, J.; Kaur, D.; Khaniya, U.; Gunner, M.R. Comparison of proton transfer paths to the Q(A) and Q(B) sites of the Rb. sphaeroides photosynthetic reaction centers. Photosynth. Res. 2022, 152, 153–165. [Google Scholar] [CrossRef]
  20. Michel, H.; Deisenhofer, J. Relevance of the Photosynthetic Reaction Center from Purple Bacteria to the Structure of Photosystem-II. Biochemistry 1988, 27, 1–7. [Google Scholar] [CrossRef]
  21. Heathcote, P.; Fyfe, P.K.; Jones, M.R. Reaction centres: The structure and evolution of biological solar power. Trends Biochem. Sci. 2002, 27, 79–87. [Google Scholar] [CrossRef]
  22. Krammer, E.M.; Sebban, P.; Ullmann, G.M. Profile Hidden Markov Models for Analyzing Similarities and Dissimilarities in the Bacterial Reaction Center and Photosystem II. Biochemistry 2009, 48, 1230–1243. [Google Scholar] [CrossRef] [PubMed]
  23. Cardona, T. Photosystem II is a Chimera of Reaction Centers. J. Mol. Evol. 2017, 84, 149–151. [Google Scholar] [CrossRef] [PubMed] [Green Version]
  24. Van Mourik, F.; Frese, R.N.; van der Zwan, G.; Cogdell, R.J.; van Grondelle, R. Direct observation of solvation dynamics and dielectric relaxation in the photosynthetic light-harvesting-2 complex of Rhodopseudomonas acidophila. J. Phys. Chem. B 2003, 107, 2156–2161. [Google Scholar] [CrossRef]
  25. Deshmukh, S.S.; Tang, K.; Kalman, L. Lipid binding to the carotenoid binding site in photosynthetic reaction centers. J. Am. Chem. Soc. 2011, 133, 16309–16316. [Google Scholar] [CrossRef]
  26. Deshmukh, S.S.; Williams, J.C.; Allen, J.P.; Kalman, L. Light-induced conformational changes in photosynthetic reaction centers: Dielectric relaxation in the vicinity of the dimer. Biochemistry 2011, 50, 340–348. [Google Scholar] [CrossRef] [PubMed]
  27. Kleinfeld, D.; Okamura, M.Y.; Feher, G. Electron-Transfer Kinetics in Photosynthetic Reaction Centers Cooled to Cryogenic Temperatures in the Charge-Separated State—Evidence for Light-Induced Structural-Changes. Biochemistry 1984, 23, 5780–5786. [Google Scholar] [CrossRef] [PubMed]
  28. Abgaryan, G.A.; Christophorov, L.N.; Goushcha, A.O.; Holzwarth, A.R.; Kharkyanen, V.N.; Knox, P.P.; Lukashev, E.A. Effects of mutual influence of photoinduced electron transitions and slow structural rearrangements in bacterial photosynthetic reaction centers. J. Biol. Phys. 1998, 24, 1–17. [Google Scholar] [CrossRef]
  29. Goushcha, A.O.; Kharkyanen, V.N.; Scott, G.W.; Holzwarth, A.R. Self-regulation phenomena in bacterial reaction centers. I. General theory. Biophys. J. 2000, 79, 1237–1252. [Google Scholar] [CrossRef] [Green Version]
  30. Barabash, Y.M.; Berezetskaya, N.M.; Christophorov, L.N.; Goushcha, A.O.; Kharkyanen, V.N. Effects of structural memory in protein reactions. J. Chem. Phys. 2002, 116, 4339–4352. [Google Scholar] [CrossRef]
  31. Christophorov, L.; Holzwarth, A.; Kharkyanen, V. Conformational regulation in single molecule reactions. Ukr. J. Phys. 2003, 48, 672–680. [Google Scholar]
  32. Goushcha, A.O.; Manzo, A.J.; Scott, G.W.; Christophorov, L.N.; Knox, P.P.; Barabash, Y.M.; Kapoustina, M.T.; Berezetska, N.M.; Kharkyanen, V.N. Self-regulation phenomena applied to bacterial reaction centers 2. Nonequilibrium adiabatic potential: Dark and light conformations revisited. Biophys. J. 2003, 84, 1146–1160. [Google Scholar] [CrossRef] [PubMed]
  33. Joliot, P.; Joliot, A. Comparative-Study of the Fluorescence Yield and of the C550 Absorption Change at Room-Temperature. Biochim. Biophys. Acta 1979, 546, 93–105. [Google Scholar] [CrossRef] [PubMed]
  34. Laisk, A.; Oja, V. Variable fluorescence of closed photochemical reaction centers. Photosynth. Res. 2020, 143, 335–346. [Google Scholar] [CrossRef] [PubMed]
  35. Oja, V.; Laisk, A. Time- and reduction-dependent rise of photosystem II fluorescence during microseconds-long inductions in leaves. Photosynth. Res. 2020, 145, 209–225. [Google Scholar] [CrossRef] [PubMed]
  36. Sipka, G.; Muller, P.; Brettel, K.; Magyar, M.; Kovacs, L.; Zhu, Q.J.; Xiao, Y.A.; Han, G.Y.; Lambrev, P.H.; Shen, J.R.; et al. Redox transients of P680 associated with the incremental chlorophyll-a fluorescence yield rises elicited by a series of saturating flashes in diuron-treated photosystem II core complex of Thermosynechococcus vulcanus. Physiol. Plant. 2019, 166, 22–32. [Google Scholar] [CrossRef]
  37. Andreasson, U.; Andreasson, L.E. Characterization of a semi-stable, charge-separated state in reaction centers from Rhodobacter sphaeroides. Photosynth. Res. 2003, 75, 223–233. [Google Scholar] [CrossRef] [PubMed]
  38. Malferrari, M.; Mezzetti, A.; Francia, F.; Venturoli, G. Effects of dehydration on light-induced conformational changes in bacterial photosynthetic reaction centers probed by optical and differential FTIR spectroscopy. BBA-Bioenerg. 2013, 1827, 328–339. [Google Scholar] [CrossRef]
  39. Strasser, R.J.; Srivastava, A.; Govindjee. Polyphasic Chlorophyll-a Fluorescence Transient in Plants and Cyanobacteria. Photochem. Photobiol. 1995, 61, 32–42. [Google Scholar] [CrossRef]
  40. Govindjee, G.; Papageorgiou, G. Chlorophyll A Fluorescence: A Signature of Photosynthesis; Springer: Dordrecht, The Netherlands, 2004; pp. 1–41. [Google Scholar]
  41. Sipka, G.; Nagy, L.; Magyar, M.; Akhtar, P.; Shen, J.-R.; Holzwarth, A.R.; Lambrev, P.H.; Garab, G. Light-induced reversible reorganizations in closed Type-II reaction centre complexes. Physiological roles and physical mechanisms. Open Biol. 2022, 12, 220297. [Google Scholar] [CrossRef]
  42. Magyar, M.; Akhtar, P.; Sipka, G.; Han, W.; Li, X.; Han, G.; Shen, J.R.; Lambrev, P.H.; Garab, G. Dependence of the rate-limiting steps in the dark-to-light transition of photosystem II on the lipidic environment of the reaction center. Photosynthetica 2022, 60, 147–156. [Google Scholar] [CrossRef]
  43. Jaenicke, R.; Bohm, G. The stability of proteins in extreme environments. Curr. Opin. Struct. Biol. 1998, 8, 738–748. [Google Scholar] [CrossRef] [PubMed]
  44. Garbers, A.; Reifarth, F.; Kurreck, J.; Renger, G.; Parak, F. Correlation between protein flexibility and electron transfer from QA to QB in PSII membrane fragments from spinach. Biochemistry 1998, 37, 11399–11404. [Google Scholar] [CrossRef] [PubMed]
  45. Pieper, J.; Hauss, T.; Buchsteiner, A.; Baczynski, K.; Adamiak, K.; Lechner, R.E.; Renger, G. Temperature- and hydration-dependent protein dynamics in photosystem II of green plants studied by quasielastic neutron scattering. Biochemistry 2007, 46, 11398–11409. [Google Scholar] [CrossRef]
  46. Pieper, J.; Trapp, M.; Skomorokhov, A.; Natkaniec, I.; Peters, J.; Renger, G. Temperature-dependent vibrational and conformational dynamics of photosystem II membrane fragments from spinach investigated by elastic and inelastic neutron scattering. BBA-Bioenerg. 2012, 1817, 1213–1219. [Google Scholar] [CrossRef] [PubMed] [Green Version]
  47. Nakanishi, M.; Sokolov, A.P. Dielectric Spectroscopy of Hydrated Biomacromolecules. In Dielectric Relaxation in Biological Systems: Physical Principles, Methods, and Applications; Raicu, V., Feldman, Y., Eds.; Oxford University Press: Oxford, UK, 2015; pp. 248–275. [Google Scholar]
  48. Katona, G.; Snijder, A.; Gourdon, P.; Andreasson, U.; Hansson, O.; Andreasson, L.E.; Neutze, R. Conformational regulation of charge recombination reactions in a photosynthetic bacterial reaction center. Nat. Struct. Mol. Biol. 2005, 12, 630–631. [Google Scholar] [CrossRef] [PubMed]
  49. Iwata, T.; Paddock, M.L.; Okamura, M.Y.; Kandori, H. Identification of FTIR Bands Due to Internal Water Molecules around the Quinone Binding Sites in the Reaction Center from Rhodobacter sphaeroides. Biochemistry 2009, 48, 1220–1229. [Google Scholar] [CrossRef] [Green Version]
  50. Malferrari, M.; Turina, P.; Francia, F.; Mezzetti, A.; Leibl, W.; Venturoli, G. Dehydration affects the electronic structure of the primary electron donor in bacterial photosynthetic reaction centers: Evidence from visible-NIR and light-induced difference FTIR spectroscopy. Photoch. Photobio. Sci. 2015, 14, 238–251. [Google Scholar] [CrossRef] [Green Version]
  51. Koike, H.; Inoue, Y. Preparation of oxygen-evolving photosystem II particles from a thermophilic blue-green alga. In The Oxygen Evolving System of Photosynthesis; Inoue, Y., Crofts, A.R., Govindjee, M.N., Renger, G., Satoh, K., Eds.; Academic Press: Cambridge, MA, USA, 1983; pp. 257–263. [Google Scholar]
  52. Shen, J.R.; Kawakami, K.; Koike, H. Purification and crystallization of oxygen-evolving photosystem II core complex from thermophilic cyanobacteria. Methods Mol. Biol. 2011, 684, 41–51. [Google Scholar] [CrossRef] [Green Version]
  53. Chylla, R.A.; Garab, G.; Whitmarsh, J. Evidence for Slow Turnover in a Fraction of Photosystem-II Complexes in Thylakoid Membranes. Biochim. Biophys. Acta 1987, 894, 562–571. [Google Scholar] [CrossRef]
  54. Shen, J.R.; Inoue, Y. Binding and functional properties of two new extrinsic components, cytochrome c-550 and a 12-kDa protein, in cyanobacterial photosystem II. Biochemistry 1993, 32, 1825–1832. [Google Scholar] [CrossRef]
  55. Shen, J.R.; Kamiya, N. Crystallization and the crystal properties of the oxygen-evolving photosystem II from Synechococcus vulcanus. Biochemistry 2000, 39, 14739–14744. [Google Scholar] [CrossRef] [PubMed]
  56. Kawakami, K.; Shen, J.R. Purification of fully active and crystallizable photosystem II from thermophilic cyanobacteria. Methods Enzymol. 2018, 613, 1–16. [Google Scholar] [CrossRef] [PubMed]
  57. Schreiber, U.; Krieger, A. Two fundamentally different types of variable chlorophyll fluorescence in vivo. FEBS Lett. 1996, 397, 131–135. [Google Scholar] [CrossRef] [PubMed] [Green Version]
  58. Allen, J.P.; Chamberlain, K.D.; Williams, J.C. Identification of amino acid residues in a proton release pathway near the bacteriochlorophyll dimer in reaction centers from Rhodobacter sphaeroides. Photosynth. Res. 2022, 1–12. [Google Scholar] [CrossRef] [PubMed]
Figure 1. Temperature-dependent variations of the single-turnover saturating flash (STSF) induced Chl-a fluorescence transients of DCMU-treated PSII CC of T. vulcanus (a) and spinach TMs (b). The STSFs were applied 500 ms apart; at the end, blue laser flashes (multiple-turnover saturating flashes, MTSFs) with different lengths and amounts were fired to ensure the saturation. The measurements were performed using the PAM-101 based setup.
Ijms 24 00094 g001
Figure 2. Kinetic traces of Chl-a fluorescence transients of DCMU-treated PSII CC of T. vulcanus at −80 °C; the traces were elicited by double STSFs fired with the indicated time intervals between the two flashes. F1,2 marks the fluorescence levels after the double STSFs and, where resolved, F1 and F2 show, respectively, the levels reached after the first and the second STSF. The measurements were performed using the PAM-101 based setup.
Ijms 24 00094 g002
Figure 3. Dependence of the F1-to-F2 Chl-a fluorescence levels on the Δτ time intervals between the first and second STSFs at different temperatures in PSII CC of T. vulcanus (a), and in spinach TMs (b) in the presence of 40 μM DCMU. Continuous lines represent logistic-function fits of the data points, which are shown as mean values ± SD (n = 3–9). Dotted vertical lines mark the Δτ1/2 half-rise time values, i.e., the Δτ values corresponding to the 50% of the maximum F1-to-F2 increments at 5 °C (blue) and −80 °C (red). The fluorescence levels at each Δτ were determined after the second STSF; here marked as F1,2, irrespective of the resolution of the F1 and F2 levels (see Figure 2). The measurements were performed on the PAM-101 based setup.
Ijms 24 00094 g003
Figure 4. Temperature dependence of the double-STSF induced (F1-to-F2) ∆τ1/2 half-waiting times of isolated T. vulcanus PSII CC (blue) and spinach TMs (red). The data points are taken from Table 1. The continuous lines represent spline interpolation of the data points.
Ijms 24 00094 g004
Figure 5. Dependence of the F2-to-F3 (blue) and the F4-to-F5 (red) Chl-a fluorescence levels on the ∆τ time intervals between the second and third, and between the fourth and fifth STSFs, respectively, in DCMU-treated T. vulcanus PSII CC at 5 °C (a) and at −80 °C (b). Continuous lines represent logistic-function fits of the data points, which represent mean values ± SD (n = 3–4); the calculated ∆τ1/2 values are also indicated. The measurements were performed on the MC-PAM based setup.
Ijms 24 00094 g005
Table 1. Double-STSF induced (F1-to-F2) Δτ1/2 half-rise times of PSII CC of T. vulcanus and spinach TMs in the presence of DCMU at different temperatures. Measurements were performed, using the PAM-101 based setup, on the same PSII CC batch and the same TM preparations at all temperatures. P is the slope of the rise curve calculated by logistic-function fit of the data points, which represent mean values ± SD (n = 3–9). Numbers marked with the symbol * are obtained from a global fit with shared P (0.73); at low temperatures (≤−60 °C), the global fit was not satisfactory, and we allowed free run of the fit. The Fv/Fm parameter values are also shown.
Temperature
(°C)
PSII CC
Δτ1/2 (ms)
Logistic Fit PFv/FmThylakoid
Δτ1/2 (ms)
Logistic Fit PFv/Fm
231.16 ± 0.400.73 *0.80 ± 0.01---
51.77 ± 0.390.73 *0.85 ± 0.020.20 ± 0.040.73 *0.65 ± 0.00
−201.37 ± 0.490.73 *0.83 ± 0.010.42 ± 0.120.73 *0.60 ± 0.01
−402.01 ± 0.450.73 *0.83 ± 0.010.36 ± 0.090.73 *0.56 ± 0.01
−603.29 ± 0.930.73 *0.83 ± 0.000.80 ± 0.091.30.53 ± 0.02
−804.18 ± 0.891.150.83 ± 0.011.14 ± 0.181.030.50 ± 0.02
Disclaimer/Publisher’s Note: The statements, opinions and data contained in all publications are solely those of the individual author(s) and contributor(s) and not of MDPI and/or the editor(s). MDPI and/or the editor(s) disclaim responsibility for any injury to people or property resulting from any ideas, methods, instructions or products referred to in the content.

