
Nucleolar- and Nuclear-Stress-Induced Membrane-Less Organelles: A Proteome Analysis through the Prism of Liquid–Liquid Phase Separation
 , ,
, ,  and
and 
Abstract
:1. Introduction
2. Results
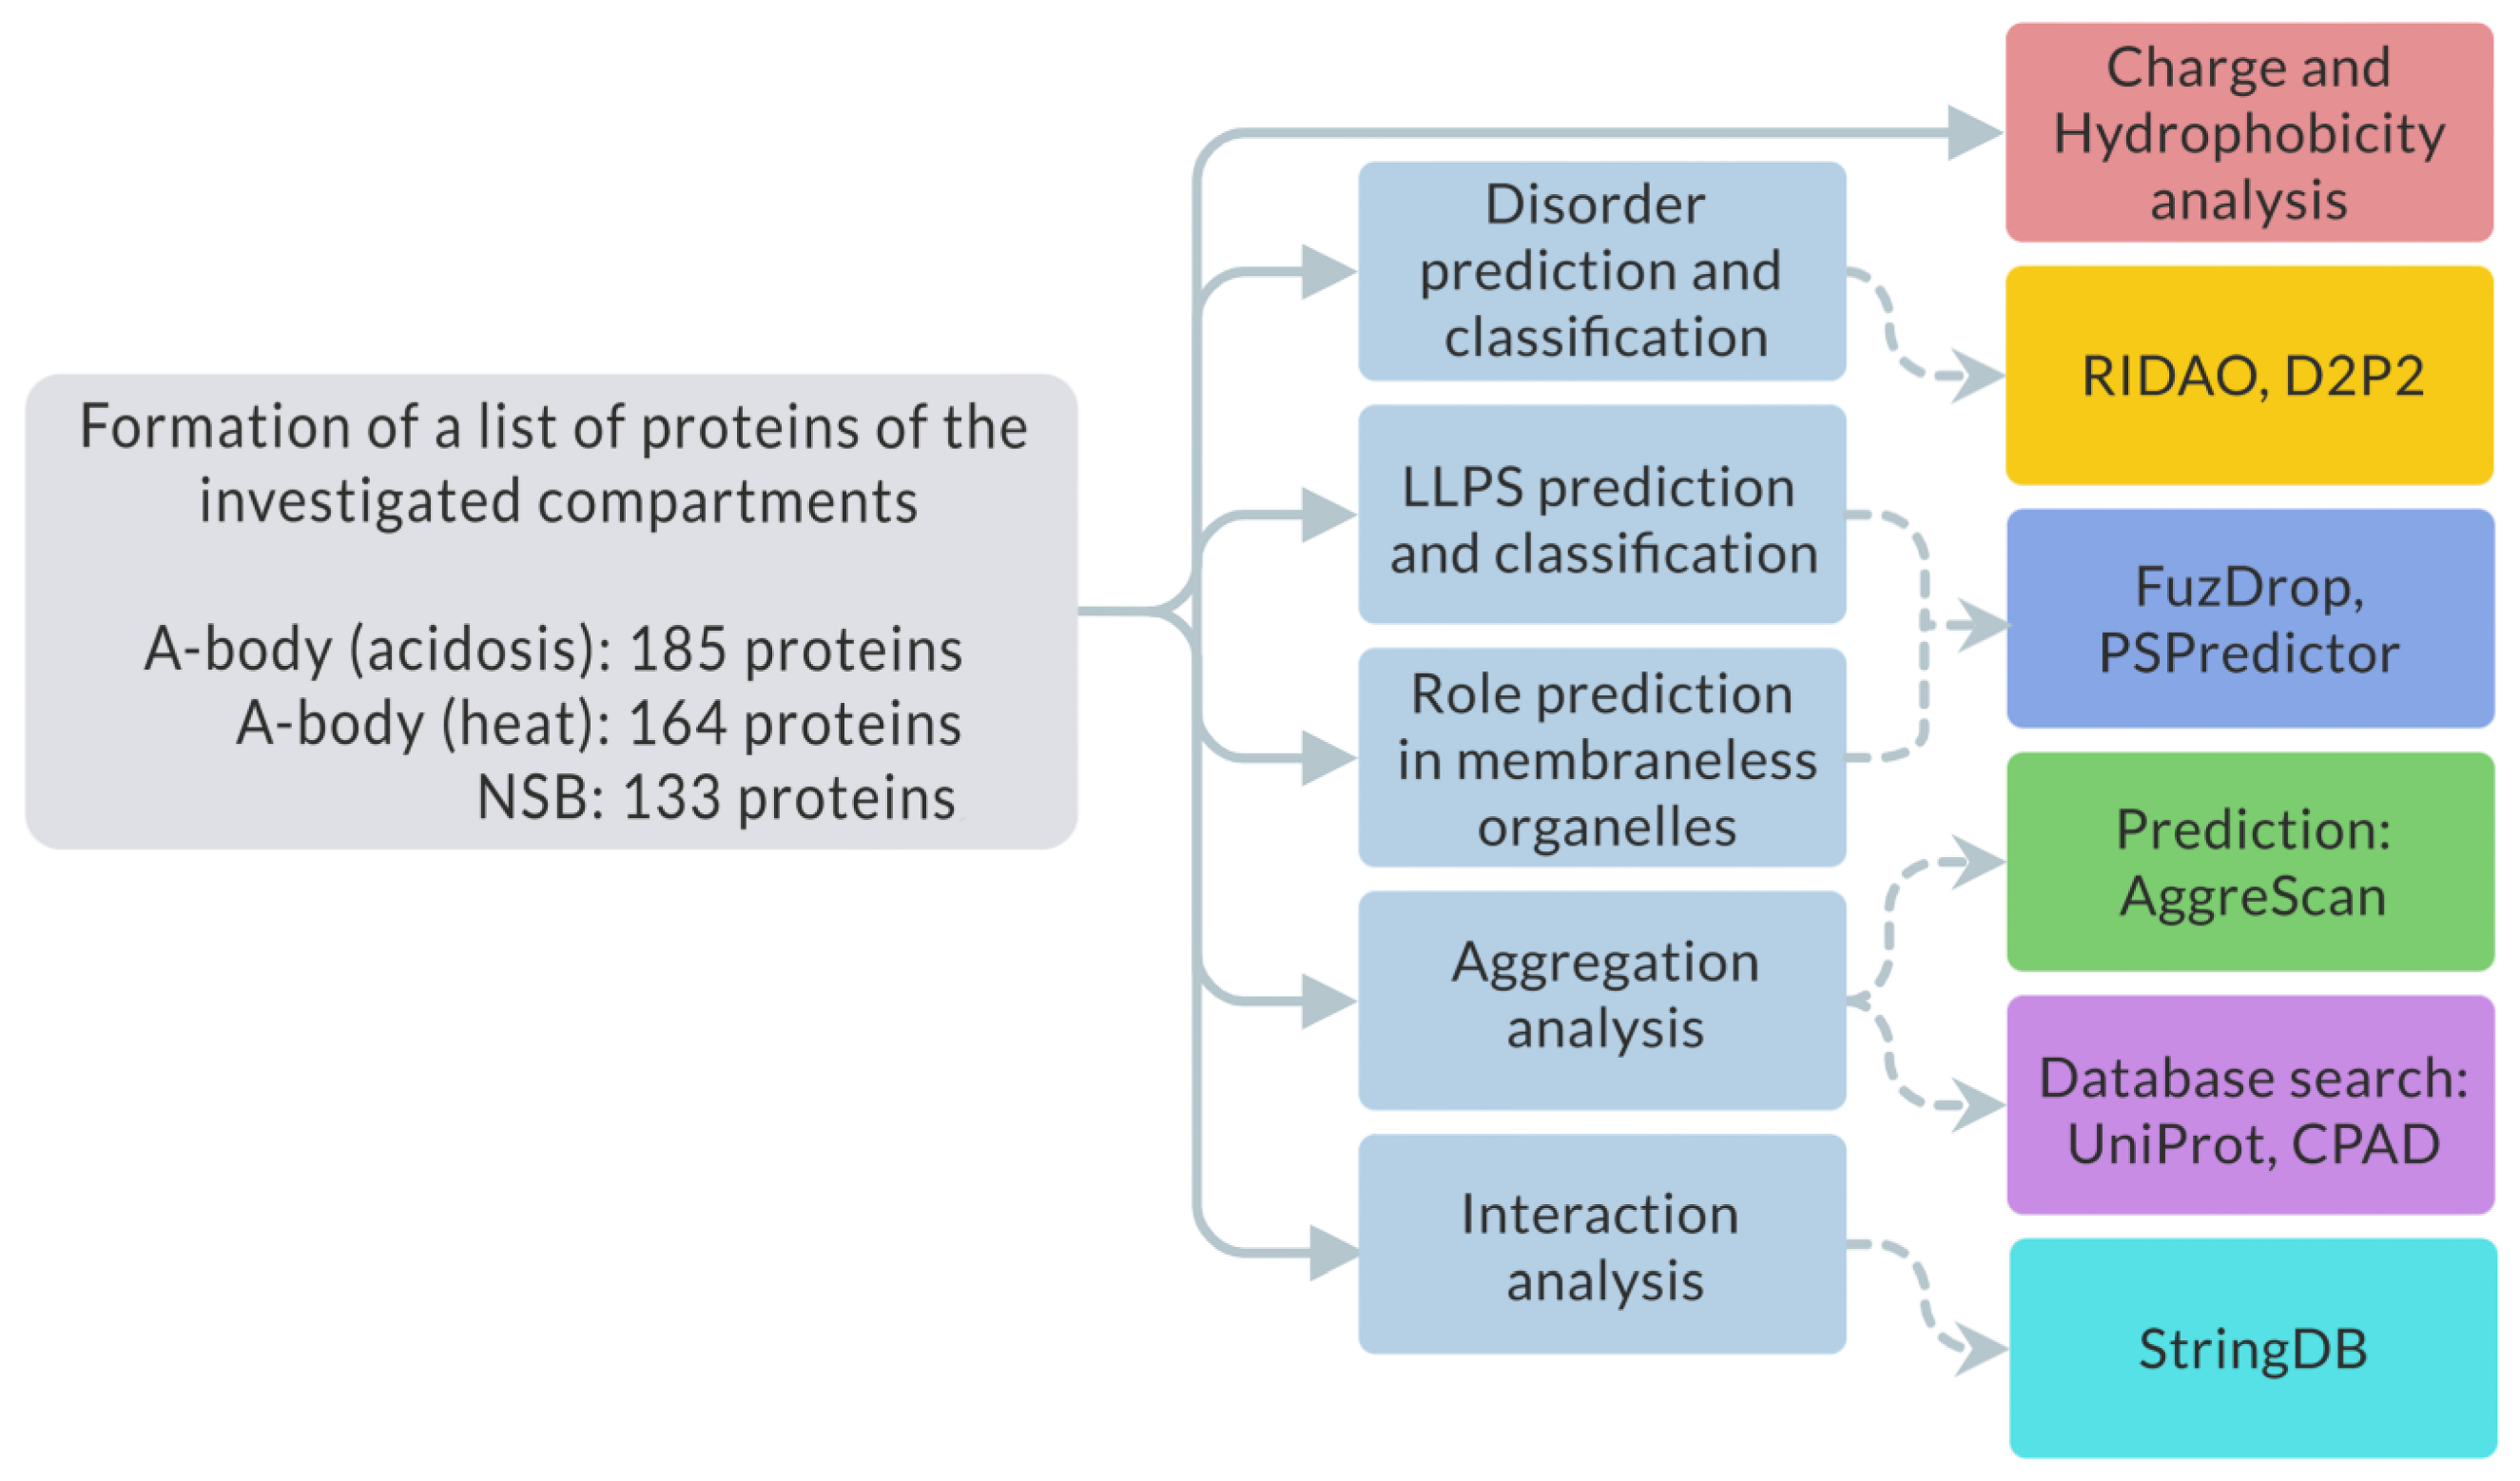
2.1. Study Design
- -
- Intrinsic disorder using D2P2 and RIDAO services;
- -
- Tendency to spontaneous LLPS using FuzDrop and PSPredictor services;
- -
- Tendency to inducible LLPS using FuzDrop service;
- -
- Charge and hydrophobic properties;
- -
- Tendency to amyloid fibrillation using AggreScan service;
- -
- UniProt and CPAD database search amyloid-forming proteins;
- -
- Interactome analysis of proteins that are simultaneously included in all three studied proteomes using STRING database.
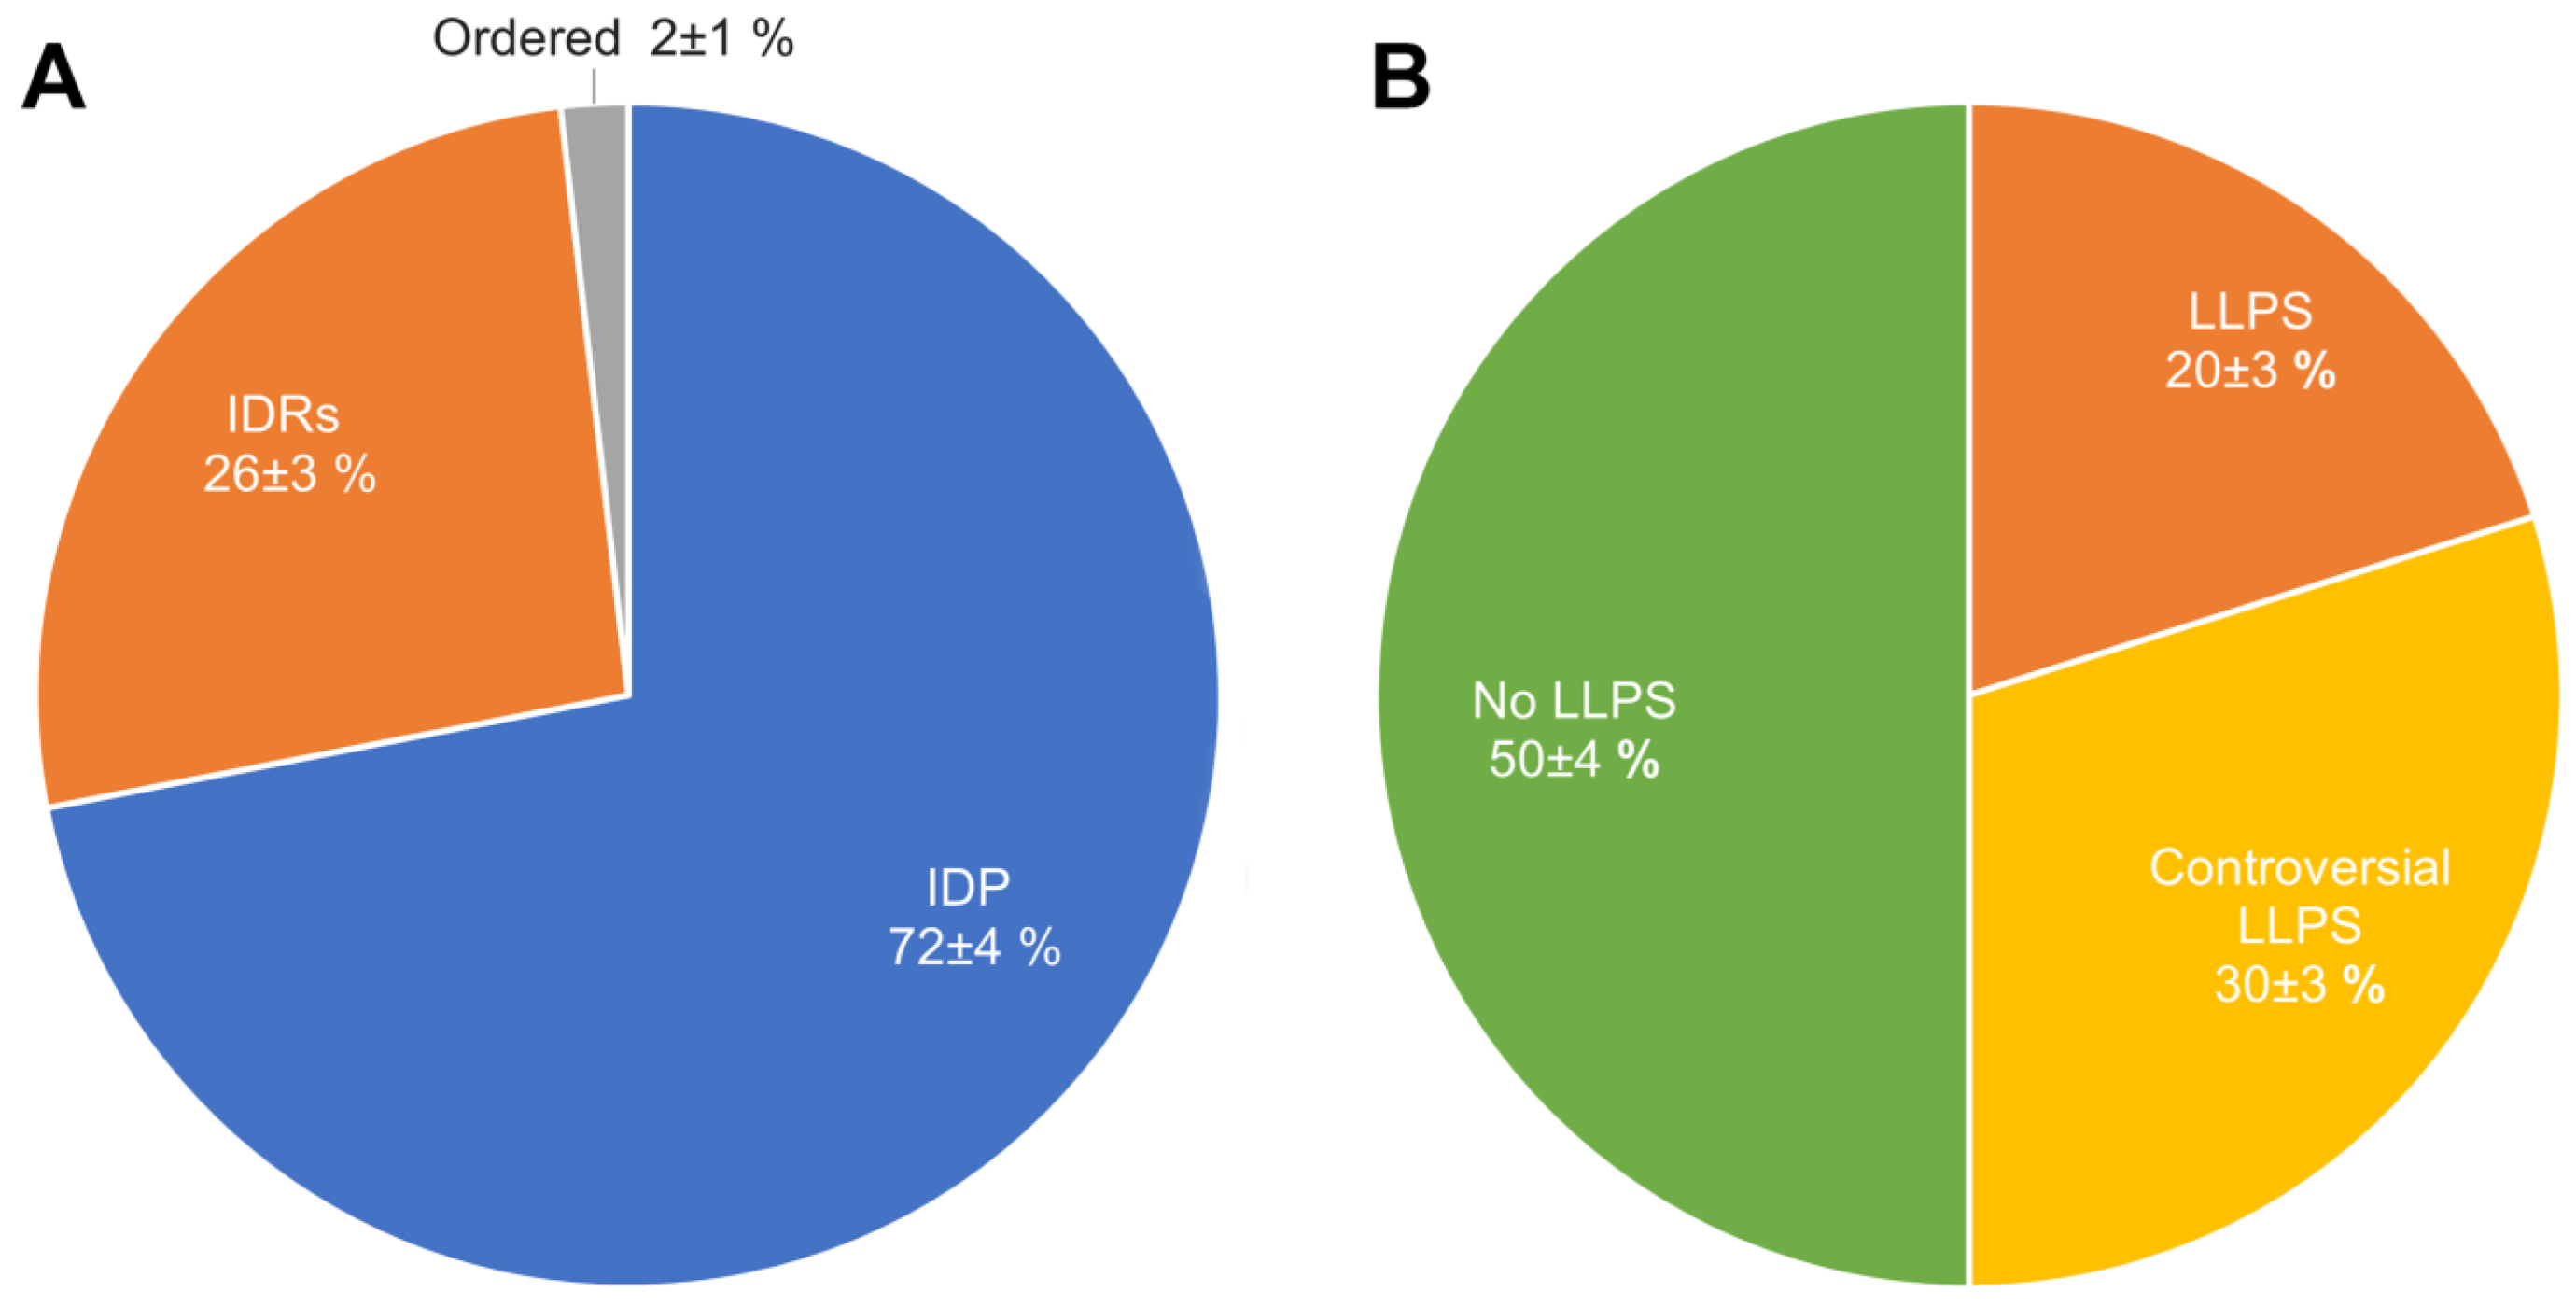
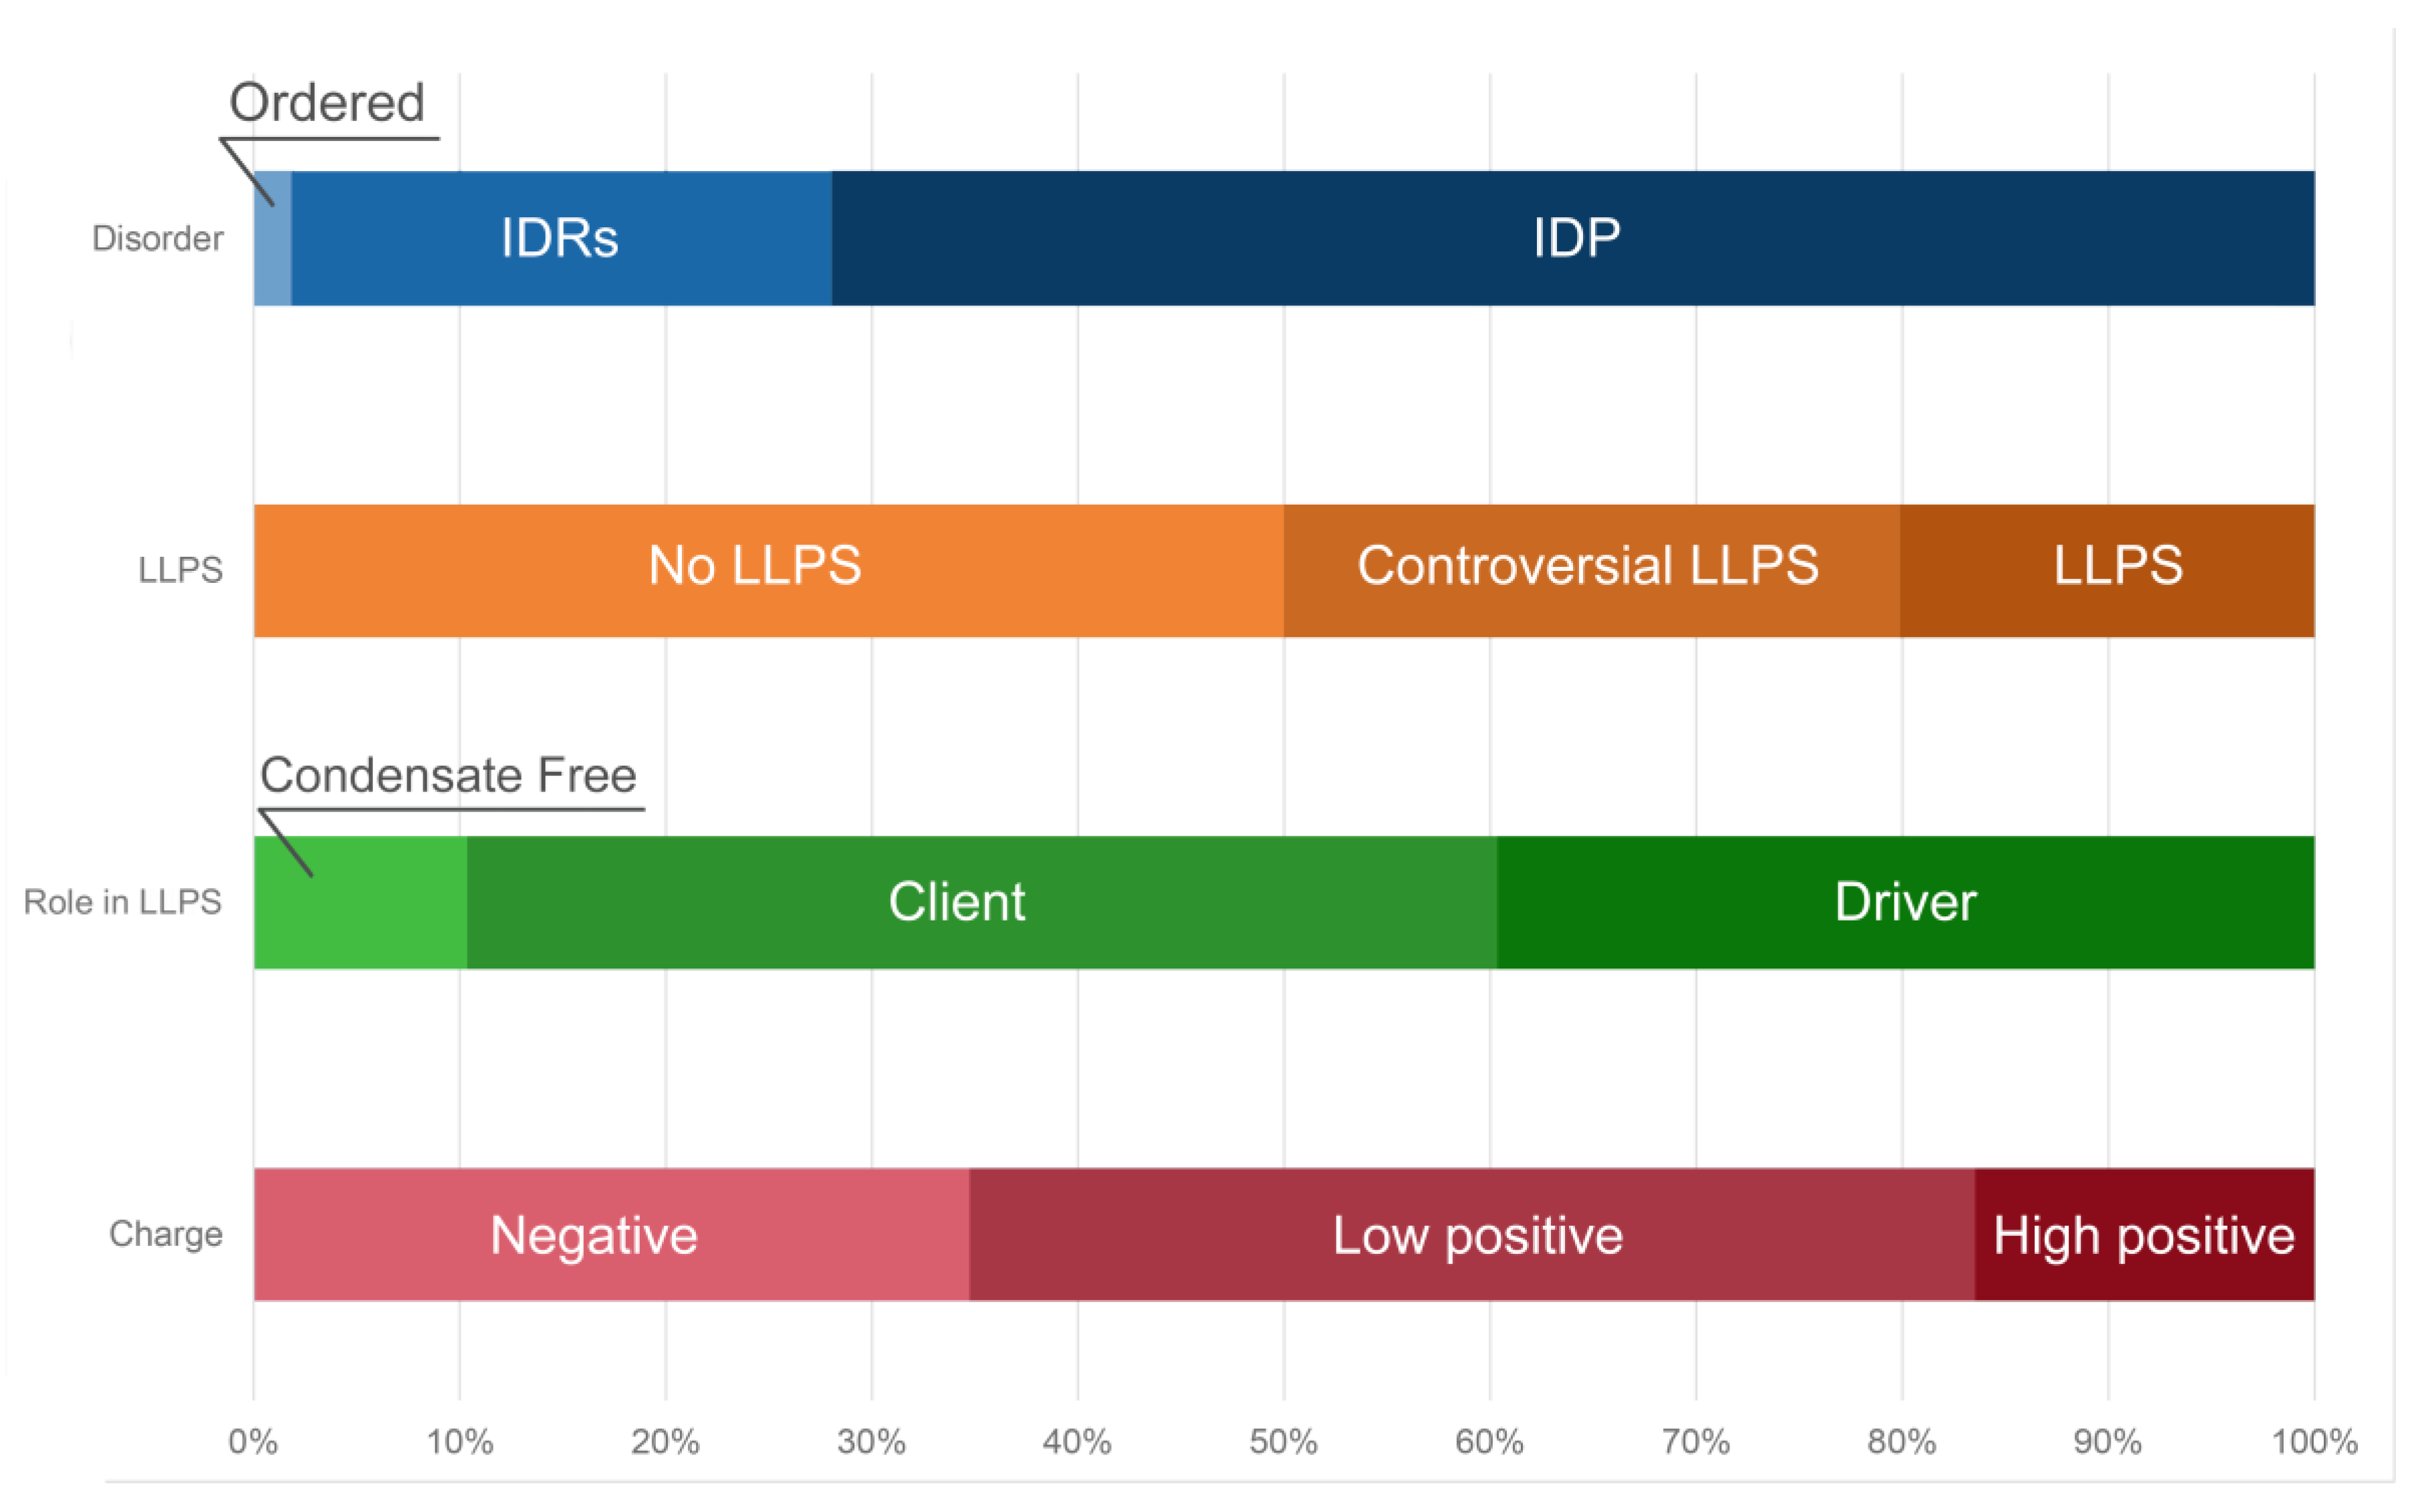
2.2. Global Disorder Analysis of Proteomes of A-Bodies and nSBs
2.3. Global Analysis of LLPS Predisposition of Proteomes of A-Bodies and nSBs
2.4. Heat-Shock-Induced A-Bodies
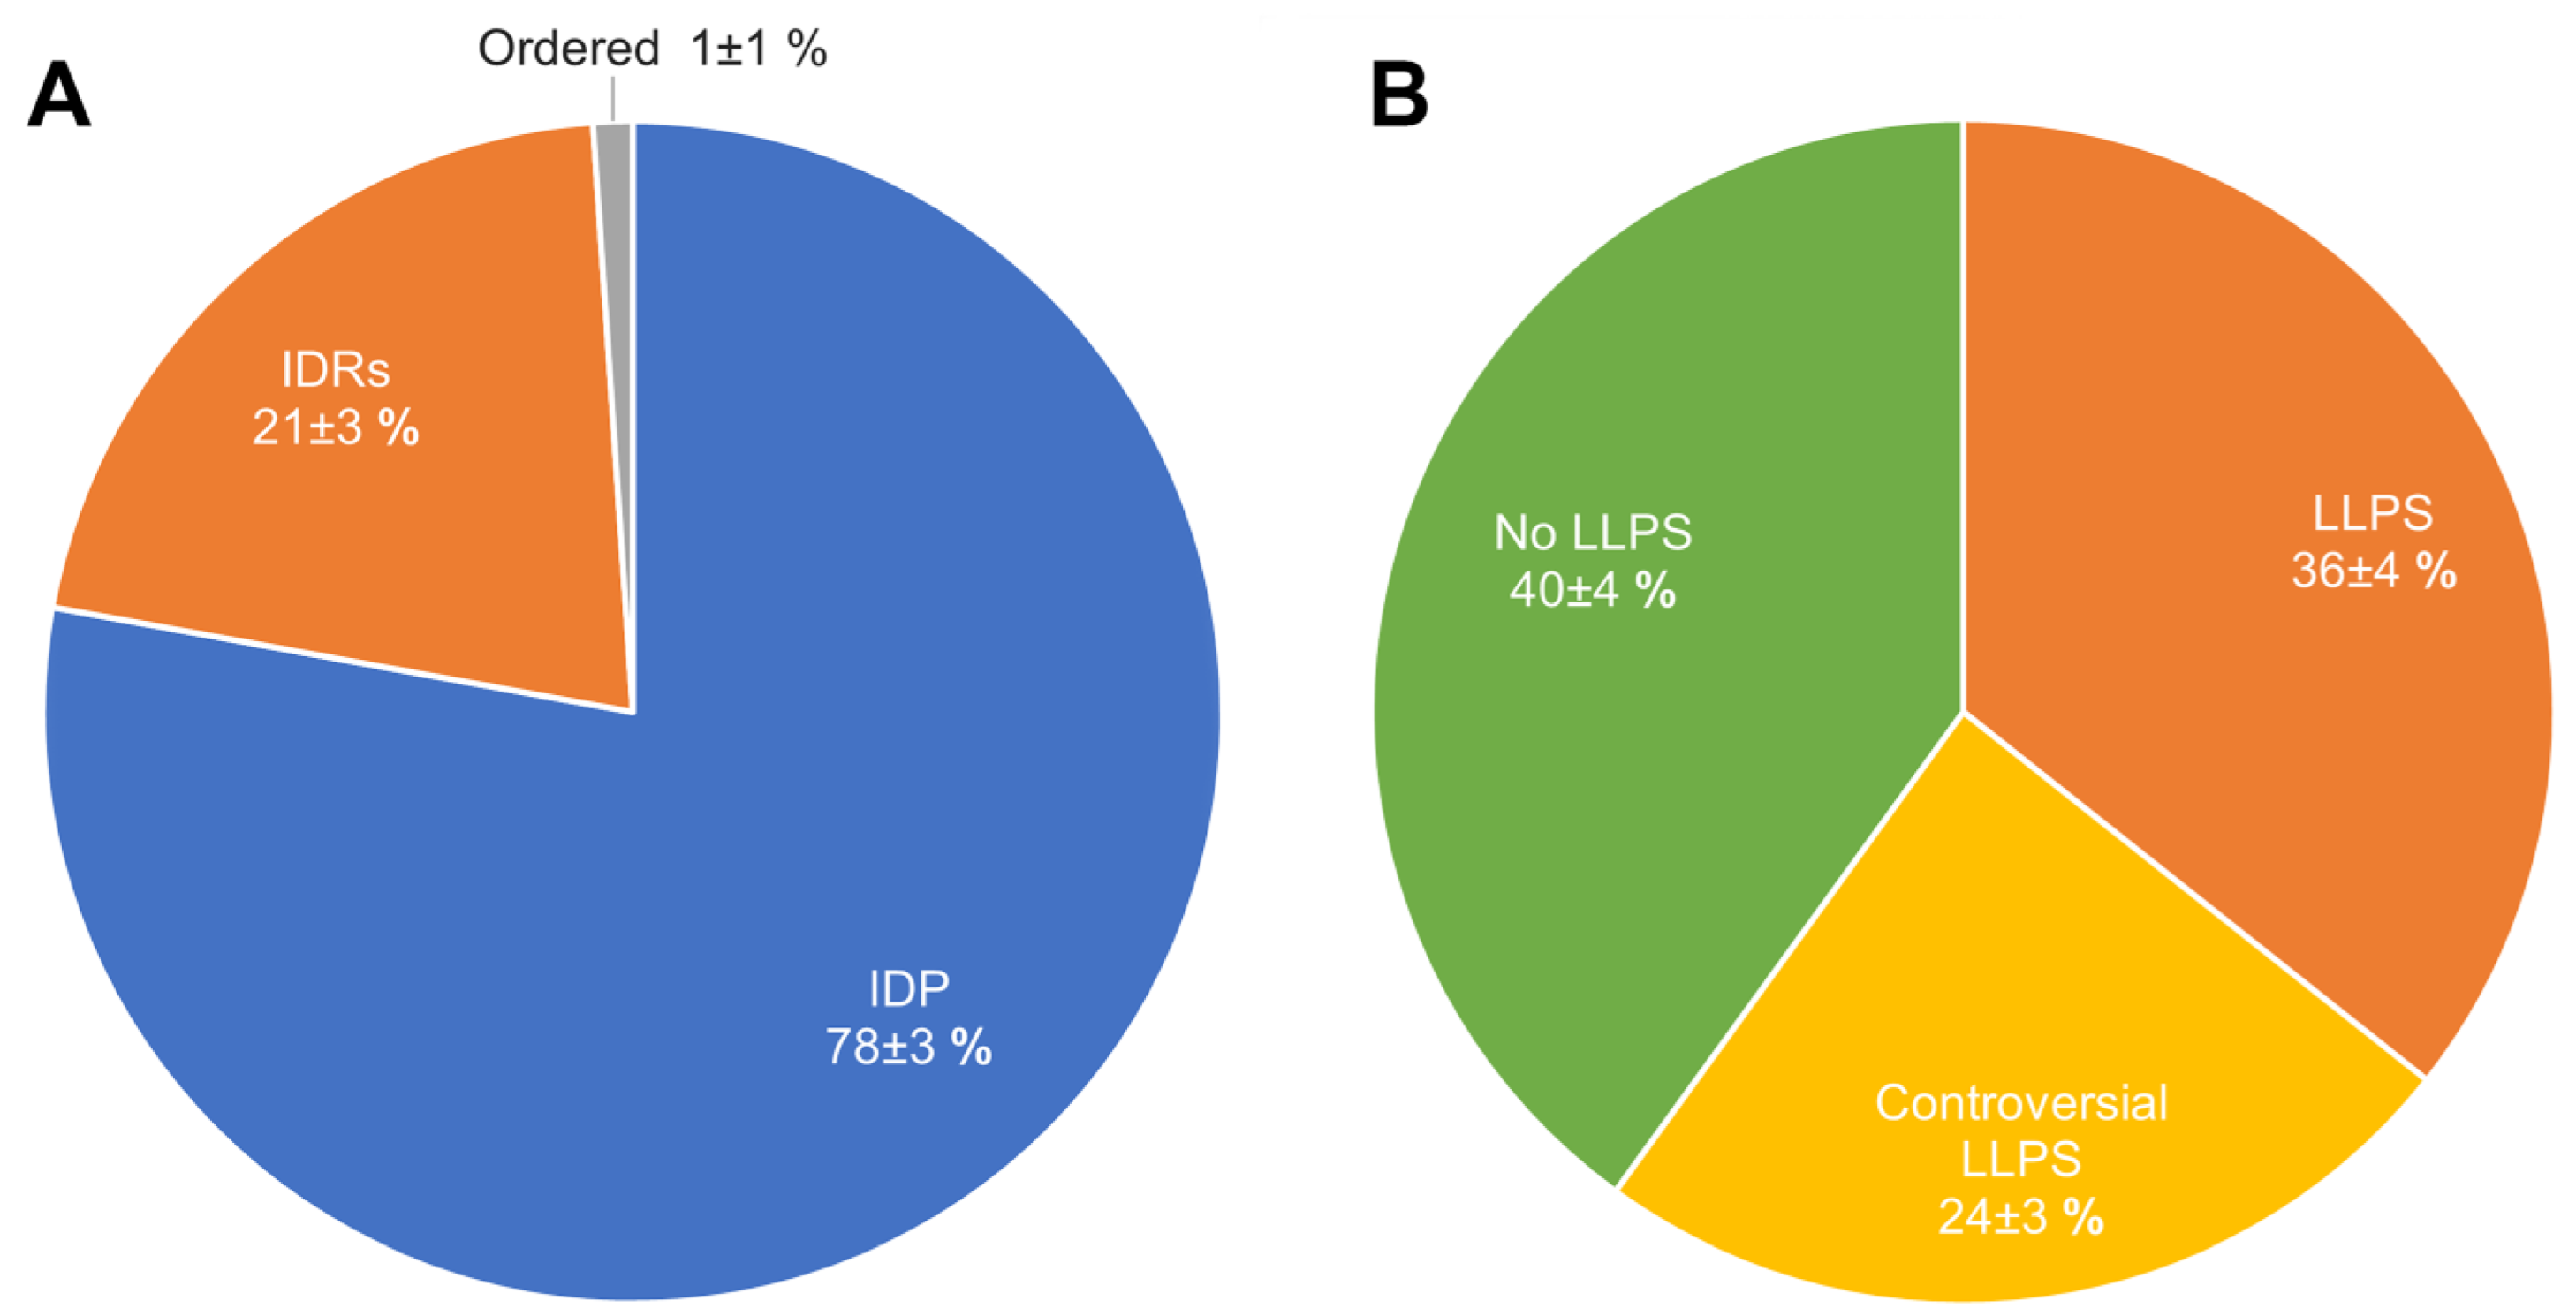
2.5. Acidosis-Induced A-Bodies
2.6. Heat-Induced Nuclear Stress Bodies (nSBs)
3. Discussion


4. Materials and Methods
4.1. Assembly of the Datasets for the Analysis
4.2. Intrinsic Disorder Analysis
4.3. Analysis of the Interactability of Proteins
4.4. LLPS Prediction
4.5. Aggregation Propensity Prediction
4.6. Calculation of Protein Charge and Hydrophobicity
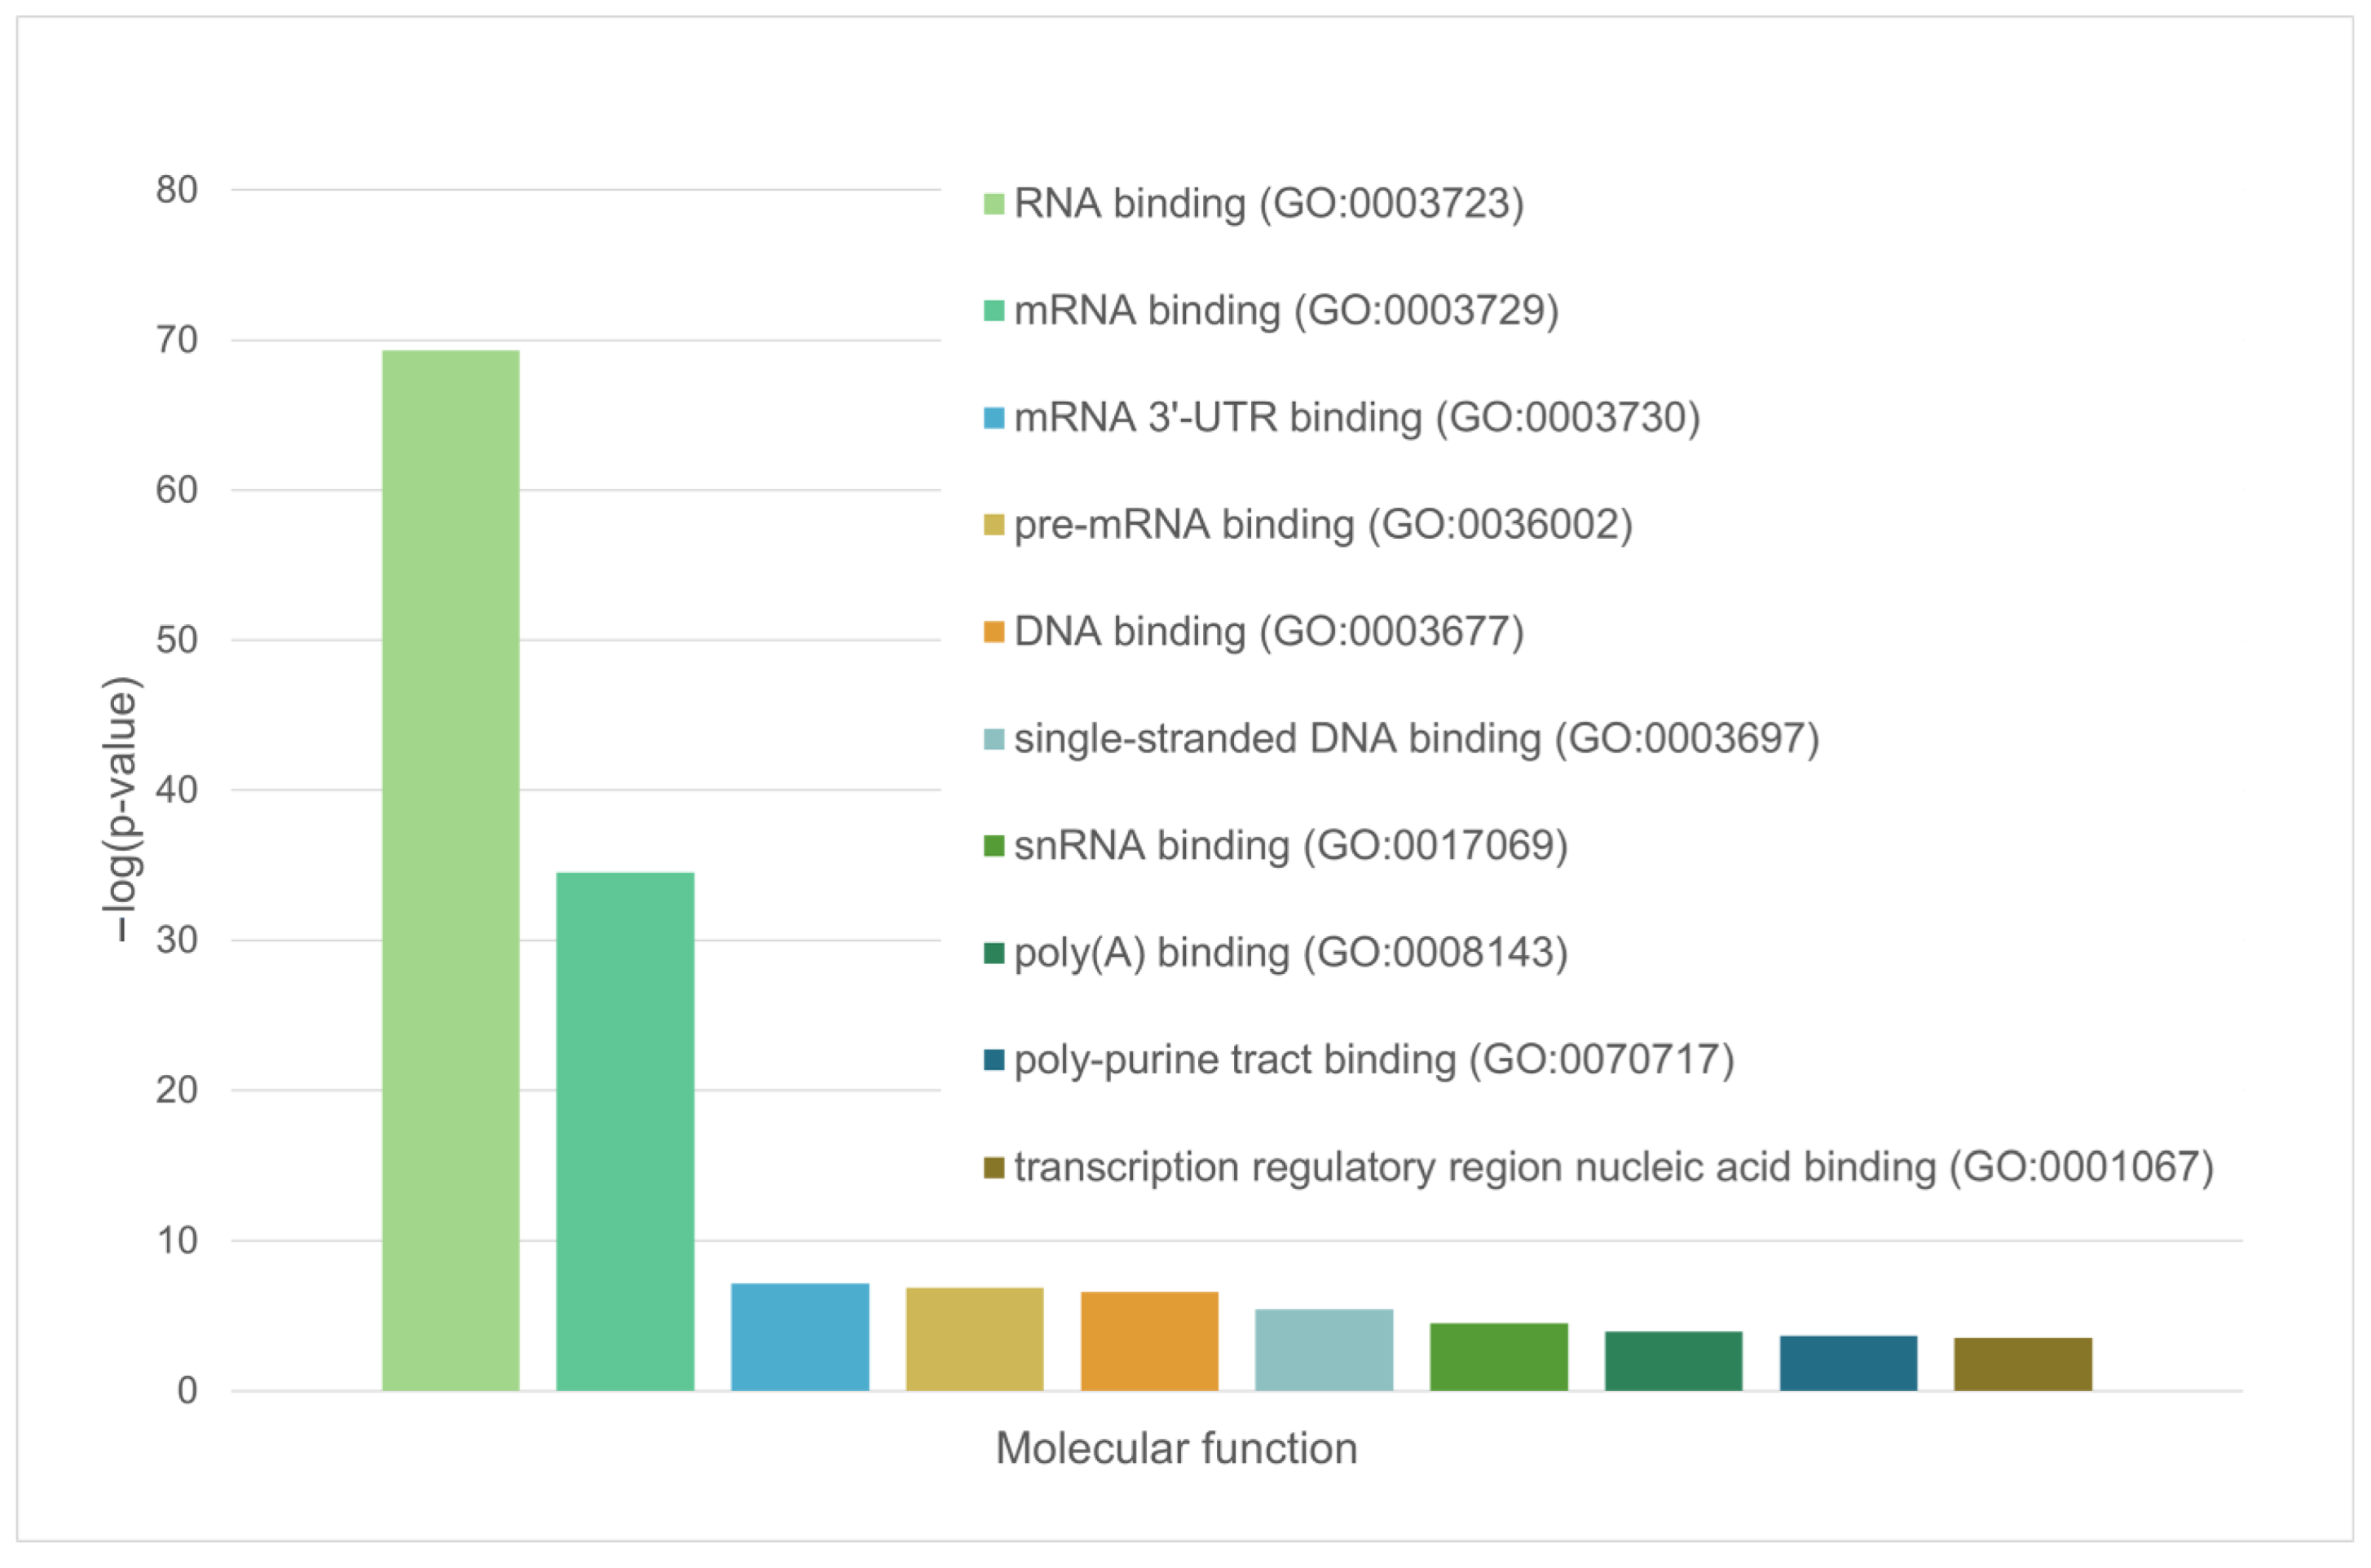
4.7. Definition of Biological Processes and Molecular Functions of Proteins
5. Conclusions
Supplementary Materials
Author Contributions
Funding
Institutional Review Board Statement
Informed Consent Statement
Data Availability Statement
Conflicts of Interest
References
- Antifeeva, I.A.; Fonin, A.V.; Fefilova, A.S.; Stepanenko, O.V.; Povarova, O.I.; Silonov, S.A.; Kuznetsova, I.M.; Uversky, V.N.; Turoverov, K.K. Liquid–liquid phase separation as an organizing principle of intracellular space: Overview of the evolution of the cell compartmentalization concept. Cell. Mol. Life Sci. 2022, 79, 1–32. [Google Scholar] [CrossRef]
- Uversky, V.N. Intrinsically Disordered Proteins and Their “Mysterious” (Meta)Physics. Front. Phys. 2019, 7, 10. [Google Scholar] [CrossRef] [Green Version]
- Uversky, V.N. Functional roles of transiently and intrinsically disordered regions within proteins. FEBS J. 2015, 282, 1182–1189. [Google Scholar] [CrossRef]
- Uversky, V.N. Intrinsically disordered proteins in overcrowded milieu: Membrane-less organelles, phase separation, and intrinsic disorder. Curr. Opin. Struct. Biol. 2016, 44, 18–30. [Google Scholar] [CrossRef] [PubMed]
- Turoverov, K.K.; Kuznetsova, I.M.; Fonin, A.V.; Darling, A.L.; Zaslavsky, B.Y.; Uversky, V.N. Stochasticity of Biological Soft Matter: Emerging Concepts in Intrinsically Disordered Proteins and Biological Phase Separation. Trends Biochem. Sci. 2019, 44, 716–728. [Google Scholar] [CrossRef]
- Erkine, A.M. ‘Nonlinear’ Biochemistry of Nucleosome Detergents. Trends Biochem. Sci. 2018, 43, 951–959. [Google Scholar] [CrossRef] [PubMed] [Green Version]
- Shin, Y.; Brangwynne, C.P. Liquid phase condensation in cell physiology and disease. Science 2017, 357, 6357. [Google Scholar] [CrossRef] [PubMed] [Green Version]
- Brangwynne, C.P.; Tompa, P.; Pappu, R.V. Polymer physics of intracellular phase transitions. Nat. Phys. 2015, 11, 899–904. [Google Scholar] [CrossRef]
- Wolozin, B.; Ivanov, P. Stress granules and neurodegeneration. Nat. Rev. Neurosci. 2019, 20, 649–666. [Google Scholar] [CrossRef]
- Fonin, A.V.; Silonov, S.A.; Fefilova, A.S.; Stepanenko, O.V.; Gavrilova, A.A.; Petukhov, A.V.; Romanovich, A.E.; Modina, A.L.; Zueva, T.S.; Nedelyaev, E.M.; et al. New Evidence of the Importance of Weak Interactions in the Formation of PML-Bodies. Int. J. Mol. Sci. 2022, 23, 1613. [Google Scholar] [CrossRef]
- Fonin, A.V.; Silonov, S.A.; Shpironok, O.G.; Antifeeva, I.A.; Petukhov, A.V.; Romanovich, A.E.; Kuznetsova, I.M.; Uversky, V.N.; Turoverov, K.K. The role of non-specific interactions in canonical and ALT-associated PML-bodies formation and dynamics. Int. J. Mol. Sci. 2021, 22, 5821. [Google Scholar] [CrossRef] [PubMed]
- Fefilova, A.S.; Fonin, A.V.; Vishnyakov, I.E.; Kuznetsova, I.M.; Turoverov, K.K. Stress-Induced Membraneless Organelles in Eukaryotes and Prokaryotes: Bird’s-Eye View. Int. J. Mol. Sci. 2022, 23, 5010. [Google Scholar] [CrossRef]
- Fefilova, A.S.; Antifeeva, I.A.; Gavrilova, A.A.; Turoverov, K.K.; Kuznetsova, I.M.; Fonin, A.V. Reorganization of Cell Compartmentalization Induced by Stress. Biomolecules 2022, 12, 1441. [Google Scholar] [CrossRef] [PubMed]
- Audas, T.E.; Jacob, M.D.; Lee, S. Immobilization of proteins in the nucleolus by ribosomal intergenic spacer noncoding RNA. Mol. Cell 2012, 45, 147–157. [Google Scholar] [CrossRef]
- Gonzalez, I.L.; Sylvester, J.E. Complete sequence of the 43-kb human ribosomal DNA repeat: Analysis of the intergenic spacer. Genomics 1995, 27, 320–328. [Google Scholar] [CrossRef] [PubMed]
- Kellermayer, M.S.; Karsai, A.; Benke, M.; Soós, K.; Penke, B. Stepwise dynamics of epitaxially growing single amyloid fibrils. Proc. Natl. Acad. Sci. USA 2008, 105, 141–144. [Google Scholar] [CrossRef]
- Rambaran, R.N.; Serpell, L.C. Amyloid fibrils: Abnormal protein assembly. Prion 2008, 2, 112–117. [Google Scholar] [CrossRef]
- Marijan, D.; Tse, R.; Elliott, K.; Chandhok, S.; Luo, M.; Lacroix, E.; Audas, T.E. Stress-specific aggregation of proteins in the amyloid bodies. FEBS Lett. 2019, 593, 3162–3172. [Google Scholar] [CrossRef] [Green Version]
- Audas, T.E.; Audas, D.E.; Jacob, M.D.; Ho, J.J.D.; Khacho, M.; Wang, M.; Perera, J.K.; Gardiner, C.; Bennett, C.A.; Head, T.; et al. Adaptation to Stressors by Systemic Protein Amyloidogenesis. Dev. Cell 2016, 39, 155–168. [Google Scholar] [CrossRef] [Green Version]
- Wang, M.; Bokros, M.; Theodoridis, P.R.; Lee, S. Nucleolar Sequestration: Remodeling Nucleoli Into Amyloid Bodies. Front. Genet. 2019, 10, 1179. [Google Scholar] [CrossRef] [Green Version]
- Wang, M.; Tao, X.; Jacob, M.D.; Bennett, C.A.; Ho, J.J.D.; Gonzalgo, M.L.; Audas, T.E.; Lee, S. Stress-Induced Low Complexity RNA Activates Physiological Amyloidogenesis. Cell Rep. 2018, 24, 1713–1721.e14. [Google Scholar] [CrossRef] [PubMed] [Green Version]
- Theodoridis, P.R.; Bokros, M.; Marijan, D.; Balukoff, N.C.; Wang, D.; Kirk, C.C.; Budine, T.D.; Goldsmith, H.D.; Wang, M.; Audas, T.E.; et al. Local translation in nuclear condensate amyloid bodies. Proc. Natl. Acad. Sci. USA 2021, 118, e2014457118. [Google Scholar] [CrossRef]
- Biamonti, G.; Vourc’h, C. Nuclear stress bodies. Cold Spring Harb. Perspect. Biol. 2010, 2, a000695. [Google Scholar] [CrossRef] [PubMed]
- Akerfelt, M.; Morimoto, R.I.; Sistonen, L. Heat shock factors: Integrators of cell stress, development and lifespan. Nat. Rev. Mol. Cell Biol. 2010, 11, 545–555. [Google Scholar] [CrossRef]
- Alastalo, T.P.; Hellesuo, M.; Sandqvist, A.; Hietakangas, V.; Kallio, M.; Sistonen, L. Formation of nuclear stress granules involves HSF2 and coincides with the nucleolar localization of Hsp70. J. Cell Sci. 2003, 116, 3557–3570. [Google Scholar] [CrossRef] [Green Version]
- Valgardsdottir, R.; Chiodi, I.; Giordano, M.; Rossi, A.; Bazzini, S.; Ghigna, C.; Riva, S.; Biamonti, G. Transcription of Satellite III non-coding RNAs is a general stress response in human cells. Nucleic Acids Res. 2008, 36, 423–434. [Google Scholar] [CrossRef]
- Col, E.; Hoghoughi, N.; Dufour, S.; Penin, J.; Koskas, S.; Faure, V.; Ouzounova, M.; Hernandez-Vargash, H.; Reynoird, N.; Daujat, S.; et al. Bromodomain factors of BET family are new essential actors of pericentric heterochromatin transcriptional activation in response to heat shock. Sci. Rep. 2017, 7, 5418. [Google Scholar] [CrossRef] [PubMed]
- Ninomiya, K.; Adachi, S. LncRNA-dependent nuclear stress bodies promote intron retention through SR protein phosphorylation. EMBO J. 2020, 39, e102729. [Google Scholar] [CrossRef]
- Ninomiya, K.; Iwakiri, J.; Aly, M.K.; Sakaguchi, Y.; Adachi, S.; Natsume, T.; Terai, G.; Asai, K.; Suzuki, T.; Hirose, T. m(6) A modification of HSATIII lncRNAs regulates temperature-dependent splicing. EMBO J. 2021, 40, e107976. [Google Scholar] [CrossRef]
- Sandqvist, A.; Björk, J.K.; Akerfelt, M.; Chitikova, Z.; Grichine, A.; Vourc’h, C.; Jolly, C.; Salminen, T.A.; Nymalm, Y.; Sistonen, L. Heterotrimerization of heat-shock factors 1 and 2 provides a transcriptional switch in response to distinct stimuli. Mol. Biol. Cell 2009, 20, 1340–1347. [Google Scholar] [CrossRef] [Green Version]
- Mekhail, K.; Khacho, M.; Carrigan, A.; Hache, R.R.; Gunaratnam, L.; Lee, S. Regulation of ubiquitin ligase dynamics by the nucleolus. J. Cell Biol. 2005, 170, 733–744. [Google Scholar] [CrossRef] [PubMed] [Green Version]
- Rajagopalan, K.; Mooney, S.M.; Parekh, N.; Getzenberg, R.H.; Kulkarni, P. A majority of the cancer/testis antigens are intrinsically disordered proteins. J. Cell. Biochem. 2011, 112, 3256–3267. [Google Scholar] [CrossRef] [PubMed] [Green Version]
- Mohammed, A.S.; Uversky, V.N. Intrinsic Disorder as a Natural Preservative: High Levels of Intrinsic Disorder in Proteins Found in the 2600-Year-Old Human Brain. Biology 2022, 11, 1704. [Google Scholar] [CrossRef]
- Hardenberg, M.; Horvath, A.; Ambrus, V.; Fuxreiter, M.; Vendruscolo, M. Widespread occurrence of the droplet state of proteins in the human proteome. Proc. Natl. Acad. Sci. USA 2020, 117, 33254–33262. [Google Scholar] [CrossRef]
- Hatos, A.; Tosatto, S.C.E.; Vendruscolo, M.; Fuxreiter, M. FuzDrop on AlphaFold: Visualizing the sequence-dependent propensity of liquid-liquid phase separation and aggregation of proteins. Nucleic Acids Res. 2022, 50, W337–W344. [Google Scholar] [CrossRef]
- Vendruscolo, M.; Fuxreiter, M. Sequence Determinants of the Aggregation of Proteins Within Condensates Generated by Liquid-liquid Phase Separation. J. Mol. Biol. 2022, 434, 167201. [Google Scholar] [CrossRef]
- Zhang, H.; Shao, S.; Zeng, Y.; Wang, X.; Qin, Y.; Ren, Q.; Xiang, S.; Wang, Y.; Xiao, J.; Sun, Y. Reversible phase separation of HSF1 is required for an acute transcriptional response during heat shock. Nat. Cell Biol. 2022, 24, 340–352. [Google Scholar] [CrossRef]
- Varadi, M.; Anyango, S.; Deshpande, M.; Nair, S.; Natassia, C.; Yordanova, G.; Yuan, D.; Stroe, O.; Wood, G.; Laydon, A.; et al. AlphaFold Protein Structure Database: Massively expanding the structural coverage of protein-sequence space with high-accuracy models. Nucleic Acids Res. 2022, 50, D439–D444. [Google Scholar] [CrossRef] [PubMed]
- Jumper, J.; Evans, R.; Pritzel, A.; Green, T.; Figurnov, M.; Ronneberger, O.; Tunyasuvunakool, K.; Bates, R.; Žídek, A.; Potapenko, A.; et al. Highly accurate protein structure prediction with AlphaFold. Nature 2021, 596, 583–589. [Google Scholar] [CrossRef]
- Andreeva, A.; Howorth, D.; Brenner, S.E.; Hubbard, T.J.; Chothia, C.; Murzin, A.G. SCOP database in 2004: Refinements integrate structure and sequence family data. Nucleic Acids Res. 2004, 32, D226–D229. [Google Scholar] [CrossRef] [Green Version]
- Murzin, A.G.; Brenner, S.E.; Hubbard, T.; Chothia, C. SCOP: A structural classification of proteins database for the investigation of sequences and structures. J. Mol. Biol. 1995, 247, 536–540. [Google Scholar] [CrossRef] [PubMed]
- de Lima Morais, D.A.; Fang, H.; Rackham, O.J.; Wilson, D.; Pethica, R.; Chothia, C.; Gough, J. SUPERFAMILY 1.75 including a domain-centric gene ontology method. Nucleic Acids Res. 2011, 39, D427–D434. [Google Scholar] [CrossRef] [PubMed] [Green Version]
- Meszaros, B.; Simon, I.; Dosztanyi, Z. Prediction of protein binding regions in disordered proteins. PLoS Comput. Biol. 2009, 5, e1000376. [Google Scholar] [CrossRef] [PubMed] [Green Version]
- Hornbeck, P.V.; Kornhauser, J.M.; Tkachev, S.; Zhang, B.; Skrzypek, E.; Murray, B.; Latham, V.; Sullivan, M. PhosphoSitePlus: A comprehensive resource for investigating the structure and function of experimentally determined post-translational modifications in man and mouse. Nucleic Acids Res. 2012, 40, D261–D270. [Google Scholar] [CrossRef] [PubMed] [Green Version]
- Dayhoff, G.W., 2nd; Uversky, V.N. Rapid prediction and analysis of protein intrinsic disorder. Protein Sci. A Publ. Protein Soc. 2022, 31, e4496. [Google Scholar] [CrossRef]
- Romero, P.; Obradovic, Z.; Li, X.; Garner, E.C.; Brown, C.J.; Dunker, A.K. Sequence complexity of disordered protein. Proteins 2001, 42, 38–48. [Google Scholar] [CrossRef]
- Peng, K.; Radivojac, P.; Vucetic, S.; Dunker, A.K.; Obradovic, Z. Length-dependent prediction of protein intrinsic disorder. BMC Bioinform. 2006, 7, 208. [Google Scholar] [CrossRef] [Green Version]
- Peng, K.; Vucetic, S.; Radivojac, P.; Brown, C.J.; Dunker, A.K.; Obradovic, Z. Optimizing long intrinsic disorder predictors with protein evolutionary information. J. Bioinform. Comput. Biol. 2005, 3, 35–60. [Google Scholar] [CrossRef]
- Xue, B.; Dunbrack, R.L.; Williams, R.W.; Dunker, A.K.; Uversky, V.N. PONDR-FIT: A meta-predictor of intrinsically disordered amino acids. Biochim. Biophys. Acta 2010, 1804, 996–1010. [Google Scholar] [CrossRef] [Green Version]
- Dosztányi, Z.; Csizmok, V.; Tompa, P.; Simon, I. IUPred: Web server for the prediction of intrinsically unstructured regions of proteins based on estimated energy content. Bioinformatics 2005, 21, 3433–3434. [Google Scholar] [CrossRef] [Green Version]
- Dosztanyi, Z.; Csizmok, V.; Tompa, P.; Simon, I. The pairwise energy content estimated from amino acid composition discriminates between folded and intrinsically unstructured proteins. J. Mol. Biol. 2005, 347, 827–839. [Google Scholar] [CrossRef] [PubMed]
- Uversky, V.N.; Gillespie, J.R.; Fink, A.L. Why are “natively unfolded” proteins unstructured under physiologic conditions? Proteins 2000, 41, 415–427. [Google Scholar] [CrossRef]
- Oldfield, C.J.; Cheng, Y.; Cortese, M.S.; Brown, C.J.; Uversky, V.N.; Dunker, A.K. Comparing and combining predictors of mostly disordered proteins. Biochemistry 2005, 44, 1989–2000. [Google Scholar] [CrossRef] [PubMed]
- He, B.; Wang, K.; Liu, Y.; Xue, B.; Uversky, V.N.; Dunker, A.K. Predicting intrinsic disorder in proteins: An overview. Cell Res. 2009, 19, 929–949. [Google Scholar] [CrossRef] [PubMed] [Green Version]
- Xue, B.; Oldfield, C.J.; Dunker, A.K.; Uversky, V.N. CDF it all: Consensus prediction of intrinsically disordered proteins based on various cumulative distribution functions. FEBS Lett. 2009, 583, 1469–1474. [Google Scholar] [CrossRef] [PubMed] [Green Version]
- Huang, F.; Oldfield, C.; Meng, J.; Hsu, W.L.; Xue, B.; Uversky, V.N.; Romero, P.; Dunker, A.K. Subclassifying disordered proteins by the CH-CDF plot method. In Pacific Symposium on Biocomputing; World Scientific: Singapore, 2012; pp. 128–139. [Google Scholar]
- Mohan, A.; Sullivan, W.J., Jr.; Radivojac, P.; Dunker, A.K.; Uversky, V.N. Intrinsic disorder in pathogenic and non-pathogenic microbes: Discovering and analyzing the unfoldomes of early-branching eukaryotes. Mol. Biosyst. 2008, 4, 328–340. [Google Scholar] [CrossRef] [PubMed]
- Huang, F.; Oldfield, C.J.; Xue, B.; Hsu, W.L.; Meng, J.; Liu, X.; Shen, L.; Romero, P.; Uversky, V.N.; Dunker, A. Improving protein order-disorder classification using charge-hydropathy plots. BMC Bioinform. 2014, 15 (Suppl. 17), S4. [Google Scholar] [CrossRef] [Green Version]
- Oates, M.E.; Romero, P.; Ishida, T.; Ghalwash, M.; Mizianty, M.J.; Xue, B.; Dosztanyi, Z.; Uversky, V.N.; Obradovic, Z.; Kurgan, L.; et al. D(2)P(2): Database of disordered protein predictions. Nucleic Acids Res. 2013, 41, D508–D516. [Google Scholar] [CrossRef] [Green Version]
- Ishida, T.; Kinoshita, K. PrDOS: Prediction of disordered protein regions from amino acid sequence. Nucleic Acids Res. 2007, 35, W460–W464. [Google Scholar] [CrossRef] [Green Version]
- Obradovic, Z.; Peng, K.; Vucetic, S.; Radivojac, P.; Dunker, A.K. Exploiting heterogeneous sequence properties improves prediction of protein disorder. Proteins Struct. Funct. Bioinform. 2005, 61, 176–182. [Google Scholar] [CrossRef]
- Walsh, I.; Martin, A.J.; Di Domenico, T.; Tosatto, S.C. ESpritz: Accurate and fast prediction of protein disorder. Bioinformatics 2012, 28, 503–509. [Google Scholar] [CrossRef] [Green Version]
- Szklarczyk, D.; Franceschini, A.; Kuhn, M.; Simonovic, M.; Roth, A.; Minguez, P.; Doerks, T.; Stark, M.; Muller, J.; Bork, P.; et al. The STRING database in 2011: Functional interaction networks of proteins, globally integrated and scored. Nucleic Acids Res. 2011, 39, D561–D568. [Google Scholar] [CrossRef] [PubMed] [Green Version]
- Chu, X.; Sun, T.; Li, Q.; Xu, Y.; Zhang, Z.; Lai, L.; Pei, J. Prediction of liquid-liquid phase separating proteins using machine learning. BMC Bioinform. 2022, 23, 72. [Google Scholar] [CrossRef]
- Conchillo-Solé, O.; de Groot, N.S.; Avilés, F.X.; Vendrell, J.; Daura, X.; Ventura, S. AGGRESCAN: A server for the prediction and evaluation of “hot spots” of aggregation in polypeptides. BMC Bioinform. 2007, 8, 65. [Google Scholar] [CrossRef] [PubMed] [Green Version]
- Thangakani, A.M.; Nagarajan, R.; Kumar, S.; Sakthivel, R.; Velmurugan, D.; Gromiha, M.M. CPAD, Curated Protein Aggregation Database: A Repository of Manually Curated Experimental Data on Protein and Peptide Aggregation. PLoS ONE 2016, 11, e0152949. [Google Scholar] [CrossRef] [PubMed]


| A-Bodies (Heat Shock) | A-Bodies (Acidosis) | nSBs (Heat Shock) | |
|---|---|---|---|
| Proteome size | 164 | 185 | 133 |
| IDPs, % | 72 | 78 | 92 |
| LLPS-related proteins | 33 (20.1%) | 66 (35.7%) | 89 (66.9%) |
| Drivers (FuzDrop) | 65 (39.6%) | 100 (54.1%) | 102 (76.9%) |
| Clients (FuzDrop) | 82 (50%) | 65 (35.1%) | 24 (18%) |
| Aggregation-related proteins | 17 (10.3%) | 14 (7.5%) | 5 (3.8%) |
| Average proteome charge | 0.02 | 0.01 | 0.03 |
| Gene Name (UniProt ID) | PER(VSL2b) | FuzDrop Score | PSPredictor Score | FuzDrop and PSP LLPS | DPRs | Role in MLOs | nHS | Na4vSS | Molecular Function |
|---|---|---|---|---|---|---|---|---|---|
| NCL (P19338) | 86.2 | 0.9872 | 0.941 | + | 7 | driver | 17 | −45.4 | RNA binding |
| HNRNPM (P52272) | 76.3 | 0.9997 | 0.8675 | + | 8 | driver | 18 | −14 | RNA binding |
| CGI-74 (Q9Y383) | 74.49 | 0.9512 | 0.0666 | ± | 3 | driver | 2 | −50.2 | RNA binding |
| HNRNPA0 (Q13151) | 61.97 | 0.9818 | 0.9959 | + | 1 | driver | 5 | −20.5 | RNA binding |
| HNRNPK (P61978) | 56.8 | 0.9031 | 0.2392 | ± | 4 | driver | 9 | −19.7 | RNA binding |
| RBM39 (Q14498) | 51.89 | 0.4127 | 0.5286 | ± | 1 | client | 17 | −18.5 | RNA binding |
| HNRNPH1 (P31943) | 51.22 | 0.9486 | 0.9727 | + | 3 | driver | 9 | −16 | RNA binding |
| HSPA8 (P11142) | 38.7 | 0.3211 | 0.5824 | ± | 2 | client | 17 | −13.8 | RNA binding |
| PPIA (P62937) | 20.61 | 0.2089 | 0.0057 | − | 0 | no | 7 | −6.7 | RNA binding |
| DDX39A (O00148) | 18.27 | 0.1354 | 0.0079 | − | 1 | client | 16 | −4 | RNA binding |
Disclaimer/Publisher’s Note: The statements, opinions and data contained in all publications are solely those of the individual author(s) and contributor(s) and not of MDPI and/or the editor(s). MDPI and/or the editor(s) disclaim responsibility for any injury to people or property resulting from any ideas, methods, instructions or products referred to in the content. |
© 2023 by the authors. Licensee MDPI, Basel, Switzerland. This article is an open access article distributed under the terms and conditions of the Creative Commons Attribution (CC BY) license (https://creativecommons.org/licenses/by/4.0/).
Share and Cite
Mokin, Y.I.; Gavrilova, A.A.; Fefilova, A.S.; Kuznetsova, I.M.; Turoverov, K.K.; Uversky, V.N.; Fonin, A.V. Nucleolar- and Nuclear-Stress-Induced Membrane-Less Organelles: A Proteome Analysis through the Prism of Liquid–Liquid Phase Separation. Int. J. Mol. Sci. 2023, 24, 11007. https://0-doi-org.brum.beds.ac.uk/10.3390/ijms241311007
Mokin YI, Gavrilova AA, Fefilova AS, Kuznetsova IM, Turoverov KK, Uversky VN, Fonin AV. Nucleolar- and Nuclear-Stress-Induced Membrane-Less Organelles: A Proteome Analysis through the Prism of Liquid–Liquid Phase Separation. International Journal of Molecular Sciences. 2023; 24(13):11007. https://0-doi-org.brum.beds.ac.uk/10.3390/ijms241311007
Chicago/Turabian StyleMokin, Yakov I., Anastasia A. Gavrilova, Anna S. Fefilova, Irina M. Kuznetsova, Konstantin K. Turoverov, Vladimir N. Uversky, and Alexander V. Fonin. 2023. "Nucleolar- and Nuclear-Stress-Induced Membrane-Less Organelles: A Proteome Analysis through the Prism of Liquid–Liquid Phase Separation" International Journal of Molecular Sciences 24, no. 13: 11007. https://0-doi-org.brum.beds.ac.uk/10.3390/ijms241311007