
Associations of Glucometabolic Indices with Aortic Stiffness in Patients Undergoing Peritoneal Dialysis with and without Diabetes Mellitus

 ,
,  , , and
Abstract
:1. Introduction
2. Results
3. Discussion
4. Materials and Methods
4.1. Study Design and Population
4.2. BP and Aortic PWV Measurements
4.3. Anthropometric Measurement
4.4. Biochemical Data
4.5. Statistical Analysis
Supplementary Materials
Author Contributions
Funding
Institutional Review Board Statement
Informed Consent Statement
Data Availability Statement
Conflicts of Interest
References
- Cho, Y.; Bello, A.K.; Levin, A.; Lunney, M.; Osman, M.A.; Ye, F.; Ashuntantang, G.E.; Bellorin-Font, E.; Gharbi, M.B.; Davison, S.N. Peritoneal dialysis use and practice patterns: An international survey study. Am. J. Kidney Dis. 2021, 77, 315–325. [Google Scholar] [CrossRef] [PubMed]
- Zazzeroni, L.; Pasquinelli, G.; Nanni, E.; Cremonini, V.; Rubbi, I. Comparison of quality of life in patients undergoing hemodialysis and peritoneal dialysis: A systematic review and meta-analysis. Kidney Blood Press. Res. 2017, 42, 717–727. [Google Scholar] [CrossRef] [PubMed]
- Yeung, E.; Bello, A.; Levin, A.; Lunney, M.; Osman, M.A.; Ye, F.; Ashuntantang, G.; Bellorin-Font, E.; Gharbi, M.B.; Davison, S. Current status of health systems financing and oversight for end-stage kidney disease care: A cross-sectional global survey. BMJ Open 2021, 11, e047245. [Google Scholar] [CrossRef]
- Yang, F.; Liao, M.; Wang, P.; Yang, Z.; Liu, Y. The cost-effectiveness of kidney replacement therapy modalities: A systematic review of full economic evaluations. Appl. Health Econ. Health Policy 2021, 19, 163–180. [Google Scholar] [CrossRef] [PubMed]
- Wong, B.; Ravani, P.; Oliver, M.J.; Holroyd-Leduc, J.; Venturato, L.; Garg, A.X.; Quinn, R.R. Comparison of patient survival between hemodialysis and peritoneal dialysis among patients eligible for both modalities. Am. J. Kidney Dis. 2018, 71, 344–351. [Google Scholar] [CrossRef] [PubMed]
- Fortes, P.C.; de Moraes, T.P.; Mendes, J.G.; Stinghen, A.E.; Ribeiro, S.C.; Pecoits-Filho, R. Insulin resistance and glucose homeostasis in peritoneal dialysis. Perit. Dial. Int. 2009, 29, 145–148. [Google Scholar] [CrossRef]
- Wang, I.-K.; Lin, C.-L.; Chen, H.-C.; Lin, S.-Y.; Chang, C.-T.; Yen, T.-H.; Sung, F.-C. Risk of new-onset diabetes in end-stage renal disease patients undergoing dialysis: Analysis from registry data of Taiwan. Nephrol. Dial. Transpl. 2018, 33, 670–675. [Google Scholar] [CrossRef]
- Cozzolino, M.; Mangano, M.; Stucchi, A.; Ciceri, P.; Conte, F.; Galassi, A. Cardiovascular disease in dialysis patients. Nephrol. Dial Transpl. 2018, 33, iii28–iii34. [Google Scholar] [CrossRef]
- Yao, Q.; Pecoits-Filho, R.; Lindholm, B.; Stenvinkel, P. Traditional and non-traditional risk factors as contributors to atherosclerotic cardiovascular disease in end-stage renal disease. Scand. J. Urol. Nephrol. 2004, 38, 405–416. [Google Scholar] [CrossRef]
- London, G.M. Arterial stiffness in chronic kidney disease and end-stage renal disease. Blood Purif. 2018, 45, 154–158. [Google Scholar] [CrossRef]
- Tatar, E.; Demirci, M.S.; Kircelli, F.; Gungor, O.; Turan, M.N.; Sevinc Ok, E.; Asci, G.; Ozkahya, M.; Ok, E. Association of insulin resistance with arterial stiffness in nondiabetic peritoneal dialysis patients. Int. Urol. Nephrol. 2012, 44, 255–262. [Google Scholar] [CrossRef] [PubMed]
- Mac-Way, F.; Couture, V.; Utescu, M.S.; Ignace, S.; De Serres, S.A.; Loignon, R.C.; Marquis, K.; Larivière, R.; Agharazii, M. Advanced glycation end products, aortic stiffness, and wave reflection in peritoneal dialysis as compared to hemodialysis. Int. Urol. Nephrol. 2014, 46, 817–824. [Google Scholar] [CrossRef] [PubMed]
- Milan, A.; Zocaro, G.; Leone, D.; Tosello, F.; Buraioli, I.; Schiavone, D.; Veglio, F. Current assessment of pulse wave velocity: Comprehensive review of validation studies. J. Hypertens. 2019, 37, 1547–1557. [Google Scholar] [CrossRef] [PubMed]
- Vlachopoulos, C.; Aznaouridis, K.; Stefanadis, C. Prediction of cardiovascular events and all-cause mortality with arterial stiffness: A systematic review and meta-analysis. J. Am. Coll. Cardiol. 2010, 55, 1318–1327. [Google Scholar] [CrossRef]
- Szeto, C.-C.; Chow, K.-M.; Kwan, B.C.-H.; Chung, K.-Y.; Leung, C.-B.; Li, P.K.-T. New-onset hyperglycemia in nondiabetic Chinese patients started on peritoneal dialysis. Am. J. Kidney Dis. 2007, 49, 524–532. [Google Scholar] [CrossRef]
- Xue, C.; Gu, Y.-Y.; Cui, C.-J.; Zhou, C.-C.; Wang, X.-D.; Ruan, M.-N.; Huang, L.-X.; Chen, S.-X.; Yang, B.; Chen, X.-J.; et al. New-onset glucose disorders in peritoneal dialysis patients: A meta-analysis and systematic review. Nephrol. Dial. Transpl. 2019, 35, 1412–1419. [Google Scholar] [CrossRef] [PubMed]
- Jiang, N.; Qian, J.; Lin, A.; Lindholm, B.; Axelsson, J.; Yao, Q. Initiation of glucose-based peritoneal dialysis is associated with increased prevalence of metabolic syndrome in non-diabetic patients with end-stage renal disease. Blood Purif. 2008, 26, 423–428. [Google Scholar] [CrossRef]
- Taniwaki, H.; Kawagishi, T.; Emoto, M.; Shoji, T.; Kanda, H.; Maekawa, K.; Nishizawa, Y.; Morii, H. Correlation between the intima-media thickness of the carotid artery and aortic pulse-wave velocity in patients with type 2 diabetes. Vessel wall properties in type 2 diabetes. Diabetes Care 1999, 22, 1851–1857. [Google Scholar] [CrossRef]
- Cardoso, C.R.L.; Salles, G.F. Aortic stiffness as a surrogate endpoint to micro- and macrovascular complications in patients with type 2 diabetes. Int. J. Mol. Sci. 2016, 17, 2044. [Google Scholar] [CrossRef]
- McEniery, C.M.; Wilkinson, I.B.; Johansen, N.B.; Witte, D.R.; Singh-Manoux, A.; Kivimaki, M.; Tabak, A.G.; Brunner, E.J.; Shipley, M.J. Nondiabetic glucometabolic status and progression of aortic stiffness: The whitehall II study. Diabetes Care 2017, 40, 599–606. [Google Scholar] [CrossRef]
- Markus, M.R.P.; Rospleszcz, S.; Ittermann, T.; Baumeister, S.E.; Schipf, S.; Siewert-Markus, U.; Lorbeer, R.; Storz, C.; Ptushkina, V.; Peters, A. Glucose and insulin levels are associated with arterial stiffness and concentric remodeling of the heart. Cardiovasc. Diabetol. 2019, 18, 145. [Google Scholar] [CrossRef] [PubMed]
- Wu, Y.; Yu, J.; Jin, C.; Li, Y.; Su, J.; Wei, G.; Zheng, X.; Gao, J.; Gao, W.; Wu, S. Longitudinal fasting blood glucose patterns and arterial stiffness risk in a population without diabetes. PLoS ONE 2017, 12, e0188423. [Google Scholar] [CrossRef] [PubMed]
- Chen, K.H.; Lin, J.L.; Hung, C.C.; Lin-Tan, D.T.; Weng, S.M.; Yen, T.H.; Hsu, C.W.; Yang, C.W. Impaired fasting glucose association with mortality in nondiabetic patients on maintenance peritoneal dialysis. Am. J. Med. Sci. 2011, 341, 312–317. [Google Scholar] [CrossRef] [PubMed]
- Nakashima, A.; Kato, K.; Ohkido, I.; Yokoo, T. Role and treatment of insulin resistance in patients with chronic kidney disease: A review. Nutrients 2021, 13, 4349. [Google Scholar] [CrossRef] [PubMed]
- Hill, M.A.; Yang, Y.; Zhang, L.; Sun, Z.; Jia, G.; Parrish, A.R.; Sowers, J.R. Insulin resistance, cardiovascular stiffening and cardiovascular disease. Metabolism 2021, 119, 154766. [Google Scholar] [CrossRef] [PubMed]
- Jia, G.; Aroor, A.R.; DeMarco, V.G.; Martinez-Lemus, L.A.; Meininger, G.A.; Sowers, J.R. Vascular stiffness in insulin resistance and obesity. Front. Physiol. 2015, 6, 231. [Google Scholar] [CrossRef] [PubMed]
- Banerjee, D.; Recio-Mayoral, A.; Chitalia, N.; Kaski, J.C. Insulin resistance, inflammation, and vascular disease in nondiabetic predialysis chronic kidney disease patients. Clin. Cardiol. 2011, 34, 360–365. [Google Scholar] [CrossRef]
- Shinohara, K.; Shoji, T.; Tsujimoto, Y.; Kimoto, E.; Tahara, H.; Koyama, H.; Emoto, M.; Ishimura, E.; Miki, T.; Tabata, T.; et al. Arterial stiffness in predialysis patients with uremia. Kidney Int. 2004, 65, 936–943. [Google Scholar] [CrossRef]
- Zhou, Y.; Yu, Z.; Jia, H.; Sun, F.; Ma, L.; Guo, R.; Peng, L.; Cui, T. Association between insulin resistance and carotid arterial stiffness in nondiabetic hemodialysis patients. Blood Purif. 2009, 28, 193–199. [Google Scholar] [CrossRef]
- Yoon, C.-Y.; Lee, M.J.; Kee, Y.K.; Lee, E.; Joo, Y.S.; Han, I.M.; Han, S.G.; Oh, H.J.; Park, J.T.; Han, S.H. Insulin resistance is associated with new-onset cardiovascular events in nondiabetic patients undergoing peritoneal dialysis. Kidney Res. Clin. Pract. 2014, 33, 192–198. [Google Scholar] [CrossRef]
- Li, Y.; Zhang, L.; Gu, Y.; Hao, C.; Zhu, T. Insulin resistance as a predictor of cardiovascular disease in patients on peritoneal dialysis. Perit. Dial. Int. 2013, 33, 411–418. [Google Scholar] [CrossRef] [PubMed]
- Briet, M.; Boutouyrie, P.; Laurent, S.; London, G.M. Arterial stiffness and pulse pressure in CKD and ESRD. Kidney Int. 2012, 82, 388–400. [Google Scholar] [CrossRef]
- Georgianos, P.I.; Pikilidou, M.I.; Liakopoulos, V.; Balaskas, E.V.; Zebekakis, P.E. Arterial stiffness in end-stage renal disease—Pathogenesis, clinical epidemiology, and therapeutic potentials. Hypertens. Res. 2018, 41, 309–319. [Google Scholar] [CrossRef]
- Sevinc Ok, E.; Asci, G.; Kircelli, F.; Duman, S.; Dheir, H.; Sezis Demirci, M.; Ozkahya, M.; Toz, H.; Ok, E. Relationship between glucose exposure via peritoneal dialysis solutions and coronary artery calcification in non-diabetic peritoneal dialysis patients. Int. Urol. Nephrol. 2012, 44, 1847–1853. [Google Scholar] [CrossRef] [PubMed]
- Lu, Q.; Cheng, L.-T.; Wang, T.; Wan, J.; Liao, L.-L.; Zeng, J.; Qin, C.; Li, K.-J. Visceral fat, arterial stiffness, and endothelial function in peritoneal dialysis patients. J. Ren. Nutr. 2008, 18, 495–502. [Google Scholar] [CrossRef] [PubMed]
- McIntyre, N.J.; Chesterton, L.J.; John, S.G.; Jefferies, H.J.; Burton, J.O.; Taal, M.W.; Fluck, R.J.; McIntyre, C.W. Tissue-advanced glycation end product concentration in dialysis patients. Clin. J. Am. Soc. Nephrol. 2010, 5, 51–55. [Google Scholar] [CrossRef]
- Gelžinský, J.; Mayer, O., Jr.; Seidlerová, J.; Mateřánková, M.; Mareš, Š.; Kordíkova, V.; Trefil, L.; Cífková, R.; Filipovský, J. Serum biomarkers, skin autofluorescence and other methods. Which parameter better illustrates the relationship between advanced glycation end products and arterial stiffness in the general population? Hypertens. Res. 2021, 44, 518–527. [Google Scholar] [CrossRef]
- Wen, Y.; Guo, Q.; Yang, X.; Wu, X.; Feng, S.; Tan, J.; Xu, R.; Yu, X. High glucose concentrations in peritoneal dialysate are associated with all-cause and cardiovascular disease mortality in continuous ambulatory peritoneal dialysis patients. Perit. Dial. Int. 2015, 35, 70–77. [Google Scholar] [CrossRef]
- Sujimongkol, C.; Pongskul, C.; Promthet, S. Regimen-related mortality risk in patients undergoing peritoneal dialysis using hypertonic glucose solution: A retrospective cohort study. J. Prev. Med. Public Health 2018, 51, 205–212. [Google Scholar] [CrossRef]
- Goossen, K.; Becker, M.; Marshall, M.R.; Bühn, S.; Breuing, J.; Firanek, C.A.; Hess, S.; Nariai, H.; Sloand, J.A.; Yao, Q.; et al. Icodextrin versus glucose solutions for the once-daily long dwell in peritoneal dialysis: An enriched systematic review and meta-analysis of randomized controlled trials. Am. J. Kidney Dis. 2020, 75, 830–846. [Google Scholar] [CrossRef]
- Khan, S.F.; Ronco, C.; Rosner, M.H. Counteracting the metabolic effects of glucose load in peritoneal dialysis patients; an exercise-based approach. Blood Purif. 2019, 48, 25–31. [Google Scholar] [CrossRef] [PubMed]
- Van Bortel, L.M.; Laurent, S.; Boutouyrie, P.; Chowienczyk, P.; Cruickshank, J.; De Backer, T.; Filipovsky, J.; Huybrechts, S.; Mattace-Raso, F.U.; Protogerou, A.D. Expert consensus document on the measurement of aortic stiffness in daily practice using carotid-femoral pulse wave velocity. J. Hypertens. 2012, 30, 445–448. [Google Scholar] [CrossRef] [PubMed]
- Radziuk, J. Insulin sensitivity and its measurement: Structural commonalities among the methods. J. Clin. Endocrinol. Metab. 2000, 85, 4426–4433. [Google Scholar] [CrossRef] [PubMed]
- Nolph, K.D.; Moore, H.L.; Twardowski, Z.J.; Khanna, R.; Prowant, B.; Meyer, M.; Ponferrada, L. Cross-sectional assessment of weekly urea and creatinine clearances in patients on continuous ambulatory peritoneal dialysis. ASAIO J. (Am. Soc. Artif. Int. Organs 1992) 1992, 38, M139–M142. [Google Scholar] [CrossRef]


| Characteristics | All Patients (n = 172) | Non-DM | DM (n = 62) | p | |
|---|---|---|---|---|---|
| Normal Fasting Glucose (n = 58) | Impaired Fasting Glucose (n = 52) | ||||
| Demographics | |||||
| Age (years) | 58.3 ± 13.5 | 51.4 ± 14.7 | 62.2 ± 12.7 a | 61.7 ± 10.1 b | <0.001 * |
| Female, n (%) | 95 (55.2) | 33 (56.9) | 31 (59.6) | 31 (50.0) | 0.561 |
| PD duration (months) | 49 (23–86) | 50 (27–78) | 57 (27–106) | 35 (19–71) | 0.063 |
| Hypertension, n (%) | 133 (77.3) | 47 (81.0) | 38 (73.1) | 48 (77.4) | 0.609 |
| Hyperlipidemia, n (%) Atrial fibrillation n (%) | 91 (52.9) 5 (2.9%) | 30 (51.7) 1 (1.7%) | 26 (50.0) 3 (5.8%) | 35 (56.5) 1 (1.6%) | 0.770 0.339 |
| Modality, n (%) | |||||
| CAPD | 66 (38.4) | 20 (34.5) | 22 (42.3) | 24 (38.7) | 0.700 |
| APD or CCPD | 106 (61.6) | 38 (65.5) | 30 (57.7) | 38 (61.3) | |
| PET status, n (%) | |||||
| High or high average | 100 (58.1) | 34 (58.6) | 33 (63.5) | 33 (53.2) | 0.542 |
| Low or low average | 72 (41.9) | 24 (41.4) | 19 (36.5) | 29 (46.8) | |
| Examination | |||||
| Weight (kg) | 64.4 ± 14.1 | 63.9 ± 13.4 | 61.7 ± 13.9 | 67.1 ± 14.5 | 0.114 |
| BMI (kg/m2) | 24.8 ± 3.9 | 24.5 ± 4.0 | 24.2 ± 3.9 | 25.7 ± 3.8 | 0.080 |
| WC (cm) | 92.0 ± 10.4 | 90.2 ± 9.6 | 90.5 ± 9.5 | 95.0 ± 11.2 b | 0.017 * |
| Systolic BP (mmHg) | 149 ± 23 | 144 ± 22 | 144 ± 24 | 156 ± 21 b,c | 0.005 * |
| Diastolic BP (mmHg) | 85 ± 15 | 87 ± 16 | 85 ± 15 | 83 ± 14 | 0.360 |
| Glycemic parameters | |||||
| Fasting glucose (mg/dL) | 105 (95–135) | 92 (90–96) | 107 (104–116) a | 145 (128–180) b,c | <0.001 * |
| Insulin level (ng/mL) | 0.67 (0.40–1.03) | 0.71 (0.40–1.29) | 0.67 (0.51–1.00) | 0.65 (0.38–0.93) | 0.556 |
| HOMA-IR | 5.6 (3.7–8.9) | 4.7 (2.6–8.7) | 5.1 (4.1–7.6) | 6.7 (4.2–10.3) b | 0.023 * |
| AGEs (ng/mL) ¶ | 2.5 (0.7–12.2) | 4.2 (0.7–30.0) | 2.0 (0.6–7.6) | 2.5 (0.7–10.1) | 0.219 |
| PD glucose load (g/day) | 136 (118–182) | 145 (118–182) | 136 (103–163) | 136 (125–182) | 0.105 |
| PD calorie load (Kcal/day) | 250 (201–312) | 265 (201–323) | 228 (176–302) | 265 (202–302) | 0.318 |
| Laboratory data | |||||
| Total cholesterol (mg/dL) | 172 ± 48 | 175 ± 44 | 180 ± 51 | 162 ± 49 | 0.121 |
| Hemoglobin (g/dL) | 9.8 (8.9–10.6) | 9.8 (8.5–10.8) | 9.2 (8.4–10.0) | 10.2 (9.3–11.0) c | 0.002 * |
| Albumin (g/dL) | 3.6 (3.4–3.8) | 3.6 (3.4–3.8) | 3.6 (3.3–3.9) | 3.6 (3.4–3.8) | 0.922 |
| Total Kt/V | 2.1 (1.8–2.3) | 2.1 (1.9–2.3) | 2.1 (1.8–2.3) | 2.0 (1.8–2.2) | 0.044 * |
| Total Ca, corrected (mg/dL) | 9.6 ± 0.8 | 9.6 ± 0.8 | 9.6 ± 0.7 | 9.7 ± 0.7 | 0.603 |
| Phosphorus (mg/dL) | 5.2 ± 1.3 | 5.6 ± 1.4 | 5.0 ± 1.3 a | 5.0 ± 1.2 b | 0.011 * |
| Ca × P (mg2/dL2) | 50.2 ± 13.4 | 53.8 ± 14.4 | 48.2 ± 13.4 | 48.4 ± 11.8 | 0.039 * |
| Intact PTH (pg/mL) | 237 (91–485) | 269 (117–623) | 254 (85–467) | 209 (82–350) | 0.430 |
| Medications, n (%) | |||||
| ACEIs or ARBs | 105 (61.0) | 34 (58.6) | 28 (53.8) | 43 (69.4) | 0.215 |
| CCBs | 99 (57.6) | 30 (51.7) | 30 (57.7) | 39 (62.9) | 0.465 |
| Calcium carbonate | 117 (68.0) | 42 (72.4) | 32 (61.5) | 43 (69.4) | 0.456 |
| Vitamin D | 39 (22.7) | 17 (29.3) | 13 (25.0) | 9 (14.5) | 0.137 |
| Statins | 52 (30.2) | 13 (22.4) | 17 (32.7) | 22 (35.5) | 0.267 |
| Icodextrin | 132 (76.7) | 38 (65.5) | 40 (76.9) | 54 (87.1) b | 0.020 * |
| Variables | Aortic PWV (m/s) | |||
|---|---|---|---|---|
| Unadjusted | Adjusted | |||
| β (95% CI) | p | β (95% CI) | p | |
| Fasting glucose | ||||
| Normal (<100 mg/dL) | Reference | 0.004 * | Reference | 0.046 * |
| Impaired (≥100 mg/dL) | 0.76 (0.25, 1.27) | 0.52 (0.01, 1.03) | ||
| HOMA-IR status | ||||
| Low (≤4.91) | Reference | 0.007 * | Reference | 0.015 * |
| High (>4.91) | 0.71 (0.20, 1.23) | 0.60 (0.12, 1.08) | ||
| Serum AGE level ¶ | ||||
| Low (≤2.5 ng/mL) | Reference | 0.667 | Reference | 0.777 |
| High (>2.5 ng/mL) | 0.12 (−0.42, 0.65) | 0.07 (−0.43, 0.57) | ||
| PD glucose load | ||||
| Low (≤136 g/day) | Reference | 0.010 * | Reference | 0.023 * |
| High (>136 g/day) | 0.68 (0.16, 1.20) | 0.58 (0.08, 1.08) | ||
| Icodextrin | ||||
| Non-user | Reference | 0.615 | Reference | 0.739 |
| User | −0.15 (−0.73, 0.44) | −0.09 (−0.63, 0.45) | ||
| Variables | Aortic PWV (m/s) | |||
|---|---|---|---|---|
| Unadjusted | Adjusted | |||
| β (95% CI) | p | β (95% CI) | p | |
| HbA1c (%) | ||||
| ≤7% | Reference | 0.161 | Reference | 0.362 |
| >7% | −0.69 (−1.67, 0.29) | −0.48 (−1.52, 0.57) | ||
| HOMA-IR status | ||||
| Low (≤6.66) | Reference | 0.483 | Reference | 0.860 |
| High (>6.66) | −0.34 (−1.29, 0.62) | 0.09 (−0.92, 1.09) | ||
| Serum AGE level ¶ | ||||
| Low (≤2.5 ng/mL) | Reference | 0.849 | Reference | 0.628 |
| High (>2.5 ng/mL) | 0.09 (−0.86, 1.05) | −0.24 (−1.24, 0.76) | ||
| PD glucose load | ||||
| Low (≤136 g/day) | Reference | 0.213 | Reference | 0.551 |
| High (>136 g/day) | 0.59 (−0.35, 1.54) | 0.36 (−0.85, 1.57) | ||
| Icodextrin | ||||
| Non-user | Reference | 0.390 | Reference | 0.667 |
| User | 0.61 (−0.80, 2.03) | 0.32 (−1.18, 1.83) | ||
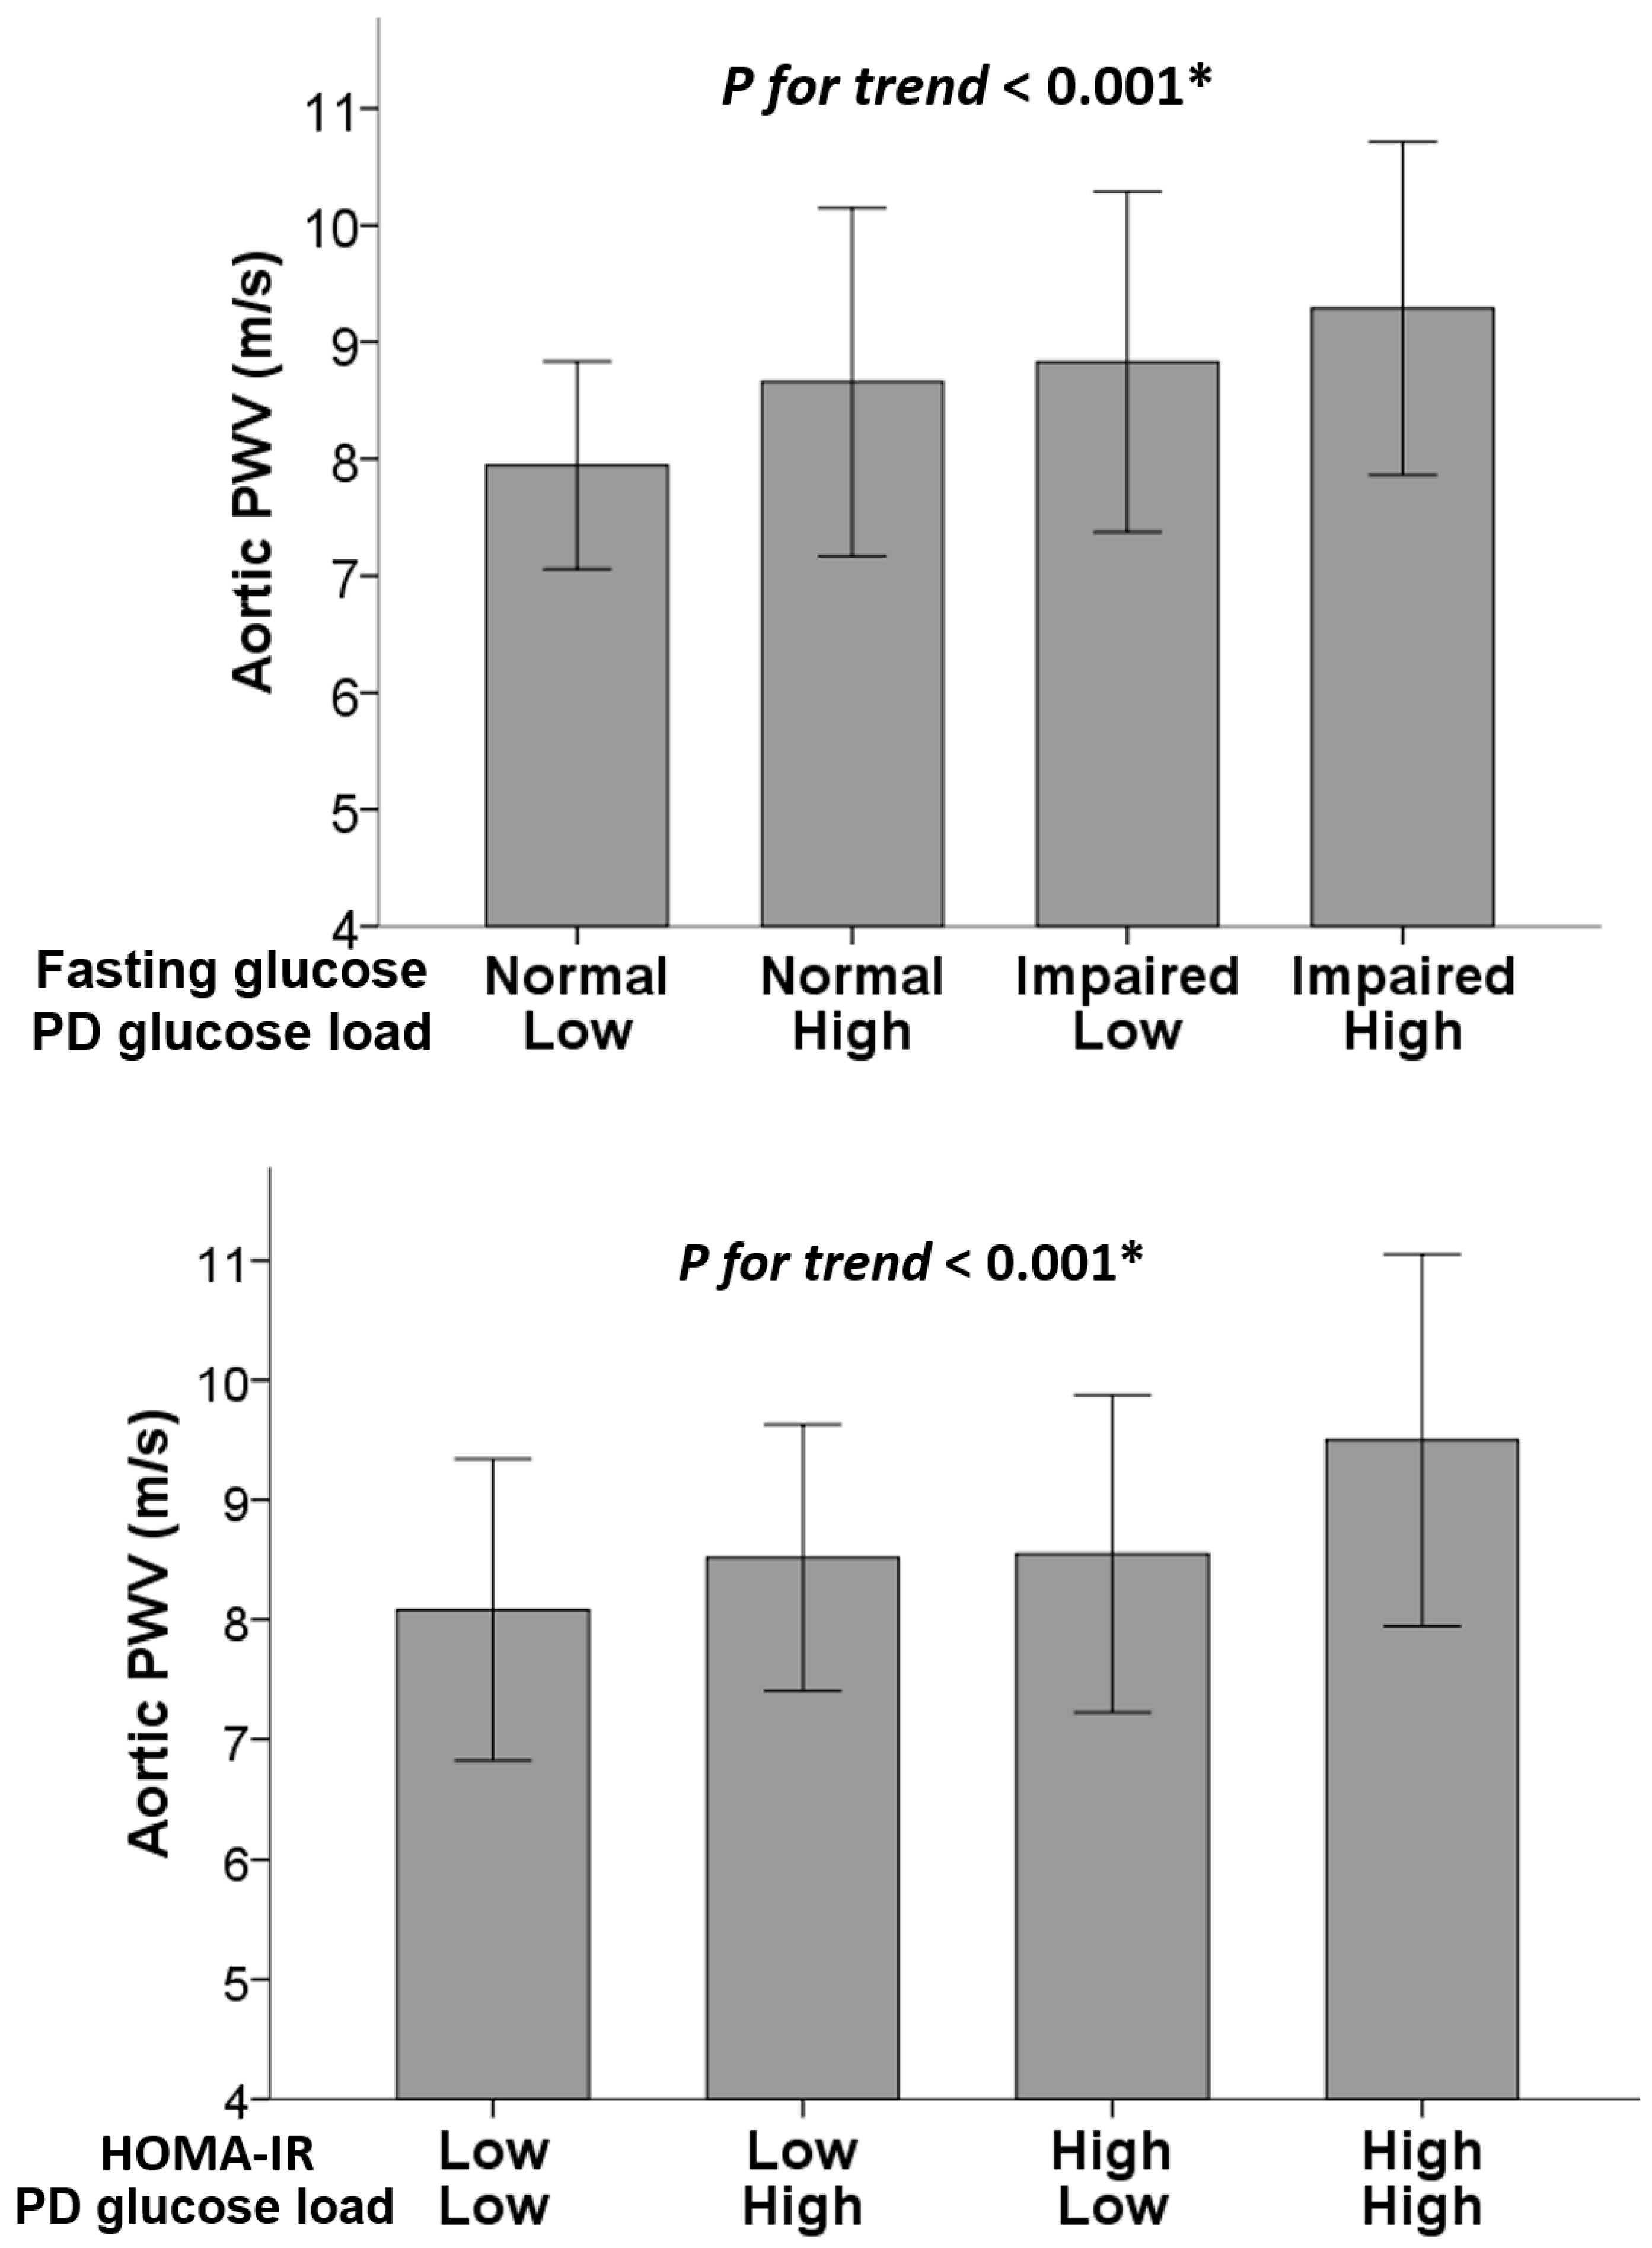
| Group | N | Aortic PWV (m/s) | ||||
| Fasting Glucose | PD Glucose Load | Unadjusted | Adjusted | |||
| β (95% CI) | p for trend | β (95% CI) | p for trend | |||
| Normal | Low | 29 | Reference | <0.001 * | Reference | 0.012 * |
| Normal | High | 29 | 0.71 (0.02, 1.41) | 0.72 (0.07, 1.37) | ||
| Impaired | Low | 26 | 0.89 (0.17, 1.60) | 0.79 (0.12, 1.45) | ||
| Impaired | High | 26 | 1.34 (0.63, 2.06) | 0.84 (0.16, 1.51) | ||
| HOMA-IR | PD glucose load | N | Unadjusted | Adjusted | ||
| β (95% CI) | p for trend | β (95% CI) | p for trend | |||
| Low | Low | 27 | Reference | <0.001 * | Reference | 0.001 * |
| Low | High | 28 | 0.44 (−0.27, 1.14) | 0.51 (−0.18, 1.19) | ||
| High | Low | 28 | 0.47 (−0.24, 1.18) | 0.52 (−0.14, 1.19) | ||
| High | High | 27 | 1.42 (0.71, 2.13) | 1.33 (0.62, 2.05) | ||
Disclaimer/Publisher’s Note: The statements, opinions and data contained in all publications are solely those of the individual author(s) and contributor(s) and not of MDPI and/or the editor(s). MDPI and/or the editor(s) disclaim responsibility for any injury to people or property resulting from any ideas, methods, instructions or products referred to in the content. |
© 2023 by the authors. Licensee MDPI, Basel, Switzerland. This article is an open access article distributed under the terms and conditions of the Creative Commons Attribution (CC BY) license (https://creativecommons.org/licenses/by/4.0/).
Share and Cite
Tang, C.-C.; Tsai, J.-P.; Chen, Y.-H.; Hung, S.-C.; Lin, Y.-L.; Hsu, B.-G. Associations of Glucometabolic Indices with Aortic Stiffness in Patients Undergoing Peritoneal Dialysis with and without Diabetes Mellitus. Int. J. Mol. Sci. 2023, 24, 17094. https://0-doi-org.brum.beds.ac.uk/10.3390/ijms242317094
Tang C-C, Tsai J-P, Chen Y-H, Hung S-C, Lin Y-L, Hsu B-G. Associations of Glucometabolic Indices with Aortic Stiffness in Patients Undergoing Peritoneal Dialysis with and without Diabetes Mellitus. International Journal of Molecular Sciences. 2023; 24(23):17094. https://0-doi-org.brum.beds.ac.uk/10.3390/ijms242317094
Chicago/Turabian StyleTang, Chi-Chong, Jen-Pi Tsai, Yi-Hsin Chen, Szu-Chun Hung, Yu-Li Lin, and Bang-Gee Hsu. 2023. "Associations of Glucometabolic Indices with Aortic Stiffness in Patients Undergoing Peritoneal Dialysis with and without Diabetes Mellitus" International Journal of Molecular Sciences 24, no. 23: 17094. https://0-doi-org.brum.beds.ac.uk/10.3390/ijms242317094