
Target Selection for T-Cell Therapy in Epithelial Ovarian Cancer: Systematic Prioritization of Self-Antigens
 , , , , and
Abstract
:1. Introduction
2. Results
2.1. Identification of Potential TAAs for EOC Therapy
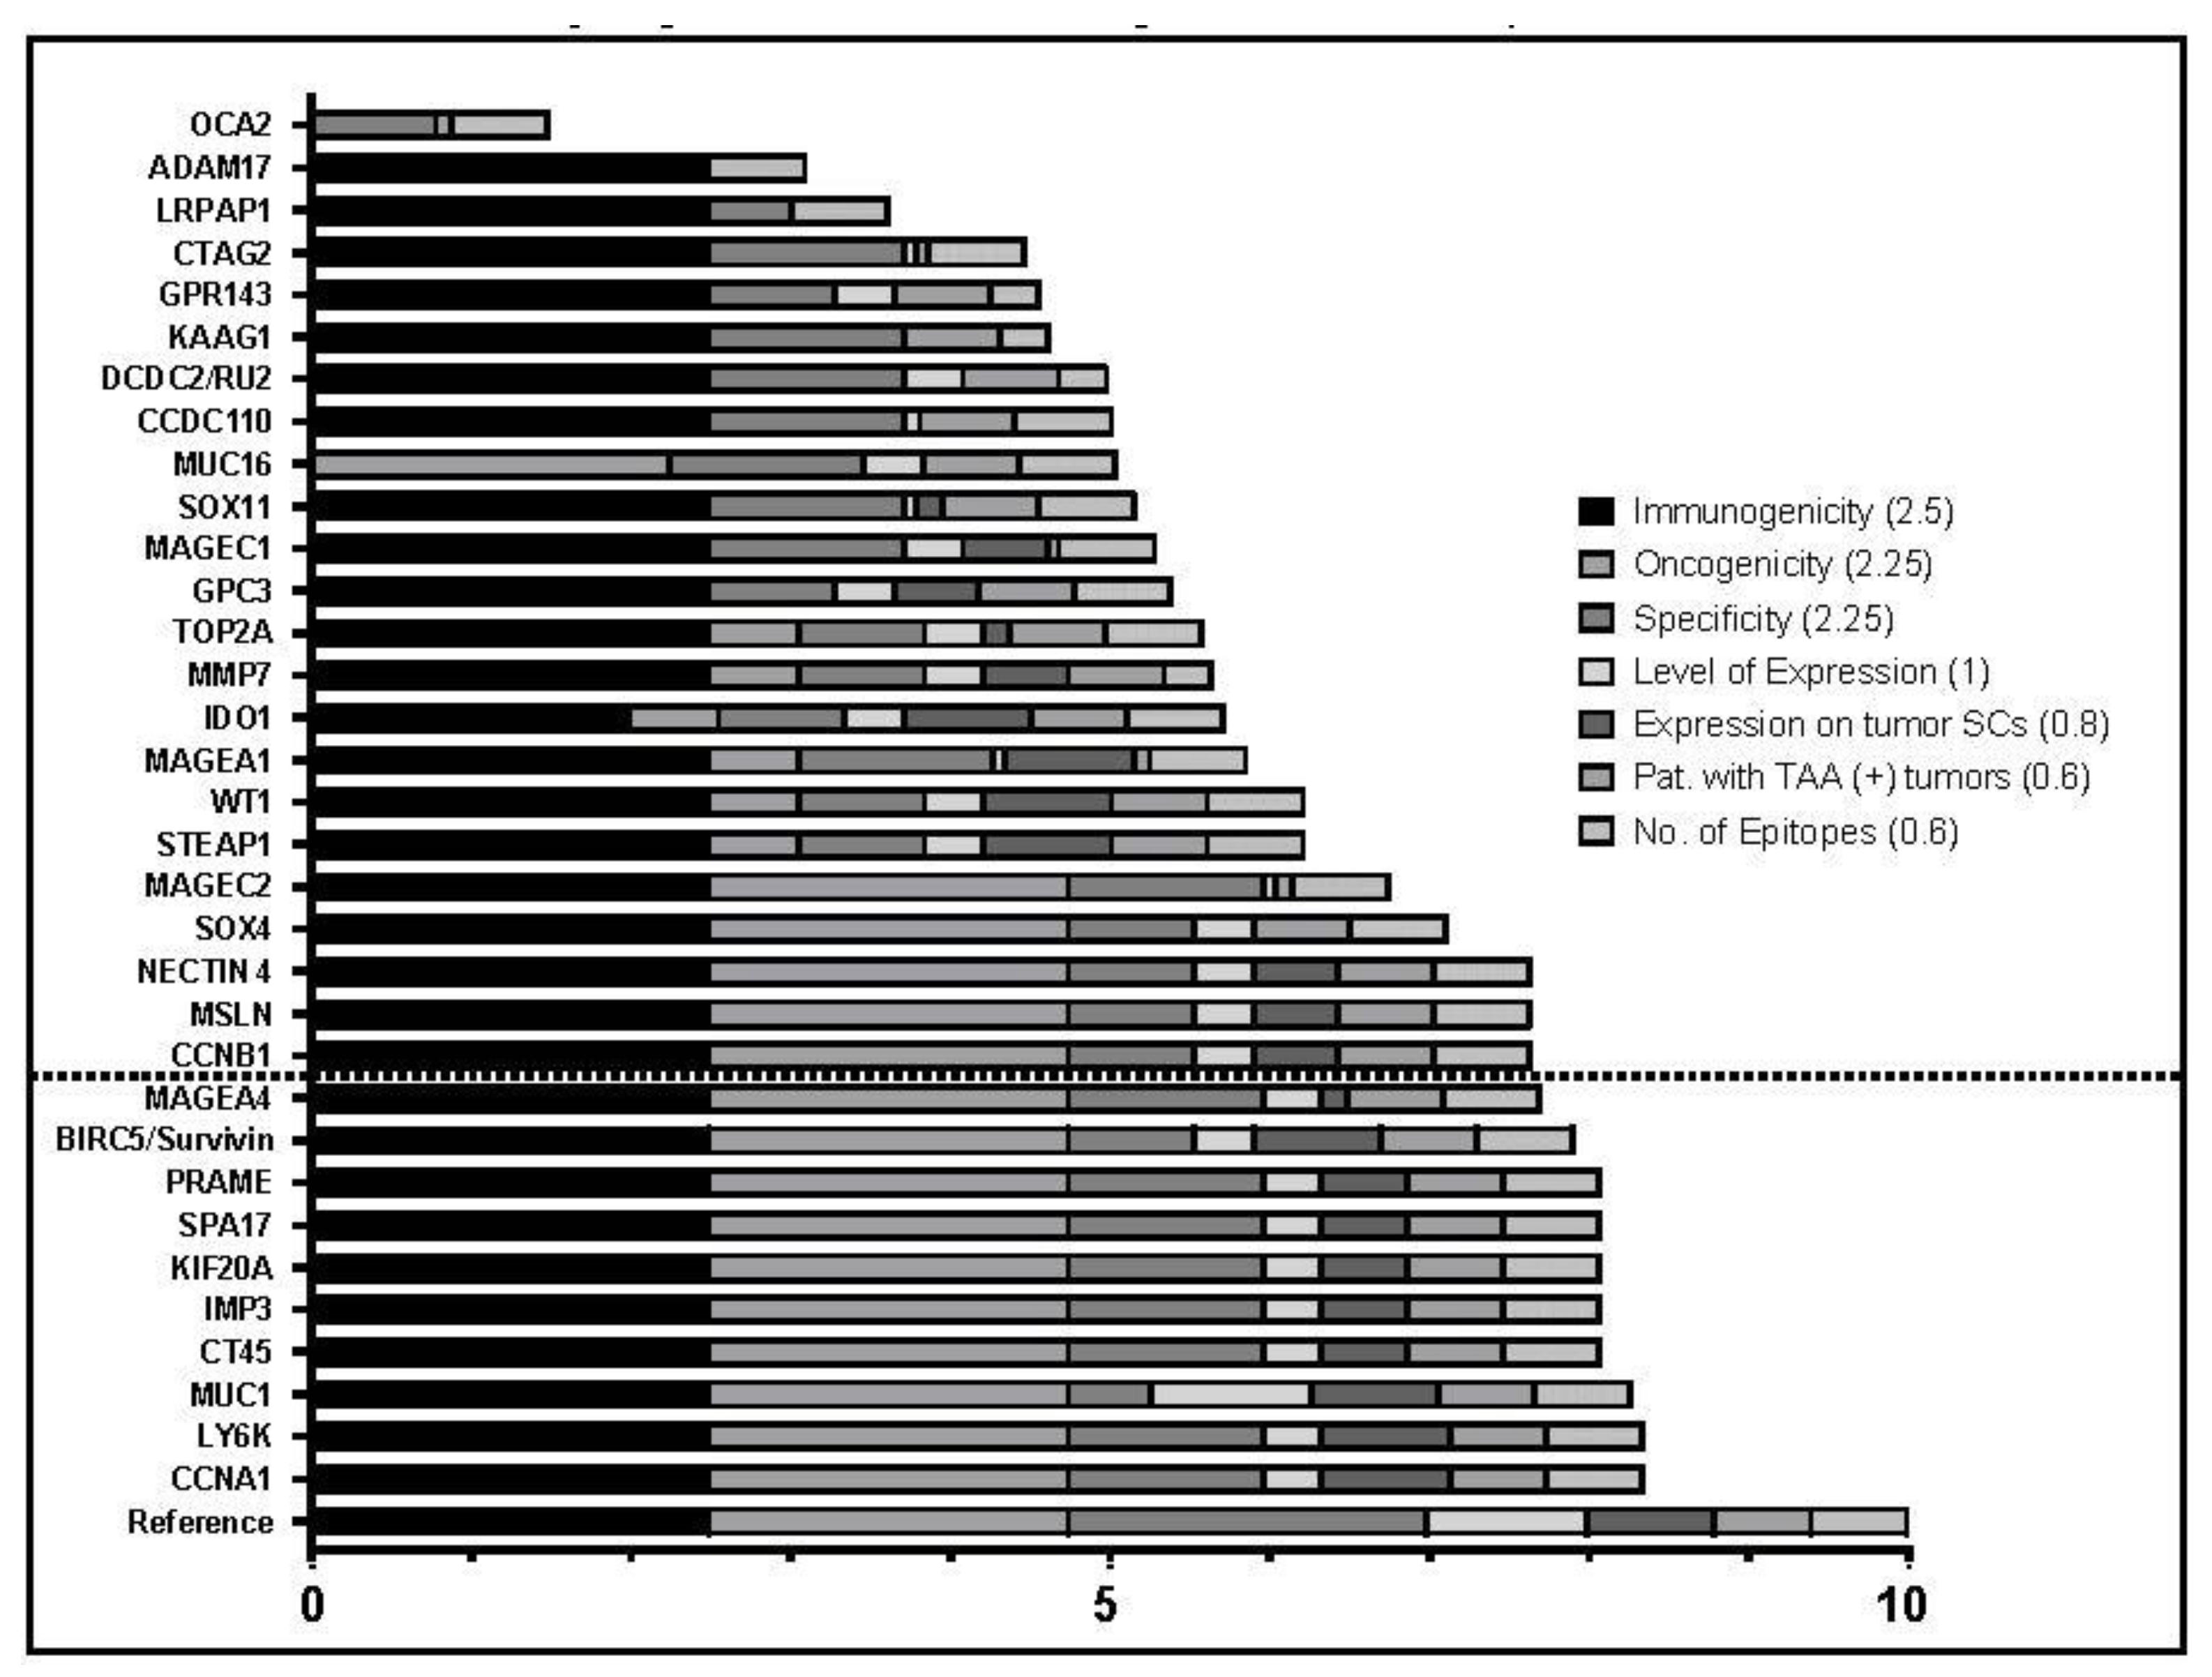
2.2. Evaluation and Prioritization of TAAs
2.3. TAA Protein Expression in Clinical Specimen
2.4. KIF20A Has a Wide Array of MHC-Presented Epitopes
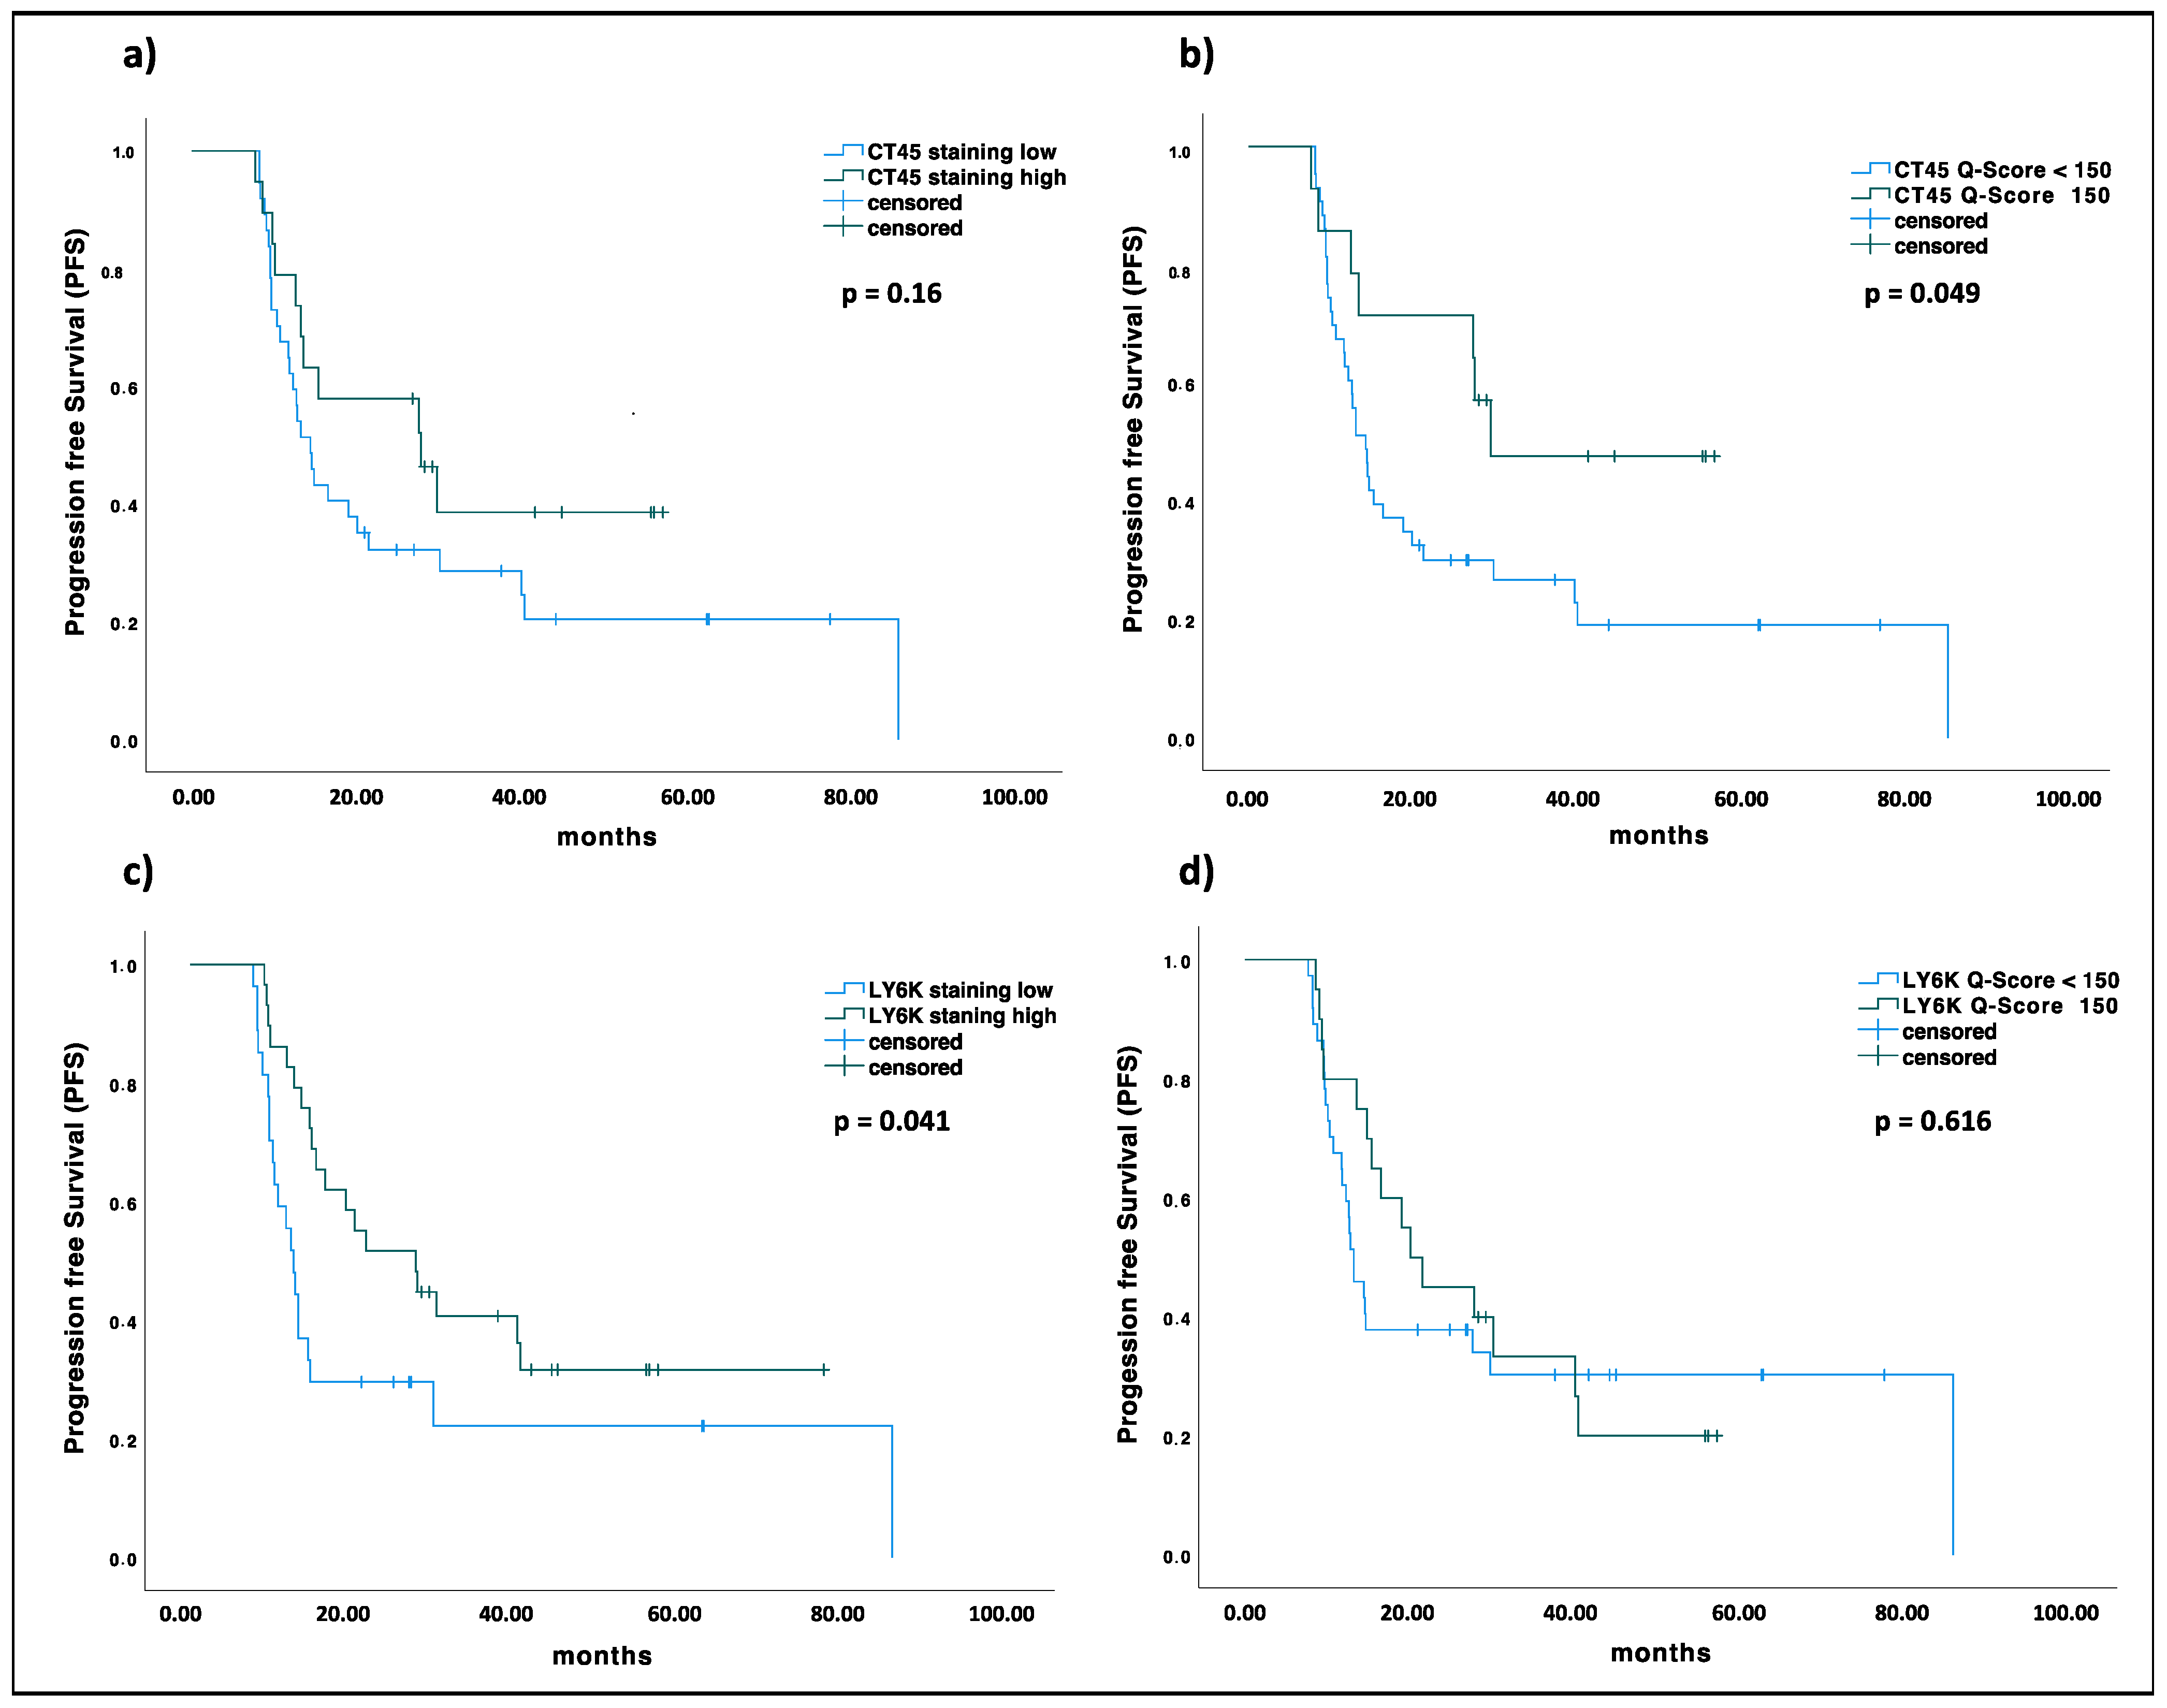
2.5. KIF20A, CT45, and LY6K Are Prognostic Markers in EOC


2.6. LY6K Is Differentially Expressed in EOCs with Mesenchymal Molecular Subtype
3. Discussion
4. Materials and Methods
4.1. Identification of Candidate TAAs
4.2. Prioritization of Candidate TAAs
4.3. HLA-Ligandome Data
4.4. Patients and Clinicopathological Features
4.5. Analysis of TAA Expression by IHC
4.6. Molecular Subtype Analysis
4.7. Statistics
Supplementary Materials
Author Contributions
Funding
Institutional Review Board Statement
Informed Consent Statement
Data Availability Statement
Acknowledgments
Conflicts of Interest
References
- Bray, F.; Ferlay, J.; Soerjomataram, I.; Siegel, R.L.; Torre, L.A.; Jemal, A. Global cancer statistics 2018: GLOBOCAN estimates of incidence and mortality worldwide for 36 cancers in 185 countries. CA Cancer J. Clin. 2018, 68, 394–424. [Google Scholar] [CrossRef] [Green Version]
- Gao, C.; Yao, H.; Liu, H.; Feng, Y.; Yang, Z. TM4SF1 is a potential target for anti-invasion and metastasis in ovarian cancer. BMC Cancer 2019, 19, 237. [Google Scholar] [CrossRef] [PubMed] [Green Version]
- Torre, L.A.; Trabert, B.; DeSantis, C.E.; Miller, K.D.; Samimi, G.; Runowicz, C.D.; Gaudet, M.M.; Jemal, A.; Siegel, R.L. Ovarian cancer statistics, 2018. CA Cancer J. Clin. 2018, 68, 284–296. [Google Scholar] [CrossRef] [PubMed] [Green Version]
- Jessmon, P.; Boulanger, T.; Zhou, W.; Patwardhan, P. Epidemiology and treatment patterns of epithelial ovarian cancer. Expert Rev. Anticancer Ther. 2017, 17, 427–437. [Google Scholar] [CrossRef] [PubMed]
- Mittica, G.; Ghisoni, E.; Giannone, G.; Genta, S.; Aglietta, M.; Sapino, A.; Valabrega, G. PARP Inhibitors in Ovarian Cancer. Recent Patents Anti-Cancer Drug Discov. 2018, 13, 392–410. [Google Scholar] [CrossRef]
- Foo, T.; George, A.; Banerjee, S. PARP inhibitors in ovarian cancer: An overview of the practice-changing trials. Genes Chromosom. Cancer 2020, 60, 385–397. [Google Scholar] [CrossRef] [PubMed]
- Coleman, R.L.; Brady, M.F.; Herzog, T.J.; Sabbatini, P.; Armstrong, D.K.; Walker, J.L.; Kim, B.G.; Fujiwara, K.; Tewari, K.S.; O’Malley, D.M.; et al. Bevacizumab and paclitaxel–carboplatin chemotherapy and secondary cytoreduction in recurrent, platinum-sensitive ovarian cancer (NRG Oncology/Gynecologic Oncology Group study GOG-0213): A multicentre, open-label, randomised, phase 3 trial. Lancet Oncol. 2017, 18, 779–791. [Google Scholar] [CrossRef] [Green Version]
- Baruch, E.N.; Berg, A.L.; Besser, M.J.; Schachter, J.; Markel, G. Adoptive T cell therapy: An overview of obstacles and opportunities. Cancer 2017, 123, 2154–2162. [Google Scholar] [CrossRef] [Green Version]
- Bonini, C.; Mondino, A. Adoptive T-cell therapy for cancer: The era of engineered T cells. Eur. J. Immunol. 2015, 45, 2457–2469. [Google Scholar] [CrossRef] [Green Version]
- Govers, C.; Sebestyén, Z.; Coccoris, M.; Willemsen, R.A.; Debets, R. T cell receptor gene therapy: Strategies for optimizing transgenic TCR pairing. Trends Mol. Med. 2010, 16, 77–87. [Google Scholar] [CrossRef]
- Walseng, E.; Köksal, H.; Sektioglu, I.M.; Fåne, A.; Skorstad, G.; Kvalheim, G.; Gaudernack, G.; Inderberg, E.M.; Wälchli, S. A TCR-based Chimeric Antigen Receptor. Sci. Rep. 2017, 7, 10713. [Google Scholar] [CrossRef] [PubMed] [Green Version]
- Zhang, J.; Wang, L. The Emerging World of TCR-T Cell Trials Against Cancer: A Systematic Review. Technol. Cancer Res. Treat. 2019, 18, 1533033819831068. [Google Scholar] [CrossRef] [PubMed] [Green Version]
- Nathan, P.; Hassel, J.C.; Rutkowski, P.; Baurain, J.-F.; Butler, M.O.; Schlaak, M.; Sullivan, R.J.; Ochsenreither, S.; Dummer, R.; Kirkwood, J.M.; et al. Overall Survival Benefit with Tebentafusp in Metastatic Uveal Melanoma. New Engl. J. Med. 2021, 385, 1196–1206. [Google Scholar] [CrossRef]
- Olivier, T.; Prasad, V. Tebentafusp in first-line melanoma trials: An outperforming outlier. Transl. Oncol. 2022, 20, 101408. [Google Scholar] [CrossRef] [PubMed]
- Xu, Y.; Jiang, J.; Wang, Y.; Wang, W.; Li, H.; Lai, W.; Zhou, Z.; Zhu, W.; Xiang, Z.; Wang, Z.; et al. Engineered T Cell Therapy for Gynecologic Malignancies: Challenges and Opportunities. Front. Immunol. 2021, 12, 725330. [Google Scholar] [CrossRef] [PubMed]
- Odunsi, K. Immunotherapy in ovarian cancer. Ann. Oncol. 2017, 28, viii1–viii7. [Google Scholar] [CrossRef]
- Morand, S.; Devanaboyina, M.; Staats, H.; Stanbery, L.; Nemunaitis, J. Ovarian Cancer Immunotherapy and Personalized Medicine. Int. J. Mol. Sci. 2021, 22, 6532. [Google Scholar] [CrossRef]
- Anderson, K.G.; Voillet, V.; Bates, B.M.; Chiu, E.Y.; Burnett, M.G.; Garcia, N.M.; Oda, S.K.; Morse, C.B.; Stromnes, I.M.; Drescher, C.W.; et al. Engineered Adoptive T-cell Therapy Prolongs Survival in a Preclinical Model of Advanced-Stage Ovarian Cancer. Cancer Immunol. Res. 2019, 7, 1412–1425. [Google Scholar] [CrossRef]
- Mittica, G.; Capellero, S.; Genta, S.; Cagnazzo, C.; Aglietta, M.; Sangiolo, D.; Valabrega, G. Adoptive immunotherapy against ovarian cancer. J. Ovarian Res. 2016, 9, 30. [Google Scholar] [CrossRef] [Green Version]
- Mantia-Smaldone, G.M.; Corr, B.; Chu, C.S. Immunotherapy in ovarian cancer. Hum. Vaccines Immunother. 2012, 8, 1179–1191. [Google Scholar] [CrossRef]
- Chiriva-Internati, M.; Weidanz, J.A.; Yu, Y.; Frezza, E.E.; Jenkins, M.R.; Kennedy, R.C.; Cobos, E.; Kast, W.M. Sperm Protein 17 is a Suitable Target for Adoptive T-cell–based Immunotherapy in Human Ovarian Cancer. J. Immunother. 2008, 31, 693–703. [Google Scholar] [CrossRef] [PubMed]
- Gillespie, A.; Rodgers, S.; Wilson, A.; Tidy, J.; Rees, R.; Coleman, R.; Murray, A. MAGE, BAGE and GAGE: Tumour antigen expression in benign and malignant ovarian tissue. Br. J. Cancer 1998, 78, 816–821. [Google Scholar] [CrossRef] [PubMed] [Green Version]
- Zhang, S.; Zhou, X.; Yu, H.; Yu, Y. Expression of tumor-specific antigen MAGE, GAGE and BAGE in ovarian cancer tissues and cell lines. BMC Cancer 2010, 10, 163. [Google Scholar] [CrossRef] [PubMed] [Green Version]
- Woloszynska-Read, A.; Mhawech-Fauceglia, P.; Yu, J.; Odunsi, K.; Karpf, A.R. Intertumor and Intratumor NY-ESO-1 Expression Heterogeneity Is Associated with Promoter-Specific and Global DNA Methylation Status in Ovarian Cancer. Clin. Cancer Res. 2008, 14, 3283–3290. [Google Scholar] [CrossRef] [PubMed] [Green Version]
- Arsenic, R.; Braicu, E.I.; Letsch, A.; Dietel, M.; Sehouli, J.; Keilholz, U.; Ochsenreither, S. Cancer-testis antigen cyclin A1 is broadly expressed in ovarian cancer and is associated with prolonged time to tumor progression after platinum-based therapy. BMC Cancer 2015, 15, 784. [Google Scholar] [CrossRef]
- Sanderson, J.P.; Crowley, D.J.; Wiedermann, G.E.; Quinn, L.L.; Crossland, K.L.; Tunbridge, H.M.; Cornforth, T.V.; Barnes, C.S.; Ahmed, T.; Howe, K.; et al. Preclinical evaluation of an affinity-enhanced MAGE-A4-specific T-cell receptor for adoptive T-cell therapy. Oncoimmunology 2019, 9, 1682381. [Google Scholar] [CrossRef] [PubMed] [Green Version]
- Cheever, M.A.; Allison, J.P.; Ferris, A.S.; Finn, O.J.; Hastings, B.M.; Hecht, T.T.; Mellman, I.; Prindiville, S.A.; Viner, J.L.; Weiner, L.M.; et al. The Prioritization of Cancer Antigens: A National Cancer Institute Pilot Project for the Acceleration of Translational Research. Clin. Cancer Res. 2009, 15, 5323–5337. [Google Scholar] [CrossRef] [Green Version]
- Aithal, A.; Rauth, S.; Kshirsagar, P.; Shah, A.; Lakshmanan, I.; Junker, W.M.; Jain, M.; Ponnusamy, M.P.; Batra, S.K. MUC16 as a novel target for cancer therapy. Expert Opin. Ther. Targets 2018, 22, 675–686. [Google Scholar] [CrossRef]
- Al-Alem, L.F.; Mccord, L.A.; Southard, R.C.; Kilgore, M.W.; Curry, T.E., Jr. Activation of the PKC pathway stimulates ovarian cancer cell proliferation, migration, and expression of MMP7 and MMP10. Biol. Reprod. 2013, 89, 73. [Google Scholar] [CrossRef] [PubMed] [Green Version]
- Al-Khadairi, G.; Naik, A.; Thomas, R.; Al-Sulaiti, B.; Rizly, S.; Decock, J. PRAME promotes epithelial-to-mesenchymal transition in triple negative breast cancer. J. Transl. Med. 2019, 17, 9. [Google Scholar] [CrossRef]
- AlHossiny, M.; Luo, L.; Frazier, W.R.; Steiner, N.; Gusev, Y.; Kallakury, B.; Glasgow, E.; Creswell, K.; Madhavan, S.; Kumar, R.; et al. Ly6E/K Signaling to TGFβ Promotes Breast Cancer Progression, Immune Escape, and Drug Resistance. Cancer Res. 2016, 76, 3376–3386. [Google Scholar] [CrossRef] [PubMed] [Green Version]
- Bahrami, B.; Hosseini, A.; Talei, A.-R.; Ghaderi, A.; Razmkhah, M. Adipose Derived Stem Cells Exert Immunomodulatory Effects on Natural Killer Cells in Breast Cancer. Cell J. 2016, 19, 137–145. [Google Scholar]
- Bai, J.; Xie, X.; Lei, Y.; An, G.; He, L.; Lv, X. Ocular albinism type 1-induced melanoma cell migration is mediated through the RAS/RAF/MEK/ERK signaling pathway. Mol. Med. Rep. 2014, 10, 491–495. [Google Scholar] [CrossRef] [Green Version]
- Bekos, C.; Muqaku, B.; Dekan, S.; Horvat, R.; Polterauer, S.; Gerner, C.; Aust, S.; Pils, D. NECTIN4 (PVRL4) as Putative Therapeutic Target for a Specific Subtype of High Grade Serous Ovarian Cancer—An Integrative Multi-Omics Approach. Cancers 2019, 11, 698. [Google Scholar] [CrossRef] [PubMed] [Green Version]
- Benti, S.; Tiwari, P.B.; Goodlett, D.W.; Daneshian, L.; Kern, G.B.; Smith, M.D.; Uren, A.; Chruszcz, M.; Shimizu, L.S.; Upadhyay, G. Small Molecule Binds with Lymphocyte Antigen 6K to Induce Cancer Cell Death. Cancers 2020, 12, 509. [Google Scholar] [CrossRef] [PubMed] [Green Version]
- Berinstein, N.L.; Karkada, M.; Oza, A.; Odunsi, K.; Villella, J.A.; Nemunaitis, J.J.; Morse, M.A.; Pejovic, T.; Bentley, J.; Buyse, M.; et al. Survivin-targeted immunotherapy drives robust polyfunctional T cell generation and differentiation in advanced ovarian cancer patients. Oncoimmunology 2015, 4, e1026529. [Google Scholar] [CrossRef] [PubMed] [Green Version]
- Bhan, S.; Chuang, A.; Negi, S.S.; Glazer, C.A.; Califano, J.A. MAGEA4 induces growth in normal oral keratinocytes by inhibiting growth arrest and apoptosis. Oncol. Rep. 2012, 28, 1498–1502. [Google Scholar] [CrossRef] [Green Version]
- Boylan, K.L.; Buchanan, P.C.; Manion, R.D.; Shukla, D.M.; Braumberger, K.; Bruggemeyer, C.; Skubitz, A.P. The expression of Nectin-4 on the surface of ovarian cancer cells alters their ability to adhere, migrate, aggregate, and proliferate. Oncotarget 2016, 8, 9717–9738. [Google Scholar] [CrossRef] [Green Version]
- Brennan, D.J.; Ek, S.; Doyle, E.; Drew, T.; Foley, M.; Flannelly, G.; O’Connor, D.P.; Gallagher, W.M.; Kilpinen, S.; Kallioniemi, O.-P.; et al. The transcription factor Sox11 is a prognostic factor for improved recurrence-free survival in epithelial ovarian cancer. Eur. J. Cancer 2009, 45, 1510–1517. [Google Scholar] [CrossRef]
- Brunette, L.L.; Mhawech-Fauceglia, P.Y.; Ji, L.; Skeate, J.G.; Brand, H.E.; Lawrenson, K.; Walia, S.; Chiriva-Internati, M.; Groshen, S.; Roman, L.D.; et al. Validity and prognostic significance of sperm protein 17 as a tumor biomarker for epithelial ovarian cancer: A retrospective study. BMC Cancer 2018, 18, 970. [Google Scholar] [CrossRef]
- Chang, M.-C.; Chen, C.-A.; Chen, P.-J.; Chen, Y.-L.; Mao, T.-L.; Lin, H.-W.; Chiang, W.-H.L.; Cheng, W.-F. Mesothelin enhances invasion of ovarian cancer by inducing MMP-7 through MAPK/ERK and JNK pathways. Biochem. J. 2012, 442, 293–302. [Google Scholar] [CrossRef] [PubMed]
- Chen, Y.-T.; Hsu, M.; Lee, P.; Shin, S.J.; Mhawech-Fauceglia, P.; Odunsi, K.; Altorki, N.K.; Song, C.-J.; Jin, B.-Q.; Simpson, A.J.; et al. Cancer/testis antigen CT45: Analysis of mRNA and protein expression in human cancer. Int. J. Cancer 2009, 124, 2893–2898. [Google Scholar] [CrossRef] [PubMed]
- Cheng, W.; Huang, P.-C.; Chao, H.-M.; Jeng, Y.-M.; Hsu, H.-C.; Pan, H.-W.; Hwu, W.-L.; Lee, Y.-M. Glypican-3 induces oncogenicity by preventing IGF-1R degradation, a process that can be blocked by Grb10. Oncotarget 2017, 8, 80429–80442. [Google Scholar] [CrossRef] [PubMed] [Green Version]
- Chisté, M.; Alexis, J.; Recine, M. IMP3 Expression in Serous Tumors of the Ovary. Appl. Immunohistochem. Mol. Morphol. 2014, 22, 658–662. [Google Scholar] [CrossRef] [PubMed]
- Choi, M.K.; Seong, I.; Kang, S.A.; Kim, J. Down-Regulation of Sox11 Is Required for Efficient Osteogenic Differentiation of Adipose-Derived Stem Cells. Mol. Cells 2014, 37, 337–344. [Google Scholar] [CrossRef] [PubMed] [Green Version]
- Coscia, F.; Lengyel, E.; Duraiswamy, J.; Ashcroft, B.; Bassani-Sternberg, M.; Wierer, M.; Johnson, A.; Wroblewski, K.; Montag, A.; Yamada, S.D.; et al. Multi-level Proteomics Identifies CT45 as a Chemosensitivity Mediator and Immunotherapy Target in Ovarian Cancer. Cell 2018, 175, 159–170.e16. [Google Scholar] [CrossRef] [Green Version]
- Daudi, S.; Eng, K.; Mhawech-Fauceglia, P.; Morrison, C.; Miliotto, A.; Beck, A.; Matsuzaki, J.; Tsuji, T.; Groman, A.; Gnjatic, S.; et al. Expression and Immune Responses to MAGE Antigens Predict Survival in Epithelial Ovarian Cancer. PLoS ONE 2014, 9, e104099. [Google Scholar] [CrossRef] [Green Version]
- Davidson, B.; Holth, A.; Hellesylt, E.; Tan, T.Z.; Huang, R.Y.-J.; Tropé, C.; Nesland, J.M.; Thiery, J.P. The clinical role of epithelial-mesenchymal transition and stem cell markers in advanced-stage ovarian serous carcinoma effusions. Hum. Pathol. 2015, 46, 1–8. [Google Scholar] [CrossRef]
- Deng, J.; Wang, L.; Chen, H.; Li, L.; Ma, Y.; Ni, J.; Li, Y. The role of tumour-associated MUC1 in epithelial ovarian cancer metastasis and progression. Cancer Metastasis Rev. 2013, 32, 535–551. [Google Scholar] [CrossRef]
- DeRycke, M.S.; Pambuccian, S.E.; Gilks, C.B.; Kalloger, S.E.; Ghidouche, A.; Lopez, M.; Bliss, R.L.; Geller, M.A.; Argenta, P.A.; Harrington, K.M.; et al. Nectin 4 Overexpression in Ovarian Cancer Tissues and Serum. Am. J. Clin. Pathol. 2010, 134, 835–845. [Google Scholar] [CrossRef]
- Di Modugno, F.; Caprara, V.; Chellini, L.; Tocci, P.; Spadaro, F.; Ferrandina, G.; Sacconi, A.; Blandino, G.; Nisticò, P.; Bagnato, A.; et al. hMENA is a key regulator in endothelin-1/β-arrestin1–induced invadopodial function and metastatic process. Proc. Natl. Acad. Sci. USA 2018, 115, 3132–3137. [Google Scholar] [CrossRef] [PubMed]
- Dobrzanski, M.J.; Rewers-Felkins, K.A.; Quinlin, I.S.; Samad, K.A.; Phillips, C.A.; Robinson, W.; Dobrzanski, D.J.; Wright, S.E. Autologous MUC1-specific Th1 effector cell immunotherapy induces differential levels of systemic TReg cell subpopulations that result in increased ovarian cancer patient survival. Clin. Immunol. 2009, 133, 333–352. [Google Scholar] [CrossRef] [PubMed] [Green Version]
- El-Balat, A.; Sänger, N.; Karn, T.; Becker, S.; Holtrich, U.; Muallem, Z.; Arsenic, R. IMP3 Expression in Borderline Tumors of the Ovary. Anticancer Res. 2017, 37, 583–588. [Google Scholar] [CrossRef] [PubMed] [Green Version]
- Fang, G.; Liu, J.; Wang, Q.; Huang, X.; Yang, R.; Pang, Y.; Yang, M. MicroRNA-223-3p Regulates Ovarian Cancer Cell Proliferation and Invasion by Targeting SOX11 Expression. Int. J. Mol. Sci. 2017, 18, 1208. [Google Scholar] [CrossRef] [Green Version]
- Felder, M.; Kapur, A.; Gonzalez-Bosquet, J.; Horibata, S.; Heintz, J.; Albrecht, R.; Fass, L.; Kaur, J.; Hu, K.; Shojaei, H.; et al. MUC16 (CA125): Tumor biomarker to cancer therapy, a work in progress. Mol. Cancer 2014, 13, 129. [Google Scholar] [CrossRef] [Green Version]
- Gao, Q.; Xiang, S.D.; Wilson, K.; Madondo, M.; Stephens, A.N.; Plebanski, M. Sperm Protein 17 Expression by Murine Epithelial Ovarian Cancer Cells and Its Impact on Tumor Progression. Cancers 2018, 10, 276. [Google Scholar] [CrossRef] [Green Version]
- Gao, Y.; Zhao, H.; Ren, M.; Chen, Q.; Li, J.; Li, Z.; Yin, C.; Yue, W. TOP2A Promotes Tumorigenesis of High-grade Serous Ovarian Cancer by Regulating the TGF-β/Smad Pathway. J. Cancer 2020, 11, 4181–4192. [Google Scholar] [CrossRef]
- Garcia-Soto, A.E.; Schreiber, T.; Strbo, N.; Ganjei-Azar, P.; Miao, F.; Koru-Sengul, T.; Simpkins, F.; Nieves-Neira, W.; Lucci, J.; Podack, E.R. Cancer-testis antigen expression is shared between epithelial ovarian cancer tumors. Gynecol. Oncol. 2017, 145, 413–419. [Google Scholar] [CrossRef]
- Gil-Kulik, P.; Krzyżanowski, A.; Dudzińska, E.; Karwat, J.; Chomik, P.; Świstowska, M.; Kondracka, A.; Kwaśniewska, A.; Cioch, M.; Jojczuk, M.; et al. Potential Involvement of BIRC5 in Maintaining Pluripotency and Cell Differentiation of Human Stem Cells. Oxidative Med. Cell. Longev. 2019, 2019, 8727925. [Google Scholar] [CrossRef] [Green Version]
- Godelaine, D.; Carrasco, J.; Brasseur, F.; Neyns, B.; Thielemans, K.; Boon, T.; Van Pel, A. A new tumor-specific antigen encoded by MAGE-C2 and presented to cytolytic T lymphocytes by HLA-B44. Cancer Immunol. Immunother. 2006, 56, 753–759. [Google Scholar] [CrossRef]
- Guo, F.; Zhang, K.; Li, M.; Cui, L.; Liu, G.; Yan, Y.; Tian, W.; Teng, F.; Zhang, Y.; Gao, C.; et al. miR-508-3p suppresses the development of ovarian carcinoma by targeting CCNA2 and MMP7. Int. J. Oncol. 2020, 57, 264–276. [Google Scholar] [CrossRef]
- Hassan, R.; Thomas, A.; Alewine, C.; Le, D.T.; Jaffee, E.M.; Pastan, I. Mesothelin Immunotherapy for Cancer: Ready for Prime Time? J. Clin. Oncol. 2016, 34, 4171–4179. [Google Scholar] [CrossRef] [Green Version]
- Hayashi, S.; Kumai, T.; Matsuda, Y.; Aoki, N.; Sato, K.; Kimura, S.; Kitada, M.; Tateno, M.; Celis, E.; Kobayashi, H. Six-transmembrane epithelial antigen of the prostate and enhancer of zeste homolog 2 as immunotherapeutic targets for lung cancer. J. Transl. Med. 2011, 9, 191. [Google Scholar] [CrossRef] [PubMed] [Green Version]
- He, X.; Yang, K.; Wang, H.; Chen, X.; Wu, H.; Yao, L.; Ma, S. Expression and clinical significance of survivin in ovarian cancer: A meta-analysis. PLoS ONE 2018, 13, e0194463. [Google Scholar] [CrossRef] [PubMed]
- Hilliard, T.S. The Impact of Mesothelin in the Ovarian Cancer Tumor Microenvironment. Cancers 2018, 10, 277. [Google Scholar] [CrossRef] [PubMed] [Green Version]
- Hsu, K.-F.; Shen, M.-R.; Huang, Y.-F.; Cheng, Y.-M.; Lin, S.-H.; Chow, N.-H.; Cheng, S.-W.; Chou, C.-Y.; Ho, C.-L. Overexpression of the RNA-binding proteins Lin28B and IGF2BP3 (IMP3) is associated with chemoresistance and poor disease outcome in ovarian cancer. Br. J. Cancer 2015, 113, 414–424. [Google Scholar] [CrossRef]
- Huang, K.-C.; Yang, J.; Ng, M.C.; Ng, S.-K.; Welch, W.R.; Muto, M.G.; Berkowitz, R.S. Cyclin A1 expression and paclitaxel resistance in human ovarian cancer cells. Eur. J. Cancer 2016, 67, 152–163. [Google Scholar] [CrossRef] [Green Version]
- Imai, K.; Hirata, S.; Irie, A.; Senju, S.; Ikuta, Y.; Yokomine, K.; Harao, M.; Inoue, M.; Tomita, Y.; Tsunoda, T.; et al. Identification of HLA-A2-restricted CTL epitopes of a novel tumour-associated antigen, KIF20A, overexpressed in pancreatic cancer. Br. J. Cancer 2010, 104, 300–307. [Google Scholar] [CrossRef] [Green Version]
- Inaba, T.; Ino, K.; Kajiyama, H.; Yamamoto, E.; Shibata, K.; Nawa, A.; Nagasaka, T.; Akimoto, H.; Takikawa, O.; Kikkawa, F. Role of the immunosuppressive enzyme indoleamine 2,3-dioxygenase in the progression of ovarian carcinoma. Gynecol. Oncol. 2009, 115, 185–192. [Google Scholar] [CrossRef]
- Jain, M.; Zhang, L.; He, M.; Zhang, Y.-Q.; Shen, M.; Kebebew, E.; Patterson, E.E.; Nilubol, N. TOP2A is overexpressed and is a therapeutic target for adrenocortical carcinoma. Endocrine-Related Cancer 2013, 20, 361–370. [Google Scholar] [CrossRef] [Green Version]
- Jiao, Z.; Huang, L.; Sun, J.; Xie, J.; Wang, T.; Yin, X.; Zhang, H.; Chen, J. Six-transmembrane epithelial antigen of the prostate 1 expression promotes ovarian cancer metastasis by aiding progression of epithelial-to-mesenchymal transition. Histochem. Cell Biol. 2020, 154, 215–230. [Google Scholar] [CrossRef] [PubMed]
- Kageyama, S.; Ikeda, H.; Miyahara, Y.; Imai, N.; Ishihara, M.; Saito, K.; Sugino, S.; Ueda, S.; Ishikawa, T.; Kokura, S.; et al. Adoptive Transfer of MAGE-A4 T-cell Receptor Gene-Transduced Lymphocytes in Patients with Recurrent Esophageal Cancer. Clin. Cancer Res. 2015, 21, 2268–2277. [Google Scholar] [CrossRef] [PubMed] [Green Version]
- Kanduc, D. Oligopeptides for Immunotherapy Approaches in Ovarian Cancer Treatment. Curr. Cancer Drug Targets 2019, 16, 285–289. [Google Scholar] [CrossRef] [PubMed]
- Kao, H.; Marto, J.A.; Hoffmann, T.K.; Shabanowitz, J.; Finkelstein, S.D.; Whiteside, T.L.; Hunt, D.F.; Finn, O.J. Identification of Cyclin B1 as a Shared Human Epithelial Tumor-Associated Antigen Recognized by T Cells. J. Exp. Med. 2001, 194, 1313–1324. [Google Scholar] [CrossRef]
- Kawai, Y.; Shibata, K.; Sakata, J.; Suzuki, S.; Utsumi, F.; Niimi, K.; Sekiya, R.; Senga, T.; Kikkawa, F.; Kajiyama, H. KIF20A expression as a prognostic indicator and its possible involvement in the proliferation of ovarian clear-cell carcinoma cells. Oncol. Rep. 2018, 40, 195–205. [Google Scholar] [CrossRef]
- Kerkar, S.P.; Wang, Z.-F.; Lasota, J.; Park, T.; Patel, K.; Groh, E.; Rosenberg, S.A.; Miettinen, M.M. MAGE-A is More Highly Expressed Than NY-ESO-1 in a Systematic Immunohistochemical Analysis of 3668 Cases. J. Immunother. 2016, 39, 181–187. [Google Scholar] [CrossRef] [Green Version]
- Khalaf, W.S.; Garg, M.; Mohamed, Y.S.; Stover, C.M.; Browning, M.J. In vitro Generation of Cytotoxic T Cells With Potential for Adoptive Tumor Immunotherapy of Multiple Myeloma. Front. Immunol. 2019, 10, 1792. [Google Scholar] [CrossRef] [Green Version]
- Kloudová, K.; Hromádková, H.; Partlová, S.; Brtnický, T.; Rob, L.; Bartůňková, J.; Hensler, M.; Halaška, M.J.; Špíšek, R.; Fialová, A. Expression of tumor antigens on primary ovarian cancer cells compared to established ovarian cancer cell lines. Oncotarget 2016, 7, 46120–46126. [Google Scholar] [CrossRef] [Green Version]
- Köbel, M.; Xu, H.; Bourne, P.A.; Spaulding, B.O.; Shih, I.-M.; Mao, T.-L.; Soslow, R.A.; Ewanowich, C.A.; Kalloger, S.E.; Mehl, E.; et al. IGF2BP3 (IMP3) expression is a marker of unfavorable prognosis in ovarian carcinoma of clear cell subtype. Mod. Pathol. 2009, 22, 469–475. [Google Scholar] [CrossRef] [Green Version]
- Kreuzinger, C.; Von Der Decken, I.; Wolf, A.; Gamperl, M.; Koller, J.; Karacs, J.; Pfaffinger, S.; Bartl, T.; Reinthaller, A.; Grimm, C.; et al. Patient-derived cell line models revealed therapeutic targets and molecular mechanisms underlying disease progression of high grade serous ovarian cancer. Cancer Lett. 2019, 459, 1–12. [Google Scholar] [CrossRef]
- Kristeleit, R.; Davidenko, I.; Shirinkin, V.; El-Khouly, F.; Bondarenko, I.; Goodheart, M.J.; Gorbunova, V.; Penning, C.A.; Shi, J.G.; Liu, X.; et al. A randomised, open-label, phase 2 study of the IDO1 inhibitor epacadostat (INCB024360) versus tamoxifen as therapy for biochemically recurrent (CA-125 relapse)–only epithelial ovarian cancer, primary peritoneal carcinoma, or fallopian tube cancer. Gynecol. Oncol. 2017, 146, 484–490. [Google Scholar] [CrossRef] [PubMed]
- Lamers, C.H.; van Steenbergen-Langeveld, S.; van Brakel, M.; Ruijven, C.M.G.-V.; van Elzakker, P.M.; van Krimpen, B.; Sleijfer, S.; Debets, R. T Cell Receptor-Engineered T Cells to Treat Solid Tumors: T Cell Processing Toward Optimal T Cell Fitness. Hum. Gene Ther. Methods 2014, 25, 345–357. [Google Scholar] [CrossRef] [PubMed] [Green Version]
- Li, H.; Zhang, W.; Sun, X.; Chen, J.; Li, Y.; Niu, C.; Xu, B.; Zhang, Y. Overexpression of kinesin family member 20A is associated with unfavorable clinical outcome and tumor progression in epithelial ovarian cancer. Cancer Manag. Res. 2018, 10, 3433–3450. [Google Scholar] [CrossRef] [Green Version]
- Liu, Y.; Wang, Y.; Yao, D.; Cui, D. LncSOX4 serves an oncogenic role in the tumorigenesis of epithelial ovarian cancer by promoting cell proliferation and inhibiting apoptosis. Mol. Med. Rep. 2018, 17, 8282–8288. [Google Scholar] [CrossRef]
- Liu, Y.; Zheng, D.; Liu, M.; Bai, J.; Zhou, X.; Gong, B.; Lu, J.; Zhang, Y.; Huang, H.; Luo, W.; et al. Downregulation of glypican-3 expression increases migration, invasion, and tumorigenicity of human ovarian cancer cells. Tumor Biol. 2015, 36, 7997–8006. [Google Scholar] [CrossRef]
- Llauradó, M.; Abal, M.; Castellví, J.; Cabrera, S.; Gil-Moreno, A.; Pérez-Benavente, A.; Colas, E.; Doll, A.; Dolcet, X.; Matias-Guiu, X.; et al. ETV5 transcription factor is overexpressed in ovarian cancer and regulates cell adhesion in ovarian cancer cells. Int. J. Cancer 2012, 130, 1532–1543. [Google Scholar] [CrossRef]
- Lopez, M.; Ghidouche, A.; Rochas, C.; Godelaine, D.; Carrasco, J.; Colau, D.; Hames, G.; Montero-Julian, F.A.; Coulie, P.G.; Olive, D. Identification of a naturally processed HLA-A*02:01-restricted CTL epitope from the human tumor-associated antigen Nectin-4. Cancer Immunol. Immunother. 2016, 65, 1177–1188. [Google Scholar] [CrossRef] [PubMed]
- Lu, J.; Gu, Y.; Li, Q.; Zhong, H.; Wang, X.; Zheng, Z.; Hu, W.; Wen, L. Wilms’ tumor 1 (WT1) as a prognosis factor in gynecological cancers. Medicine 2018, 97, e11485. [Google Scholar] [CrossRef]
- Lu, L.; Wang, S.; Zhu, Q.; Qu, Y.; Gu, W.; Ning, Y.; Chen, X.; Wang, Y. The expression of IMP3 in 366 cases with ovarian carcinoma of high grade serous, endometrioid and clear cell subtypes. Pathol. Res. Pr. 2018, 214, 1087–1094. [Google Scholar] [CrossRef] [PubMed]
- Luo, L.; McGarvey, P.; Madhavan, S.; Kumar, R.; Gusev, Y.; Upadhyay, G. Distinct lymphocyte antigens 6 (Ly6) family members Ly6D, Ly6E, Ly6K and Ly6H drive tumorigenesis and clinical outcome. Oncotarget 2016, 7, 11165–11193. [Google Scholar] [CrossRef]
- Ma, W.; Germeau, C.; Vigneron, N.; Maernoudt, A.-S.; Morel, S.; Boon, T.; Coulie, P.G. Two new tumor-specific antigenic peptides encoded by geneMAGE-C2 and presented to cytolytic T lymphocytes by HLA-A2. Int. J. Cancer 2004, 109, 698–702. [Google Scholar] [CrossRef] [PubMed]
- Marijt, K.A.; Blijleven, L.; Verdegaal, E.M.; Kester, M.G.; Kowalewski, D.J.; Rammensee, H.-G.; Stevanović, S.; Heemskerk, M.H.; Van Der Burg, S.H.; Van Hall, T. Identification of non-mutated neoantigens presented by TAP-deficient tumors. J. Exp. Med. 2018, 215, 2325–2337. [Google Scholar] [CrossRef] [PubMed] [Green Version]
- McCormack, E.; Adams, K.J.; Hassan, N.J.; Kotian, A.; Lissin, N.M.; Sami, M.; Mujić, M.; Osdal, T.; Gjertsen, B.T.; Baker, D.; et al. Bi-specific TCR-anti CD3 redirected T-cell targeting of NY-ESO-1- and LAGE-1-positive tumors. Cancer Immunol. Immunother. 2012, 62, 773–785. [Google Scholar] [CrossRef] [PubMed] [Green Version]
- Monji, M.; Nakatsura, T.; Senju, S.; Yoshitake, Y.; Sawatsubashi, M.; Shinohara, M.; Kageshita, T.; Ono, T.; Inokuchi, A.; Nishimura, Y. Identification of a Novel Human Cancer/Testis Antigen, KM-HN-1, Recognized by Cellular and Humoral Immune Responses. Clin. Cancer Res. 2004, 10, 6047–6057. [Google Scholar] [CrossRef] [PubMed] [Green Version]
- Moreaux, J.; Kassambara, A.; Hose, D.; Klein, B. STEAP1 is overexpressed in cancers: A promising therapeutic target. Biochem. Biophys. Res. Commun. 2012, 429, 148–155. [Google Scholar] [CrossRef] [PubMed] [Green Version]
- Ochsenreither, S.; Majeti, R.; Schmitt, T.; Stirewalt, D.; Keilholz, U.; Loeb, K.R.; Wood, B.; Choi, Y.E.; Bleakley, M.; Warren, E.; et al. Cyclin-A1 represents a new immunogenic targetable antigen expressed in acute myeloid leukemia stem cells with characteristics of a cancer-testis antigen. Blood 2012, 119, 5492–5501. [Google Scholar] [CrossRef]
- Odunsi, K.; Jungbluth, A.A.; Stockert, E.; Qian, F.; Gnjatic, S.; Tammela, J.; Intengan, M.; Beck, A.; Keitz, B.; Santiago, D.; et al. NY-ESO-1 and LAGE-1 cancer-testis antigens are potential targets for immunotherapy in epithelial ovarian cancer. Cancer Res. 2003, 63, 6076–6083. [Google Scholar]
- Orlando, D.; Miele, E.; De Angelis, B.; Guercio, M.; Boffa, I.; Sinibaldi, M.; Po, A.; Caruana, I.; Abballe, L.; Carai, A.; et al. Adoptive Immunotherapy Using PRAME-Specific T Cells in Medulloblastoma. Cancer Res. 2018, 78, 3337–3349. [Google Scholar] [CrossRef] [Green Version]
- Pantanowitz, L.; Otis, C.N. Glypican-3 immunohistochemistry in the ovary. Histopathology 2008, 53, 115–117. [Google Scholar] [CrossRef]
- Park, J.-S.; Kim, H.-S.; Park, M.-Y.; Kim, C.-H.; Chung, Y.-J.; Hong, Y.-K.; Kim, T.-G. Topoisomerase II alpha as a universal tumor antigen: Antitumor immunity in murine tumor models and H-2Kb-restricted T cell epitope. Cancer Immunol. Immunother. 2009, 59, 747–757. [Google Scholar] [CrossRef]
- Plewka, D.; Jakubiec-Bartnik, B.; Morek, M.; Bogunia, E.; Bienioszek, M.; Wolski, H.; Kotrych, D.; Dziekan, K.; Seremak-Mrozikiewicz, A.; Plewka, A. Survivin in ovary tumors. Ginekol. Polska 2015, 86, 525–530. [Google Scholar] [CrossRef] [PubMed]
- Rao, T.D.; Fernández-Tejada, A.; Axelrod, A.; Rosales, N.; Yan, X.; Thapi, S.; Wang, A.; Park, K.J.; Nemieboka, B.; Xiang, J.; et al. Antibodies Against Specific MUC16 Glycosylation Sites Inhibit Ovarian Cancer Growth. ACS Chem. Biol. 2017, 12, 2085–2096. [Google Scholar] [CrossRef] [PubMed]
- Rapoport, A.P.; Stadtmauer, E.A.; Binder-Scholl, G.K.; Goloubeva, O.; Vogl, D.T.; Lacey, S.F.; Badros, A.Z.; Garfall, A.; Weiss, B.M.; Finklestein, J.; et al. NY-ESO-1–specific TCR–engineered T cells mediate sustained antigen-specific antitumor effects in myeloma. Nat. Med. 2015, 21, 914–921. [Google Scholar] [CrossRef] [PubMed] [Green Version]
- Sastry, N.G.; Wan, X.; Huang, T.; Alvarez, A.A.; Pangeni, R.P.; Song, X.; James, C.D.; Horbinski, C.M.; Brennan, C.W.; Nakano, I.; et al. LY6K Promotes Glioblastoma Tumorigenicity via CAV-1-Mediated ERK1/2 Signaling Enhancement. Neuro. Oncol. 2020, 22, 1315–1326. [Google Scholar] [CrossRef]
- Schiewek, J.; Schumacher, U.; Lange, T.; Joosse, S.A.; Wikman, H.; Pantel, K.; Mikhaylova, M.; Kneussel, M.; Linder, S.; Schmalfeldt, B.; et al. Clinical relevance of cytoskeleton associated proteins for ovarian cancer. J. Cancer Res. Clin. Oncol. 2018, 144, 2195–2205. [Google Scholar] [CrossRef]
- Schmitz, M.; Wehner, R.; Stevanovic, S.; Kiessling, A.; Rieger, M.A.; Temme, A.; Bachmann, M.; Rieber, E.P.; Weigle, B. Identification of a naturally processed T cell epitope derived from the glioma-associated protein SOX11. Cancer Lett. 2007, 245, 331–336. [Google Scholar] [CrossRef]
- Schuster, H.; Peper, J.K.; Bösmüller, H.-C.; Röhle, K.; Backert, L.; Bilich, T.; Ney, B.; Löffler, M.W.; Kowalewski, D.J.; Trautwein, N.; et al. The immunopeptidomic landscape of ovarian carcinomas. Proc. Natl. Acad. Sci. USA 2017, 114, E9942–E9951. [Google Scholar] [CrossRef] [Green Version]
- Sernbo, S.; Gustavsson, E.; Brennan, D.J.; Gallagher, W.M.; Rexhepaj, E.; Rydnert, F.; Jirström, K.; Borrebaeck, C.A.; Ek, S. The tumour suppressor SOX11 is associated with improved survival among high grade epithelial ovarian cancers and is regulated by reversible promoter methylation. BMC Cancer 2011, 11, 405. [Google Scholar] [CrossRef] [Green Version]
- Sethy, C.; Goutam, K.; Nayak, D.; Pradhan, R.; Molla, S.; Chatterjee, S.; Rout, N.; Wyatt, M.D.; Narayan, S.; Kundu, C.N. Clinical significance of a pvrl 4 encoded gene Nectin-4 in metastasis and angiogenesis for tumor relapse. J. Cancer Res. Clin. Oncol. 2019, 146, 245–259. [Google Scholar] [CrossRef]
- Shang, B.; Gao, A.; Pan, Y.; Zhang, G.; Tu, J.; Zhou, Y.; Yang, P.; Cao, Z.; Wei, Q.; Ding, Y.; et al. CT45A1 acts as a new proto-oncogene to trigger tumorigenesis and cancer metastasis. Cell Death Dis. 2014, 5, e1285. [Google Scholar] [CrossRef] [Green Version]
- Shi, C.; Huang, D.; Lu, N.; Chen, D.; Zhang, M.; Yan, Y.; Deng, L.; Lu, Q.; Lu, H.; Luo, S. Aberrantly activated Gli2-KIF20A axis is crucial for growth of hepatocellular carcinoma and predicts poor prognosis. Oncotarget 2016, 7, 26206–26219. [Google Scholar] [CrossRef] [PubMed] [Green Version]
- Shimizu, Y.; Suzuki, T.; Yoshikawa, T.; Endo, I.; Nakatsura, T. Next-Generation Cancer Immunotherapy Targeting Glypican-3. Front. Oncol. 2019, 9, 248. [Google Scholar] [CrossRef] [PubMed]
- Sillanpää, S.; Anttila, M.; Voutilainen, K.; Ropponen, K.; Turpeenniemi-Hujanen, T.; Puistola, U.; Tammi, R.; Tammi, M.; Sironen, R.; Saarikoski, S.; et al. Prognostic significance of matrix metalloproteinase-9 (MMP-9) in epithelial ovarian cancer. Gynecol. Oncol. 2007, 104, 296–303. [Google Scholar] [CrossRef]
- Sinnathamby, G.; Zerfass, J.; Hafner, J.; Block, P.; Nickens, Z.; Hobeika, A.; Secord, A.A.; Lyerly, H.K.; Morse, M.A.; Philip, R. ADAM metallopeptidase domain 17 (ADAM17) is naturally processed through major histocompatibility complex (MHC) class I molecules and is a potential immunotherapeutic target in breast, ovarian and prostate cancers. Clin. Exp. Immunol. 2010, 163, 324–332. [Google Scholar] [CrossRef] [PubMed]
- Song, X.; Hao, J.; Wang, J.; Guo, C.; Wang, Y.; He, Q.; Tang, H.; Qin, X.; Li, Y.; Zhang, Y.; et al. The cancer/testis antigen MAGEC2 promotes amoeboid invasion of tumor cells by enhancing STAT3 signaling. Oncogene 2016, 36, 1476–1486. [Google Scholar] [CrossRef]
- Sørensen, R.B.; Berge-Hansen, L.; Junker, N.; Hansen, C.A.; Hadrup, S.R.; Schumacher, T.; Svane, I.M.; Becker, J.C.; Straten, P.T.; Andersen, M.H. The Immune System Strikes Back: Cellular Immune Responses against Indoleamine 2,3-dioxygenase. PLoS ONE 2009, 4, e6910. [Google Scholar] [CrossRef] [PubMed]
- Stapelberg, M.; Zobalova, R.; Nguyen, M.N.; Walker, T.; Stantic, M.; Goodwin, J.; Pasdar, E.A.; Thai, T.; Prokopova, K.; Yan, B.; et al. Indoleamine-2,3-dioxygenase elevated in tumor-initiating cells is suppressed by mitocans. Free. Radic. Biol. Med. 2014, 67, 41–50. [Google Scholar] [CrossRef]
- Straetemans, T.; van Brakel, M.; van Steenbergen, S.; Broertjes, M.; Drexhage, J.; Hegmans, J.; Lambrecht, B.N.; Lamers, C.; van Der Bruggen, P.; Coulie, P.G.; et al. TCR Gene Transfer: MAGE-C2/HLA-A2 and MAGE-A3/HLA-DP4 Epitopes as Melanoma-Specific Immune Targets. J. Immunol. Res. 2012, 2012, 586314. [Google Scholar] [CrossRef] [Green Version]
- Straughn, J.M., Jr.; Shaw, D.R.; Guerrero, A.; Bhoola, S.M.; Racelis, A.; Wang, Z.; Chiriva-Internati, M.; Grizzle, W.E.; Alvarez, R.D.;; Lim, S.H.; et al. Expression of sperm protein 17 (Sp17) in ovarian cancer. Int. J. Cancer 2004, 108, 805–811. [Google Scholar] [CrossRef]
- Sun, D.; Fan, X.-H. LncRNA SNHG12 accelerates the progression of ovarian cancer via absorbing miRNA-129 to upregulate SOX4. Eur. Rev. Med. Pharmacol. Sci. 2019, 23, 2345–2352. [Google Scholar]
- Taube, E.T.; Denkert, C.; Sehouli, J.; Kunze, C.A.; Dietel, M.; Braicu, I.; Letsch, A.; Darb-Esfahani, S. Wilms tumor protein 1 (WT1)—Not only a diagnostic but also a prognostic marker in high-grade serous ovarian carcinoma. Gynecol. Oncol. 2015, 140, 494–502. [Google Scholar] [CrossRef] [PubMed]
- Teck, A.T.; Urban, S.; Quass, P.; Nelde, A.; Schuster, H.; Letsch, A.; Busse, A.; Walz, J.S.; Keilholz, U.; Ochsenreither, S. Cancer testis antigen Cyclin A1 harbors several HLA-A*02:01-restricted T cell epitopes, which are presented and recognized in vivo. Cancer Immunol. Immunother. 2020, 69, 1217–1227. [Google Scholar] [CrossRef] [PubMed]
- Tomita, Y.; Harao, M.; Senju, S.; Imai, K.; Hirata, S.; Irie, A.; Inoue, M.; Hayashida, Y.; Yoshimoto, K.; Shiraishi, K.; et al. Peptides derived from human insulin-like growth factor-II mRNA binding protein 3 can induce human leukocyte antigen-A2-restricted cytotoxic T lymphocytes reactive to cancer cells. Cancer Sci. 2010, 102, 71–78. [Google Scholar] [CrossRef]
- Tomita, Y.; Yuno, A.; Tsukamoto, H.; Senju, S.; Kuroda, Y.; Hirayama, M.; Imamura, Y.; Yatsuda, J.; Abu Sayem, M.; Irie, A.; et al. Identification of immunogenic LY6K long peptide encompassing both CD4+ and CD8+ T-cell epitopes and eliciting CD4+ T-cell immunity in patients with malignant disease. Oncoimmunology 2014, 3, e28100. [Google Scholar] [CrossRef] [PubMed] [Green Version]
- Touloukian, C.E.; Leitner, W.W.; Schnur, R.E.; Robbins, P.F.; Li, Y.; Southwood, S.; Sette, A.; Rosenberg, S.A.; Restifo, N.P. Normal Tissue Depresses While Tumor Tissue Enhances Human T Cell Responses In Vivo to a Novel Self/Tumor Melanoma Antigen, OA1. J. Immunol. 2003, 170, 1579–1585. [Google Scholar] [CrossRef] [PubMed] [Green Version]
- Vaghjiani, R.J.; Talma, S.; Murphy, C.L. Six-Transmembrane Epithelial Antigen of the Prostate (STEAP1 and STEAP2)—Differentially Expressed by Murine and Human Mesenchymal Stem Cells. Tissue Eng. Part A 2009, 15, 2073–2083. [Google Scholar] [CrossRef] [PubMed]
- Eynde, B.J.V.D.; Gaugler, B.; Probst-Kepper, M.; Michaux, L.; Devuyst, O.; Lorge, F.; Weynants, P.; Boon, T. A New Antigen Recognized by Cytolytic T Lymphocytes on a Human Kidney Tumor Results from Reverse Strand Transcription. J. Exp. Med. 1999, 190, 1793–1800. [Google Scholar] [CrossRef] [PubMed]
- Vermeij, R.; Daemen, T.; de Bock, G.H.; De Graeff, P.; Leffers, N.; Lambeck, A.; Hoor, K.A.T.; Hollema, H.; Van Der Zee, A.G.J.; Nijman, H.W. Potential Target Antigens for a Universal Vaccine in Epithelial Ovarian Cancer. J. Immunol. Res. 2010, 2010, 891505. [Google Scholar] [CrossRef] [PubMed]
- Wang, F.-Q.; So, J.; Reierstad, S.; Fishman, D.A. Matrilysin (MMP-7) promotes invasion of ovarian cancer cells by activation of progelatinase. Int. J. Cancer 2004, 114, 19–31. [Google Scholar] [CrossRef]
- Xu, Y.; Zou, R.; Wang, J.; Wang, Z.-W.; Zhu, X. The role of the cancer testis antigen PRAME in tumorigenesis and immunotherapy in human cancer. Cell Prolif. 2020, 53, e12770. [Google Scholar] [CrossRef]
- Yakirevich, E.; Sabo, E.; Lavie, O.; Mazareb, S.; Spagnoli, G.C.; Resnick, M.B. Expression of the MAGE-A4 and NY-ESO-1 cancer-testis antigens in serous ovarian neoplasms. Clin. Cancer Res. 2003, 9, 6453–6460. [Google Scholar] [PubMed]
- Yamamoto, M.; Suzuki, S.; Togashi, K.; Sanomachi, T.; Seino, S.; Kitanaka, C.; Okada, M. AS602801, an Anticancer Stem Cell Candidate Drug, Reduces Survivin Expression and Sensitizes A2780 Ovarian Cancer Stem Cells to Carboplatin and Paclitaxel. Anticancer Res. 2018, 38, 6699–6706. [Google Scholar] [CrossRef] [PubMed]
- Yokoyama, Y.; Grünebach, F.; Schmidt, S.M.; Heine, A.; Häntschel, M.; Stevanovic, S.; Rammensee, H.-G.; Brossart, P. Matrilysin (MMP-7) Is a Novel Broadly Expressed Tumor Antigen Recognized by Antigen-Specific T Cells. Clin. Cancer Res. 2008, 14, 5503–5511. [Google Scholar] [CrossRef]
- Zhang, W.; Barger, C.J.; Eng, K.H.; Klinkebiel, D.; Link, P.A.; Omilian, A.; Bshara, W.; Odunsi, K.; Karpf, A.R. PRAME expression and promoter hypomethylation in epithelial ovarian cancer. Oncotarget 2016, 7, 45352–45369. [Google Scholar] [CrossRef] [Green Version]
- Zhang, W.; Barger, C.J.; Link, P.A.; Mhawech-Fauceglia, P.; Miller, A.; Akers, S.N.; Odunsi, K.; Karpf, A.R. DNA hypomethylation-mediated activation of Cancer/Testis Antigen 45(CT45) genes is associated with disease progression and reduced survival in epithelial ovarian cancer. Epigenetics 2015, 10, 736–748. [Google Scholar] [CrossRef] [PubMed] [Green Version]
- Zhao, G.; Wang, Q.; Wu, Z.; Tian, X.; Yan, H.; Wang, B.; Dong, P.; Watari, H.; Pfeffer, L.M.; Guo, Y.; et al. Ovarian Primary and Metastatic Tumors Suppressed by Survivin Knockout or a Novel Survivin Inhibitor. Mol. Cancer Ther. 2019, 18, 2233–2245. [Google Scholar] [CrossRef] [Green Version]
- Zheng, H.; Hu, W.; Deavers, M.T.; Shen, D.-Y.; Fu, S.; Li, Y.-F.; Kavanagh, J.J. Nuclear cyclin B1 is overexpressed in low-malignant-potential ovarian tumors but not in epithelial ovarian cancer. Am. J. Obstet. Gynecol. 2009, 201, 367.e1–367.e6. [Google Scholar] [CrossRef] [PubMed]
- Zimmermann, A.-K.; Imig, J.; Klar, A.; Renner, C.; Korol, D.; Fink, D.; Stadlmann, S.; Singer, G.; Knuth, A.; Moch, H.; et al. Expression of MAGE-C1/CT7 and selected cancer/testis antigens in ovarian borderline tumours and primary and recurrent ovarian carcinomas. Virchows Arch. 2013, 462, 565–574. [Google Scholar] [CrossRef] [Green Version]
- Vita, R.; Mahajan, S.; Overton, J.A.; Dhanda, S.K.; Martini, S.; Cantrell, J.R.; Wheeler, D.K.; Sette, A.; Peters, B. The Immune Epitope Database (IEDB): 2018 update. Nucleic Acids Res. 2019, 47, D339–D343. [Google Scholar] [CrossRef] [Green Version]
- Chong, C.; Marino, F.; Pak, H.; Racle, J.; Daniel, R.T.; Müller, M.; Gfeller, D.; Coukos, G.; Bassani-Sternberg, M. High-throughput and Sensitive Immunopeptidomics Platform Reveals Profound Interferonγ-Mediated Remodeling of the Human Leukocyte Antigen (HLA) Ligandome. Mol. Cell. Proteom. 2018, 17, 533–548. [Google Scholar] [CrossRef] [Green Version]
- Lánczky, A.; Győrffy, B. Web-Based Survival Analysis Tool Tailored for Medical Research (KMplot): Development and Implementation. J. Med. Internet Res. 2021, 23, e27633. [Google Scholar] [CrossRef] [PubMed]
- Tothill, R.W.; Tinker, A.V.; George, J.; Brown, R.; Fox, S.B.; Lade, S.; Johnson, D.S.; Trivett, M.K.; Etemadmoghadam, D.; Locandro, B.; et al. Novel Molecular Subtypes of Serous and Endometrioid Ovarian Cancer Linked to Clinical Outcome. Clin. Cancer Res. 2008, 14, 5198–5208. [Google Scholar] [CrossRef] [PubMed] [Green Version]
- Mahmoud, A.M. Cancer testis antigens as immunogenic and oncogenic targets in breast cancer. Immunotherapy 2018, 10, 769–778. [Google Scholar] [CrossRef]
- Fijak, M.; Bhushan, S.; Meinhardt, A. Immunoprivileged Sites: The Testis. Suppr. Regul. Immune Responses 2010, 677, 459–470. [Google Scholar] [CrossRef]
- Buccitelli, C.; Selbach, M. mRNAs, proteins and the emerging principles of gene expression control. Nat. Rev. Genet. 2020, 21, 630–644. [Google Scholar] [CrossRef]
- Nusinow, D.P.; Szpyt, J.; Ghandi, M.; Rose, C.M.; McDonald, E.R., 3rd; Kalocsay, M.; Jané-Valbuena, J.; Gelfand, E.; Schweppe, D.K.; Jedrychowski, M.; et al. Quantitative Proteomics of the Cancer Cell Line Encyclopedia. Cell 2020, 180, 387–402.e16. [Google Scholar] [CrossRef]
- Upadhyay, R.; Boiarsky, J.A.; Pantsulaia, G.; Svensson-Arvelund, J.; Lin, M.J.; Wroblewska, A.; Bhalla, S.; Scholler, N.; Bot, A.; Rossi, J.M.; et al. A Critical Role for Fas-Mediated Off-Target Tumor Killing in T-cell Immunotherapy. Cancer Discov. 2021, 11, 599–613. [Google Scholar] [CrossRef]
- Berlin, C.; Kowalewski, D.J.; Schuster, H.; Mirza, N.; Walz, S.; Handel, M.; Schmid-Horch, B.; Salih, H.R.; Kanz, L.; Rammensee, H.-G.; et al. Mapping the HLA ligandome landscape of acute myeloid leukemia: A targeted approach toward peptide-based immunotherapy. Leukemia 2014, 29, 647–659. [Google Scholar] [CrossRef]
- Olsen, L.R.; Tongchusak, S.; Lin, H.; Reinherz, E.L.; Brusic, V.; Zhang, G.L. TANTIGEN: A comprehensive database of tumor T cell antigens. Cancer Immunol. Immunother. 2017, 66, 731–735. [Google Scholar] [CrossRef]
- Zhang, G.; Chitkushev, L.; Olsen, L.R.; Keskin, D.B.; Brusic, V. TANTIGEN 2.0: A knowledge base of tumor T cell antigens and epitopes. BMC Bioinform. 2021, 22, 40. [Google Scholar] [CrossRef]
- Vigneron, N.; Stroobant, V.; Eynde, B.J.V.D.; Van Der Bruggen, P. Database of T cell-defined human tumor antigens: The 2013 update. Cancer Immun. 2013, 13, 15. [Google Scholar] [PubMed]
- Uhlén, M.; Zhang, C.; Lee, S.; Sjöstedt, E.; Fagerberg, L.; Bidkhori, G.; Benfeitas, R.; Arif, M.; Liu, Z.; Edfors, F.; et al. A pathology atlas of the human cancer transcriptome. Science 2017, 357, 2507. [Google Scholar] [CrossRef] [PubMed] [Green Version]
- The Cancer Genome Atlas Research Network; Weinstein, J.N.; Collisson, E.A.; Mills, G.B.; Shaw, K.R.M.; Ozenberger, B.A.; Ellrott, K.; Shmulevich, I.; Sander, C.; Stuart, J.M. The Cancer Genome Atlas Pan-Cancer analysis project. Nat. Genet. 2013, 45, 1113–1120. [Google Scholar] [CrossRef]
- Anonymous. AltAnalyze FAQ: “What is the recommended cutoff for expressed genes with RNA-Seq?“. Available online: https://altanalyze.readthedocs.io/en/latest/RNASeqExpressionCutoffs/ (accessed on 10 May 2020).
- Gabrielsen, I.S.M.; Helgeland, H.; Akselsen, H.; Aass, H.C.D.; Sundaram, A.; Snowhite, I.V.; Pugliese, A.; Flåm, S.T.; Lie, B.A. Transcriptomes of antigen presenting cells in human thymus. PLoS ONE 2019, 14, e0218858. [Google Scholar] [CrossRef] [PubMed]
- Anonymous. Human Protein Atlas Technical Data, TCGA RNA-seq data. Available online: https://www.proteinatlas.org/about/assays+annotation (accessed on 11 May 2020).
- Prabh, N.; Rödelsperger, C. Are orphan genes protein-coding, prediction artifacts, or non-coding RNAs? BMC Bioinform. 2016, 17, 226. [Google Scholar] [CrossRef]


| n | % | |
|---|---|---|
| Age ≤60 years >60 years | 28 30 | 48.3 51.7 |
| Histology serous | 58 | 100 |
| Grade | ||
| 2 3 | 6 52 | 10.3 89.7 |
| Stage (FIGO) | ||
| II III IV | 3 46 9 | 5.2 79.3 15.5 |
| Peritoneal Carcinomatosis | ||
| no yes | 7 51 | 12.1 87.9 |
| Residual macroscopic tumor | ||
| no yes | 43 15 | 74.1 25.9 |
| Primary Platinum response | ||
| no yes unknown | 20 37 1 | 34.5 63.8 1.7 |
| Criteria and Subcriteria | Definition | Pts. |
|---|---|---|
| Immunogenicity | 2.5 | |
| HLA-restricted T Cell-Immunity verifiable | Experimental generation of HLA-restricted T cells, specific for a TAA is possible | 2.5 |
| T Cell-Immunity detectable in humans | Spontaneous T cell-Immunity against specific TAA is detectable in humans | 2 |
| Immunogenicity in animal models | Immunogenic in animal models observed, with similar antigen expression to humans | 0.28 |
| Antibodies detectable in humans | Antibody observed in humans (humoral response) | 0.25 |
| not applicable | 0 | |
| Oncogenicity | 2.25 | |
| oncogenic self-protein | TAA is associated with oncogenic process | 2.25 |
| persistent viral AG | persistently expressed viral antigen | 0.77 |
| Correlation with unfavorable outcome | Function of TAA unknown/uncertain, but expression correlates with unfavorable prognosis/decreased survival | 0.56 |
| tissue-differentiation, not oncogenic | TAA not oncogenic, but associated with tissue differentiation | 0.27 |
| stromal-Expression | Expression on tumor related stroma, but not on malignant cells | 0.27 |
| not applicable | 0 | |
| Specificity | 2.25 | |
| absolute Specificity | TAA is absolutely specific (e.g., mutated Oncogene, viral protein) | 2.25 |
| oncofetal AG | TAA is expressed in fetus with no or little expression in healthy adult tissues (e.g., cancer-testis-antigens) | 1.22 |
| overexpressed in Tumors | overexpressed in cancer, but expressed in some healthy tissues | 0.79 |
| abnormal posttranslational modifications | TAA expressed in normal tissues, but expressed in cancer with unique posttranslational changes (e.g., glycosy-, phosphorylation) | 0.52 |
| Tissue specific (expendable tissue) | Tissue specific expression in tissue relatively expendable for survival (e.g., prostate, ovaries) | 0.47 |
| Tumor stroma AG | normal TAA expressed on tumor-stroma | 0.23 |
| not applicable | 0 | |
| Level of Expression | 1 | |
| high, all cancer cells | Highly expressed on all cancer cells | 1 |
| high, most cancer cells | Highly expressed on most cancer cells | 0.37 |
| lower, all cancer cells | Lower level of expression on all cancer cells | 0.23 |
| lower, most cancer cells | Lower level of expression on most cancer cells | 0.08 |
| not applicable | 0 | |
| Tumor Stem Cell Expression | 0.8 | |
| Stem Cell Expression, presumptive | Evidence for expression on tumor stem cells | 0.8 |
| No info about SCs, but on all stages | Present at all stages of tumor development, from premalignant to metastatic lesions, but no info about stem cell expression | 0.53 |
| No info about SCs, but most cancer cells | Expression on most cancer cells, but no info about stem cell expression | 0.16 |
| not applicable | 0 | |
| Patients with TAA-pos. Tumors | 0.6 | |
| many Patients, high level | High level of expression in high fraction of patients in a tumor type | 0.6 |
| many Patients, lower level | Lower level of expression in high fraction of patients in a tumor type | 0.1 |
| fewer Patients, high level | High level of expression in lower fraction of patients in a tumor type | 0.07 |
| not applicable | 0 | |
| No. of Epitopes | 0.6 | |
| longer Antigen | Longer antigen with multiple (potential) immunogenic epitopes | 0.6 |
| short antigenic segment | Short antigenic segment with fewer (potential) immunogenic epitopes and potential to only bind to selected MHC-molecules | 0.08 |
Disclaimer/Publisher’s Note: The statements, opinions and data contained in all publications are solely those of the individual author(s) and contributor(s) and not of MDPI and/or the editor(s). MDPI and/or the editor(s) disclaim responsibility for any injury to people or property resulting from any ideas, methods, instructions or products referred to in the content. |
© 2023 by the authors. Licensee MDPI, Basel, Switzerland. This article is an open access article distributed under the terms and conditions of the Creative Commons Attribution (CC BY) license (https://creativecommons.org/licenses/by/4.0/).
Share and Cite
Schossig, P.; Coskun, E.; Arsenic, R.; Horst, D.; Sehouli, J.; Bergmann, E.; Andresen, N.; Sigler, C.; Busse, A.; Keller, U.; et al. Target Selection for T-Cell Therapy in Epithelial Ovarian Cancer: Systematic Prioritization of Self-Antigens. Int. J. Mol. Sci. 2023, 24, 2292. https://0-doi-org.brum.beds.ac.uk/10.3390/ijms24032292
Schossig P, Coskun E, Arsenic R, Horst D, Sehouli J, Bergmann E, Andresen N, Sigler C, Busse A, Keller U, et al. Target Selection for T-Cell Therapy in Epithelial Ovarian Cancer: Systematic Prioritization of Self-Antigens. International Journal of Molecular Sciences. 2023; 24(3):2292. https://0-doi-org.brum.beds.ac.uk/10.3390/ijms24032292
Chicago/Turabian StyleSchossig, Paul, Ebru Coskun, Ruza Arsenic, David Horst, Jalid Sehouli, Eva Bergmann, Nadine Andresen, Christian Sigler, Antonia Busse, Ulrich Keller, and et al. 2023. "Target Selection for T-Cell Therapy in Epithelial Ovarian Cancer: Systematic Prioritization of Self-Antigens" International Journal of Molecular Sciences 24, no. 3: 2292. https://0-doi-org.brum.beds.ac.uk/10.3390/ijms24032292