Article

Classification and Antioxidant Activity Evaluation of Edible Oils by Using Nanomaterial-Based Electrochemical Sensors

by
Irina Georgiana Munteanu
and
Constantin Apetrei
*
Department of Chemistry, Physics and Environment, Faculty of Sciences and Environment, “Dunărea de Jos” University of Galaţi, 47 Domneasca Street, 800008 Galaţi, Romania
*
Author to whom correspondence should be addressed.
Int. J. Mol. Sci. 2023, 24(3), 3010; https://0-doi-org.brum.beds.ac.uk/10.3390/ijms24033010
Submission received: 8 January 2023 / Revised: 24 January 2023 / Accepted: 30 January 2023 / Published: 3 February 2023

Abstract

:
The classification of olive oils and the authentication of their biological or geographic origin are important issues for public health and for the olive oil market and related industries. The development of techniques for olive oil classification that are fast, easy to use, and suitable for online, in situ and remote operation is of high interest. In this study, the possibility of discriminating and classifying vegetable oils according to different criteria related to biological or geographical origin was assessed using cyclic voltammograms (CVs) as input data, obtained with electrochemical sensors based on carbonaceous nanomaterials and gold nanoparticles. In this context, 44 vegetable oil samples of different categories were analyzed and the capacity of the sensor array coupled with multivariate analysis was evaluated. The characteristics highlighted in voltammograms are related to the redox properties of the electroactive compounds, mainly phenolics, existing in the oils. Moreover, the antioxidant activity of the oils’ hydrophilic fraction was also estimated by conventional spectrophotometric methods (1,1-diphenyl-2-picrylhydrazyl (DPPH) and galvinoxyl) and correlated with the voltammetric responses of the sensors. The percentage of DPPH and galvinoxyl inhibition was accurately predicted from the voltammetric data, with a correlation coefficients greater than 0.97 both in calibration and in validation. The results indicate that this method allows for a clear discrimination of oils from different biological or geographic origins.

1. Introduction

The olive (Olea europaea L.) is an ancient crop in Mediterranean countries and has been spread throughout all five continents. The reason for its worldwide diffusion is related to the high value of its oils, which are used in human consumption and have been demonstrated to be highly beneficial for human health [1]. Olive fruits are very nutritious and their use together with the leaves in medicine dates back to ancient times [2]. Clinical data prove the beneficial properties of olive oil as a nutrient that reduces the risk of heart, skin or prostate diseases, as well as the risk of gastrointestinal cancer, etc., and it is included as an ingredient in numerous pharmaceutical and cosmetic formulations [3].
The assessment of virgin olive oil (VOO) quality and the classification into different categories is based on the following criteria: acidity, peroxide value, UV absorption and organoleptic evaluation [4]. On the basis of these criteria and taking into account the process of obtaining the various varieties of oil, the EU defines six main types of oils, which are delineated also by The International Olive Council (IOC) [5], in Article 118 of European Commission (EC) Regulation (EC) No 1234/2007 [6]. The specific characteristics of each type of oil are shown in Table S1.
The quality of the seed oils is established according to the Codex Standard for named vegetable oils 210 (Amendment 2005, 2011, 2013 and 2015) [7]. In the case of extra virgin sunflower oil, the technological process includes the cold extraction of the oil, which is suitable for human consumption without refining.
Of the many commercial categories that exist for olive oil, EVOO has particularly high standards in terms of composition as well as sensory characteristics as assessed by recognized panels [8]. Chemically, it is a complex food composed mainly of triglycerides, accounting for 98% of the total composition and a number of minor constituents that are of crucial importance in terms of health benefits and sensory properties [9]. This fraction of minor compounds includes free fatty acids [10], monoglycerides [11], diglycerides [12], phenols [13], tocopherols [14], sterols [15], phospholipids [16], waxes [17], squalene [17], hydrocarbons [18] and volatile compounds [19]. However, the phenolic compounds are the main compounds responsible for the flavor of EVOOs and as biomarkers of authenticity [20]. Furthermore, EVOO contains a high amount of phenolic compounds, which are the main agents responsible for resistance to auto-oxidation and photo-oxidation [21].
There are at least thirty-six structurally different phenolic compounds that have been identified in EVOO [22]. Not all of these compounds are present in every EVOO and there is variation in the concentration of phenolic compounds between olive oils [23]. Such variation in the phenolic fraction is the result of production factors, including the variety of olives [24], the region of olive cultivation [25], the agricultural techniques used for olive cultivation [26], the maturity of the olive fruit at harvest [27] and also the extraction, processing and storage methods [28]. The main phenolic compounds in olive oil are presented in Table S2.
The quantitative determination of these compounds is usually performed according to the Folin–Ciocalteu spectrophotometric method [29]. However, the method is less specific compared to chromatographic methods [30]. According to the literature, the most common analytical techniques used for the separation and determination of these phenolic compounds in olive oil to date are high-performance liquid chromatography (HPLC) coupled with ultraviolet (UV) or diode array detection (DAD) [31], mass spectrometry (MS) [32], gas chromatography coupled with MS [33], capillary electrophoresis (CE) coupled with UV or MS detection [34], nuclear magnetic resonance spectroscopy (NMR) [35], and infrared (IR) spectroscopy [36]. These methods have the disadvantage of being laborious [37], requiring a relatively long period of analysis and processing of the samples due to the complexity of the phenolic species [38]. Complementary innovative methods for the qualitative and quantitative determination of phenolic compounds are based on electrochemical sensors and biosensors [39,40,41]. The sensors and biosensors can be used for the detection of specific compounds or to obtain the chemical profile (“chemical fingerprint”) when an array of such sensors is used [42,43,44].
The array of sensors coupled with multivariate data analysis, electronic tongues, based on potentiometric, voltammetric or impedimetric sensors, have been successfully used for discriminating different types of oils, depending on their phenolic and sensory characteristics [45,46]. These features were used for the discrimination and classification of oils, and especially olive oils, as a function of quality, olive variety, bitterness or other sensorial characteristics, geographical origin, etc. [47,48].
An important category of electrochemical sensors and biosensors is based on carbonaceous nanomaterials and metal nanoparticles, which have a special affinity for the phenolic compounds [49]. These nanomaterials have high surface-to-volume ratios biocompatible with the phenolic compounds and enhance electron-transfer kinetics during electrochemical processes [50]. Therefore, these kinds of sensors and biosensors have excellent performance characteristics for the detection of phenolic compounds in complex samples.
In this study, screen-printed electrodes based on nanomaterials (carbon nanotubes, graphene and carbon nanofibers) modified with gold nanoparticles were used for the sensitive detection of phenolic compounds in oil hydromethanolic extracts. The synergic effects in the sensitive properties of nanomaterials increases the active area of sensors and improves the rate of electron transfer, increasing sensitivity. Electrochemical responses coupled with multivariate data analysis were used for discriminating and classifying vegetable oils according to different criteria, related to biological or geographical origin, or to establish correlations with antioxidant activity.

2. Materials and Methods

2.1. Reagents and Solutions

KCl was purchased from Sigma-Aldrich (St. Louis, MO, USA) and dissolved in ultrapure water obtained from a Milli-Q system (Millipore, Bedford, MA, USA). Methanol was purchased from Merck (Darmstadt, Germany).
The 0.1 mM DPPH stock solution was prepared by weighing 0.0036 g DPPH (2,2-diphenyl-1-picrylhydrazyl) reagent (purchased from Sigma-Aldrich) and dissolving in 100 mL 96% (v/v) ethanol (Sigma-Aldrich). The resulting solution was kept at room temperature and in the dark until use.
The 0.1 mM galvinoxyl stock solution was prepared by weighing 0.0042 g free radical galvinoxyl (2,6-di-tert-butyl-α-(3,5-di-tert-butyl-4-ox-2,5-cyclohexadiene-1-ylidene)-p-tolyloxy) reagent (purchased from Sigma-Aldrich) and dissolving in 100 mL 96% (v/v) ethanol, the mixture being kept in the dark at room temperature for 20 min before determination.

2.2. Electrodes and Devices Used

Electrochemical measurements were performed using a conventional system containing three electrodes, namely an Ag/AgCl reference electrode (Princeton, Applied Research), an auxiliary electrode consisting of a platinum wire, and a working electrode. The working electrode was, in turn, a screen-printed electrode (SPE) based on nanomaterials such as carbon nanotubes (CNT) and gold nanoparticles (GNP), nanofibers (CNF) and GNP and also, graphene (GPH) and GNP. These three working electrodes were purchased from Metrohm-DropSens (Llanera, Spain).
A Biologic SP 150 potentiostat/galvanostat (Bio-Logic Science Instruments SAS France) coupled with EC-Lab Express software operating in Windows was used to record, characterize and optimize the electrode signals. Software was also used to analyze and interpret the results: Origin, The Unscrambler and Microsoft Excel. For the weighting of the compounds, the Partner AS 220/C/2 analytical balance was used, as well as the Elmasonic ultrasonic bath (Carl Roth GmbH, Karlsruhe, Germany) for the dissolution and homogenization of the solutions.
For the spectrophotometric method based on the reaction of antioxidants with the stable free radicals DPPH and galvinoxyl, sample absorbances were measured using a Rayleigh UV2601 UV/Vis Double Beam Spectrophotometer (Beijing Beifen-Ruili Analytical Instrument, Beijing, China).

2.3. Samples

44 different commercial oils with year of production 2022 were analyzed in this study, divided into three types of edible vegetable oil, namely POO, EVOO from various countries (Italy, Greece, Spain and Tunisia), and unrefined sunflower oils (SFO). All oils studied were purchased from a local supermarket. A sub-criterion for EVOO sample classification was the country of origin. The studied samples were packaged in dark 0.5 or 1 L bottles and their price was not higher than 8 €/L at the time of the study. Oil samples were kept in a dry and dark place, at a constant temperature. Table 1 summarizes all the samples of edible oils studied.

2.4. Obtaining Extracts

For analysis, 44 samples from different oils were prepared using liquid–liquid extraction [51]. For each oil, 5 g was mixed with 10 mL methanol-water solution (40:10, v/v) and ultrasonicated for 10 min. The hydromethanolic extracts were separated using a separation funnel. For the measurements with the sensors, 5 mL of hydromethanolic extract was added to 45 mL 10−1 M KCl solution and the CVs were registered. Six replicates for all samples and sensors were registered. These data were used as input in multivariate data analysis.

2.5. DPPH Method

The DPPH assay for the evaluation of antioxidant activity is a simple, cheap and effective method, one of the most commonly used to determine the antioxidant capacity of a compound, an extract or other biological matrices (plants, fruit, wine, honey) [52,53,54]. In its initial radical form, DPPH has an intense purple color, which changes to yellow when found in reduced form (Figure S1).
DPPH has a significant absorption band in the range 515–520 nm, making spectrophotometry an easy tool for measuring this color change and determining the antioxidant activity of the sample. The more this color changes, the more DPPH is reduced and the better the antioxidant activity of the sample [55]. The use of the DPPH assay provides an easy and rapid way to assess antioxidants by spectrophotometry, and various chemical compounds or natural products with antioxidant activity can be evaluated [56].

2.6. Galvinoxyl Method

The galvinoxyl method of determining antiradical activity is based on the use of the stable O-centered radical galvinoxyl, which is known to associate with the physiological action of oxygen radicals rather than the stable N-centered radical of DPPH [57]. Galvinoxyl exhibits strong absorption at 860 nm that is used for the spectrophotometric determination of the antioxidant activity based on a decrease in the absorbance intensity in the presence of antioxidants [58]. The same sensing mechanism of radical scavenging described in Figure S1 can be applied to this radical. However, the color change induced by exposure to antioxidants is not easily detected by the naked eye. The galvinoxyl radical-scavenging reaction is given in Figure S2.

2.7. Data Analysis

The input data used in the multivariate data analysis were the CVs obtained with three electrochemical sensors immersed in the hydromethanolic extracts of all oils under study. Six replicates CVs of all electrochemical sensors were registered for all the oil sample hydromethanolic extracts and all CV data were used as input in the multivariate data analysis.
The cyclic voltammograms were registered between −0.4 and 1.3 V and the scan rate was 0.1 V·s−1. No signal pretreatment was applied. All CVs were imported in Excel and the constant variable (potential values) was removed. The current values of all replicates and samples from the anodic scan were included in the input matrix. From the analysis of the CVs it was observed that the main differences between the samples was in the anodic part. In order to respect the convention that in the data matrix the samples must be the lines and the variables the columns, the matrix containing the anodic current values was transposed. In this way, a matrix with 264 rows (44 samples × 6 replicates) and 480 columns (3 sensors × 160 current values) for the anodic part of CV was obtained.
Multivariate data analysis was performed to determine if there were significant differences between the oils studied and for their classification as a function of type of oil, or country of origin (in the case of EVOOs).
Principal component analysis (PCA) was used to reduce the variables and discriminate into different classes. PCA is a multidimensional analysis that allows the transformation of the original variables into new ones, called principal components. The role of principal components is to explain the maximum amount of variance with the smallest number of components [59,60].
PLS-DA (partial least squares—discriminant analysis) has been used as a deterministic classification technique. The basis of PLS-DA consists primarily of applying a partial regression model using the least squares method on variables that are indicators of groups. The second step of PLS-DA is to classify the observations from the PLS regression results on the indicator variables [61]. By projecting intercorrelated data from a high-dimensional space into a low-dimensional orthogonal space, the newly formed variables, which are linear combinations of the original variables, become orthogonal to each other [62]. By finding the discriminant plane to effectively separate data into different classes, PLS-DA is capable of separating “tight” classes of observations on the basis of the X-variables (CVs of the sensors), according to a Y-vector that encodes the class membership in a set of categorized variables, denoted as positive and negative (1 and 0 values, respectively) [63].
Partial Least Squares regression (PLS) is a method which reduces the variables used to predict to a smaller set of predictors, which is then used to perform a regression [64]. PLS 1 corresponds to the case where there is only one dependent variable. The PLS1 regression model was used to establish correlations between electrochemical sensor responses and antioxidant activity determined by the DPPH spectrophotometric method or galvinoxyl method (% inhibition degree is the dependent variable).
Multivariate data analysis was performed using Matlab, Excel and Unscrambler.

3. Results and Discussion

3.1. Electrochemical Study of Oil Extracts with Nanomaterials-Based Sensors

To study electrochemical processes, reversibility of reactions and stability of the response of the three sensors, the CV electrochemical method was used. The determinations were carried out in the potential range between −0.4 and 1.3 V and the scan rate was 0.1 V·s−1.
In the first step, the behavior of the three electrodes CNT-GNP/SPE, CNF-GNP/SPE and GPH-GNP/SPE immersed in the extract solutions was studied. Figure 1 shows the CVs of the three sensors when immersed in the same extract from EVOO sample v1.
It can be seen that each sensor has a particular response when immersed in a solution of the same extract. These differences among the responses of the three electrodes is attributed to the redox activity of the phenolic compounds present in the sample to be analyzed [65], the oxidation and reduction processes being facilitated differently by the modifying nanomaterials present in the sensitive elements of the sensors [66,67].
It was also observed that the highest intensity at which the oxidation peak occurs is obtained in the case of GPH-GNP/SPCE (276.22 µA), while the intensity at which the reduction peak occurs is higher in the case of CNF-GNP/SPCE (−98.16 µA). These increases in oxidation and reduction current intensity could be attributed to the association of nanomaterials CNT, GPH and also CNF with GNP, achieving a synergistic effect and contributing to increase the conductivity of the electrodes and the electron transfer rate, thus increasing the sensitivity of the sensors [68,69]. Therefore, the three sensors immersed in the same extract solution provide complementary chemical composition information and the CVs are chemical fingerprints of the analyzed samples.
To highlight the differences occurring between extracts from different samples, the following figure shows the response of the CNF-GNP/SPCE sensor when immersed in EVOO sample v2, POO sample p2 and SFO sample s2 (Figure 2).
Important differences in peak intensity, position and shape were observed from one sample to another, depending mostly on the polyphenolic compound content of the respective samples. At the same time, a shift of oxidation peak potentials towards lower values is observed with increasing polyphenolic compounds content [70]. The results shown in Figure 2 indicate that the nature and concentration of the compounds found in different classes of oils give rise to a variety of electrochemical signals that can be used to discriminate between different types of oils. In particular, olive oils can be easily distinguished from seed oils due to their high polyphenol content [71].
Figure 3 shows the detection mechanism of mono- and di-phenolic compounds in the samples studied with voltammetric sensors. A single redox process is observed, involving the exchange of one electron and one proton in the case of mono-phenolic compounds, and the exchange of two electrons and two protons in a single step in the case of di-phenolic compounds, with the formation of the respective quinone derivative in both cases.
The nanomaterials from the sensitive element of the sensors facilitate the detection of phenolic compounds from the samples, the CVs being well defined, with reduced noise and high current peaks. The peak potentials and currents are related to the nature of the analyzed samples.

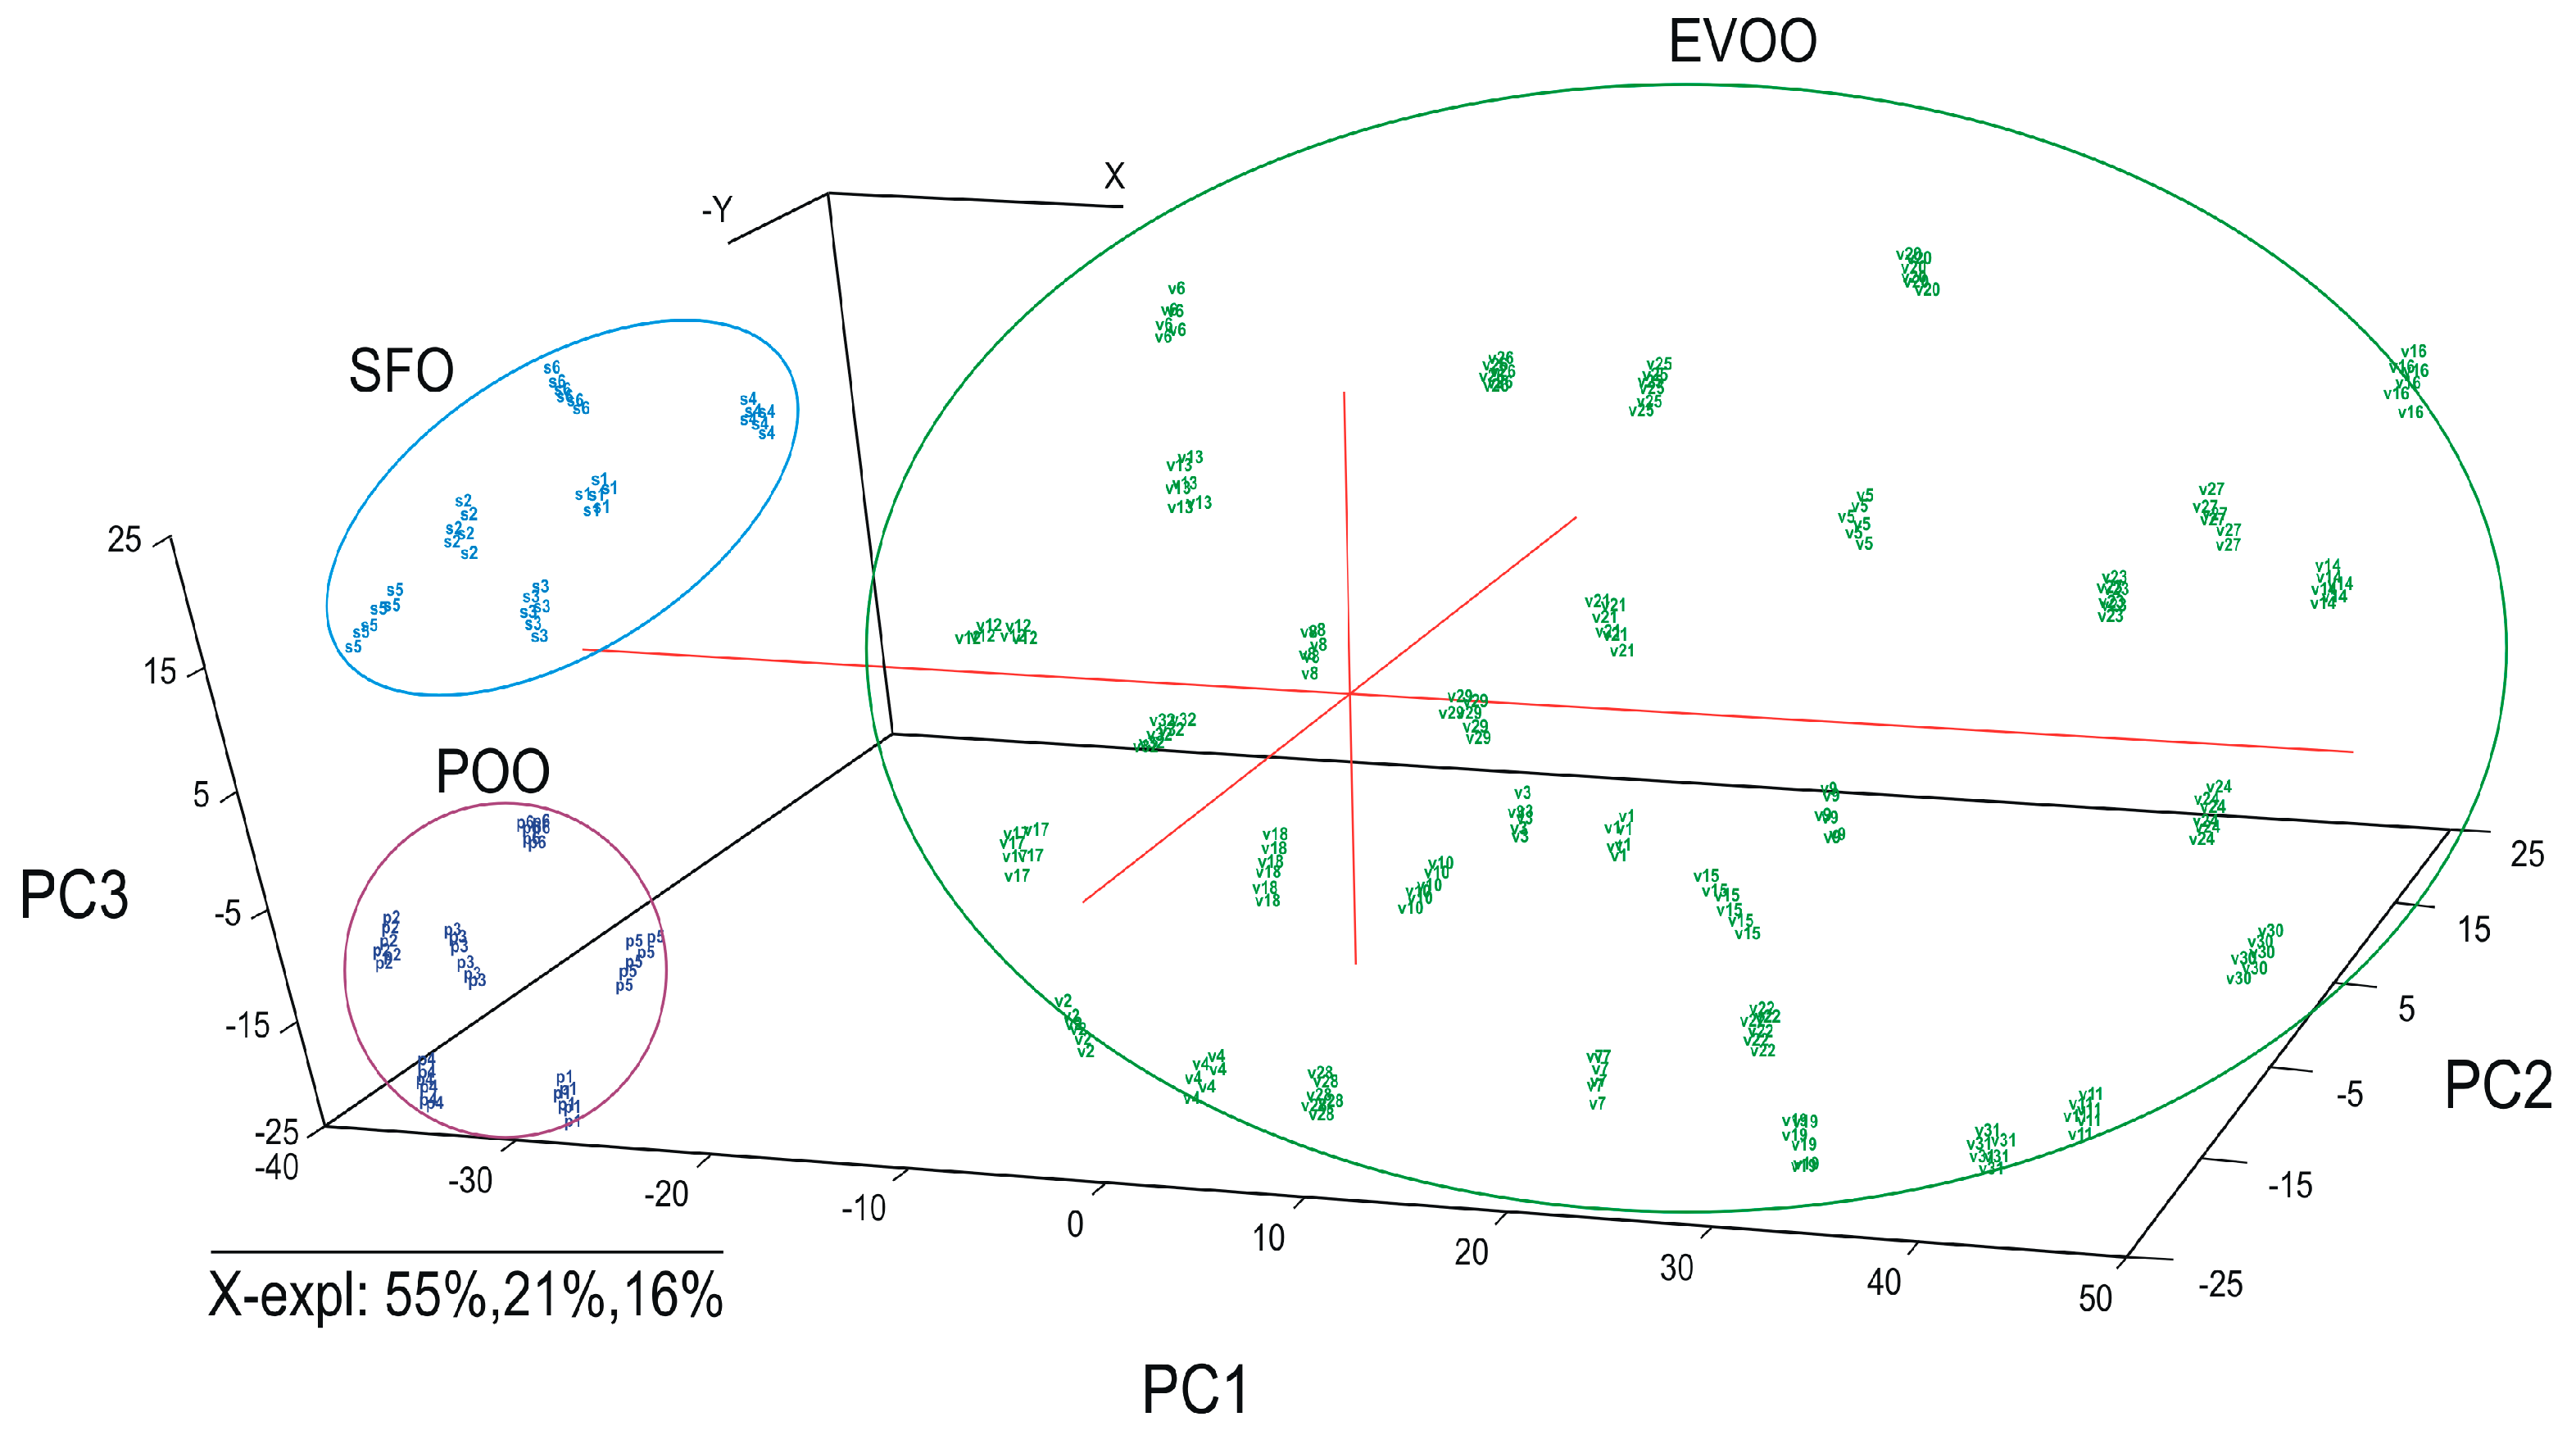
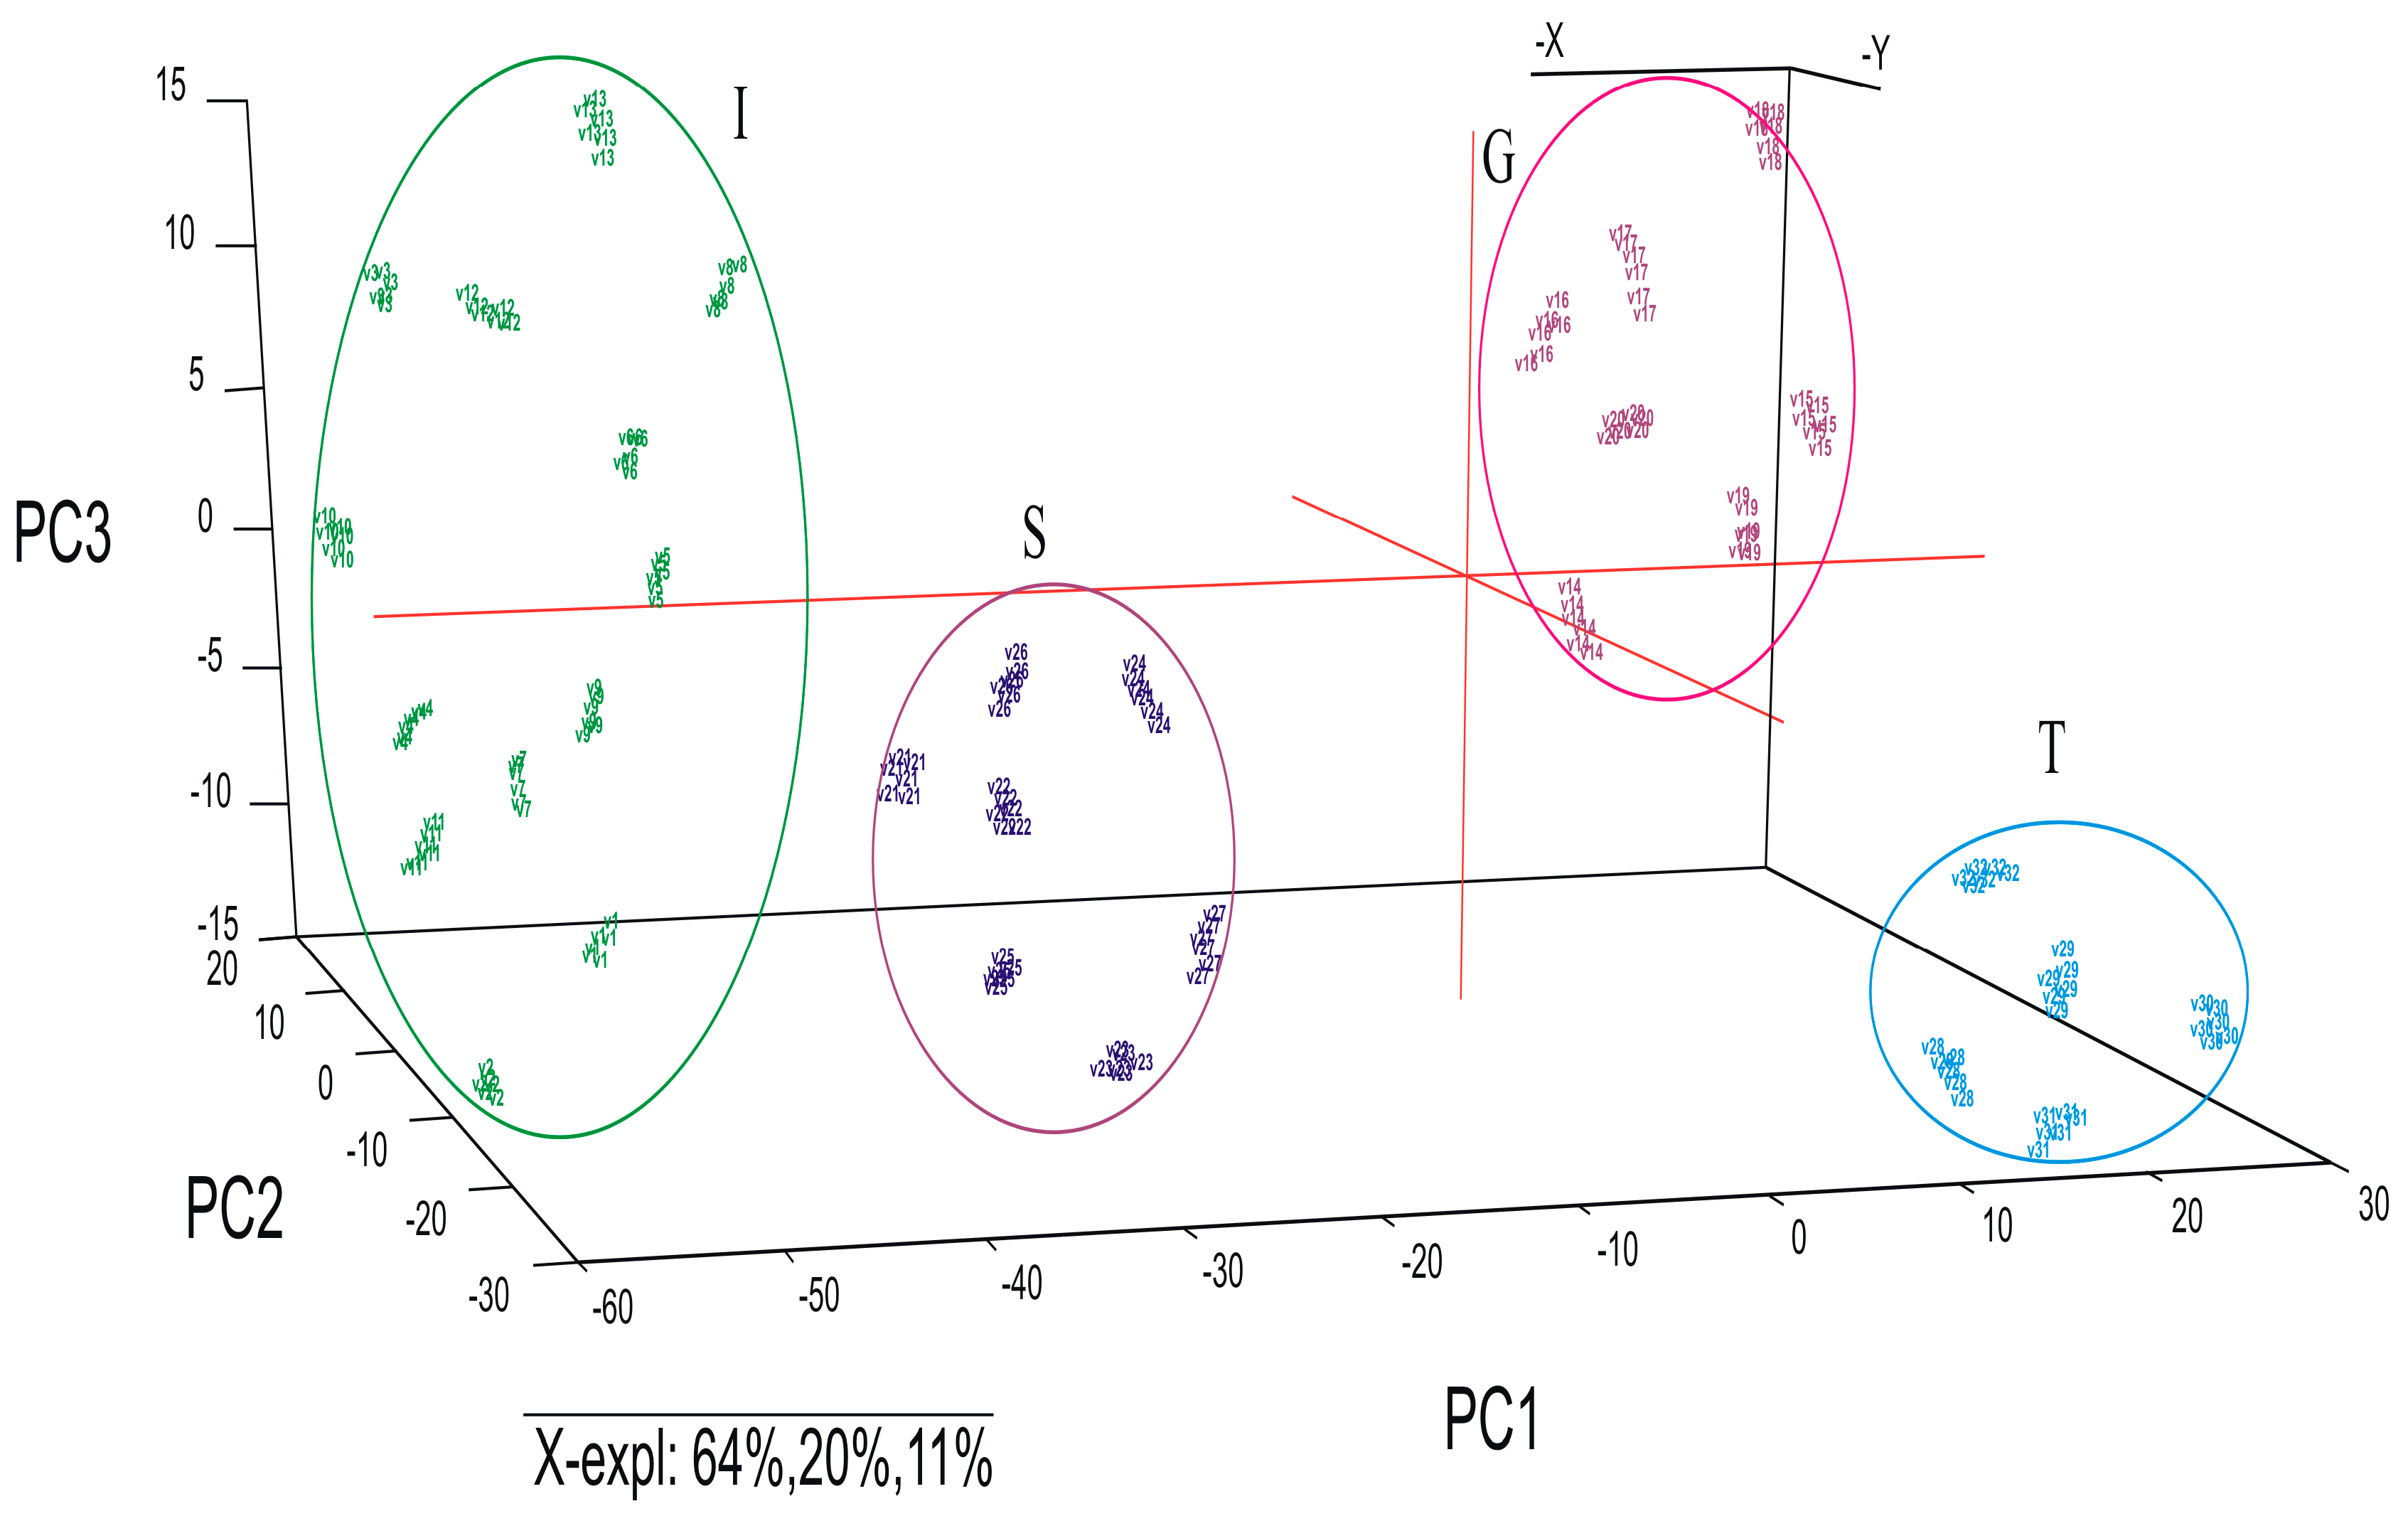
3.2. Discrimination and Classification of Oils Using Multivariate Data Analysis

In the first step, electrochemical data from the input matrix were used to perform the PCA. The data from the input matrix were firstly pre-processed by centering the variables and scaling them to unit variance. The purpose of this treatment was to give all variables included in PCA an equal chance to influence the model, regardless of their original variance. The normalization was performed with the 1/(Standard Deviation) method. For this data analysis, the entire data matrix was split into two different data sets including the specific samples and all the corresponding variables differentiated by different criteria: type of the oils (all samples) and the country of origin (all the EVOO samples). The results are presented as three-dimensional score plots, differentiated by EVOO, POO or SFO—all samples were included in the model (Figure 4), and by country of origin—Italy, Greece, Spain and Tunisia—for all the EVOO samples (Figure 5).
The graph in Figure 4 shows that the system based on the three sensors immersed in different solutions of hydromethanolic extracts is able to discriminate EVOO from POO and SFO samples, with the first three main components explaining 92% of the variation. Thus, the first principal component explains 55% of the variance of the electrochemical signal, the second principal component accounts for 21% and the third principal component for 16%. It can be seen that EVOO appeared in the right region of the score plot (mostly at positive PC1 values), while POO appeared on the left side of the plot (at negative PC1 values). SFO also appeared at the negative PC1 values, but was well discriminated from other types of oils. PC2 is relevant for the discrimination between POO and SFO. Furthermore, PC2 is important for the discrimination of the samples of each category. As can be observed, the three groups are very well separated and this indicates that the samples could be clearly discriminated using the electrochemical sensors array based on nanomaterials.
Another principal component analysis was carried out to explore the structure of the data and the possibility of discriminating EVOO samples by country of origin. The scores plot of PCA based on the CVs of all voltammetric sensors immersed in the extracts of EVOOs is presented in Figure 5.
In the PCA score plot, four distinct groups of EVOOs could be found, grouped according to country of origin (Figure 5). The members of the first group on the left side of the scores plot are olive oil samples from Italy. This group is well separated from the second group consisting of samples from Spain. The samples from Greece and Tunisia are separated from the other two categories and are found on the right side of the plot (at positive values of PC1). PC2 is very important in the discrimination of the EVOOs from Greece and Tunisia. All three PCs, which explain 95% of the variance, have the highest importance in the discrimination of the samples in agreement with EVOO country of origin, indicating that the geographical location had a great influence on the chemical composition of the olive oils.
The PLS-DA technique, a supervised classification method that allows verification of the assignment of a sample to a particular group and calculation of the calibration and validation error, was used to confirm the groups observed in the principal component analysis.
PLS-DA modeling involves two main procedures, PLS-DA component construction (dimension reduction) and prediction model construction (discriminant analysis). The output of the PLS-DA algorithms is the X-score (PLS-DA scores), which represents the original data X in a lower-dimensional subspace, and the predicted class membership matrix (Ypred), which estimates the class membership of the samples [64]. PLS-DA is used to optimize separation between different groups of samples, which is accomplished by linking two data matrices X (sensor data) and Y (classes of samples).
PLS-DA aims to maximize the covariance between the independent variables X (sensors data) and the corresponding dependent variable Y (classes of samples) of highly multidimensional data by finding a linear subspace of the explanatory variables [62]. This new subspace permits the prediction of the Y variable based on a reduced number of factors (latent variables, LV). These factors describe the behavior of dependent variables Y and they span the subspace onto which the independent variables X are projected [63]. For example, if the samples are divided into two different classes, then the variable Y will comprise a single vector, which will have an entry of 0 for all samples in the first class and an entry of 1 for all samples in the second class. When the data contain three classes, then the three groups will be binarily encoded in 3 variables with the Y matrix as [1 0 0] for all samples from class A, [0 1 0] for samples from class B, and finally [0 0 1] for samples from class C. This is the case for PLS-DA taking into account the type of oil: EVOO, POO and SFO.
Figure 6 shows the PLS-DA scores plots developed from the same data used for PCA (X matrix), and the dependent variables were the classification criteria observed in PCA scores plots (Y matrix): type of oil (Figure 6a) and country of origin (Figure 6b), respectively. The random test cross-validation method was used to validate the models. In this method, the training and test samples are randomly selected. The random test was performed for 100 runs by removing 2 randomly selected samples. The optimal number of latent variables (LV) was determined according to the minimum predicted residual error sum of squares.
In Figure 6, it can be seen that the distribution of the samples in the scores plots is similar to that observed in the case of the PCA scores plots. However, a greater separation of the sample groups based on different criteria was observed.
The quantitative data of all PLS-DA models are collected in Table 2, with correlation coefficients greater than 0.97 and root mean square errors very low at both calibration and validation.
From these results, it can be concluded that the electrochemical data obtained with the voltammetric sensors based on different carbonaceous nanomaterials and gold nanoparticles can be successfully used for the classification of the oils based on different criteria such as type of oil for EVOO, POO and SFO samples, or country of origin for EVOO samples.

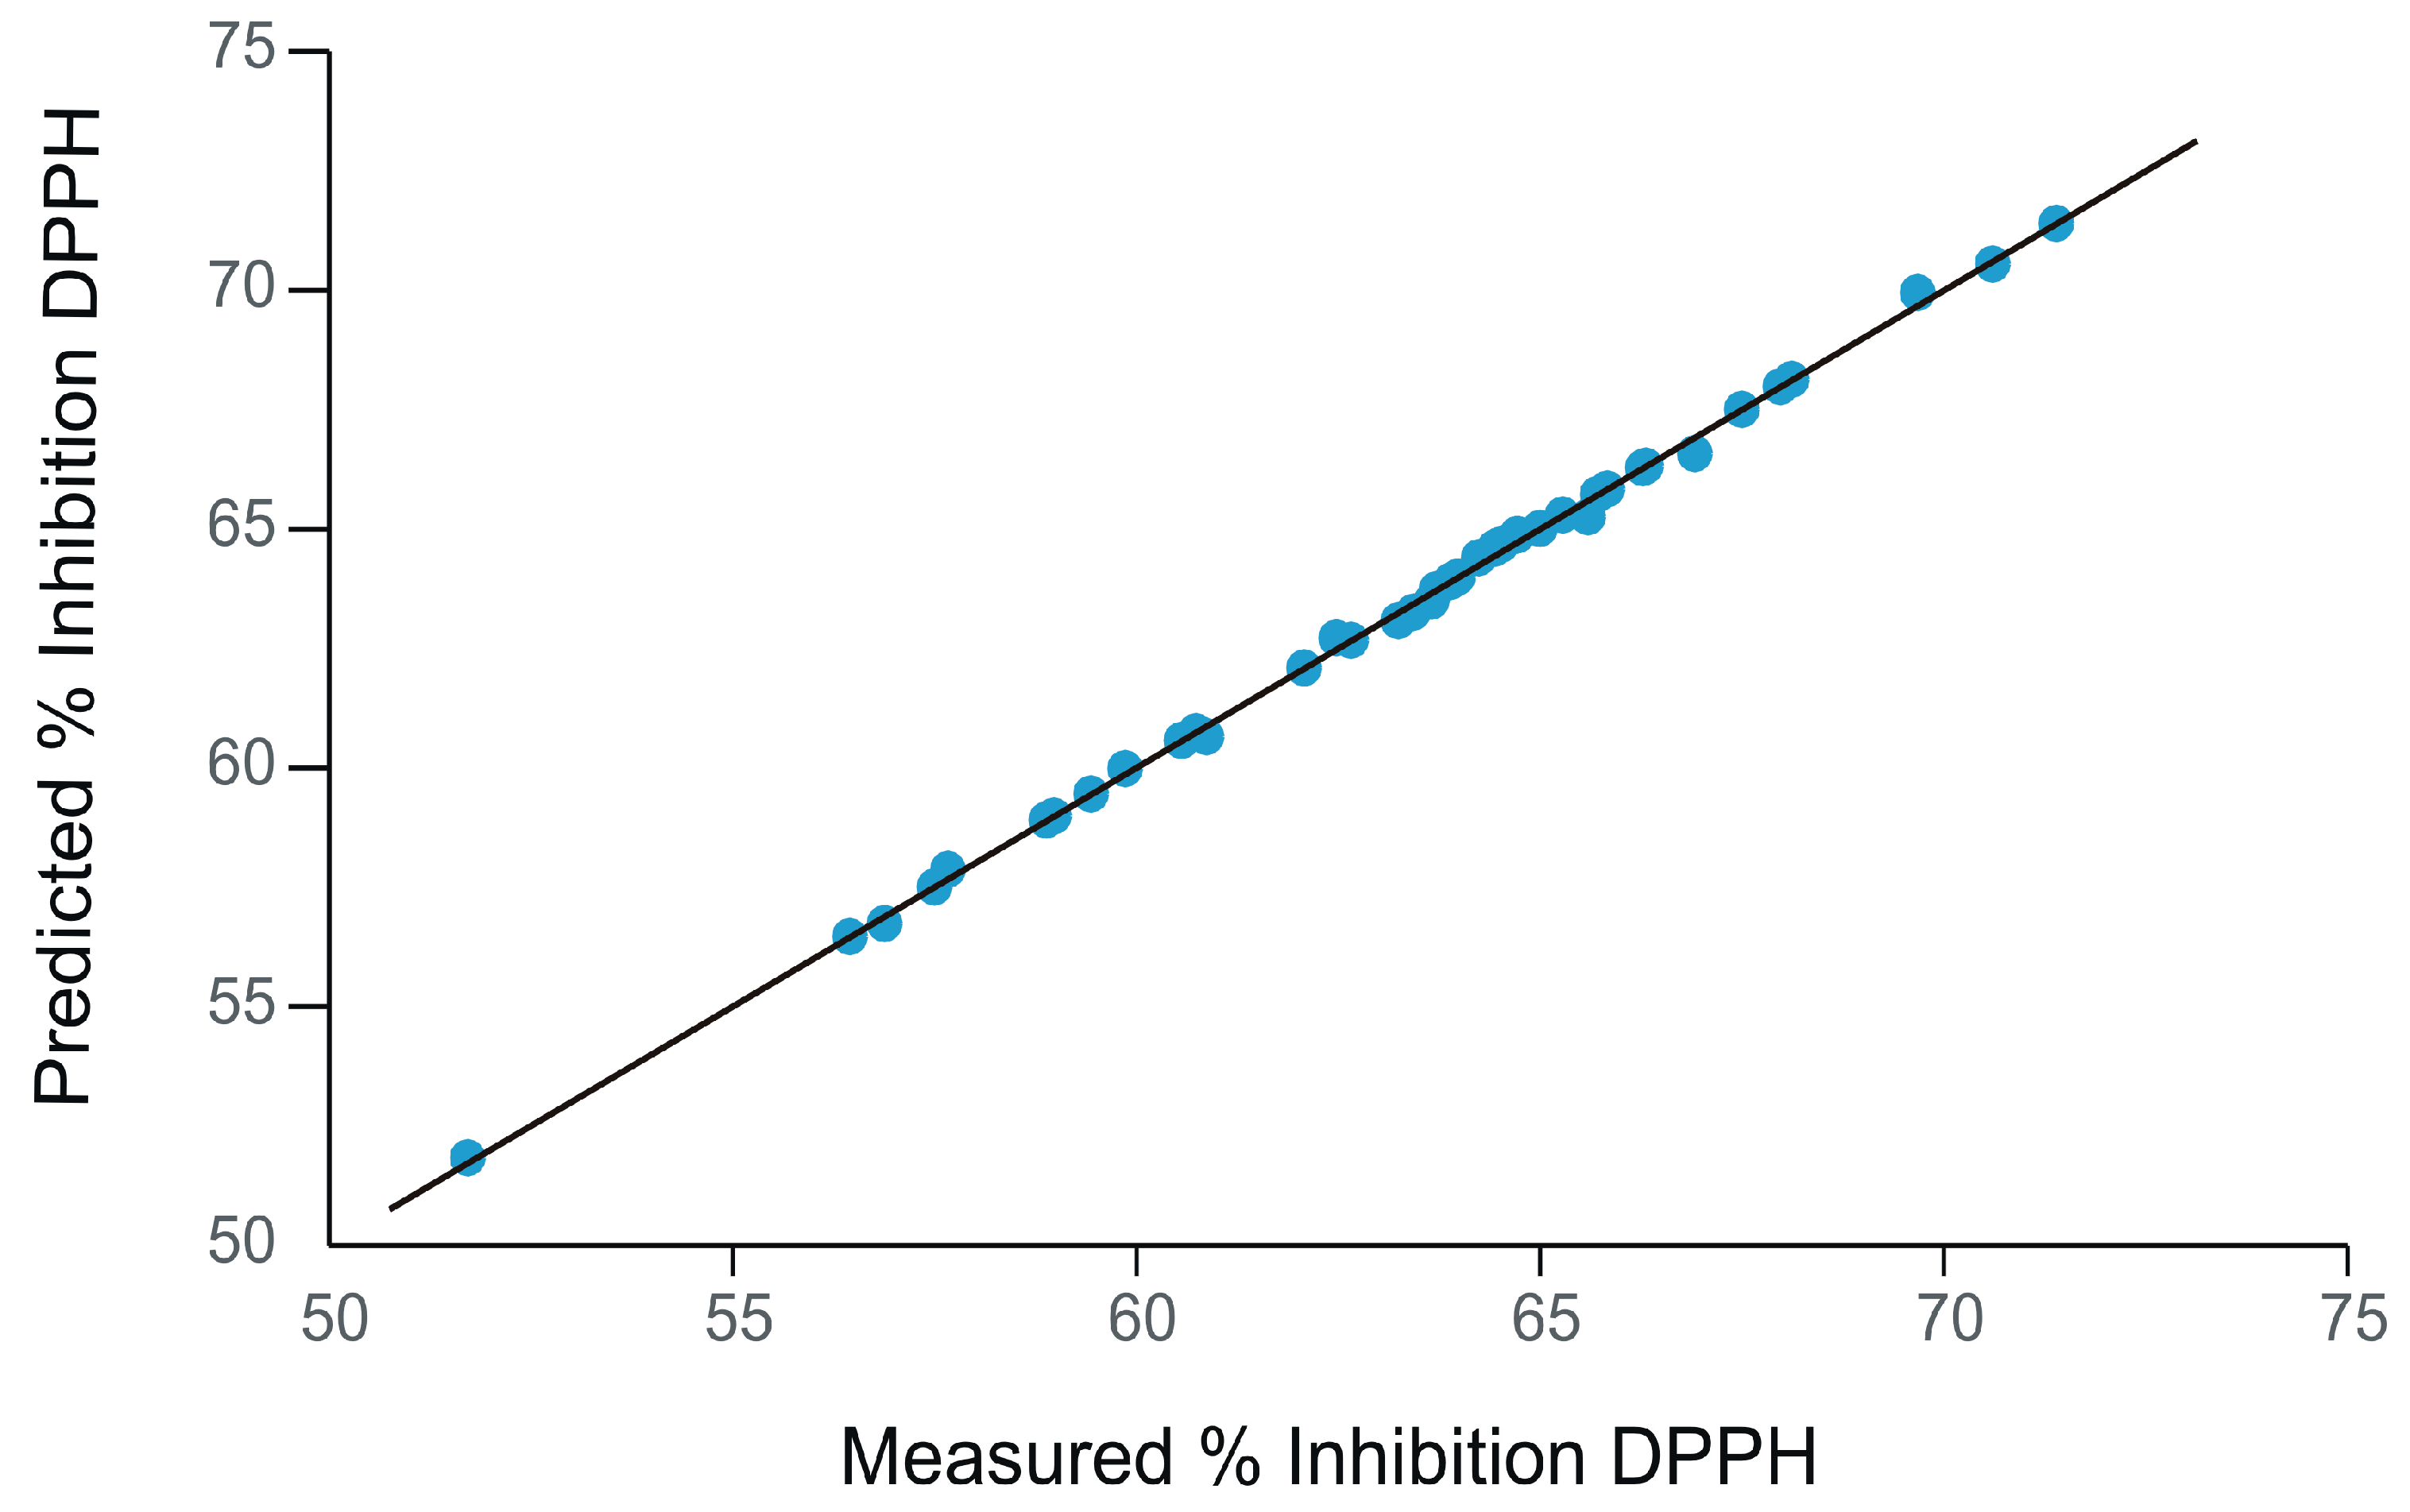
3.3. Determination of Antioxidant Activity. Correlation between Sensor Response and Spectrophotometric Measurements to Determine Antioxidant Activity

An evaluation of antioxidant activity with the DPPH spectrophotometric method was performed according to the method previously described by Gali et al. [72]. The assay was carried out by adding volumes of 1 mL extract solution to 3 mL 0.1 mM DPPH ethanolic solution in the spectrophotometer cuvettes and then measuring the absorbance at λ = 517 nm towards ethanol.
For the application of the galvinoxyl method for the analysis of oil samples, volumes of 1 mL extract solution were added to 3 mL 0.1 mM galvinoxyl solution in the spectrophotometer cuvettes and the absorbance for each sample was then measured at 860 nm towards ethanol after 20 min [73].
For both methods, the percentage of DPPH inhibition and the percentage of galvinoxyl inhibition were calculated according to the following equation [74]:
% Inhibition = ( AD AE AD ) × 100
where AD is the absorbance of the control solutions and AE is the absorbance of the test solutions.
The % inhibition results obtained by both methods are shown in Table 3. All the analyses were carried out in triplicate and the average values are reported. The standard deviation of the measurements was lower than 2% for all the measurements.
As can be seen from the table above, the percentage inhibition values are mostly close in value, but the highest inhibition percentage was obtained for Costa d’Oro L’Italiano EVOO. This result can be correlated with a higher intensity of the anodic peak and, therefore, with a higher content of polyphenolic compounds.
The next step of the study was to establish correlations between the electrochemical signals provided by the sensors and the data obtained from the spectrophotometric determination of antioxidant activity by the DPPH and galvinoxyl methods.
PLS1 was used as a prediction technique to correlate the voltammetric data obtained with the sensors with the antioxidant activity quantified as capacity of free radical scavenging. The independent variables (X matrix) were all CVs obtained with the sensors and the dependent variable was the percentage of DPPH inhibition or the percentage of galvinoxyl inhibition, respectively. The normalization of the data was performed with the 1/(Standard Deviation) method.
The results of PLS1 regression models are presented in the form of the dependences between predicted antioxidant activity and measured antioxidant activity.
Figure 7 shows the dependence plot between the percentage inhibition value of DPPH free radical predicted from voltammetric data and the values measured by the spectrophotometric method.
As can be observed in Figure 7, the voltammetric data obtained with the sensors are able to predict the antioxidant properties of the samples expressed as the capacity to scavenge the free radical DPPH with good accuracy. Similar results were obtained for the galvinoxyl test.
Table 4 shows the quantitative data obtained from the CV-DPPH and CV-galvinoxyl PLS1 regression models. It can be noted that both calibration and validation values indicate good model performance (correlation coefficient close to 1). In addition, low values of the root mean square error at calibration (RMSEC) and root mean square error at prediction (RMSEP) were obtained for both PLS1 models.
From the data included in Table 4, it can be seen that, from the data obtained with the electrochemical sensors by CV, it is possible to accurately estimate the antioxidant activity of the oils expressed as the inhibition capacity towards the free radicals DPPH and galvinoxyl, respectively.

4. Conclusions

In this study, models were developed for discriminating and classifying oil samples based on different criteria, using an electrochemical method based on SPE modified with different carbonaceous nanomaterials and GNP. The electrochemical signals were used as input variables in multivariate data analysis studies. At the same time, it was established that there was a very good correlation between the electrochemical responses of the sensors when immersed in solutions from the 44 oil samples studied and the data obtained from the DPPH and galvinoxyl spectrophotometric assays for the assessment of antioxidant activity. As a result of this study, it can be concluded that electrochemical sensors can be useful for the estimation of antioxidant activity of different types of oils, including EVOO, but also that they can be used for the discrimination and classification of vegetable oils.
The use of sensors and biosensors in industry and quality control laboratories is still limited, even though these have numerous advantages and adequate sensitivity. Further studies will include biosensors capable of detecting biomarkers that could improve the performance of the analytical system for discrimination, classification or authentication. Thus, the development of databases using analytical information obtained by electroanalytical methods, together with the use of appropriate statistical tools could be useful in increasing the performance of systems for the quality control of EVOOs. Another research perspective would be the development of a lab-on-a-chip device useful in the routine analysis of olive oil at different stages of production, from harvesting to marketing, and also to analyse oxidative stability.

Supplementary Materials

The following supporting information can be downloaded at: https://0-www-mdpi-com.brum.beds.ac.uk/article/10.3390/ijms24033010/s1.

Author Contributions

Conceptualization, C.A.; methodology, C.A. and I.G.M.; validation, C.A. and I.G.M.; formal analysis, I.G.M.; investigation, C.A. and I.G.M.; data curation, C.A. and I.G.M.; writing—original draft preparation, I.G.M.; writing—review and editing, C.A.; supervision, C.A. All authors have read and agreed to the published version of the manuscript.

Funding

This work was supported by a grant from the Romanian Ministry of Education and Research, CNCS—UEFISCDI, project number PN-III-P4-ID-PCE-2020-0923, within PNCDI III.

Institutional Review Board Statement

Not applicable.

Informed Consent Statement

Not applicable.

Data Availability Statement

Not applicable.

Acknowledgments

The work of author Irina Georgiana Munteanu was supported by the project “PROINVENT”, Contract no. 62487/03.06.2022—POCU/993/6/13—Code 153299, financed by The Human Capital Operational Programme 2014–2020 (POCU), Romania.

Conflicts of Interest

The authors declare no conflict of interest.

References

  1. Dugo, L.; Russo, M.; Cacciola, F.; Mandolfino, F.; Salafia, F.; Vilmercati, A.; Fanali, C.; Casale, M.; De Gara, L.; Dugo, P.; et al. Determination of the Phenol and Tocopherol Content in Italian High-Quality Extra-Virgin Olive Oils by Using LC-MS and Multivariate Data Analysis. Food Anal. Methods 2020, 13, 1027–1041. [Google Scholar] [CrossRef]
  2. Sain, A.; Sahu, S.; Naskar, D. Potential of Olive Oil and Its Phenolic Compounds as Therapeutic Intervention against Colorectal Cancer: A Comprehensive Review. Br. J. Nutr. 2021, 128, 1257–1273. [Google Scholar] [CrossRef] [PubMed]
  3. Bodurov, I.; Vlaeva, I.; Marudova, M.; Yovcheva, T.; Nikolova, K.; Eftimov, T.; Slavova, V. Detection of Adulteration in Olive Oils Using Optical and Thermal Methods. Bulg. Chem. Commun. 2013, 45, 81–85. [Google Scholar]
  4. Conte, L.; Bendini, A.; Valli, E.; Lucci, P.; Moret, S.; Maquet, A.; Lacoste, F.; Brereton, P.; García-González, D.L.; Moreda, W.; et al. Olive Oil Quality and Authenticity: A Review of Current EU Legislation, Standards, Relevant Methods of Analyses, Their Drawbacks and Recommendations for the Future. Trends Food Sci. Technol. 2020, 105, 483–493. [Google Scholar] [CrossRef]
  5. International Olive Council (IOC). Olive World: Olive Oil. Available online: https://www.internationaloliveoil.org/olive-world/olive-oil/ (accessed on 2 November 2022).
  6. International Olive Council. Trade Standard Applying to Olive Oils and Olive-Pomace Oils. COI/T.15/NC No. 3/Rev. 16. Available online: https://www.internationaloliveoil.org/wp-content/uploads/2021/07/COI-T15-NC3-REV-16-2021-_ENG.pdf (accessed on 2 November 2022).
  7. Codex Stan 33-1981 (2021). Standard for Olive Oils and Olive Pomace Oils. Adopted in 1981 Revision: 1989, 2003, 2015. Amendment: 2009, 2013. Available online: http://www.fao.org/input/download/standards/88/CXS_033e_2015.pdf (accessed on 10 November 2022).
  8. Carrasco-Pancorbo, A.; Cerretani, L.; Bendini, A.; Segura-Carretero, A.; Gallina-Toschi, T.; Fernández-Gutiérrez, A. Analytical Determination of Polyphenols in Olive Oils. J. Sep. Sci. 2005, 28, 837–858. [Google Scholar] [CrossRef]
  9. Jeong, H.-M.; Kwon, H.-C.; Xu, B.; Jung, D.; Han, M.; Kwon, D.-H.; Kang, S.-W. Taste Sensor Based on the Floating Gate Structure of a Lateral Double-Diffused Metal-Oxide Semiconductor. Sens. Actuators B Chem. 2020, 308, 127661. [Google Scholar] [CrossRef]
  10. Paciulli, M.; Difonzo, G.; Conte, P.; Flamminii, F.; Piscopo, A.; Chiavaro, E. Physical and Thermal Evaluation of Olive Oils from Minor Italian Cultivars. Foods 2021, 10, 1004. [Google Scholar] [CrossRef]
  11. Gomes, T.; Caponio, F.; Bruno, G.; Summo, C.; Paradiso, V.M. Effects of Monoacylglycerols on the Oxidative Stability of Olive Oil. J. Sci. Food Agric. 2010, 90, 2228–2232. [Google Scholar] [CrossRef]
  12. Valli, E.; Ayyad, Z.; Bendini, A.; Adrover-Obrador, S.; Femenia, A.; Gallina Toschi, T. Extra Virgin Olive Oil Stored in Different Conditions: Focus on Diglycerides. Ital. J. Food Sci. 2015, 27, 166–172. [Google Scholar] [CrossRef]
  13. Grassi, S.; Jolayemi, O.S.; Giovenzana, V.; Tugnolo, A.; Squeo, G.; Conte, P.; De Bruno, A.; Flamminii, F.; Casiraghi, E.; Alamprese, C. Near Infrared Spectroscopy as a Green Technology for the Quality Prediction of Intact Olives. Foods 2021, 10, 1042. [Google Scholar] [CrossRef] [PubMed]
  14. Bakre, S.M.; Gadmale, D.K.; Toche, R.B.; Gaikwad, V.B. Rapid Determination of Alpha Tocopherol in Olive Oil Adulterated with Sunflower Oil by Reversed Phase High-Performance Liquid Chromatography. J. Food Sci. Technol. 2015, 52, 3093–3098. [Google Scholar] [CrossRef] [PubMed] [Green Version]
  15. Kyçyk, O.; Aguilera, M.P.; Gaforio, J.J.; Jiménez, A.; Beltrán, G. Sterol Composition of Virgin Olive Oil of Forty-Three Olive Cultivars from the World Collection Olive Germplasm Bank of Cordoba. J. Sci. Food Agric. 2016, 96, 4143–4150. [Google Scholar] [CrossRef]
  16. Hatzakis, E.; Koidis, T.; Boskou, D.; Dais, P. Determination of Phospholipids in Olive Oil by 31P NMR Spectroscopy. J. Agric. Food Chem. 2008, 56, 6232–6240. [Google Scholar] [CrossRef]
  17. Giuffrè, A.M. Wax Ester Variation in Olive Oils Produced in Calabria (Southern Italy) During Olive Ripening. J. Am. Oil Chem. Soc. 2014, 91, 1355–1366. [Google Scholar] [CrossRef]
  18. Angelo Maria Giuffrè The Effect of Cultivar and Harvest Season on the N-Alkane and the n-Alkene Composition of Virgin Olive Oil. Eur. Food Res. Technol. 2021, 247, 25–36. [CrossRef]
  19. Kalua, C.M.; Allen, M.S.; Bedgood, D.R.; Bishop, A.G.; Prenzler, P.D.; Robards, K. Olive Oil Volatile Compounds, Flavour Development and Quality: A Critical Review. Food Chem. 2007, 100, 273–286. [Google Scholar] [CrossRef]
  20. Lozano-Castellón, J.; López-Yerena, A.; Domínguez-López, I.; Siscart-Serra, A.; Fraga, N.; Sámano, S.; López-Sabater, C.; Lamuela-Raventós, R.M.; Vallverdú-Queralt, A.; Pérez, M. Extra Virgin Olive Oil: A Comprehensive Review of Efforts to Ensure Its Authenticity, Traceability, and Safety. Compr. Rev. Food Sci. Food Saf. 2022, 21, 2639–2664. [Google Scholar] [CrossRef]
  21. Marx, Í.M.G.; Casal, S.; Rodrigues, N.; Cruz, R.; Veloso, A.C.A.; Pereira, J.A.; Peres, A.M. Does Water Addition during the Industrial Milling Phase Affect the Chemical-Sensory Quality of Olive Oils? The Case of Cv. Arbequina Oils. Food Chem. 2022, 395, 133570. [Google Scholar] [CrossRef]
  22. Marx, Í.; Veloso, A.; Dias, L.; Casal, S.; Pereira, J.; Peres, A. Electrochemical Sensor-Based Devices for Assessing Bioactive Compounds in Olive Oils: A Brief Review. Electronics 2018, 7, 387. [Google Scholar] [CrossRef]
  23. Marx, Í.M.G.; Casal, S.; Rodrigues, N.; Veloso, A.C.A.; Pereira, J.A.; Peres, A.M. Estimating Hydroxytyrosol-Tyrosol Derivatives Amounts in Cv. Cobrançosa Olive Oils Based on the Electronic Tongue Analysis of Olive Paste Extracts. LWT 2021, 147, 111542. [Google Scholar] [CrossRef]
  24. Franconi, F.; Coinu, R.; Carta, S.; Urgeghe, P.P.; Ieri, F.; Mulinacci, N.; Romani, A. Antioxidant Effect of Two Virgin Olive Oils Depends on the Concentration and Composition of Minor Polar Compounds. J. Agric. Food Chem. 2006, 54, 3121–3125. [Google Scholar] [CrossRef] [PubMed]
  25. Vinha, A.F.; Ferreres, F.; Silva, B.M.; Valentao, P.; Goncalves, A.; Pereira, J.A.; Oliveira, M.B.; Seabra, R.M.; Andrade, P.B. Phenolic Profiles of Portuguese Olive Fruits (Olea Europaea L.): Influences of Cultivar and Geographical Origin. Food Chem. 2005, 89, 561–568. [Google Scholar] [CrossRef]
  26. Gómez-Rico, A.; Salvador, M.D.; La Greca, M.; Fregapane, G. Phenolic and Volatile Compounds of Extra Virgin Olive Oil (Olea Europaea L. Cv. Cornicabra) with Regard to Fruit Ripening and Irrigation Management. J. Agric. Food Chem. 2006, 54, 7130–7136. [Google Scholar] [CrossRef]
  27. Gómez-Alonso, S.; Fregapane, G.; Salvador, M.D.; Gordon, M.H. Changes in Phenolic Composition and Antioxidant Activity of Virgin Olive Oil during Frying. J. Agric. Food Chem. 2003, 51, 667–672. [Google Scholar] [CrossRef]
  28. Bakhouche, A. Literature Review on Production Process To Obtain Extra Virgin Olive Oil Enriched in Bioactive Compounds. Potential Use of Byproducts as Alternative Sources of Polyphenols. J. Agric. Food Chem. 2013, 61, 5179–5188. [Google Scholar]
  29. García, A.; Brenes, M.; García, P.; Romero, C.; Garrido, A. Phenolic Content of Commercial Olive Oils. Eur. Food Res. Technol. 2003, 216, 520–525. [Google Scholar] [CrossRef]
  30. Antonini, E.; Farina, A.; Leone, A.; Mazzara, E.; Urbani, S.; Selvaggini, R.; Servili, M.; Ninfali, P. Phenolic Compounds and Quality Parameters of Family Farming versus Protected Designation of Origin (PDO) Extra-Virgin Olive Oils. J. Food Compos. Anal. 2015, 43, 75–81. [Google Scholar] [CrossRef]
  31. Tasioula-Margari, M.; Tsabolatidou, E. Extraction, Separation, and Identification of Phenolic Compounds in Virgin Olive Oil by HPLC-DAD and HPLC-MS. Antioxidants 2015, 4, 548–562. [Google Scholar] [CrossRef]
  32. Suárez, M.; Macià, A.; Romero, M.-P.; Motilva, M.-J. Improved Liquid Chromatography Tandem Mass Spectrometry Method for the Determination of Phenolic Compounds in Virgin Olive Oil. J. Chromatogr. A 2008, 1214, 90–99. [Google Scholar] [CrossRef]
  33. Ríos, J.J.; Gil, M.J.; Gutiérrez-Rosales, F. Solid-Phase Extraction Gas Chromatography-Ion Trap-Mass Spectrometry Qualitative Method for Evaluation of Phenolic Compounds in Virgin Olive Oil and Structural Confirmation of Oleuropein and Ligstroside Aglycons and Their Oxidation Products. J. Chromatogr. A 2005, 1093, 167–176. [Google Scholar] [CrossRef] [PubMed]
  34. Gómez Caravaca, A.M.; Carrasco Pancorbo, A.; Cañabate Díaz, B.; Segura Carretero, A.; Fernández Gutiérrez, A. Electrophoretic Identification and Quantitation of Compounds in the Polyphenolic Fraction of Extra-Virgin Olive Oil. Electrophoresis 2005, 26, 3538–3551. [Google Scholar] [CrossRef] [PubMed]
  35. Christophoridou, S.; Dais, P. Novel Approach to the Detection and Quantification of Phenolic Compounds in Olive Oil Based on 31P Nuclear Magnetic Resonance Spectroscopy. J. Agric. Food Chem. 2006, 54, 656–664. [Google Scholar] [CrossRef]
  36. Mora-Ruiz, M.E.; Reboredo-Rodríguez, P.; Salvador, M.D.; González-Barreiro, C.; Cancho-Grande, B.; Simal-Gándara, J.; Fregapane, G. Assessment of Polar Phenolic Compounds of Virgin Olive Oil by NIR and Mid-IR Spectroscopy and Their Impact on Quality. Eur. J. Lipid Sci. Technol. 2017, 119, 1600099. [Google Scholar] [CrossRef]
  37. Bounegru, A.V.; Apetrei, C. Evaluation of Olive Oil Quality with Electrochemical Sensors and Biosensors: A Review. Int. J. Mol. Sci. 2021, 22, 12708. [Google Scholar] [CrossRef]
  38. Rodrigues, N.; Marx, Í.M.G.; Dias, L.G.; Veloso, A.C.A.; Pereira, J.A.; Peres, A.M. Monitoring the Debittering of Traditional Stoned Green Table Olives during the Aqueous Washing Process Using an Electronic Tongue. LWT 2019, 109, 327–335. [Google Scholar] [CrossRef]
  39. Harzalli, U.; Rodrigues, N.; Veloso, A.C.A.; Dias, L.G.; Pereira, J.A.; Oueslati, S.; Peres, A.M. A Taste Sensor Device for Unmasking Admixing of Rancid or Winey-Vinegary Olive Oil to Extra Virgin Olive Oil. Comput. Electron. Agric. 2018, 144, 222–231. [Google Scholar] [CrossRef]
  40. Martini, E.; Tomassetti, M.; Campanella, L.; Fortuna, A. Reducing the Pollutant Load of Olive Mill Wastewater by Photocatalytic Membranes and Monitoring the Process Using Both Tyrosinase Biosensor and COD Test. Front. Chem. 2013, 1, 36. [Google Scholar] [CrossRef]
  41. Astolfi, M.L.; Marini, F.; Frezzini, M.A.; Massimi, L.; Capriotti, A.L.; Montone, C.M.; Canepari, S. Multielement Characterization and Antioxidant Activity of Italian Extra-Virgin Olive Oils. Front. Chem. 2021, 9, 769620. [Google Scholar] [CrossRef]
  42. Blandon-Naranjo, L.; Alaniz, R.D.; Zon, M.A.; Fernández, H.; Granero, A.M.; Robledo, S.N.; Pierini, G.D. Development of a Voltammetric Electronic Tongue for the Simultaneous Determination of Synthetic Antioxidants in Edible Olive Oils. Talanta 2022, 124123. [Google Scholar] [CrossRef] [PubMed]
  43. Marx, Í.M.G.; Rodrigues, N.; Veloso, A.C.A.; Casal, S.; Pereira, J.A.; Peres, A.M. Effect of Malaxation Temperature on the Physicochemical and Sensory Quality of Cv. Cobrançosa Olive Oil and Its Evaluation Using an Electronic Tongue. LWT 2021, 137, 110426. [Google Scholar] [CrossRef]
  44. Rodrigues, N.; Marx, Í.M.G.; Casal, S.; Dias, L.G.; Veloso, A.C.A.; Pereira, J.A.; Peres, A.M. Application of an Electronic Tongue as a Single-Run Tool for Olive Oils’ Physicochemical and Sensory Simultaneous Assessment. Talanta 2019, 197, 363–373. [Google Scholar] [CrossRef]
  45. Calvini, R.; Pigani, L. Toward the Development of Combined Artificial Sensing Systems for Food Quality Evaluation: A Review on the Application of Data Fusion of Electronic Noses, Electronic Tongues and Electronic Eyes. Sensors 2022, 22, 577. [Google Scholar] [CrossRef] [PubMed]
  46. Tarapoulouzi, M.; Agriopoulou, S.; Koidis, A.; Proestos, C.; Enshasy, H.A.E.; Varzakas, T. Recent Advances in Analytical Methods for the Detection of Olive Oil Oxidation Status during Storage along with Chemometrics, Authenticity and Fraud Studies. Biomolecules 2022, 12, 1180. [Google Scholar] [CrossRef] [PubMed]
  47. Di Rosa, A.R.; Leone, F.; Cheli, F.; Chiofalo, V. Fusion of Electronic Nose, Electronic Tongue and Computer Vision for Animal Source Food Authentication and Quality Assessment–A Review. J. Food Eng. 2017, 210, 62–75. [Google Scholar] [CrossRef]
  48. Leon-Medina, J.X.; Acosta-Opayome, D.; Fuenmayor, C.A.; Zuluaga-Domínguez, C.M.; Anaya, M.; Tibaduiza, D.A. Intelligent Electronic Tongue System for the Classification of Genuine and False Honeys. Int. J. Food Prop. 2023, 26, 327–343. [Google Scholar] [CrossRef]
  49. Apetrei, C. Novel Method Based on Polypyrrole-modified Sensors and Emulsions for the Evaluation of Bitterness in Extra Virgin Olive Oils. Food Res. Int. 2012, 48, 673–680. [Google Scholar] [CrossRef]
  50. Apetrei, I.M.; Apetrei, C. Detection of Virgin Olive Oil Adulteration Using a Voltammetric E-Tongue. Comput. Electron. Agric. 2014, 108, 148–154. [Google Scholar] [CrossRef]
  51. Bounegru, A.V.; Apetrei, C. Sensitive Detection of Hydroxytyrosol in Extra Virgin Olive Oils with a Novel Biosensor Based on Single-Walled Carbon Nanotubes and Tyrosinase. Int. J. Mol. Sci. 2022, 23, 9132. [Google Scholar] [CrossRef]
  52. Carmona-Jiménez, Y.; García-Moreno, M.V.; Igartuburu, J.M.; Garcia Barroso, C. Simplification of the DPPH Assay for Estimating the Antioxidant Activity of Wine and Wine By-Products. Food Chem. 2014, 165, 198–204. [Google Scholar] [CrossRef]
  53. Comuzzo, P.; Battistutta, F.; Vendrame, M.; Páez, M.S.; Luisi, G.; Zironi, R. Antioxidant Properties of Different Products and Additives in White Wine. Food Chem. 2015, 168, 107–114. [Google Scholar] [CrossRef]
  54. Romanet, R.; Coelho, C.; Liu, Y.; Bahut, F.; Ballester, J.; Nikolantonaki, M.; Gougeon, R.D. The Antioxidant Potential of White Wines Relies on the Chemistry of Sulfur-Containing Compounds: An Optimized DPPH Assay. Molecules 2019, 24, 1353. [Google Scholar] [CrossRef] [PubMed]
  55. Munteanu, I.G.; Apetrei, C. Tyrosinase-Based Biosensor—A New Tool for Chlorogenic Acid Detection in Nutraceutical Formulations. Materials 2022, 15, 3221. [Google Scholar] [CrossRef] [PubMed]
  56. Arteaga, J.F.; Ruiz-Montoya, M.; Palma, A.; Alonso-Garrido, G.; Pintado, S.; Rodríguez-Mellado, J.M. Comparison of the Simple Cyclic Voltammetry (CV) and DPPH Assays for the Determination of Antioxidant Capacity of Active Principles. Mol. Basel Switz. 2012, 17, 5126–5138. [Google Scholar] [CrossRef] [PubMed]
  57. Bendjedid, S.; Lekmine, S.; Tadjine, A.; Djelloul, R.; Bensouici, C. Analysis of Phytochemical Constituents, Antibacterial, Antioxidant, Photoprotective Activities and Cytotoxic Effect of Leaves Extracts and Fractions of Aloe Vera. Biocatal. Agric. Biotechnol. 2021, 33, 101991. [Google Scholar] [CrossRef]
  58. Slagman, S.; Zuilhof, H.; Franssen, M.C.R. Laccase-Mediated Grafting on Biopolymers and Synthetic Polymers: A Critical Review. ChemBioChem 2018, 19, 288–311. [Google Scholar] [CrossRef]
  59. Chiriac, E.R.; Chiţescu, C.L.; Borda, D.; Lupoae, M.; Gird, C.E.; Geană, E.-I.; Blaga, G.-V.; Boscencu, R. Comparison of the Polyphenolic Profile of Medicago Sativa L. and Trifolium Pratense L. Sprouts in Different Germination Stages Using the UHPLC-Q Exactive Hybrid Quadrupole Orbitrap High-Resolution Mass Spectrometry. Molecules 2020, 25, 2321. [Google Scholar] [CrossRef]
  60. Popescu, R.; Geana, E.I.; Dinca, O.R.; Sandru, C.; Costinel, D.; Ionete, R.E. Characterization of the Quality and Floral Origin of Romanian Honey. Anal. Lett. 2016, 49, 411–422. [Google Scholar] [CrossRef]
  61. Chevallier, S.; Bertrand, D.; Kohler, A.; Courcoux, P. Application of PLS-DA in Multivariate Image Analysis. J. Chemom. 2006, 20, 221–229. [Google Scholar] [CrossRef]
  62. Apetrei, C.; Apetrei, I.M.; Villanueva, S.; de Saja, J.A.; Gutierrez-Rosales, F.; Rodriguez-Mendez, M.L. Combination of an E-Nose, an e-Tongue and an e-Eye for the Characterisation of Olive Oils with Different Degree of Bitterness. Anal. Chim. Acta 2010, 663, 91–97. [Google Scholar] [CrossRef]
  63. Liu, Z.; Cai, W.; Shao, X. Outlier Detection in Near-Infrared Spectroscopic Analysis by Using Monte Carlo Cross-Validation. Sci. China Ser. B Chem. 2008, 51, 751–759. [Google Scholar] [CrossRef]
  64. Rodriguez-Mendez, M.L.; Apetrei, C.; Gay, M.; Medina-Plaza, C.; de Saja, J.A.; Vidal, S.; Aagaard, O.; Ugliano, M.; Wirth, J.; Cheynier, V. Evaluation of Oxygen Exposure Levels and Polyphenolic Content of Red Wines Using an Electronic Panel Formed by an Electronic Nose and an Electronic Tongue. Food Chem. 2014, 155, 91–97. [Google Scholar] [CrossRef] [PubMed]
  65. Munteanu, I.G.; Apetrei, C. A Review on Electrochemical Sensors and Biosensors Used in Assessing Antioxidant Activity. Antioxidants 2022, 11, 584. [Google Scholar] [CrossRef] [PubMed]
  66. Apetrei, C.; Apetrei, I.M.; Nevares, I.; del Alamo, M.; Parra, V.; Rodríguez-Méndez, M.L.; De Saja, J.A. Using an E-Tongue Based on Voltammetric Electrodes to Discriminate among Red Wines Aged in Oak Barrels or Aged Using Alternative Methods. Electrochimica Acta 2007, 52, 2588–2594. [Google Scholar] [CrossRef]
  67. Apetrei, I.M.; Apetrei, C. A Modified Nanostructured Graphene-Gold Nanoparticle Carbon Screen-Printed Electrode for the Sensitive Voltammetric Detection of Rutin. Measurement 2018, 114, 37–43. [Google Scholar] [CrossRef]
  68. Munteanu, I.-G.; Apetrei, C. Electrochemical Determination of Chlorogenic Acid in Nutraceuticals Using Voltammetric Sensors Based on Screen-Printed Carbon Electrode Modified with Graphene and Gold Nanoparticles. Int. J. Mol. Sci. 2021, 22, 8897. [Google Scholar] [CrossRef]
  69. Munteanu, I.G.; Apetrei, C. Assessment of the Antioxidant Activity of Catechin in Nutraceuticals: Comparison between a Newly Developed Electrochemical Method and Spectrophotometric Methods. Int. J. Mol. Sci. 2022, 23, 8110. [Google Scholar] [CrossRef]
  70. Rodríguez-Méndez, M.; Apetrei, C.; De Saja, J.A. Evaluation of the Polyphenolic Content of Extra Virgin Olive Oils Using an Array of Voltammetric Sensors. Electrochimica Acta 2008, 53, 5867–5872. [Google Scholar] [CrossRef]
  71. Apetrei, C.; Rodríguez-Méndez, M.L.; de Saja, J.A. Modified Carbon Paste Electrodes for Discrimination of Vegetable Oils. Sens. Actuators B Chem. 2005, 111–112, 403–409. [Google Scholar] [CrossRef]
  72. Gali, L.; Bedjou, F. Antioxidant and Anticholinesterase Effects of the Ethanol Extract, Ethanol Extract Fractions and Total Alkaloids from the Cultivated Ruta Chalepensis. S. Afr. J. Bot. 2019, 120, 163–169. [Google Scholar] [CrossRef]
  73. Grilj, J.; Zonca, C.; Daku, L.M.L.; Vauthey, E. Photophysics of the Galvinoxyl Free Radical Revisited. Phys. Chem. Chem. Phys. 2012, 14, 6352–6358. [Google Scholar] [CrossRef] [PubMed]
  74. Fratianni, F.; Cozzolino, R.; Martignetti, A.; Malorni, L.; d’Acierno, A.; De Feo, V.; da Cruz, A.G.; Nazzaro, F. Biochemical Composition and Antioxidant Activity of Three Extra Virgin Olive Oils from the Irpinia Province, Southern Italy. Food Sci. Nutr. 2019, 7, 3233–3243. [Google Scholar] [CrossRef] [PubMed]
Figure 1. Voltammetric responses of CNT-GNP/SPCE (red line), CNF-GNP/SPCE (black line) and GPH-GNP/SPCE (green line) towards extract of EVOO sample v1. Scan rate: 0.1 V·s−1.
Ijms 24 03010 g001
Figure 2. CVs of CNF-GNP/SPCE sensor when immersed in EVOO sample v2 (red line), POO sample p2 (green line) and SFO sample s2 (black line). Scan rate 0.1 V·s−1.
Ijms 24 03010 g002
Figure 3. Schematic representation for the mechanism of mono- and di-phenolic compound detection using the electrochemical method.
Ijms 24 03010 g003
Figure 4. PCA scores plot corresponding to the CV data corresponding to different categories of oils: EVOO, POO and SFO samples.
Ijms 24 03010 g004
Figure 5. PCA scores plot corresponding to the CV data obtained with the sensors when these are exposed to EVOO samples from Italy, Spain, Greece and Tunisia.
Ijms 24 03010 g005
Figure 6. PLS-DA scores plot resulting from the sensor data (X matrix) corresponding to different classes of oils (Y matrix): (a) EVOO, POO and SFO samples; (b) Italy, Spain, Greece and Tunisia EVOO samples.
Ijms 24 03010 g006
Figure 7. Plot of predicted % inhibition of DPPH from the voltammetric data vs. measured % inhibition of DPPH obtained from the spectrophotometric methods. The averages of six replicates corresponding to each oil sample were included in the regression models.
Ijms 24 03010 g007
Table 1. Oil denomination, code, type of oil, and country of origin for the 44 oil samples under study.
SampleOils DenominationCode  
Type of OilCountry of Origin
1TopSeller Pomace Oil p1POO-
2Oliolp2POO-
3Costa d’Oro, Sansap3POO-
4Regina Olio di Sansap4POO-
5Pietro Coricelli Olio di Sansap5POO-
6Ioniap6POO-
7Reginav1EVOOI
8Costa D’Oro L’extra v2EVOOI
9Olitalia v3EVOOI
10Pietro Coricelli Non Filtratov4EVOOI
11Mazzav5EVOOI
12Rivano Olio v6EVOOI
13Costa d’Oro Il Grezzov7EVOOI
14Pietro Coricelli Olio v8EVOOI
15Monini Miniv9EVOOI
16Costa d’Oro L’Italianov10EVOOI
17Costa d’Oro, Il Biologico v11EVOOI
18Monini Delicatov12EVOOI
19Monini Classicov13EVOOI
20Solaris Koroneiki v14EVOOG
21Greek Koroneiki v15EVOOG
22Minerva Greek v16EVOOG
23Monastir Oil v17EVOOG
24Kanakisv18EVOOG
25Agoureleov19EVOOG
26Agoureleo Finestv20EVOOG
27Mueloliva v21EVOOS
28TopSeller Extra Virgin Olive Oilv22EVOOS
29Molino Alfonsov23EVOOS
30Pletorav24EVOOS
31Iznaolivav25EVOOS
32Coosurv26EVOOS
33Obiov27EVOOS
34Terra Delyssa—Tunisian Oilv28EVOOT
35Clearspringv29EVOOT
36Urtekramv30EVOOT
37Terra Delyssa Biov31EVOOT
38Oliviv32EVOOT
39Solaris s1SFO-
40De la Lunas2SFO-
41Walachias3SFO-
42Moraritas4SFO-
43Bunettos5SFO-
44Super Foodss6SFO-
EVOO—extra virgin olive oil; POO—pomace olive oil; SFO = sunflower oil; I = Italy; G = Greece; S = Spain; T = Tunisia.
Table 2. Quantitative data of the PLS-DA regression using voltammetric data for two classification models.
Classification CriteriumCalibrationValidation
SlopeOffsetRCRMSECSlopeOffsetRPRMSEP
Type
EVOO0.9930.0080.9890.0640.9880.0110.9880.074
SFO0.9740.0100.9730.0290.9710.0090.9710.044
POO0.9850.0050.9830.0160.9810.0060.9800.041
Country of origin
Italy0.9930.0090.9920.0220.9910.0110.9860.048
Greece0.9900.0120.9860.0440.9890.0100.9800.063
Spain0.9940.0040.9900.0320.9920.0060.9840.054
Tunisia 0.9910.0070.9890.0260.9880.0050.9810.052
Rc—correlation coefficient of calibration; Rp—correlation coefficient of prediction; RMSEC—Root Mean Square Error of Calibration; RMSEP—Root Mean Square Error of Prediction.
Table 3. Antioxidant activity of oil samples studied expressed as % inhibition of the free radicals DPPH or galvinoxyl.
Sample% Inhibition
DPPH
% Inhibition
Galvinoxyl
Sample% Inhibition
DPPH
% Inhibition
Galvinoxyl
165.0023.532364.7223.53
258.8913.732462.4419.47
360.8315.792563.7220.45
456.4513.452664.2420.35
557.5012.762766.9427.45
659.4416.982865.8325.89
760.5613.732966.3126.64
863.8918.653067.9827.53
951.677.763166.2725.98
1065.2825.493265.7127.41
1164.7221.973368.1225.54
1263.8917.753463.3317.65
1367.5031.373564.5218.54
1464.4419.003662.6616.43
1564.7222.573763.9817.61
1671.3936.183862.0817.21
1765.5625.693960.5615.69
1870.8334.334059.8417.65
1969.7233.334156.8820.67
2063.5620.434257.6519.96
2163.1516.764358.9816.82
2264.7221.574460.7416.45
Table 4. Results of PLS1-DPPH and PLS1-galvinoxyl regression models in calibration and validation.
PLS1 DPPH
Regression Model
PLS1 Galvinoxyl
Regression Model
Calibration
Slope0.9630.959
Offset2.7520.984
Correlation0.9840.991
RMSEC1.5601.412
Validation
Slope0.9530.951
Offset3.1041.016
Correlation0.9750.984
RMSEP1.6281.712
Disclaimer/Publisher’s Note: The statements, opinions and data contained in all publications are solely those of the individual author(s) and contributor(s) and not of MDPI and/or the editor(s). MDPI and/or the editor(s) disclaim responsibility for any injury to people or property resulting from any ideas, methods, instructions or products referred to in the content.

