Article

Genome-Wide Identification Analysis of the R2R3-MYB Transcription Factor Family in Cymbidium sinense for Insights into Drought Stress Responses

1
College of Forestry, Fujian Agriculture and Forestry University, Fuzhou 350002, China
2
Key Laboratory of National Forestry and Grassland Administration for Orchid Conservation and Utilization, College of Landscape Architecture and Art, Fujian Agriculture and Forestry University, Fuzhou 350002, China
*
Author to whom correspondence should be addressed.
Int. J. Mol. Sci. 2023, 24(4), 3235; https://0-doi-org.brum.beds.ac.uk/10.3390/ijms24043235
Submission received: 26 December 2022 / Revised: 1 February 2023 / Accepted: 2 February 2023 / Published: 6 February 2023
(This article belongs to the Special Issue Orchid Biochemistry)

Abstract

:
Cymbidium sinense represents a distinctive Orchidaceae plant that is more tolerant than other terrestrial orchids. Studies have shown that many members of the MYB transcription factor (TF) family, especially the R2R3-MYB subfamily, are responsive to drought stress. This study identified 103 CsMYBs; phylogenetic analysis classified these genes into 22 subgroups with Arabidopsis thaliana. Structural analysis showed that most CsMYB genes contained the same motifs, three exons and two introns, and showed a helix-turn-helix 3D structure in each R repeat. However, the members of subgroup 22 contained only one exon and no intron. Collinear analysis revealed that C. sinense had more orthologous R2R3-MYB genes with wheat than A. thaliana and rice. Ka/Ks ratios indicated that most CsMYB genes were under purifying negative selection pressure. Cis-acting elements analysis revealed that drought-related elements were mainly focused on subgroups 4, 8, 18, 20, 21, and 22, and Mol015419 (S20) contained the most. The transcriptome analysis results showed that expression patterns of most CsMYB genes were upregulated in leaves in response to slight drought stress and downregulated in roots. Among them, members in S8 and S20 significantly responded to drought stress in C. sinense. In addition, S14 and S17 also participated in these responses, and nine genes were selected for the real-time reverse transcription quantitative PCR (RT-qPCR) experiment. The results were roughly consistent with the transcriptome. Our results, thus, provide an important contribution to understanding the role of CsMYBs in stress-related metabolic processes.

1. Introduction

As one of the largest TF families in plants, the MYB family plays a vital role in regulating phytochemical biosynthesis pathways and responses to abiotic or biotic stress [1,2]. The MYB protein is characterized by a highly conserved DNA-binding domain named the MYB domain, which is at the N-terminus. This domain usually consists of the range of one to four imperfect amino acid sequence repeats (R) containing approximately 52–53 amino acid residues, which acquire a helix-turn-helix (HTH) conformation and intercalates in the major groove of DNA [3,4,5]. According to the number of R repeats, the MYB gene family can be divided into four categories; MYB-related, R2R3-MYB, 3R-MYB, and atypical MYB (4R-MYB). Among these, the R2R3 type is the largest subfamily with diverse functions [6,7].
Research on the R2R3-MYB genes of model plant A. thaliana (AtMYBs) found 126 AtMYBs, divided into 25 subgroups. Of these subgroups, AtMYB60 and AtMYB96 in subgroup 1 (S1) were proven to play a dual role in drought stress responses through the ABA signaling cascade to regulate stomatal movement and lateral root growth, and AtMYB60 was only regulated at the initial stage of drought stress but inhibited at severe drought stress [8,9]. AtMYB33, AtMYB101 in subgroup 18 (S18), and AtMYB44 in subgroup 22 (S22) are also involved in ABA-mediated responses to environmental signals, and AtMYB2 in subgroup 20 (S20) controls the ABA induction of dehydration responsive genes [5,10]. Moreover, many studies in other species have also shown that the expression of R2R3-MYB genes could enhance the tolerance to drought stress. The relevant research on rice (Oryza sativa) showed that overexpression of OsMYB2 could enhance the up-regulation of genes encoding proline synthase and transporters to adapt to drought stress. Similarly, OsMYB4 causes high levels of several amino acids involved in stress adaptation. OsMYB60 promotes cuticular wax biosynthesis on leaf surfaces to enhance plant resilience to drought stress [11,12,13]. R2R3-MYB TF in wheat (Triticum aestivum) TaPIMP1 is involved in drought response by binding to the MYB-binding site and activates the expression of the genes with the Myb cis-element. Another wheat gene, TaMYB70, can also contribute to drought tolerance by targeting the gene with an MYB recognition site insertion in the promoter [14,15].
Orchids are renowned for their beautiful appearance and medicinal importance. Cymbidium is one of the earliest orchid groups to be cultivated, making excellent potted plants and cut flowers due to its extremely high ornamental and economic value. Commercially important hybrids have been cultivated for a long time in China and adjacent regions [16]. They are primarily distributed throughout the subtropics and tropical areas of Asia and northern Australia, which makes them adaptable to various habitats, including terrestrial, epiphytic, and saprophytic types [17]. The terrestrial types mainly rely on rainfall to obtain enough water for survival and growth. However, a dry climate certainly impacts their survival [18]. Some of the most important terrestrial orchids with high ornamental values include C. goeringii, C. faberi, C. ensifolium, C. sinensis, C. kanran, C. tortisepalum, and C. tortisepalum. Among these, C. sinense has a long history of cultivation in China, and it can withstand severe drought stress [19,20]. The recent whole genome sequencing of C. sinense [21] has broadened the spectrum to understand the stress-response mechanism of orchids. Many R2R3-MYB TFs play important roles in orchid plants, such as flavonoid regulation in P. equestris and Cattleya hybridKOVA’, floral aroma regulation in Pleione limprichtii and C. faberi, and environmental stress responses in D. officinale, D. hybrid, and P. equestris [22]. However, studies on R2R3-MYB genes of orchids in response to drought stress have rarely been reported.
In this study, R2R3-MYB subfamily members in C. sinense (CsMYBs) were identified by using bioinformatics methods. A total of 103 CsMYBs were found, and analyses of their gene structures and conserved motifs, phylogenetics, Ka/Ks ratios, collinear relationships, and cis-acting regulatory elements were conducted. In addition, we analyzed the expression patterns of CsMYBs under both well-watered and drought treatments and identified potential genes that can play important roles in drought stress tolerance. The results lay a foundation for investigating more roles of MYB transcription factors in C. sinense and other orchids.

2. Results

2.1. Identification and Phylogenetic Analysis of the R2R3-MYB Genes in C. sinense

A total of 103 CsMYB genes (Table S1) were identified, as shown in the phylogenetic tree (Figure 1). The identified CsMYBs were divided into 22 subgroups according to Arabidopsis [5]. Of these groups, S21 contained the most R2R3-MYB genes, with 12 CsMYBs, followed by S14 and S17, each containing eight CsMYBs, while 11 drought-responsive R2R3-MYB genes (11 DrMYBs) from Arabidopsis (AtMYB2, 33, 44, 60, 96, 101), rice (OsMYB2, 4, 60) and wheat (TaPIMP, TaMYB70) mentioned above were divided into S1, S2, S18, S20, and S22. Among these subgroups, S20 had only three members of CsMYBs, while others contained either five or six CsMYBs. In addition, no CsMYBs were classified into groups S12, S15, and S16.

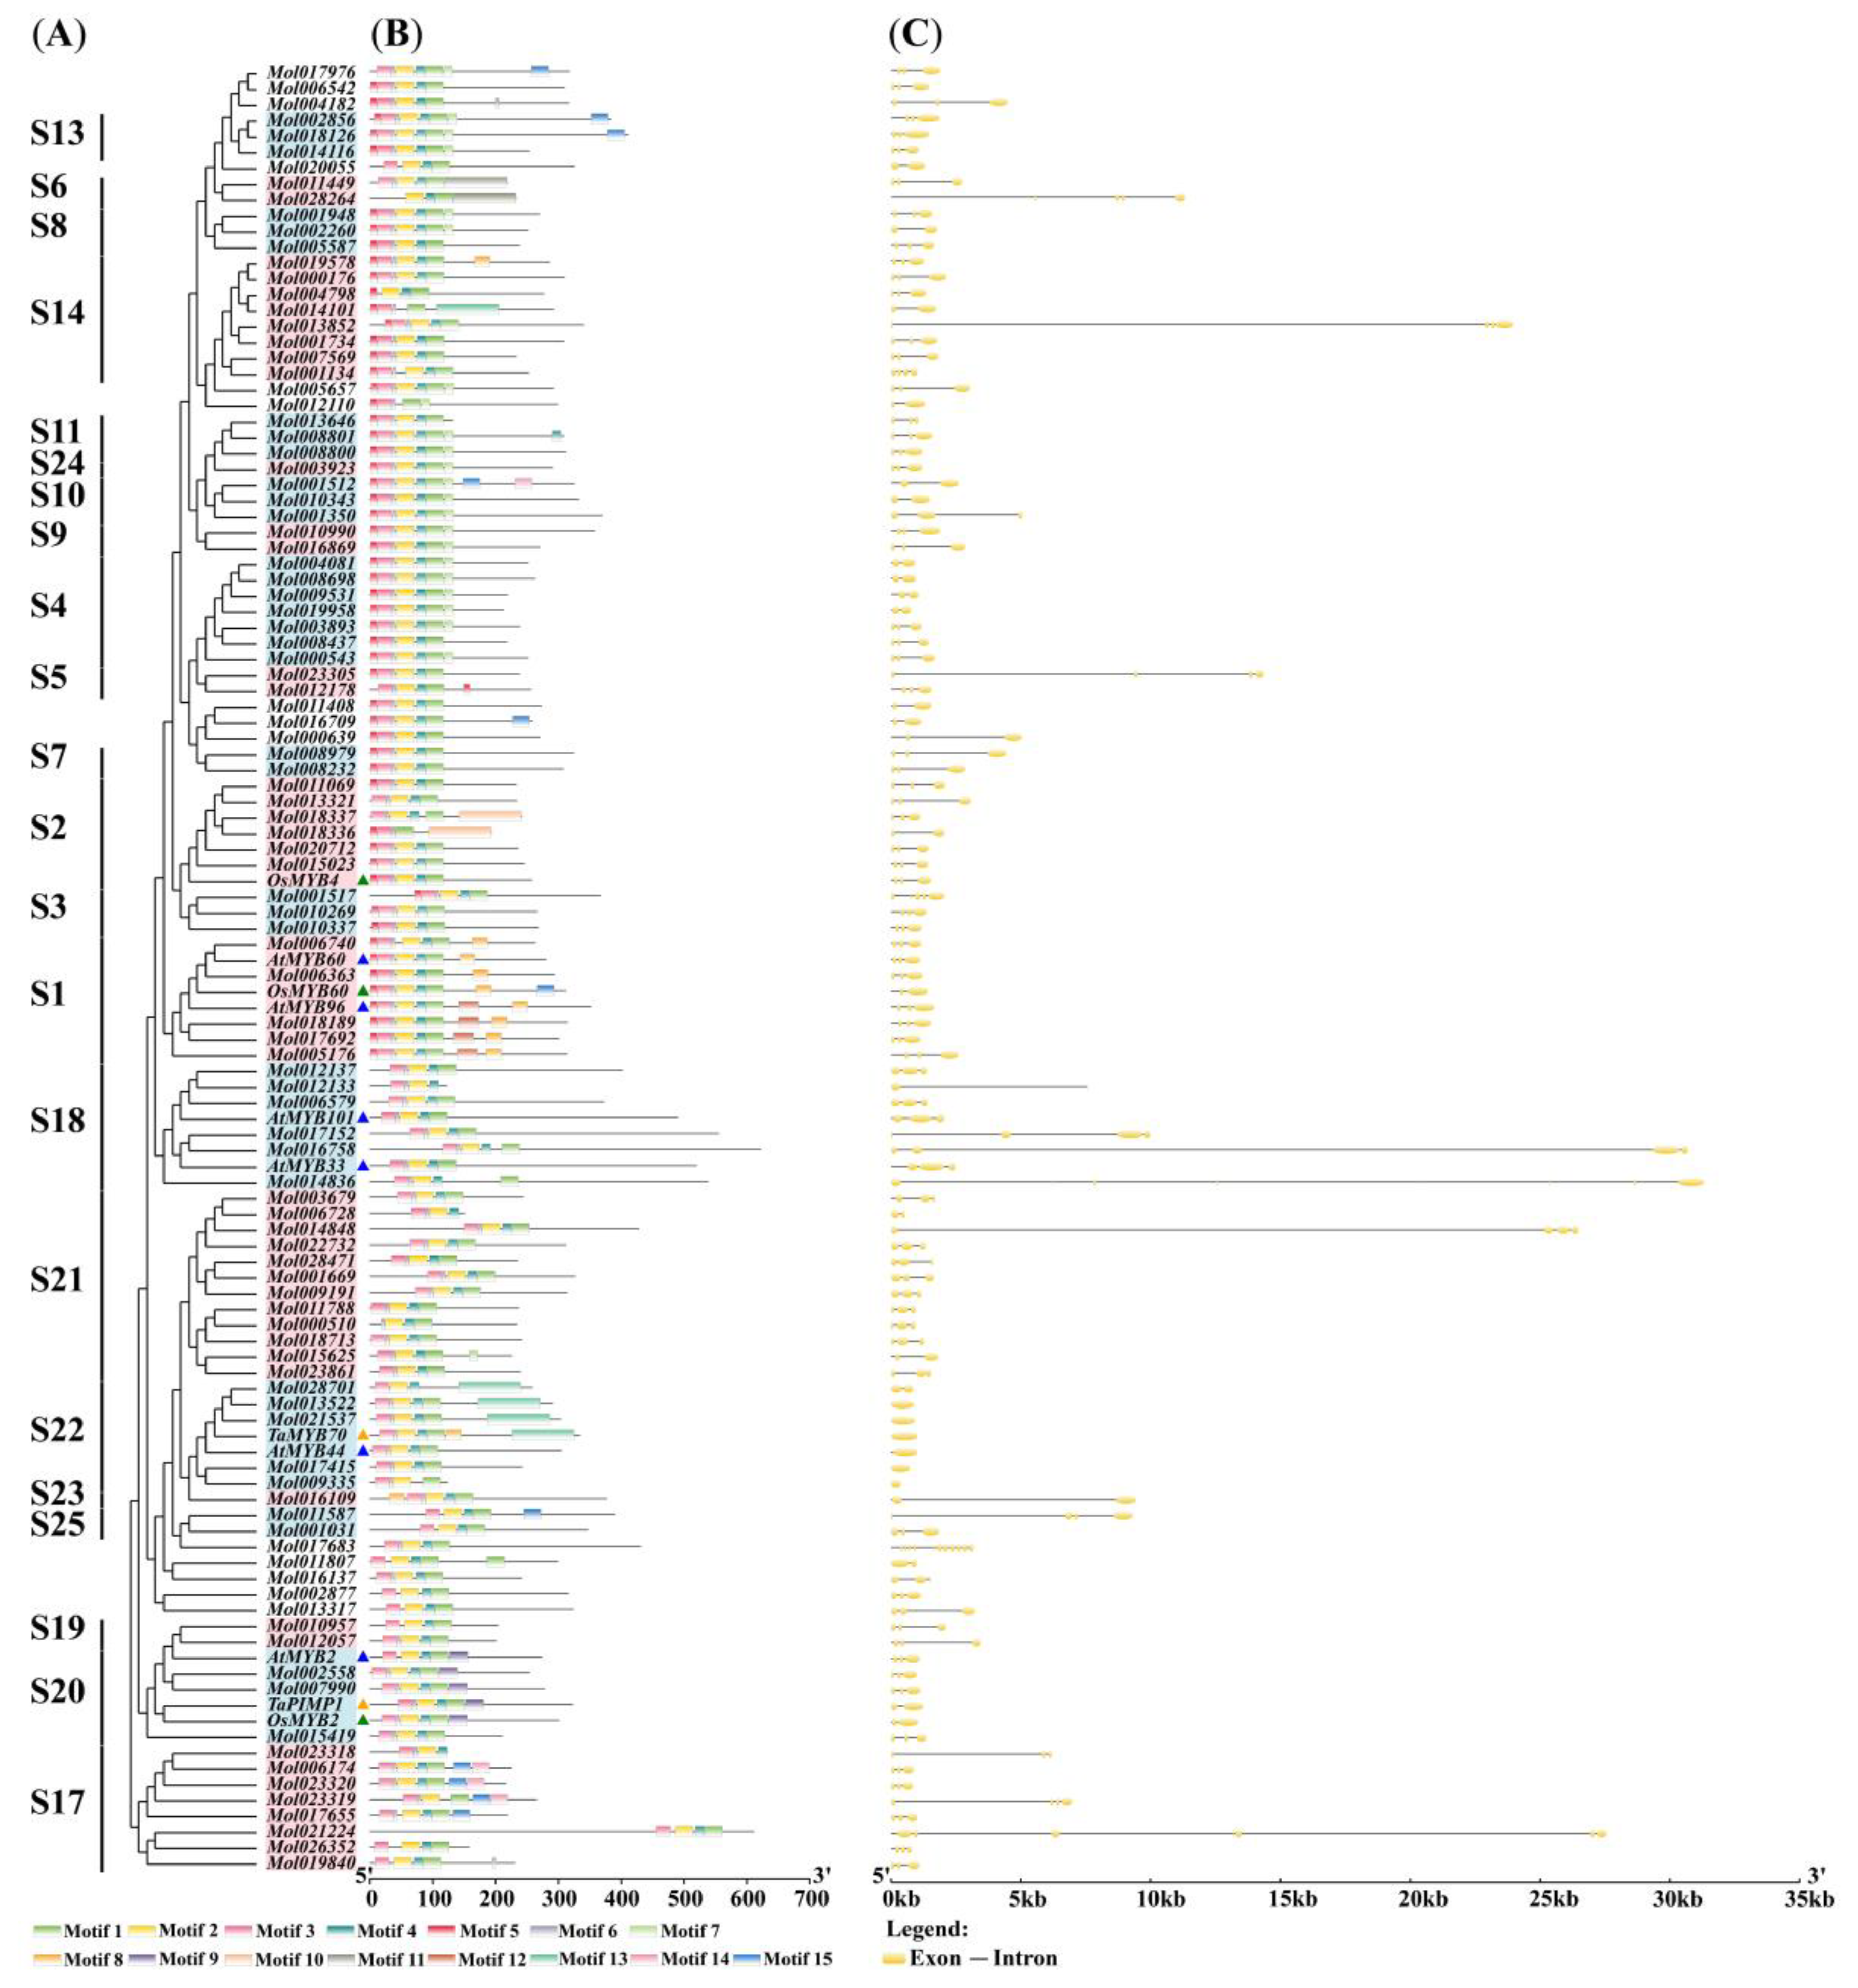
2.2. Gene Structure and Domain Analysis of CsMYBs and DrMYBs

To further understand the functional diversification of CsMYBs, the intron–exon structure and conserved motifs were compared with 11 DrMYBs, using GSDS software [23] and the MEME tool [24], respectively. As shown in Figure 2, 15 motifs ranged in length from 6 to 100. The results showed that most R2R3-MYB proteins in the same group contained similar motifs, further verifying their functional similarity. Almost all CsMYB proteins contained motifs 1, 2, 3, 4, and 6, which were part of the R2 (Figure 3A) or R3 domain (Figure 3B). However, motif 5 was present in more than half of the CsMYB members, which did not belong to the conserved domain. Additionally, motif 8 was present in all members of S1, Mol019578 of S14, and TaMYB70 of S22. Motif 13 was present in half members of S22 (Mol028701, Mol013522, Mol021537, and TaMYB70) and Mol014101 of S14. Motifs 14 and 15 existed simultaneously in four members of S17 with close phylogenetic relationships. However, motifs 12 and 9 only appeared in S1 and S20, respectively. Moreover, Mol018189, clustered with AtMYB96 in S1, contained motifs 8 and 12. These conserved motifs may be associated with the specific functions of the groups mentioned above. The exons in CsMYB genes ranged from one to 11. In S22, most members of CsMYBs only had one exon, similar to those of DrMYBs (TaMYB70 and AtMYB40), while most of these genes consisted of three exons and two introns. These results showed the conservation of gene structure in CsMYBs.
To analyze the conservation of CsMYBs, aligned protein sequences were used to generate logos by WebLogo, as shown in Figure 3. A and B indicate the R2 and R3 repeats of C. sinense, respectively. Notably, some amino acids were more conserved, as tryptophan appeared at the sites of approximately every 18 amino acids. There were three tryptophans in R2 and two in R3.

2.3. Collinearity and Purifying Selection Analysis of CsMYB Genes

CsMYB genes were unevenly distributed across 17 chromosomes in C. sinensis (Figure S2). To further analyze the potential evolutionary processes of the CsMYBs, the collinear relationships of R2R3-MYB genes were examined within C. sinensis and among C. sinense, A. thaliana, O. sativa, and T. aestivum. The results showed 15 linked regions within C. sinensis, and chromosome 10 had three R2R3-MYB gene pairs linked (Figure S2). For different species, 10 orthologues were detected between C. sinense and A. thaliana, 33 were detected between C. sinense and O. sative, and 73 orthologues were present between C. sinensis and T. aestivum (Figure 4). The Ka/Ks ratio reflected the selection pressure on the genes. In this study, we selected 36 pairs of CsMYBs with identity≥ 60%. Notably, four pairs, which were NaN (not a number), were excluded. The other 31 gene pairs scored less than 1, and most of the pairs (29/31) showed a value < 0.5; only one gene pair from S17 showed a rate greater than 1, which indicated that most CsMYBs mainly evolved under the influence of purifying selection. The divergence time of 32 CsMYB gene pairs was in the range of 1.31 mya for Mol018337 and Mol018336 of S2 to 178.98 mya for Mol002856 and Mol018126 of S13 (Table S2).

2.4. Protein Secondary and Tertiary Structures Prediction

The secondary structure prediction indicated that DrMYB and CsMYB proteins were both composed of α-helix, random coils, extended strands, and β-turns, with their means accounting for 35.94%, 8.15%, 5.65%, and 50.26% of the protein structure, respectively (Table S3).
Tertiary structures of a few members from subgroups 1, 8, 20, and 22 were highly conserved, characterized by six helixes, among which each R repeat forming three α–helixes, and an extended strand in the C terminus. The second and third helixes of each repeat build an HTH structure with three in R2 or two in R3 regularly spaced tryptophan residues. With the combination of secondary structure, members of S22 showed an extended strand in the N terminus, especially Mol009335, which were rare in other groups, and Mol021537 (S22) exhibited very random coil helixes (Figure 5).

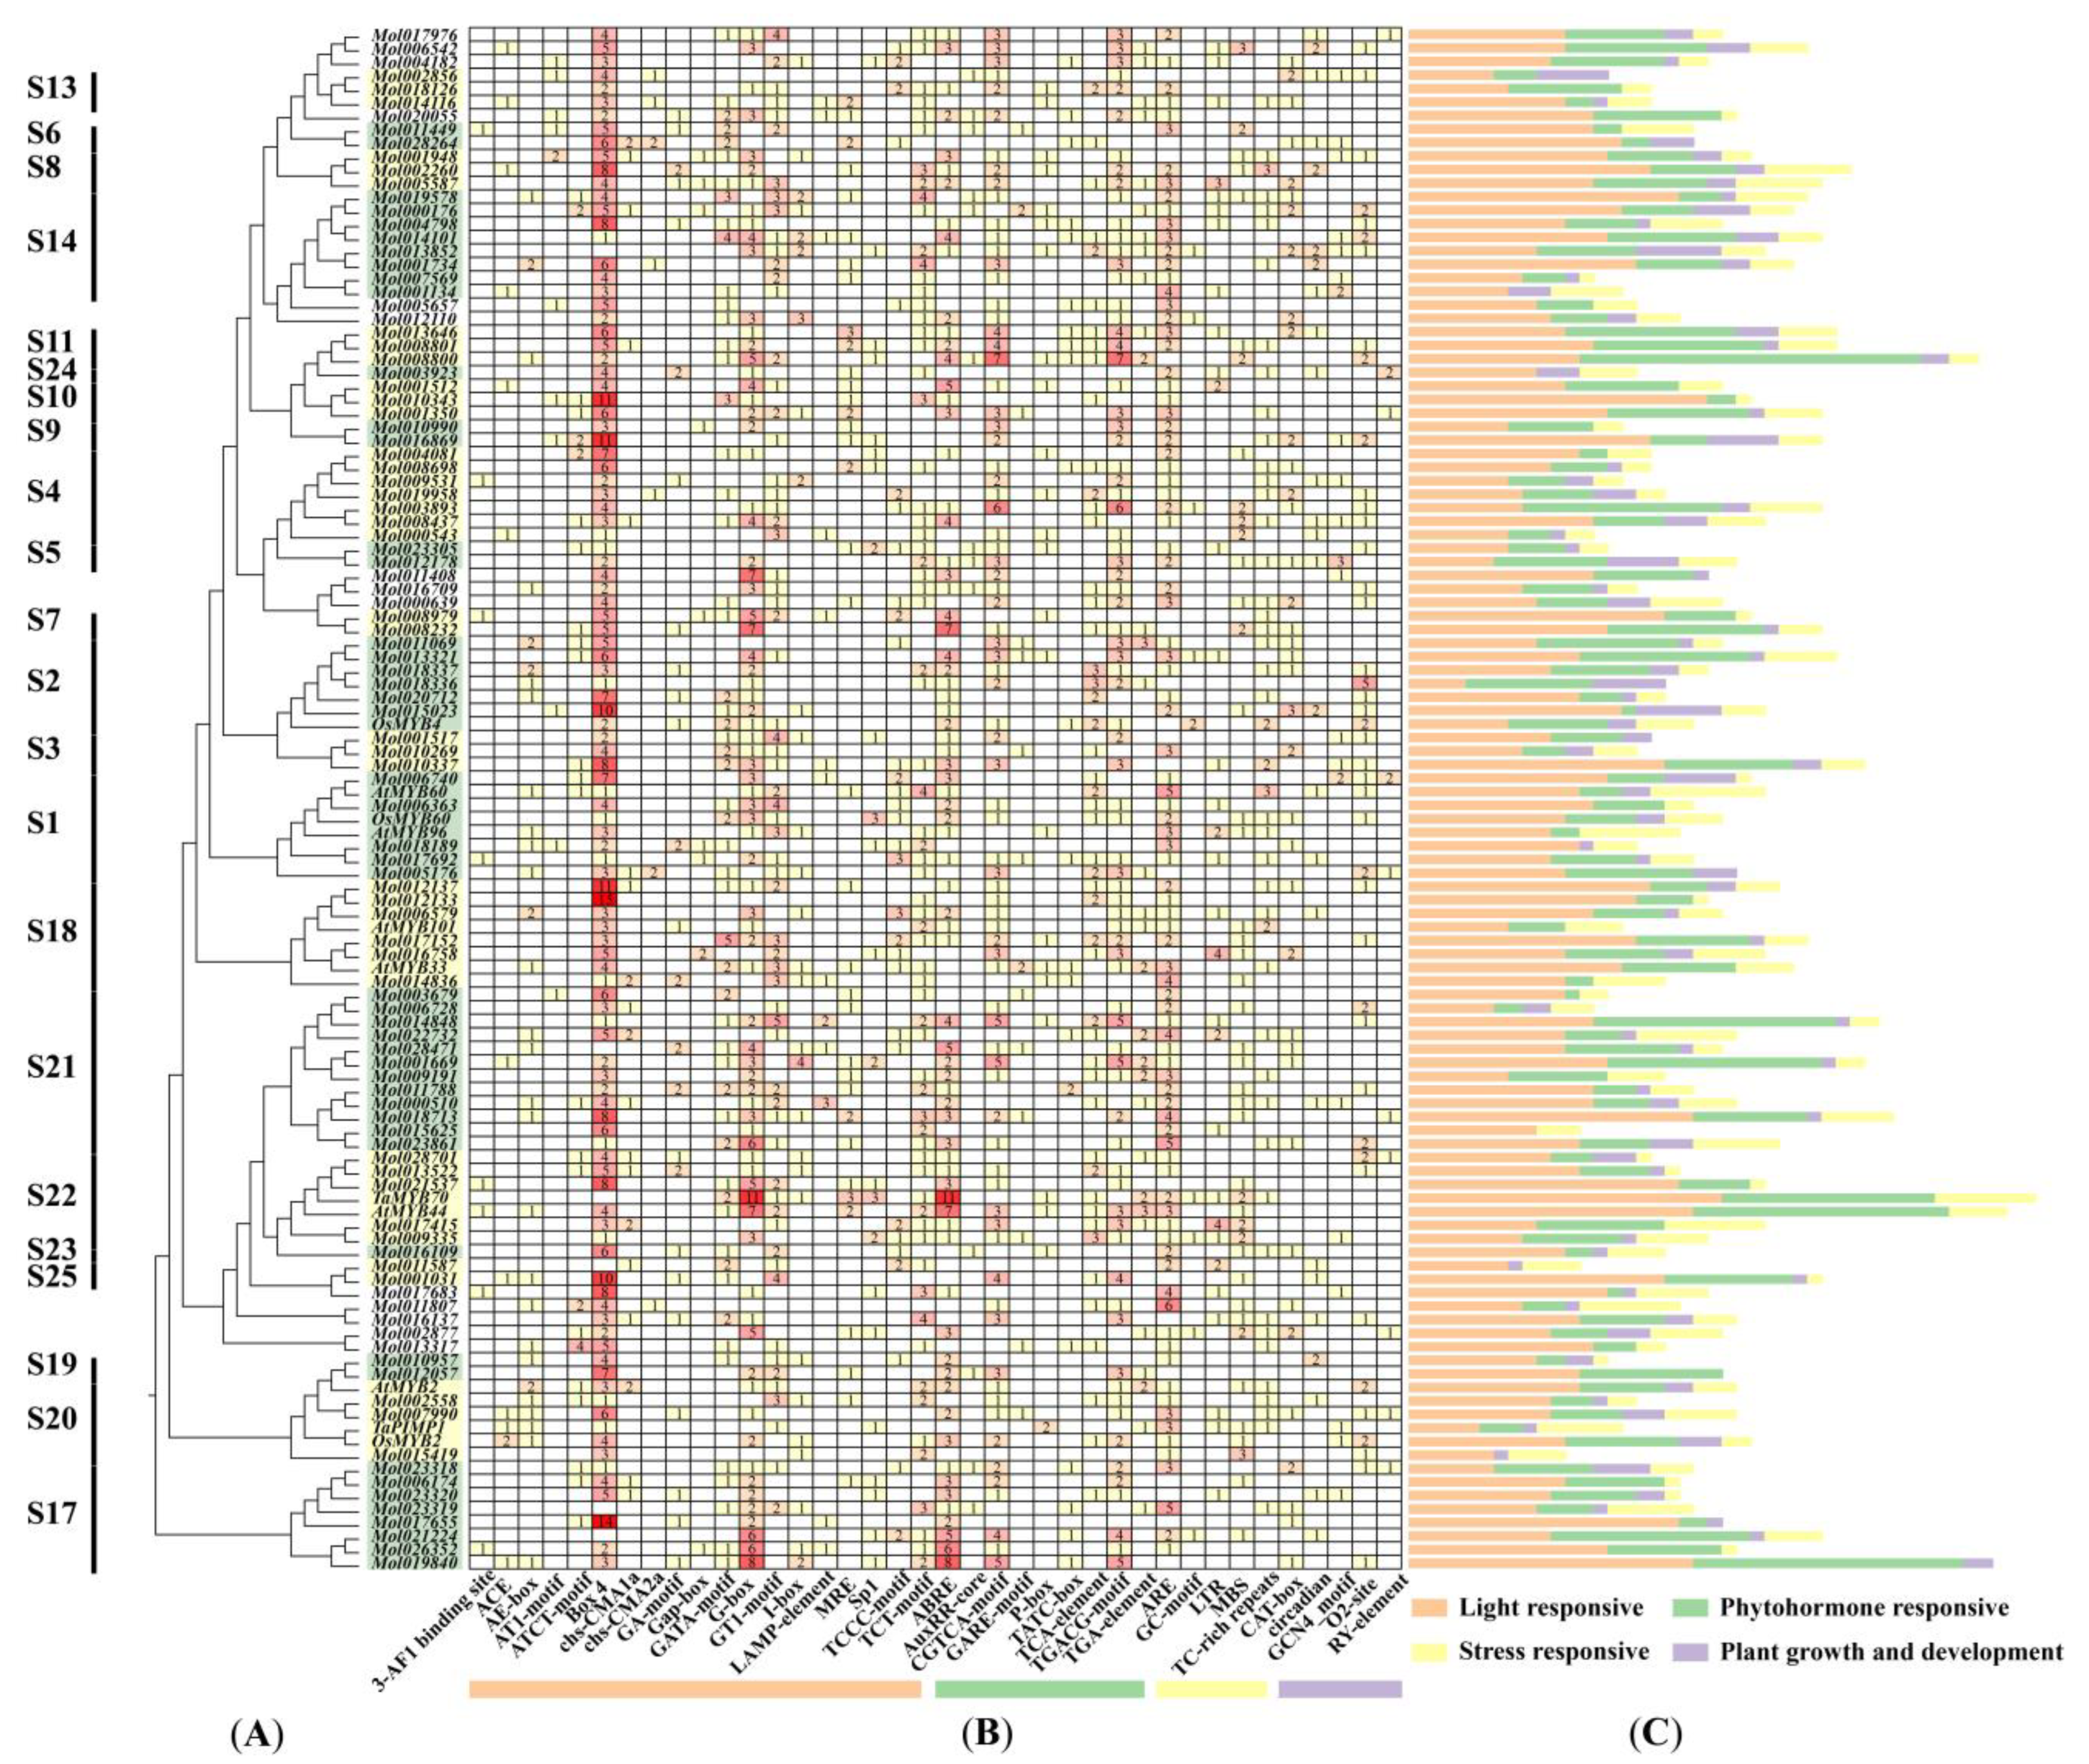
2.5. Cis-Acting Regulatory Elements Analysis in CsMYB and DrMYB Genes

To better understand the functions of the R2R3-MYB genes in C. sinense, the 2000 bp upstream promoter regions of all CsMYB genes and 11 DrMYBs were predicted for putative cis-acting elements (Figure 6). A total of 38 kinds of elements were identified and divided into 4 types according to their functions, such as light responses, phytohormone responses, plant growth and development, and stress responses. Among them, light responsiveness comprised the highest proportion, 52.7% (1193/2265), followed by phytohormone-responsive functions (608/2265). The stress-responsive type (297/2265) contained 5 cis-elements and was composed of ARE elements (163/297), MBS elements (48/298), TC-rich repeats (40/298), LTR elements (39/298), and GC motifs (7/297) (Table S4a). Interestingly, MBS elements, which were predicted to be involved in drought inducibility, were found in seven DrMYBs belonging to S1 (OsMYB60, AtMYB96), S18 (AtMYB101), S20 (AtMYB2, TaPIMP1, and OsMYB2) and S22 (TaMYB70 and AtMYB44). The MBS elements were absent from three DrMYBs belonging to S1 (AtMYB60), S2 (OsMYB4), and S18 (AtMYB33). Mol015419, a member of S20, had three MBS elements in the promoter regions. Moreover, half of the CsMYBs in S18 and S22 contained one or two MBS elements. Additionally, almost all members of CsMYBs in S4, S8, and S21 contained MBS elements, which might contribute to drought responsiveness (Table S4b).

2.6. Expression Patterns Analysis of CsMYB Genes under Drought Stress in Leaves and Roots

To explore the expression patterns of the CsMYB genes, the transcript levels in leaves of C. sinense were analyzed (Figure 7A and Table S5a). The expression levels of CsMYB genes were evaluated by comparing the FPKM values for each gene under 3 leaf conditions (L1, L2, L3). Twenty-six out of 35 CsMYBs were modulated by drought stress, consisting of 16 upregulated genes and 3 downregulated genes in L2, and 6 upregulated and 14 downregulated genes in L3. Among them, Mol015419 and Mol007990 members in S20 were upregulated both in L2 and L3, with the most significant changes as compared to other R2R3-MYB genes of C. sinense. S3 (Mol010269, Mol001517), S4 (Mol019958, Mol008698), and S8 (Mol002260, Mol001948) were upregulated by slight drought stress and downregulated by more severe drought treatment (Figure 7A and Figure S3 and Table S6a).
In the roots of C. sinense, the FPKM values (FPKM > 5) in 49 out of 103 CsMYB genes were significant (Table S5b). Most of the detected CsMYBs (41/49) were modulated by drought stress. Only 10 out of 49 CsMYBs were upregulated, and 22 genes were downregulated by slight drought stress (R2). Under severe stress (R3), 31 genes were downregulated (Figure 7B and Table S6b). Notably, Mol001948 from S8, which was downregulated 84-fold in R2 and 47-fold in R3, showed the most significant changes (Table S6b). Furthermore, Mol021537, a member of S22, was consistently upregulated during drought treatments, distinct from the patterns of S20, which showed consistent downregulation in roots. In addition, S4 (Mol008698, Mol009531, Mol003893), S8 (Mol002260, Mol001948), S14 (Mol000176), and S17 (Mol023320, Mol017655) also showed responses to drought stress in C. sinense. Interestingly, Mol000176 (S14) showed a positive response to drought treatments through significant downregulation. Moreover, Mol018189 (S1) was downregulated under slight drought stress both in leaves and roots, which was completely opposite to the expression patterns of Mol010269 (S3) and Mol001948 (S8) (Figure 7B and Figure S3).

3. Discussion

Many MYB TFs play important roles in orchid plants, but relatively few published studies have focused on stress-related responses. In this study, we identified 103 R2R3-MYB genes from the C. sinense genome, which is in line with the number of R2R3-MYB genes from other orchids, including 96, 99, 101, 102, and 104 R2R3-MYB genes in P. equestris, P. aphrodite, D. officinale, C. ensifolium, and C. goeringii, respectively. However, it showed a significant divergence compared to other species, such as A. thaliana and O. sativa, suggesting that several R2R3-MYB genes might have been lost in orchids during evolution (Table 1).
According to phylogenetic analysis, R2R3-MYB gene members of C. sinense can be divided into 22 groups based on AtMYBs, which are divided into 25 subgroups. Members with similar motifs or identical functions were divided into the same subgroup. Mol018189 clustered with AtMYB96 in S1, suggesting it might act through the ABA signaling cascade in response to drought stress. Moreover, Mol021537, a consistently upregulated gene during stress treatments, clustered with TaMYB70 (S22), which confers enhanced drought tolerance of plants [15]. Mol015419 and Mol007990, members from S20, clustered with drought-responsive AtMYB2, OsMYB2, and TaPIMP1, also showed positive responses to drought stress (Figure 1) [5,12,14]. The clustering results of CsMYBs and AtMYBs were similar to those of D. officinale, P. aphrodite, C. ensifolium, and A. thaliana, in which most members were found in the S21 subfamily [7,28]. There were no members of CsMYBs in S12, indicating that some special characteristics existed in the R2R3-MYB genes of C. sinense. In summary, the number and classification of R2R3-MYB gene members among orchid plants were similar.
Structural domain analysis of CsMYBs showed that the genes contained highly conserved tryptophan residues, among which R2 had three and R3 had two, while the first tryptophan residue in R3 was replaced by phenylalanine. This result is consistent with that observed in A. thaliana [6] and other plants. The substitution of the tryptophan residue in R3 may contribute to identifying new target genes and may result in the loss of DNA binding activity to target genes [30]. Additionally, the conserved motif analysis of CsMYB and 11 DrMYB protein sequences revealed close relationships in the phylogenetic tree and those with similar functions clustered into the same groups. Almost all the members contained motifs 1, 2, 3, 4, and 6. Interestingly, the members in S20 obtained motif 9, which was absent from other groups. The results might imply the special functions of the members in S20. The intron–exon structure analysis showed that the majority of CsMYB sequences (59%) consisted of two introns and three exons, while all members in S22 except Mol028701 contained one exon and no intron except AtMYB44 and TaMYB70. The secondary and tertiary structure predictions showed a highly conserved helix-turn-helix 3D structure in each R repeat of most R2R3-MYB proteins. Combined with the secondary structure, the members in S22 were characterized by a longer extended strand in the N terminus, which indicated that S22 might have some special functions in plants. In summary, the number of motifs, introns, exons, and protein structures in the same clade was similar or variable in a few groups.
Gene duplication is a main source of gene family expansion, playing a vital role in plant evolution. Three whole-genome duplication (WGD) events have occurred in A. thaliana [31], and C. sinense has experienced two WGD events [21]. There were only 10 collinear R2R3-MYB gene pairs between the dicot plants Arabidopsis and C. sinense, which was different from monocotyledons, such as rice and T. aestivum with more gene pairs, indicating that the R2R3-MYB gene family might have specific amplification between monocotyledons and dicotyledons. Furthermore, the number of collinear R2R3-MYB genes in C. sinense and T. aestivum was much higher than in rice. C. sinense experienced two WGD events of Orchidaceae plants together [32], and the CsMYBs may have expanded or rearranged in this event. The result of Ka/Ks analysis suggested that this gene family underwent purifying selection and highly conserved evolution. The results on cis-acting elements related to drought stress responses showed that the members of CsMYBs containing MBS elements were phylogenetically close to those DrMYBs with MBSs, which were thought to have an important role in the drought tolerance of plants. Moreover, the members containing MBS elements mainly focused on S4, S8, S18, S20, S21, and S22. Mol015419, a member of S20, contained 3 MBSs, displaying a positive response strategy to drought treatments according to the expression pattern. This indicated that the responses of CsMYBs to drought treatments might be highly related to cis-acting elements. Therefore, the study of cis-acting elements in the promoters of CsMYBs would provide significant value for further research.
It has been widely investigated in Arabidopsis, rice, and wheat that R2R3-MYB genes are involved in regulating responses to drought stress [5,11,12,13,33]. Among the other species, GaMYB85 of Gossypium aridum, homolog with AtMYB85 from S8, reportedly play an important role in the drought tolerance of plants [34]. R2R3-MYB gene MdoMYB121 from Malus domestica, MbMYB4 from M. baccata, and PlMYB108 (S20) from Paeonia lactiflflora were involved in increasing drought tolerance [35,36,37]. Notably, these functional genes were detected in S8 and S20. Among the 103 R2R3-MYB genes of C. sinense, it was found that members of S8 (Mol001948 and Mol002260) and S20 (Mol015419 and Mol007990) showed significant expression changes under drought stress compared to other subgroups (Table S6). In addition, most CsMYB genes were upregulated in leaves but downregulated in roots. Notably, the slight drought treatment could initiate more responses to stress in leaves. However, in the roots of C. sinense, some genes exhibited different expression patterns in response to drought stress. Mol021537, a member of S22, was consistently upregulated during drought treatments, possibly due to the special gene structures with motif 13, one exon, and no intron. This result may imply that members of S22 possess some special stress-response mechanisms.
These findings screened out potential genes that can improve the efficiency of molecular breeding, contribute to the enhancement of the tolerance of orchids to stress in the future, and provide significant value for understanding the role of R2R3-MYB transcription factors in stress responsiveness. However, the mechanism of executive function in potential genes is still unclear. We next intend to verify these gene functions through transgene studies and protein interactions.

4. Materials and Methods

4.1. Identification and Phylogenetic Analysis of R2R3-MYB Genes in C. sinense

The genome data of C. sinense, previously described by Yang et al. (2021 [21]), was downloaded from an online repository (NCBI: PRJNA743748) to identify the candidate R2R3-MYB genes. For further verification, a blast was performed using R2R3-MYB proteins of A. thaliana (http://www.arabidopsis.org/, accessed on 31 March 2022) as a probe with an E-value of 1 × 10⁻⁵ by TBtools software [38]. The conserved domains (PF00249) were generated by a hidden Markov model (HMM) in the Pfam2 database. Those with two R domains (PF00249) were considered the R2R3-MYB subfamily, and the uncertain genes were uploaded to the NCBI website (https://blast.ncbi.nlm.nih.gov/, accessed on 31 March 2022) for a BLASTP search.
To explore the evolutionary relationship between the R2R3-MYB gene family of C. sinense and Arabidopsis and to better predict the functions of CsMYBs, 126 AtMYBs, five DrMYBs from rice (OsMYB2, 4, 60) and wheat (TaPIMP1, TaMYB70) and the identified CsMYBs sequences were aligned by MAFFT with auto strategy [39]. A phylogenetic dendrogram was constructed using the maximum likelihood (ML) method at the CIPRES Science Gateway web server (RAxML-HPC2 on XSEDE) [40]. The bootstrap values were 1000 replicates with the “PROTGAMMAAUTO” model, which predicted the fittest model and parameters. The generated tree was redrawn and annotated by EVOLVIEW [41].

4.2. Intron–Exon Structure and Conserved Domain Analysis of R2R3-MYB Genes

To further compare CsMYBs and 11 DrMYBs, the gene structures and the exon–intron structures of the protein sequences were analyzed by Gene Structure Display Server 2.0 (GSDS) [23], and the conserved motifs were analyzed by the MEME suite (Multiple Expectation Maximization for Motif Elicitation, version 5.1.0, University of Nevada, Reno and University of Washington, USA) [24]. The parameters were set as follows: 0 or 1 occurrence in each sequence; the number of motifs to be found, 15; the minimum width of the motif was 6; the maximum width of the motif was 100; and the motif must exist in all members of the same subgroup. Afterward, MAST XML was downloaded and redrawn with TBtools [38]. The R2 and R3 domains were produced by WebLogo (http://weblogo.berkeley.edu/logo.cgi, accessed on 3 April 2022) using aligned protein sequences of CsMYBs by MAFFT (Rozewicki et al., 2019 [39]).

4.3. Collinearity and Selective Pressure

The chromosome-level genomic Fasta files of A. thaliana were obtained from the TAIR database (http://www.arabidopsis.org/, accessed on 4 April 2022), and the genomes of O. sativa and T. aestivum were downloaded from the Phytozome website (https://phytozome-next.jgi.doe.gov/info/Osativa_v7_0, accessed on 4 April 2022) and NCBI database (https://0-www-ncbi-nlm-nih-gov.brum.beds.ac.uk/, accessed on 4 April 2022), respectively. The genome sequences of C. sinense [21] and the three species mentioned above were used for collinear block analysis of R2R3-MYB genes. In detail, MCscanX employed in TBtools was used to construct collinearity relationships between C. sinense and other species. The results were combined and visualized by the Dual_synteny_plot tool of TBtools [38].
To further analyze the selection pressure of CsMYB genes, two candidate gene sequences with similar genetic relationships were isolated according to the phylogenetic tree. DNAMAN software was used to compare gene pairs. The gene pairs that were more than 60% identical were used to calculate Ka (nonsynonymous substitution) and Ks (synonymous substitution). The Ka/Ks, Ka, and Ks values were calculated using TBtools [38]. Divergence time (T) was calculated by using the Formula T = Ks/(2 × 9.1 × 10−9) × 10−6 million years ago (mya) [42]. The Ka/Ks ratio was 1.0, critical for identifying genes under positive selection. Generally, Ka/Ks < 1.0 indicates purification or negative selection. Ka/Ks = 1.0 indicates a neutral choice, while Ka/Ks > 1.0 indicates a positive choice [43,44].

4.4. Protein Secondary and Tertiary Structures Prediction of DrMYBs and CsMYBs

The secondary structure was performed by the SOPMA program [45]. Tertiary structure prediction was performed and visualized by SWISS-MODEL [46] and colored by rainbow order representing N to C terminus.

4.5. Cis-Acting Element Analysis

The extraction of the promoter sequences was conducted using TBtools [38] to obtain 2000 bp upstream of CsMYBs and 11 DrMYBs. The online software PlantCARE (http://bioinformatics.psb.ugent.be/webtools/plantcare/html/, accessed on 7 April 2022) [47] was employed to identify and annotate cis-acting elements of promoter regions. The numbers and responsive functions of cis-acting elements were visualized by TBtools [38] and Origin software [48], respectively.

4.6. Expression Analysis of R2R3-MYB Genes under Drought Stress in Different Tissues of C. sinense

The experiment was carried out in a TR-YLD2000 climate incubator. The environmental conditions were set as follows: light intensity 25 μmol/(m2·s), light/dark (12 h/12 h), temperature (22–28 °C), and humidity (40%). First, healthy and mature C. sinense plants were selected to grow seedlings for 4 days with a well-watered treatment. On the fourth day, the control group was collected (L1 and R1), and the irrigation was stopped to initiate drought stress treatments. The light drought stress group was collected after three days without irrigation (L2 and R2), and the severe stress group was collected on the 7th day (L3 and R3) (Figure S4). Three replicates were collected for each group. The sampling was performed from 2–3 young leaves with a length of 3–4 cm, and newly grown roots were collected from the base of each repetition. The samples were collected in liquid nitrogen and stored at −80 °C for further use. During the drought treatment, the moisture matrix of each pot was monitored every day to detect the degree of stress.
Total RNA was extracted from different tissues using the cetyltrimethylammonium bromide (CTAB) method, and transcriptome sequencing was performed on the MGI2000 sequencing platform. The clean reads were obtained by removing low-quality reads and adapter- and poly-N-possessing reads (with >5% unknown bases) using SOAPnuke v1.4.0 software (BGI-Shenzhen, China) [49] and were mapped to the nucleotide sequences of CsMYB genes using HISAT2 version 2.1.0 (University of Texas Southwestern Medical Center, Dallas, TX, USA) [50]. The expression level of CsMYBs was calculated by the fragments per kilobase of exon per million fragments mapped (FPKM) method using RSEM v1.2.8 (University of Wisconsin-Madison, Madison, WI, USA) [51,52]. The heatmap of expression profiling was visualized by TBtools v 1.0971 (Chen et al., 2020). The genes with an FPKM value >5 in the control or drought stress treatment were regarded as sensible and were used to calculate the fold change (FPKM values of drought/FPKM values of control) [53]. Genes with a ≥2.0-fold change were regarded as upregulated genes, and those with a ≤0.5-fold change were defined as downregulated genes.

4.7. qRT–PCR Analysis

To verify the transcriptome data, several genes were selected for Quantitative RT–PCR (qRT–PCR) analysis. Three biological repeats were conducted. Specifically, total RNA was reverse transcribed into cDNA by TransScript® All-in-One First-Strand cDNA Synthesis SuperMix for quantitative PCR (qPCR; TransGen Biotech, Beijing, China). The cDNA of each sample was diluted to 60 ng/mL, and 2 μL was used as a template for qRT–PCR. PCRs were performed using the Advanced™ Universal SYBR® Green Supermix detection system (Bio-Rad, Hercules, CA, USA) in an ABI 7500 Real-time system (ABI, Foster City, CA, USA) with the following amplification regime: 95 °C for 30 s and 40 cycles of 95 °C for 5 s and 60 °C for 30 s. Actin from C. sinense (Mol022529) was used to normalize the expression of genes. The 2−ΔΔCT method [54] was used to calculate the relative gene expression level. All the primers of CsMYB genes and actins for qRT–PCR were designed by Primer Premier 5 software and are listed in Table S7.

5. Conclusions

In this study, the 103 R2R3-MYB genes of C. sinense were identified from the genome. We analyzed their conserved motifs, exon–intron structures, secondary, and tertiary structures. The results showed that most R2R3-MYB genes were highly conserved, even from different species. Phylogeny and Ka/Ks ratios analysis indicated that most CsMYBs experienced negative selection, and three WDGs gave rise to more members in C. sinense. Functional cis-acting regulatory elements revealed that members in S4, S8, S18, S20, S21, and S22 might be drought-responsive, especially Mol015419 (S20). We also analyzed the expression patterns of CsMYB genes in leaves and roots under drought treatment in wild C. sinense. Consequently, more genes were upregulated in leaves under slight drought stress (L2) but downregulated in the roots of C. sinense. Nine CsMYB genes, mainly from S1, S3, S4, S8, S20, S21, and S22, were used to verify the expression patterns at three water deficit stages in leaves and roots. The results consistently indicated that these CsMYBs were probably upregulated in leaves and downregulated in roots under slight drought stress. Among them, members of S8 (Mol001948 and Mol002260) and S20 (Mol015419 and Mol007990) showed positive responses to drought stress. Interestingly, members of S22, such as Mol021537, might have different stress mechanisms because of the consistent upregulation in response to drought treatments in the roots of C. sinense. The results will provide available information for further studies on the stress responsiveness of R2R3-MYB genes in different tissues of orchid species and other plants.

Supplementary Materials

The following supporting information can be downloaded at: https://0-www-mdpi-com.brum.beds.ac.uk/article/10.3390/ijms24043235/s1.

Author Contributions

S.L. conceived and designed the research. M.Z. and Q.W. prepared the original draft. S.T. helped to perform the experiment. S.K., Y.B. and D.L. analyzed the data. S.A. and D.Z. revised the manuscript. All authors have read and agreed to the published version of the manuscript.

Funding

This research was funded by Forestry Peak Discipline Construction Project of Fujian Agriculture and Forestry University (72202200205).

Institutional Review Board Statement

Not applicable.

Informed Consent Statement

Not applicable.

Data Availability Statement

The original contributions presented in the study are included in the article/Supplementary Material, and further inquiries can be directed to the corresponding authors.

Conflicts of Interest

The authors declare no conflict of interest.

References

  1. Chen, C.; Zhang, K.X.; Khurshid, M.; Li, J.B.; He, M.; Georgiev, M.I.; Zhang, X.Q.; Zhou, M.L. MYB Transcription Repressors Regulate Plant Secondary Metabolism. Crit. Rev. Plant Sci. 2019, 38, 159–170. [Google Scholar] [CrossRef]
  2. Baldoni, E.; Genga, A.; Cominelli, E. Plant MYB Transcription Factors: Their Role in Drought Response Mechanisms. Int. J. Mol. Sci. 2015, 16, 15811–15851. [Google Scholar] [CrossRef] [PubMed]
  3. Ogata, K.; Morikawa, S.; Nakamura, H.; Sekikawa, A.; Inoue, T.; Kanai, H.; Sarai, A.; Ishii, S.; Nishimura, Y. Solution Structure of a Specific DNA Complex of the Myb DNA-Binding Domain with Cooperative Recognition Helices. Cell 1994, 79, 639–648. [Google Scholar] [CrossRef] [PubMed]
  4. Millard, P.S.; Kragelund, B.B.; Burow, M. R2R3 MYB Transcription Factors–Functions Outside the DNA-Binding Domain. Trends Plant Sci. 2019, 24, 934–946. [Google Scholar] [CrossRef]
  5. Dubos, C.; Stracke, R.; Grotewold, E.; Weisshaar, B.; Martin, C.; Lepiniec, L. MYB Transcription Factors in Arabidopsis. Trends Plant Sci. 2010, 15, 573–581. [Google Scholar] [CrossRef]
  6. Stracke, R.; Werber, M.; Weisshaar, B. The R2R3-MYB Gene Family in Arabidopsis thaliana. Curr. Opin. Plant Biol. 2001, 4, 447–456. [Google Scholar] [CrossRef]
  7. Fan, H.; Cui, M.; Li, N.; Li, X.; Liang, Y.; Liu, L.; Cai, Y.; Lin, Y. Genome-Wide Identification and Expression Analyses of R2R3-MYB Transcription Factor Genes from Two Orchid Species. PeerJ 2020, 8. [Google Scholar] [CrossRef]
  8. Oh, J.E.; Kwon, Y.; Kim, J.H.; Noh, H.; Hong, S.W.; Lee, H. A Dual Role for MYB60 in Stomatal Regulation and Root Growth of Arabidopsis Thaliana under Drought Stress. Plant Mol. Biol. 2011, 77, 91–103. [Google Scholar] [CrossRef]
  9. Seo, P.J.; Xiang, F.; Qiao, M.; Park, J.-Y.; Lee, Y.N.; Kim, S.-G.; Lee, Y.-H.; Park, W.J.; Park, C.-M. The MYB96 Transcription Factor Mediates Abscisic Acid Signaling during Drought Stress Response in Arabidopsis. Plant Physiol. 2009, 151, 275–289. [Google Scholar] [CrossRef]
  10. Jung, C.; Jun, S.S.; Sang, W.H.; Yeon, J.K.; Chung, H.K.; Sang, I.S.; Baek, H.N.; Yang, D.C.; Cheong, J.J. Overexpression of AtMYB44 Enhances Stomatal Closure to Confer Abiotic Stress Tolerance in Transgenic Arabidopsis. Plant Physiol. 2008, 146, 623–635. [Google Scholar] [CrossRef] [Green Version]
  11. Jian, L.; Kang, K.; Choi, Y.; Suh, M.C.; Paek, N. Mutation of OsMYB60 Reduces Rice Resilience to Drought Stress by Attenuating Cuticular Wax Biosynthesis. Plant J. 2022, 112, 339–351. [Google Scholar] [CrossRef] [PubMed]
  12. Yang, A.; Dai, X.; Zhang, W.-H. A R2R3-Type MYB Gene, OsMYB2, Is Involved in Salt, Cold, and Dehydration Tolerance in Rice. J. Exp. Bot. 2012, 63, 2541–2556. [Google Scholar] [CrossRef] [PubMed]
  13. Vannini, C.; Iriti, M.; Bracale, M.; Locatelli, F.; Faoro, F.; Croce, P.; Pirona, R.; di Maro, A.; Coraggio, I.; Genga, A. The Ectopic Expression of the Rice Osmyb4 Gene in Arabidopsis Increases Tolerance to Abiotic, Environmental and Biotic Stresses. Physiol. Mol. Plant Pathol. 2006, 69, 26–42. [Google Scholar] [CrossRef]
  14. Zhang, Z.; Liu, X.; Wang, X.; Zhou, M.; Zhou, X.; Ye, X.; Wei, X. An R2R3 MYB Transcription Factor in Wheat, TaPIMP1, Mediates Host Resistance to Bipolaris Sorokiniana and Drought Stresses through Regulation of Defense- and Stress-Related Genes. New Phytol. 2012, 196, 1155–1170. [Google Scholar] [CrossRef]
  15. Mao, H.; Jian, C.; Cheng, X.; Chen, B.; Mei, F.; Li, F.; Zhang, Y.; Li, S.; Du, L.; Li, T.; et al. The Wheat ABA Receptor Gene TaPYL1-1B Contributes to Drought Tolerance and Grain Yield by Increasing Water-Use Efficiency. Plant Biotechnol. J. 2022, 20, 846–861. [Google Scholar] [CrossRef]
  16. Zhang, S.; Yang, Y.; Li, J.; Qin, J.; Zhang, W.; Huang, W.; Hu, H. Physiological Diversity of Orchids. Plant Divers. 2018, 40, 196–208. [Google Scholar] [CrossRef]
  17. Chen, X.Q.; Liu, Z.J.; Zhu, G.H.; Lang, K.Y.; Tsi, Z.H.; Luo, Y.B.; Jin, X.H.; Cribb, P.J.; Wood, J.J.; Gale, S.W. Flora of China, Vol. 25; Science Press and Missouri Botanical Garden Press: St. Louis, MO, USA, 2009; pp. 260–280. [Google Scholar]
  18. Liu, Z.J.; Chen, L.J.; Liu, K.W.; Li, L.Q.; Zhang, Y.T.; Huang, L.Q. Climate Warming Brings about Extinction Tendency in Wild Population of Cymbidium Sinense. Acta Ecol. Sin. 2009, 29, 3443–3455. [Google Scholar]
  19. Wei, Y.L.; Jin, J.P.; Liang, D.; Gao, J.; Li, J.; Xie, Q.; Lu, C.Q.; Yang, F.X.; Zhu, G.F. Genome-Wide Identification of Cymbidium Sinense WRKY Gene Family and the Importance of Its Group III Members in Response to Abiotic Stress. Front. Plant Sci. 2022, 13. [Google Scholar] [CrossRef]
  20. Zheng, X.N.; Wen, Z.Q.; Pan, R.C.; Hew, C.S. Response of Cymbidium sinense to Drought Stress. J. Hortic. Sci. 1992, 67, 295–299. [Google Scholar] [CrossRef]
  21. Yang, F.-X.; Gao, J.; Wei, Y.-L.; Ren, R.; Zhang, G.-Q.; Lu, C.-Q.; Jin, J.-P.; Ai, Y.; Wang, Y.-Q.; Chen, L.-J.; et al. The Genome of Cymbidium sinense Revealed the Evolution of Orchid Traits. Plant Biotechnol. J. 2021, 19, 2501–2516. [Google Scholar] [CrossRef]
  22. Yujie, K.E.; Mingkun, C.; Shanhu, M.A.; Yue, O.U.; Yi, W.; Qingdong, Z.; Zhongjian, L.I.U.; Ye, A.I. Research Progress of MYB Transcription Factors in Orchidaceae. Acta Hortic. Sin. 2021, 48, 2311. [Google Scholar]
  23. Hu, B.; Jin, J.P.; Guo, A.Y.; Zhang, H.; Luo, J.C.; Gao, G. GSDS 2.0: An Upgraded Gene Feature Visualization Server. Bioinformatics 2015, 31, 1296–1297. [Google Scholar] [CrossRef] [PubMed] [Green Version]
  24. Bailey, T.L.; Williams, N.; Misleh, C.; Li, W.W. MEME: Discovering and Analyzing DNA and Protein Sequence Motifs. Nucleic Acids Res. 2006, 34, W369–W373. [Google Scholar] [CrossRef]
  25. Wilkins, O.; Nahal, H.; Foong, J.; Provart, N.J.; Campbell, M.M. Expansion and Diversification of the Populus R2R3-MYB Family of Transcription Factors. Plant Physiol. 2009, 149, 981–993. [Google Scholar] [CrossRef] [PubMed]
  26. Zhao, K.; Bartley, L.E. Comparative Genomic Analysis of the R2R3 MYB Secondary Cell Wall Regulators of Arabidopsis, Poplar, Rice, Maize, and Switchgrass. BMC Plant Biol. 2014, 14. [Google Scholar] [CrossRef]
  27. Wang, X.; Liang, L.; Li, L.; Wang, T. Genome-wide analysis of R2R3-MYB transcription factors in Phalaenopsis equestris. For. Res. 2018, 31, 104–113. (In Chinese) [Google Scholar]
  28. Ke, Y.J.; Zheng, Q.D.; Yao, Y.H.; Ou, Y.; Chen, J.Y.; Wang, M.J.; Lai, H.P.; Yan, L.; Liu, Z.J.; Ai, Y. Genome-Wide Identification of the Myb Gene Family in Cymbidium ensifolium and Its Expression Analysis in Different Flower Colors. Int. J. Mol. Sci. 2021, 22, 13245. [Google Scholar] [CrossRef]
  29. Chen, J.; Bi, Y.-Y.; Wang, Q.-Q.; Liu, D.-K.; Zhang, D.; Ding, X.; Liu, Z.-J.; Chen, S.-P. Genome-Wide Identification and Analysis of Anthocyanin Synthesis-Related R2R3-MYB Genes in Cymbidium goeringii. Front. Plant Sci. 2022, 13. [Google Scholar] [CrossRef]
  30. Lixiang, J.U.; Xin, L.E.I.; Chengzhi, Z.; Huangying, S.H.U.; Zhiwei, W.; Shanhan, C. Identification of MYB Family Genes and Its Relationship with Pungency of Pepper. Acta Hortic. Sin. 2020, 47, 875. [Google Scholar]
  31. Bowers, J.E.; Chapman, B.A.; Rong, J.; Paterson, A.H. Unravelling Angiosperm Genome Evolution by Phylogenetic Analysis of Chromosomal Duplication Events. Nature 2003, 422, 433–438. [Google Scholar] [CrossRef]
  32. Ai, Y.; Li, Z.; Sun, W.-H.; Chen, J.; Zhang, D.; Ma, L.; Zhang, Q.-H.; Chen, M.-K.; Zheng, Q.-D.; Liu, J.-F.; et al. The Cymbidium Genome Reveals the Evolution of Unique Morphological Traits. Hortic. Res. 2021, 8, 255. [Google Scholar] [CrossRef] [PubMed]
  33. Bi, H.; Luang, S.; Li, Y.; Bazanova, N.; Morran, S.; Song, Z.; Perera, M.A.; Hrmova, M.; Borisjuk, N.; Lopato, S. Identification and Characterization of Wheat Drought-Responsive MYB Transcription Factors Involved in the Regulation of Cuticle Biosynthesis. J. Exp. Bot. 2016, 67, 5363–5380. [Google Scholar] [CrossRef] [PubMed]
  34. Butt, H.I.; Yang, Z.; Gong, Q.; Chen, E.; Wang, X.; Zhao, G.; Ge, X.; Zhang, X.; Li, F. GaMYB85, an R2R3 MYB Gene, in Transgenic Arabidopsis Plays an Important Role in Drought Tolerance. BMC Plant Biol. 2017, 17, 1–17. [Google Scholar] [CrossRef] [PubMed]
  35. Yao, C.; Li, X.; Li, Y.; Yang, G.; Liu, W.; Shao, B.; Zhong, J.; Huang, P.; Han, D. Overexpression of a Malus baccata MYB Transcription Factor Gene MbMYB4 Increases Cold and Drought Tolerance in Arabidopsis thaliana. Int. J. Mol. Sci. 2022, 23, 1794. [Google Scholar] [CrossRef]
  36. Wu, Y.; Li, T.; Cheng, Z.; Zhao, D.; Tao, J.; Arasimowicz-Jelonek, M.; Kosmala, A.; Sobieszczuk-Nowicka, E.; Aroca, R. R2R3-MYB Transcription Factor PlMYB108 Confers Drought Tolerance in Herbaceous peony (Paeonia Lactiflora Pall.). Int. J. Mol. Sci. 2021, 22, 11884. [Google Scholar] [CrossRef]
  37. Cao, Z.H.; Zhang, S.Z.; Wang, R.K.; Zhang, R.F.; Hao, Y.J. Genome Wide Analysis of the Apple MYB Transcription Factor Family Allows the Identification of MdoMYB121 Gene Confering Abiotic Stress Tolerance in Plants. PLoS One 2013, 8, e69955. [Google Scholar] [CrossRef]
  38. Chen, C.; Chen, H.; Zhang, Y.; Thomas, H.R.; Frank, M.H.; He, Y.; Xia, R. TBtools: An Integrative Toolkit Developed for Interactive Analyses of Big Biological Data. Mol. Plant 2020, 13, 1194–1202. [Google Scholar] [CrossRef]
  39. Rozewicki, J.; Li, S.; Amada, K.M.; Standley, D.M.; Katoh, K. MAFFT-DASH: Integrated Protein Sequence and Structural Alignment. Nucleic Acids Res. 2019, 47, W5–W10. [Google Scholar] [CrossRef]
  40. Miller, M.A.; Pfeiffer, W.; Schwartz, T. The CIPRES Science Gateway: A Community Resource for Phylogenetic Analyses. In Proceedings of the Proceedings of the TeraGrid 2011 Conference: Extreme Digital Discovery, TG’11, Salt Lake City, UT, USA, 18–21 July 2011. [Google Scholar] [CrossRef]
  41. He, Z.; Zhang, H.; Gao, S.; Lercher, M.J.; Chen, W.-H.; Hu, S. Evolview v2: An Online Visualization and Management Tool for Customized and Annotated Phylogenetic Trees. Nucleic Acids Res. 2016, 44, W236–W241. [Google Scholar] [CrossRef]
  42. Zhang, J.; Li, Y.; Liu, B.B.; Wang, L.J.; Zhang, L.; Hu, J.J.; Chen, J.; Zheng, H.Q.; Lu, M.Z. Characterization of the Populus Rab Family Genes and the Function of PtRabE1b in Salt Tolerance. BMC Plant Biol. 2018, 18. [Google Scholar] [CrossRef]
  43. Zhang, Z.; Li, J.; Zhao, X.-Q.; Wang, J.; Wong, G.K.-S.; Yu, J. KaKs_calculator: Calculating Ka and Ks through Model Selection and Model Averaging. Genom. Proteom. Bioinform. 2006, 4, 259–263. [Google Scholar] [CrossRef] [PubMed]
  44. Wang, Q.Q.; Zhu, M.J.; Yu, X.; Bi, Y.Y.; Zhou, Z.; Chen, M.K.; Chen, J.; Zhang, D.; Ai, Y.; Liu, Z.J.; et al. Genome-Wide Identification and Expression Analysis of Terpene Synthase Genes in Cymbidium faberi. Front. Plant Sci. 2021, 12. [Google Scholar] [CrossRef] [PubMed]
  45. Geourjon, C.; Deleage, G. SOPMA: Significant Improvements in Protein Secondary Structure Prediction by Consensus Prediction from Multiple Alignments. Bioinformatics 1995, 11, 681–684. [Google Scholar] [CrossRef] [PubMed]
  46. Schwede, T.; Kopp, J.; Guex, N.; Peitsch, M.C. SWISS-MODEL: An Automated Protein Homology-Modeling Server. Nucleic Acids Res. 2003, 31, 3381–3385. [Google Scholar] [CrossRef]
  47. Lescot, M.; Déhais, P.; Thijs, G.; Marchal, K.; Moreau, Y.; van de Peer, Y.; Rouzé, P.; Rombauts, S. PlantCARE, a Database of Plant Cis-Acting Regulatory Elements and a Portal to Tools for in Silico Analysis of Promoter Sequences. Nucleic Acids Res. 2002, 30, 325–327. [Google Scholar] [CrossRef]
  48. Edwards, P.M. COMPUTER SOFTWARE REVIEWS Origin 7.0: Scientific Graphing and Data Analysis Software. Available online: https://0-pubs-acs-org.brum.beds.ac.uk/doi/pdf/10.1021/ci0255432 (accessed on 25 December 2022).
  49. Chen, Y.; Chen, Y.; Shi, C.; Huang, Z.; Zhang, Y.; Li, S.; Li, Y.; Ye, J.; Yu, C.; Li, Z. SOAPnuke: A MapReduce Acceleration-Supported Software for Integrated Quality Control and Preprocessing of High-Throughput Sequencing Data. Gigascience 2018, 7, gix120. [Google Scholar] [CrossRef]
  50. Kim, D.; Langmead, B.; Salzberg, S.L. HISAT: A Fast Spliced Aligner with Low Memory Requirements. Nat. Methods 2015, 12, 357–360. [Google Scholar] [CrossRef]
  51. Li, B.; Dewey, C.N. RSEM: Accurate Transcript Quantification from RNA-Seq Data with or without a Reference Genome. BMC Bioinform. 2011, 12, 1–16. [Google Scholar] [CrossRef]
  52. Langmead, B.; Salzberg, S.L. Fast Gapped-Read Alignment with Bowtie 2. Nat. Methods 2012, 9, 357–359. [Google Scholar] [CrossRef]
  53. He, C.; Teixeira da Silva, J.A.; Wang, H.; Si, C.; Zhang, M.; Zhang, X.; Li, M.; Tan, J.; Duan, J. Mining MYB Transcription Factors from the Genomes of Orchids (Phalaenopsis and Dendrobium) and Characterization of an Orchid R2R3-MYB Gene Involved in Water-Soluble Polysaccharide Biosynthesis. Sci. Rep. 2019, 9, 13818. [Google Scholar] [CrossRef]
  54. Livak, K.J.; Schmittgen, T.D. Analysis of Relative Gene Expression Data Using Real-Time Quantitative PCR and the 2−ΔΔCT Method. Methods 2001, 25, 402–408. [Google Scholar] [CrossRef] [PubMed]
Figure 1. Phylogenetic analysis of R2R3-MYB proteins from C. sinense, A. thaliana, O. sativa, and T. aestivum. In total, 103 CsMYB, 126 AtMYB, three drought-responsive OsMYB, and two TaMYB protein sequenses were selected to construct the ML tree with 1000 bootstraps using RAxML-HPC2 on XSEDE. S1–S25 indicates the subgroups according to the classification of R2R3-MYB proteins in A. thaliana.
Ijms 24 03235 g001
Figure 2. Phylogenetic relationships, conserved motifs, and intron–exon structure analysis of CsMYBs and DrMYBs. (A) Phylogenetic tree constructed with 103 CsMYBs and 11 DrMYBs. S1-S25 represent the subgroups. (B) Conserved protein motifs in different subgroups of CsMYBs and DrMYBs. The sequence logos of the motifs are listed in the supplementary files (Figure S1). The colored boxes indicate the motifs from 1 to 15, as listed at the bottom of the figure. (C) The predicted intron–exon structures in CsMYB genes and DrMYBs. The yellow boxes and black lines exhibit exons and introns, respectively.
Ijms 24 03235 g002
Figure 3. Sequence logos of the R2 (A) and R3 (B) repeats of CsMYB proteins. (A,B) indicate the logos of the R2 and R3 domains, respectively, based on multiple alignment analyses of 103 CsMYB proteins. * Indicates typical conserved tryptophan residues in the MYB domain.
Ijms 24 03235 g003
Figure 4. The collinearity of CsMYB genes between A. thaliana, O. sativa, and T. aestivum. The grey lines in the background indicate collinear blocks within the A. thaliana, O. sativa, T. aestivum, and C. sinense genomes, while the colored lines highlight the syntenic R2R3-MYB gene pairs.
Ijms 24 03235 g004
Figure 5. Protein tertiary structure of R2R3-MYB genes from subgroups 1, 8, 20, and 22. The tertiary structures were colored in rainbow order, representing N to C terminus.
Ijms 24 03235 g005
Figure 6. Analysis of cis-acting regulatory elements in CsMYBs and DrMYBs. (A) Phylogenetic tree constructed with 103 CsMYBs and 11 DrMYBs. S1-S25 represent the subgroups. (B) Heatmap of the number of cis-elements. Color bars and values in the box indicate the classification and number of cis-elements, respectively. Orange, green, yellow, and purple colors exhibit cis-acting elements in light responsiveness, phytohormone responsiveness, stress responsiveness, and plant growth development. (C) The sum of 4 types of cis-elements in each gene is represented by a histogram of different colors.
Ijms 24 03235 g006
Figure 7. Expression profiles of CsMYB genes in leaves (A) and roots (B) of C. sinense under different degrees of drought treatment based on transcriptome data. L1, L2, and L3 represent control, slight, and severe drought treatments in leaves, respectively. The same treatments in roots are marked as R1, R2, and R3. The color bar represents the normalized FPKM values as follows: red, high expression level; white, low expression level; and blue, no expression. Detailed FPKM values are listed in Table S5.
Ijms 24 03235 g007
Table 1. MYB transcription factors in nine plant species.—not determined; 1 this study.
SpeciesMYB Groups
MYB-relatedR2R3-MYB3R-MYBAtypical MYB
EudicotA. thaliana [5,6]6412652
P. trichocarpa [25,26]-1925-
O. sativa [26]7012551
MonocotP. equestri [27]27962-
P. aphrodite [7]-99--
D. officinale [7]-101--
C. ensifolium [28]2710222
C. goeringii [29]-104--
C. sinense 15510041
Disclaimer/Publisher’s Note: The statements, opinions and data contained in all publications are solely those of the individual author(s) and contributor(s) and not of MDPI and/or the editor(s). MDPI and/or the editor(s) disclaim responsibility for any injury to people or property resulting from any ideas, methods, instructions or products referred to in the content.

