
Track Structure of Light Ions: The Link to Radiobiology

INFN-LNL, Viale dell’Università 2, I-35020 Legnaro, Italy
*
Author to whom correspondence should be addressed.
Int. J. Mol. Sci. 2023, 24(6), 5826; https://0-doi-org.brum.beds.ac.uk/10.3390/ijms24065826
Submission received: 14 February 2023
/
Revised: 9 March 2023
/
Accepted: 16 March 2023
/
Published: 18 March 2023
(This article belongs to the Special Issue Electron and Radical Induced Chemistry with Radiobiological Applications)
Abstract
:It is generally recognized that the biological response to irradiation by light ions is initiated by complex damages at the DNA level. In turn, the occurrence of complex DNA damages is related to spatial and temporal distribution of ionization and excitation events, i.e., the particle track structure. It is the aim of the present study to investigate the correlation between the distribution of ionizations at the nanometric scale and the probability to induce biological damage. By means of Monte Carlo track structure simulations, the mean ionization yield and the cumulative probabilities , , and of at least one, two and three ionizations, respectively, were calculated in spherical volumes of water-equivalent diameters equal to 1, 2, 5 and 10 nm. When plotted as a function of , the quantities , and are distributed along almost unique curves, largely independent of particle type and velocity. However, the shape of the curves depends on the size of the sensitive volume. When the site size is 1 nm, biological cross sections are strongly correlated to combined probabilities of and calculated in the spherical volume, and the proportionality factor is the saturation value of biological cross sections.
1. Introduction
It is generally accepted that the biological response to irradiation with light ions is initiated, to a greater part, by complex lesions at the DNA level [1]. It is also recognized that the complexity of these lesions and their repairability are related to the clustering of energy deposition events at the nanoscopic level and therefore to the particle track structure, i.e., to the spatial and temporal distributions of ionization and excitation events [2,3]. In particular, it can be assumed: (i) that the severity of radiation damage to the DNA increases with an increasing number of particle interactions therein, and (ii) that the ability of cells to recognize and correctly repair the damage decreases with increasing damage complexity. The complete description of particle track structure can be studied by means of Monte Carlo simulations [4], but experimental techniques are not yet able to detect very small events of energy deposition, which are common in volumes of nanometer size. The experimental determination of the stochastic aspects of particle interaction is therefore limited to the ionization component of the energy deposition event. When the number of ionizations is large, it is assumed that the mean ionization yield is proportional to the mean energy deposited and that the stochastic distribution of the number of ionizations produced in the sensitive volume is a good representation of the stochastics of energy deposition. On the other hand, when the number of ionizations is very small, the discrete distribution of the number of ionizations (hereafter called the ionization cluster-size distribution, ICSD) fails in describing the details of the continuous distribution of the energy deposited [5]. The stochastic distribution of energy deposition events derived from ionization measurements (multiplying the number of ionizations by the average energy expended per ion pair formed) is a discrete distribution instead of a continuous one. However, a strong correlation still exists between the moments of the energy and ionization distributions [6]. At the same time, a recent study on the nature of damaging events (measurable ionizations vs. other inelastic channels) induced in simulated DNA targets by swift carbon ion beams in a wide energy range concluded that about 70% of the events leading to the damaging clusters correspond to ionization processes [7]. Based on these findings, and in view of establishing a procedure to characterize the radiation quality of particle tracks based on measurable quantities, the ionization component of particle track structure has been studied both experimentally and by means of Monte Carlo simulations [8,9,10,11,12,13,14,15].
The number ν of ionizations created in a nanometer-sized target volume by single ionizing particles penetrating through or passing nearby the target at specified impact parameter d is measured, and the corresponding relative frequency ) represents the probability of cluster size ν due to ionizing particles of radiation quality Q (defined as the charge state and velocity of a particle) [9]. In this work, only central passage of a spherical target volume V is considered, with primary ions traveling along the V diameter with the impact parameter set to zero. Hence, the dependence on the impact parameter is not made explicit in the notation (being always d = 0), while the dependence on the site diameter D is explicitly introduced as ). The chosen irradiation geometry is not meant to mimic the real scenario, where a biological target are obviously irradiated at different impact parameters. The aim is to identify characteristic quantities of the particle track structure that correlate to the radio-induced biological damage better than the particle LET. Based on the probabilities ), the mean ionization-cluster size caused by single ionizing particles in the target volume is given by the moment , which is defined by Equation (1) for = 1.
Similarly, the complementary cumulative probability of forming ionization-cluster sizes is given by the sum defined by Equation (2).
Here, ) represents the probability that an ionizing particle creates at least one ionization within the target volume, and ) is the probability that an ionizing particle creates at least two ionizations in it. The cumulative probabilities describe the clustering of ionizations within short distances and are therefore related to the induced radiobiological DNA damage. Based on a large amount of data, it has been observed that when plotted as a function of , the quantities , and behave as almost unique curves, independent of radiation quality, and correlate with the biological inactivation cross sections, if measured in target volumes between 1 and 1.5 nm in size [16,17]. While it was recognized that the contribution of the δ-electrons depends on site size, it was inferred that this variable contribution has only a minor influence on the functional dependency of on , at least for . The aim of this work was to study in more detail the shape of the curves ) for different sizes of the target volume and their correlation to the inactivation of cross sections for V79 and HSG cells available in the literature.
This work reports on Monte Carlo track-structure simulations [9,18] performed for protons, helium and carbon ions of different energies interacting with gaseous spherical target volumes equivalent to water spheres of diameters 1, 2, 5 and 10 nm [19]. The traveling direction of primary particles was set along the sphere diameter (impact parameter set to zero).
2. Results
2.1. Track Structure Characteristics
Figure 1 shows the cumulative distributions , and simulated in target volumes of diameters 1, 2, 5, and 10 nm in water, as a function of the mean ionization yield . Tables with the simulated data are given in Appendix A. It can be observed that, for a specified site size, depends almost exclusively on , independent of particle type (protons, helium and carbon ions) and velocity. However, the shape of the curve depends on site size: at small values, the difference between , , and is maximum at diameter D = 1 nm and decreases with increasing site sizes. The cumulative distributions show a saturation effect at increasing , which follows from their definition. The variability between the smallest value of , corresponding to 200 MeV protons, and the largest one, corresponding to 1 AMeV carbon ions, is of about 3.5, 3.0, 2.5 and 2 orders of magnitude at 1, 2, 5 and 10 nm, respectively. The variation is even more pronounced for , while it is less evident for .
In Figure 1, symbols correspond to ion types for which the Monte Carlo simulations were performed. The lines are the best fit of the simulated data, performed with the following equations, which offer a parametrization of and will be discussed later:
The values of the fitting parameters , and , which depend on the diameter of the simulated site but are independent of particle type, are reported in Table 1.
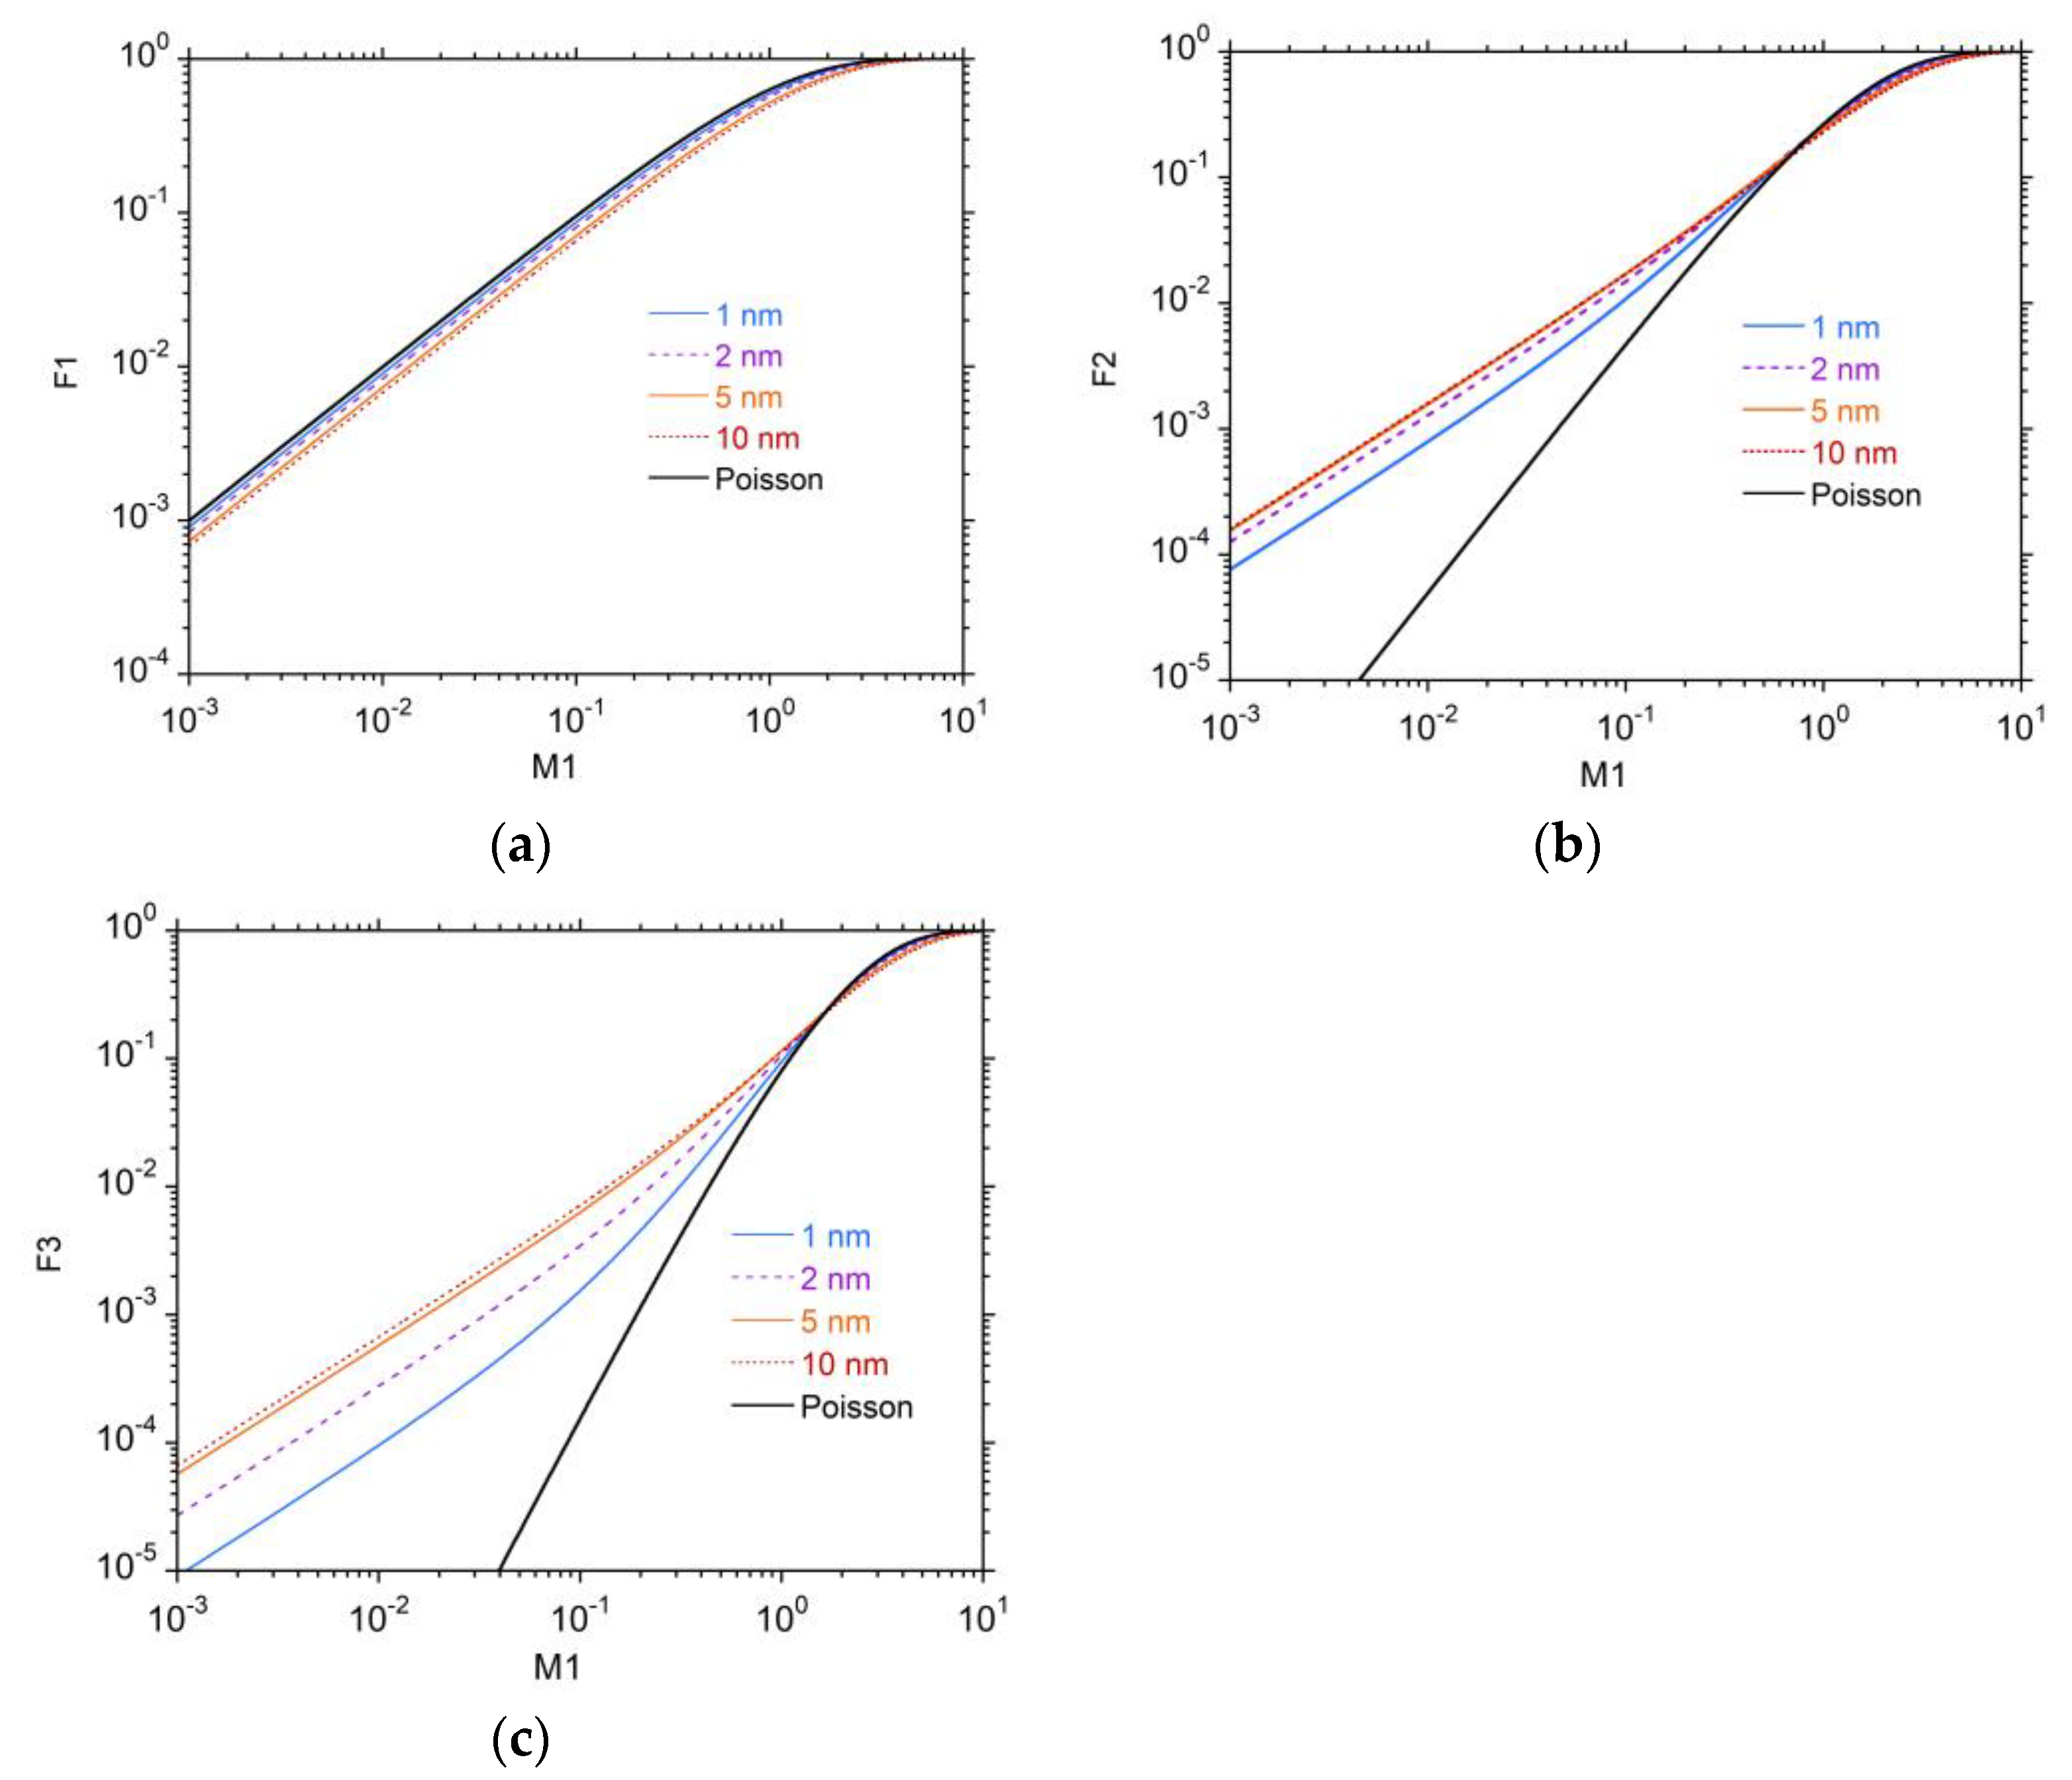
To make the functional dependency of on at the different simulated site sizes more clear, Figure 2 shows in panel (a), in panel (b) and in panel (c). The black lines represent the values that would derive from a pure Poisson distribution of the cluster size ν, with mean value . It can be observed that always lies below the corresponding “Poisson-type” curve, while and always lie above. The deviations increase with increasing site size, reflecting the growing contribution by δ-electrons to the total ionization inside the target volume. When the site size is small, the contribution by δ-electrons is also small, and the stochastics of the number of ionizations is dominated by the component due to ionizations of the primary particle, which is Poisson distributed.
It is clear from Figure 2 that the cumulative probabilities have a functional dependency on that depends on the size of the simulated volume, in particular for small sizes with .
The complete distributions were simulated, including the probability for cluster size . This choice is different from that by other authors [20,21,22], who instead considered the conditional distributions, i.e., without taking into account the passage of a particle that does not produce any ionization in the target volume. The reason to keep count of the zeroes is that the complete distributions have the additive property, i.e., in a mixed radiation field, the resulting distribution is the sum of all the corresponding to all the (j) components, each weighted with the relative frequency of radiation quality (j). The same additive property holds for all the derived quantities, in particular for the moments and the cumulative quantities .
2.2. The Link to Radiobiology
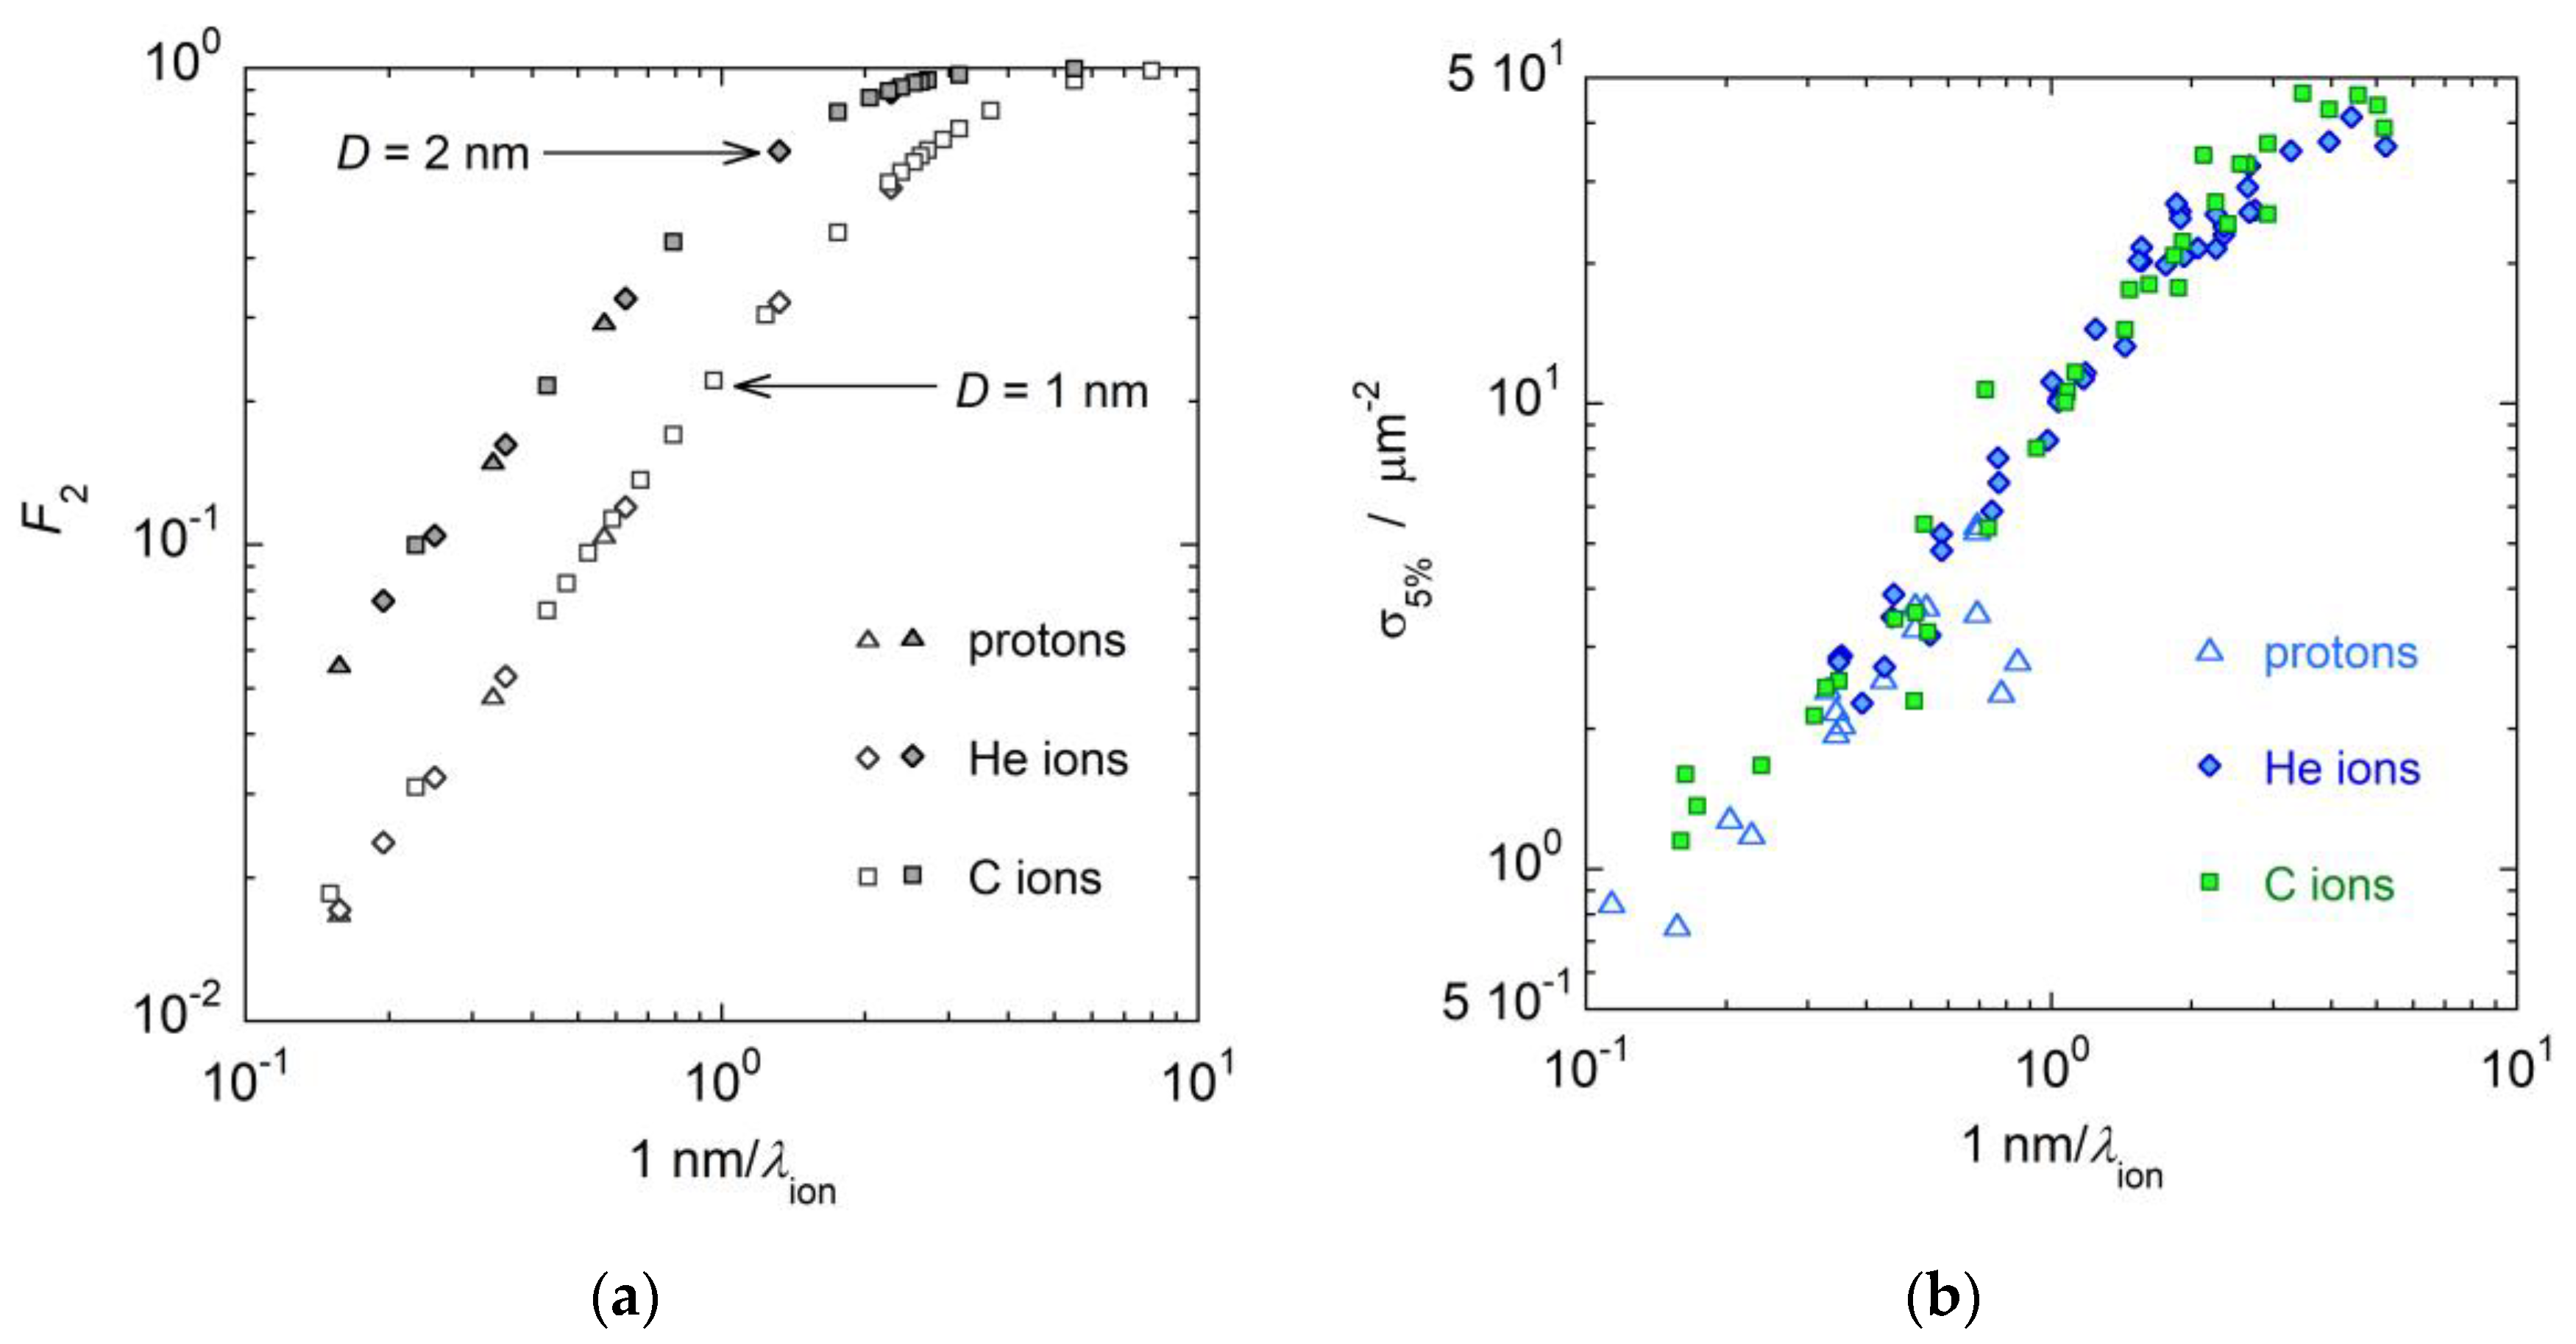
It has already been noted [16], and it is confirmed in this study, that the cumulative distribution functions behave, when plotted as a function of mean cluster size , in a similar way as biological inactivation cross sections [23] plotted as a function of LET: they first increase with increasing or LET until they show a saturation effect at large or LET values. In particular, a strong correlation has been observed between the cumulative probability and the inactivation cross section at 5% survival, [17]. To study this correlation in more detail, biological data for V79 asynchronous cells irradiated by protons, helium and carbon ions, available in the PIDE radiobiological database [24], are plotted in Figure 3b versus the ratio , where is the mean free ionization path length of the primary particles in propane [9]; the ratio represents the mean number of ionizations produced by the primary particle in 1 nm path length. In Figure 3a, the probabilities calculated in simulated sites of diameter D equal to 1 and 2 nm are also plotted versus the ratio .
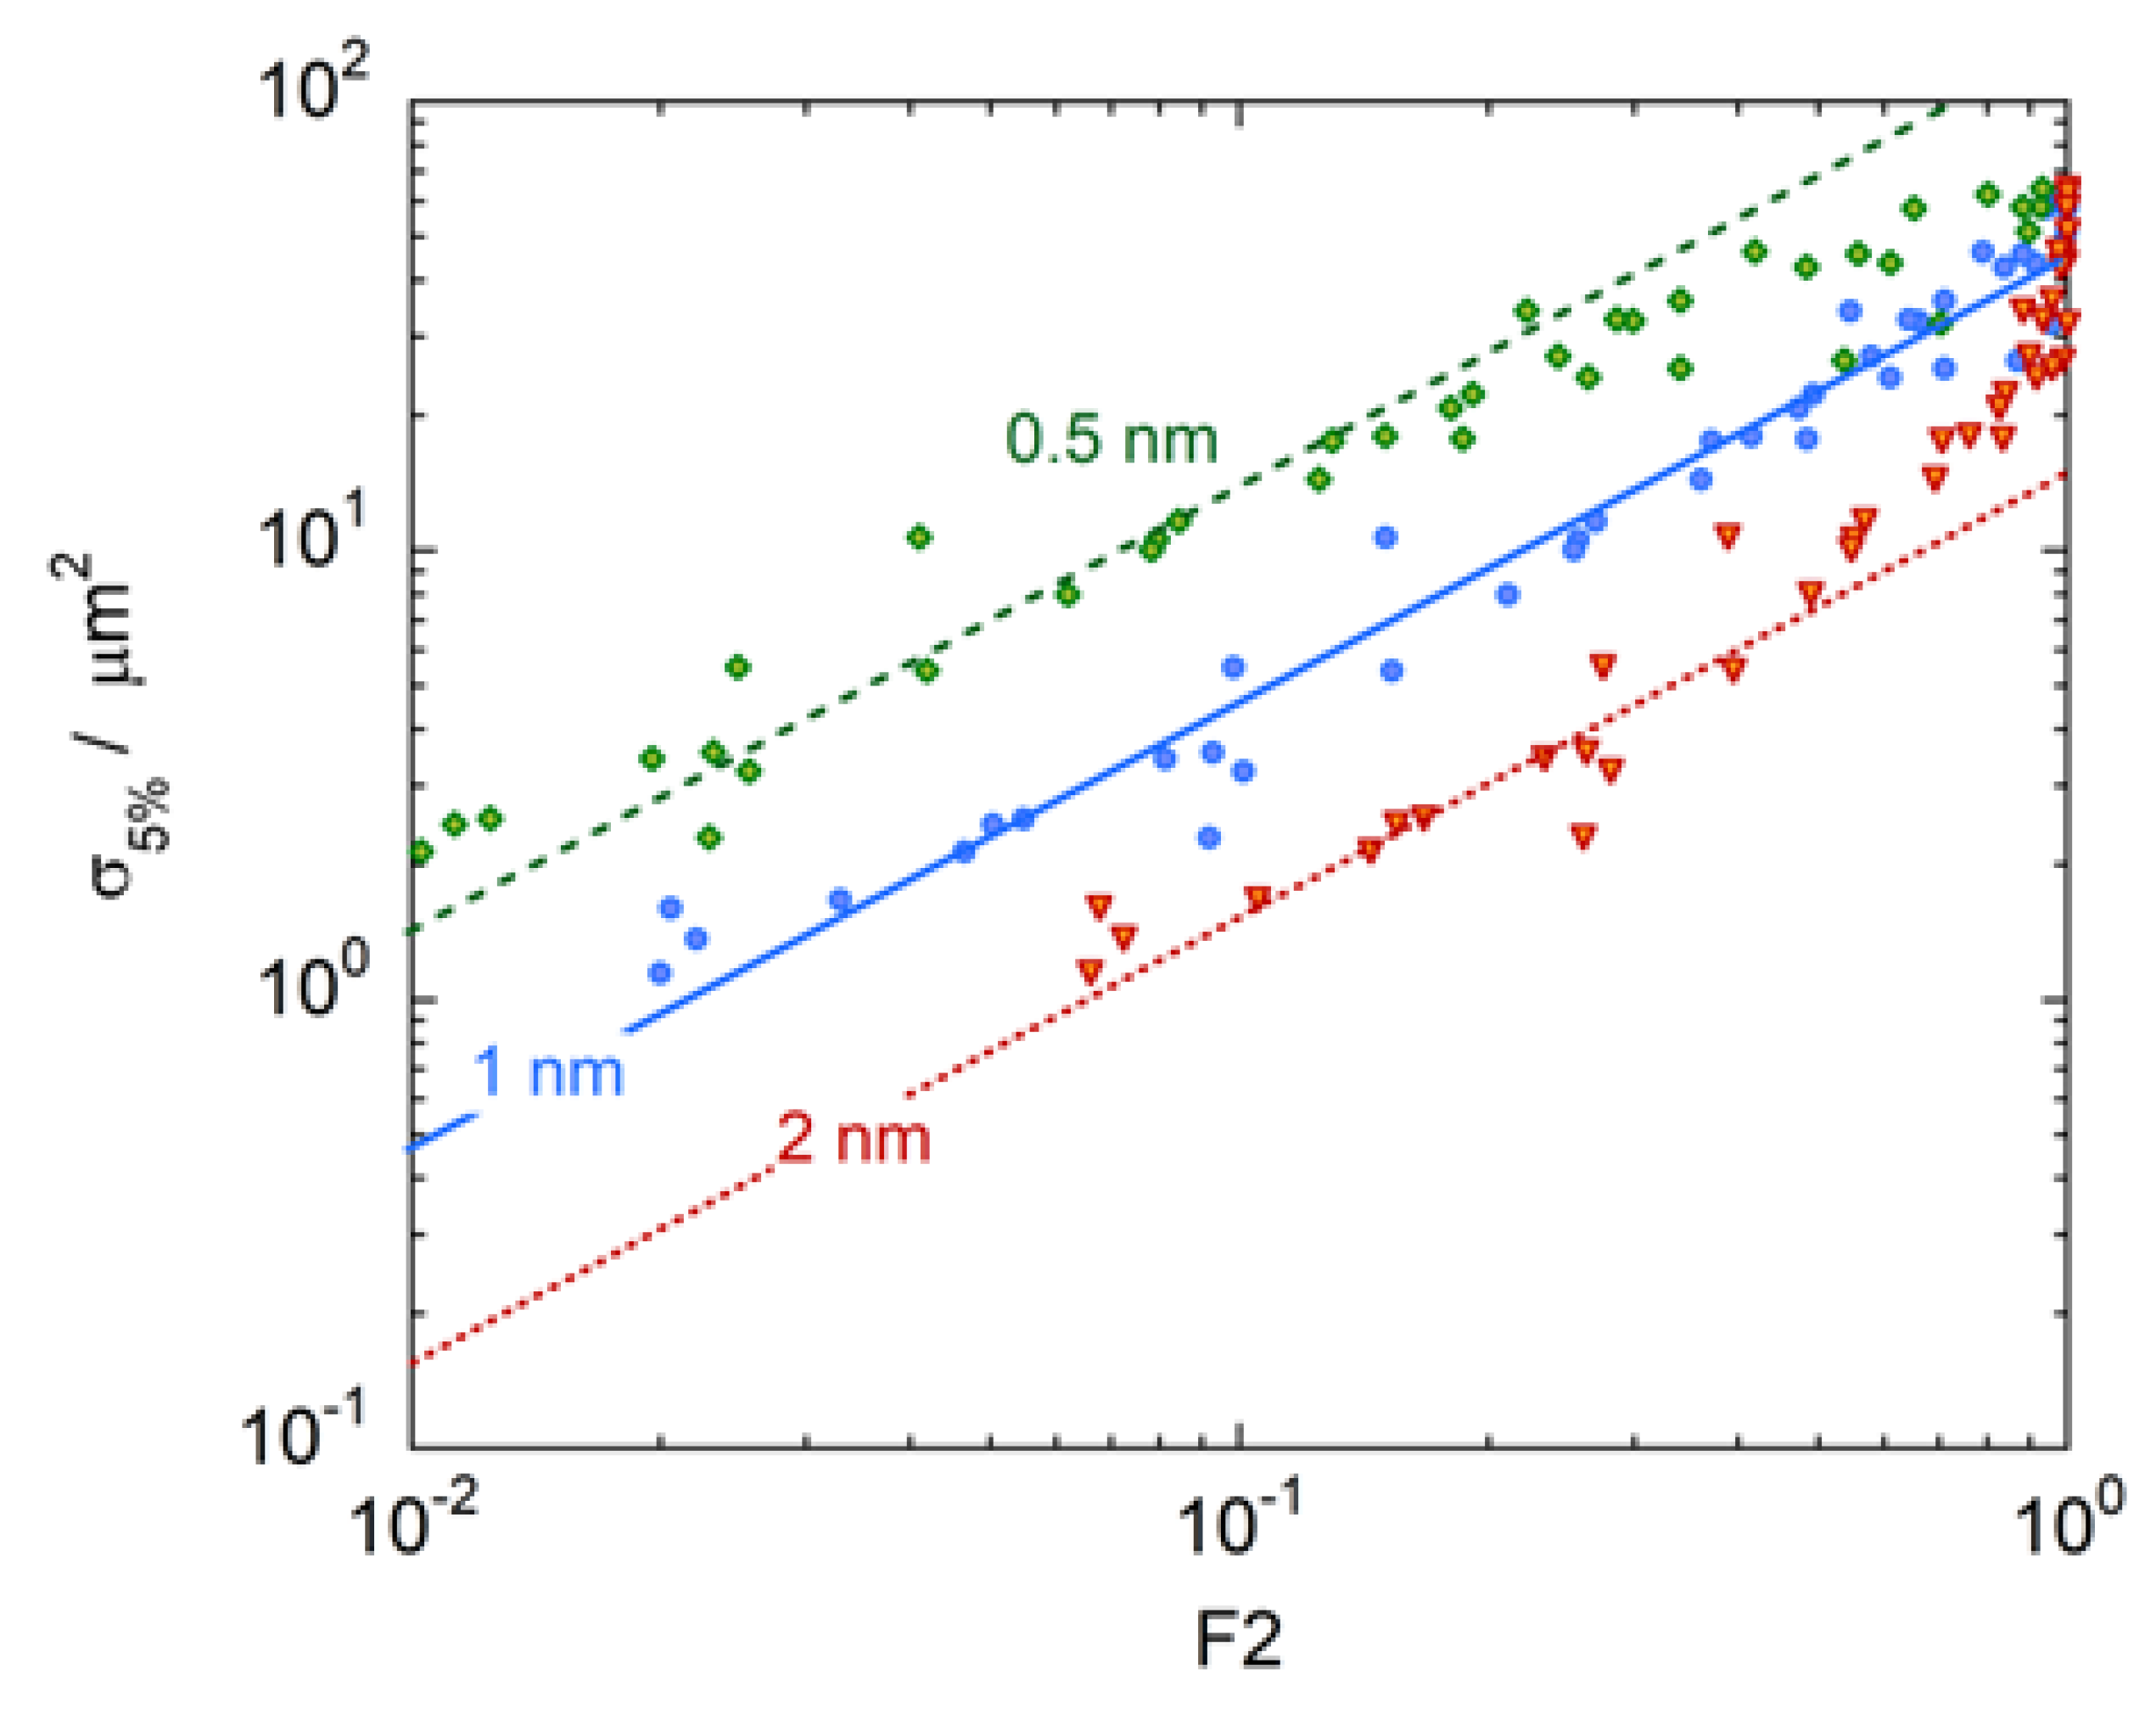
It can be easily observed that the best correspondence is achieved for D = 1 nm. This result is clearer in Figure 4, where the inactivation cross sections for carbon ion irradiation are plotted as a function of for different site sizes: 0.5, 1 and 2 nm. The best correlation between and is found when is measured in a simulated volume of diameter D = 1 nm. If the site size is smaller, for instance D = 0.5 nm, the cross sections bend, and their growth slows for when saturation begins to take effect and the correlation is lost. If the target volume is larger than 1 nm, for instance D = 2 nm, reaches the saturation value of too early, for radiation qualities at which biological cross sections are still growing. For D = 1 nm, has good approximation proportional to for all radiation qualities, the proportionality factor being k = 50 μm2, which approximately corresponds to the saturation value of the biological cross sections.
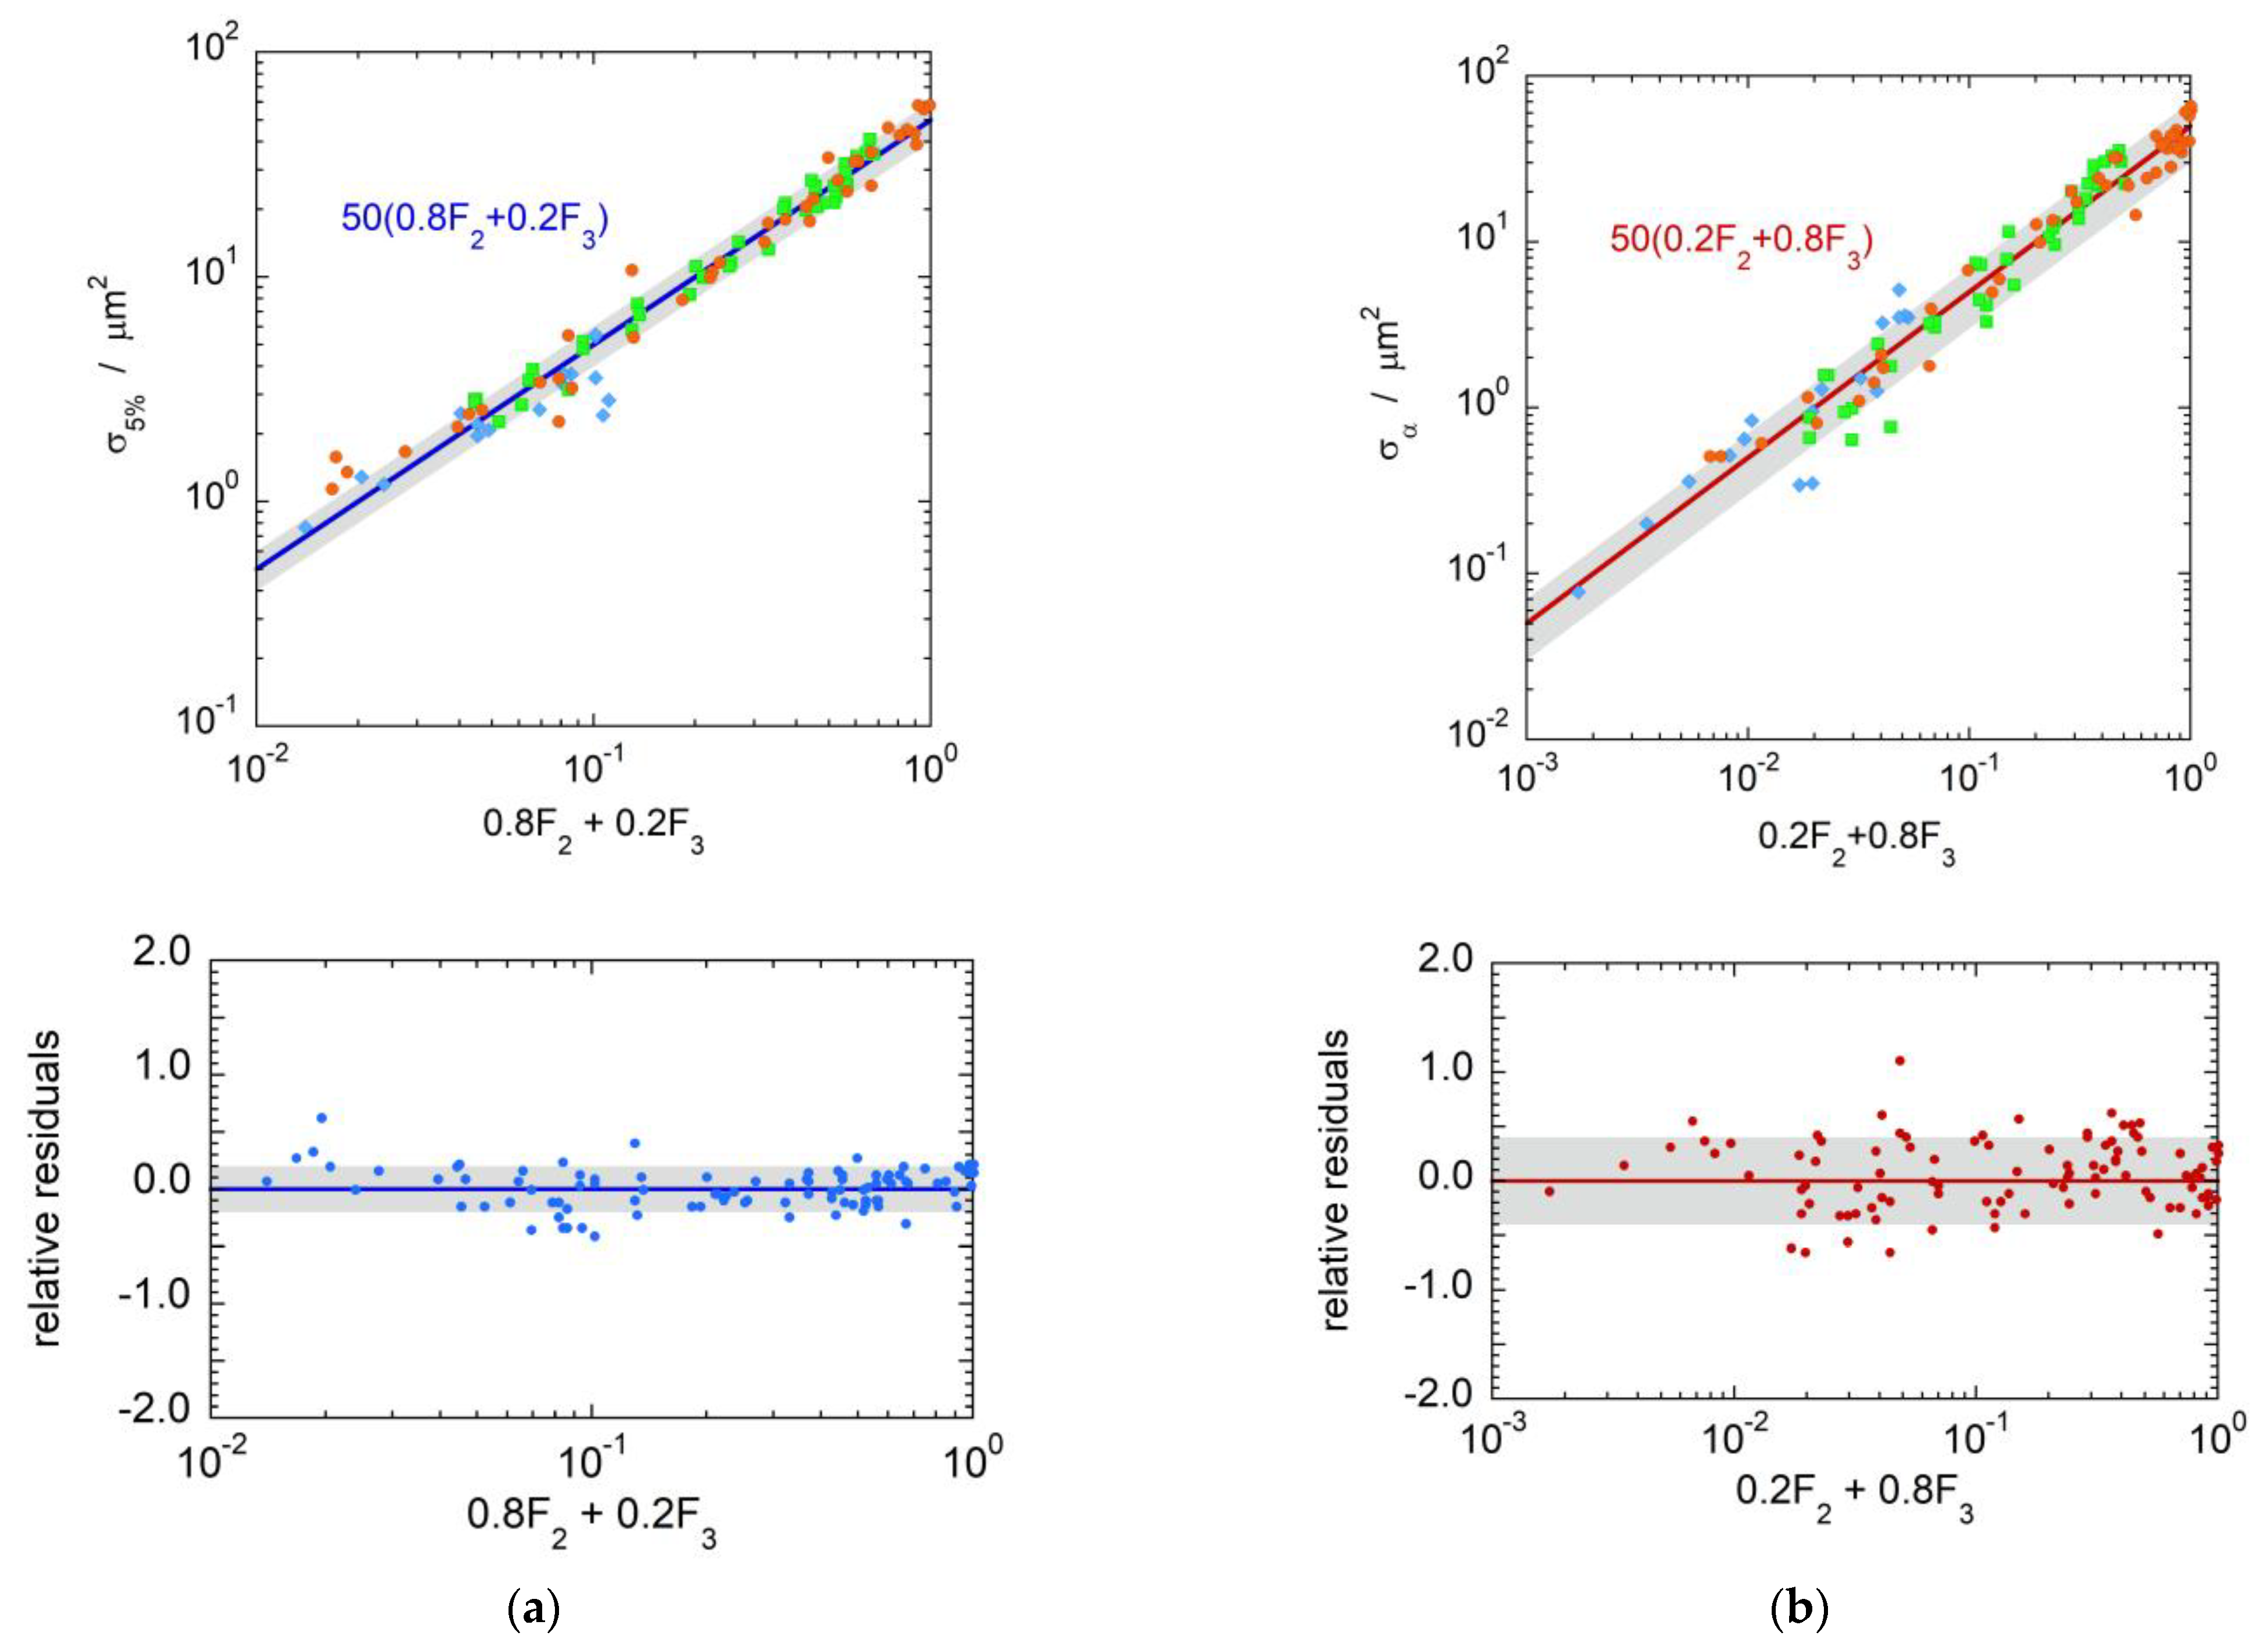
The correlation between biological cross sections and nanodosimetric quantities was therefore investigated in detail for a simulated target volume 1 nm in diameter. The correlations of and with specific combinations of the cumulative probabilities and are represented in Figure 5a,b, respectively. The relative residuals, plotted in the bottom panels, are Gaussian distributed with a standard deviation of 0.18 for and 0.35 for .
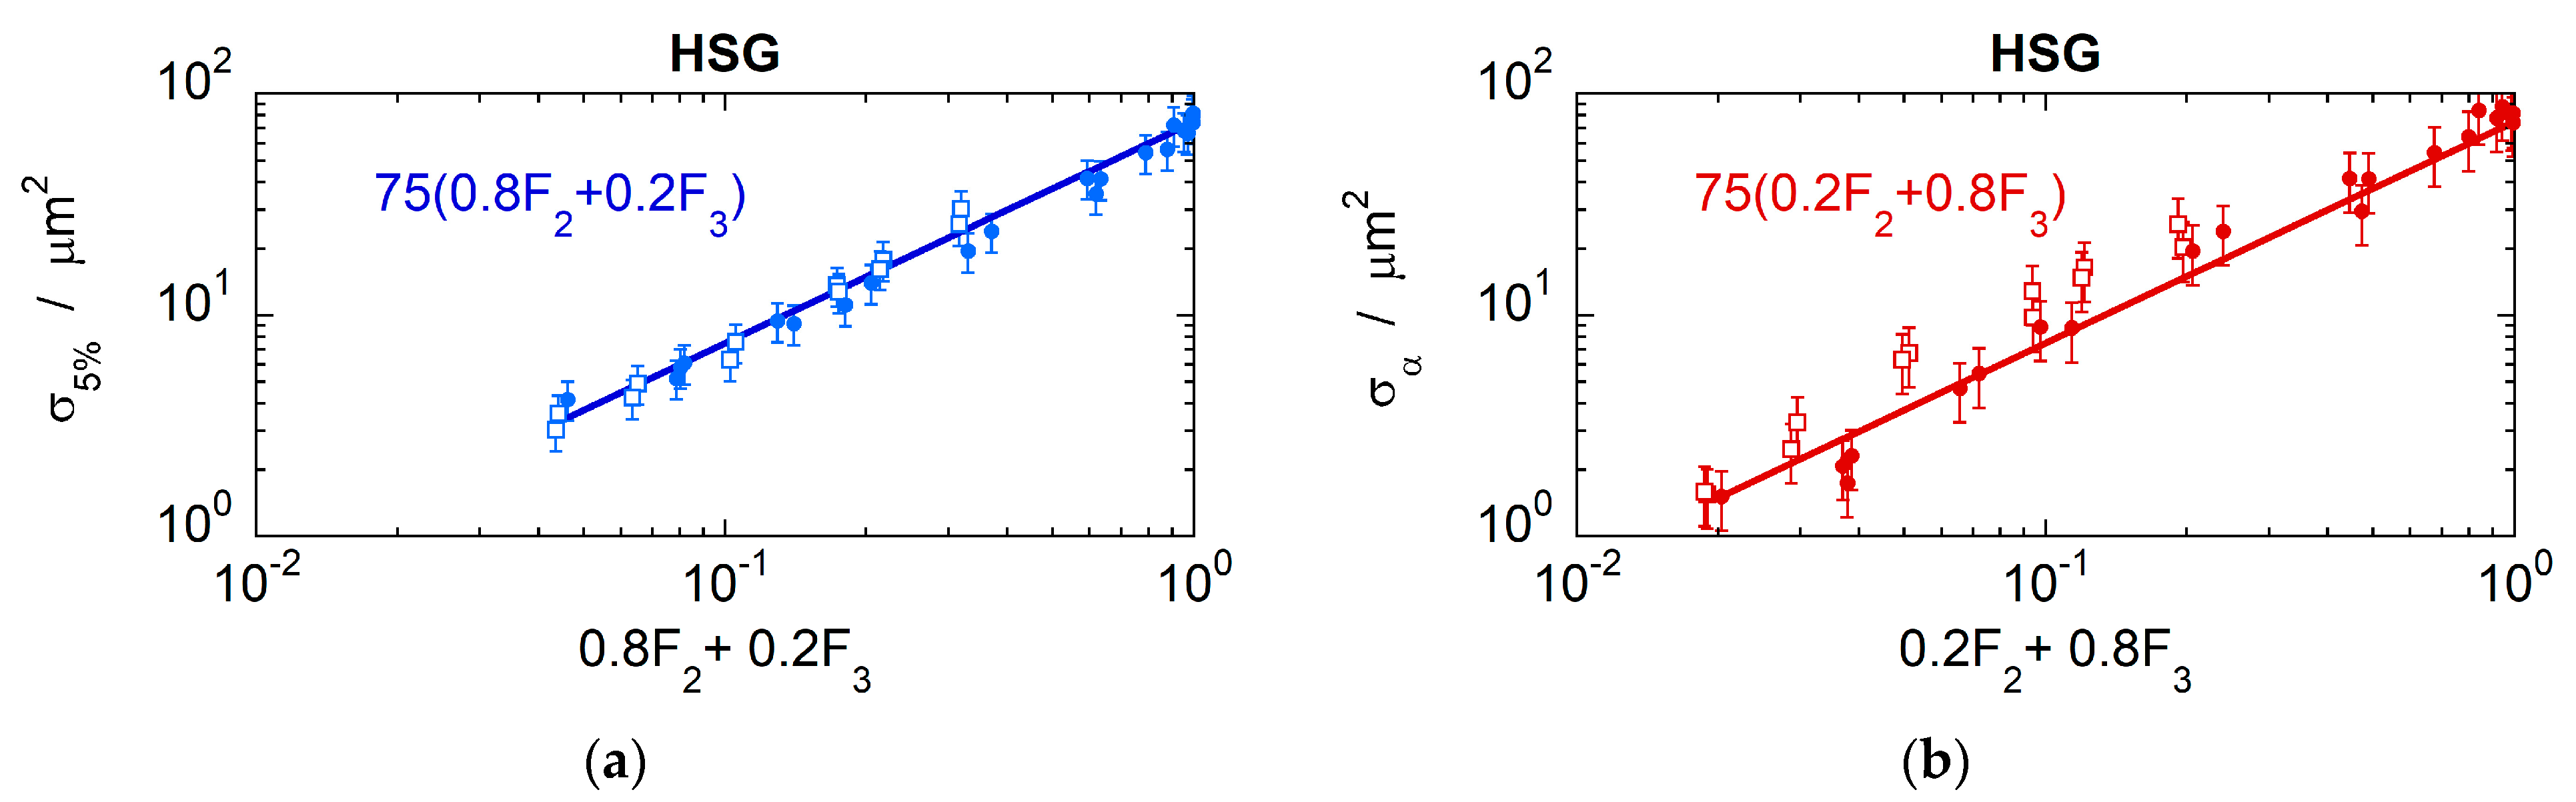
The analysis was extended to another cell line, specifically to asynchronous HSG cells irradiated by helium and carbon ions, data which are also available in the PIDE database. The results are illustrated in Figure 6, which shows the biological cross sections (panel a) and (panel b) plotted as a function of the linear combinations and , respectively. Similarly to the V79 cells, a good correlation was found but with a proportionality factor k = 0.75 μm2, reflecting the larger sensitive volume for HSG compared to that of V79 cells, also indicated in other works [25].
3. Discussion
The Probabilistic Description of Ionization–Cluster Size Formation
The behavior of the cumulative distribution functions at different site sizes can be interpreted on the basis of a probabilistic theory of ionization–cluster size formation [9]. For ionizing particles of radiation quality Q crossing a nanometer-sized spherical target volume V along its diameter D, it is assumed that the ionization cluster-size caused within V is exclusively determined by the average number of ionizing interactions of a primary particle along D and by the behavior of δ-electrons within the target volume.
Based on these basic assumptions, the probability of ionization–cluster size ν is given by a compound Poisson process [9] described by Equation (6).
Here, is the probability that in the event of exactly κ primary ionizations due to primary particles of radiation quality Q, a cluster size ν is formed within the target volume (the ionizations due to δ-electrons are included). The average number of ionizing interactions of a primary particle along D is given as the quotient , where is the mean free ionization path length of the primary particles in matter.
In view of the fact that in a short track segment, an ionization process due to a primary particle is independent of the number of previously formed ions, the distribution is given by the κ-fold convolution of the probability distribution , ν = 1, 2, 3, …, in the case of a single primary ionization (κ = 1), which is referred to in the following single-ionization distribution, i.e.,
where the convolution operation, indicated by the asterisk, is performed κ times (κ-fold convolution) and is defined for two discrete functions and , ν = 0, 1, 2, …, as .
The single-ionization distributions , ν = 0, 1, 2, … represent the cluster-size formation due to a single primary ionization event; therefore, they are independent of , but at least in principle, they depend on the spectral distribution of secondary electrons set in motion by impact ionization and, thus, on the particle’s velocity. In contrast, is determined by the mean free ionization path length of the primary particles in matter and, thus, on the particles’ charge state and velocity.
To relate the ionization–cluster size probabilities defined by Equation (6) to the members of the single-ionization distribution, the formalism of folding discrete distributions can be applied:
Here, Equation (8) represents the folding of the single-ionization distribution with the distribution in the case of exactly κ-1 primary ionizations. For κ = 0, the expression reflects the fact that, if no primary ionizations take place, no δ-electrons are produced in the target volume, and the only possible cluster size is ν = 0. This assumption neglects the contribution to the total ionization by δ-electrons that are produced outside of the target volume V and enter it. For κ ≥ 1, by successive application of the convolution operation, all members of the -distribution can be written as a sum of products, which exclusively consists of members of the -distribution in the case of a single primary ionization. For particles directly crossing the target volume V:
because in volume V, there are at least primary ionizations. As a consequence, in case of a particle traversing the target volume, the superior limit of the summation in Equation (8) can be substituted by :
The first values of , for , can be easily obtained:
The cumulative distributions and and can be simply derived and written in terms of the members and of the single-ionization distribution:
can also be written in terms of and the mean value of the distribution, as derived in detail in [9]:
It can be observed that, under the hypothesis , depends only on the quotient , while and depend on the single ionization distribution values and and therefore on the spectral distribution of secondary δ-electrons. However, Figure 1 shows only negligible dependency of , and on particle type and thus also on the primary particle velocity if is the same.
Comparing Equations (14)–(16) with the fitting Equations (3)–(5), the following relations exist for the fitting parameters :
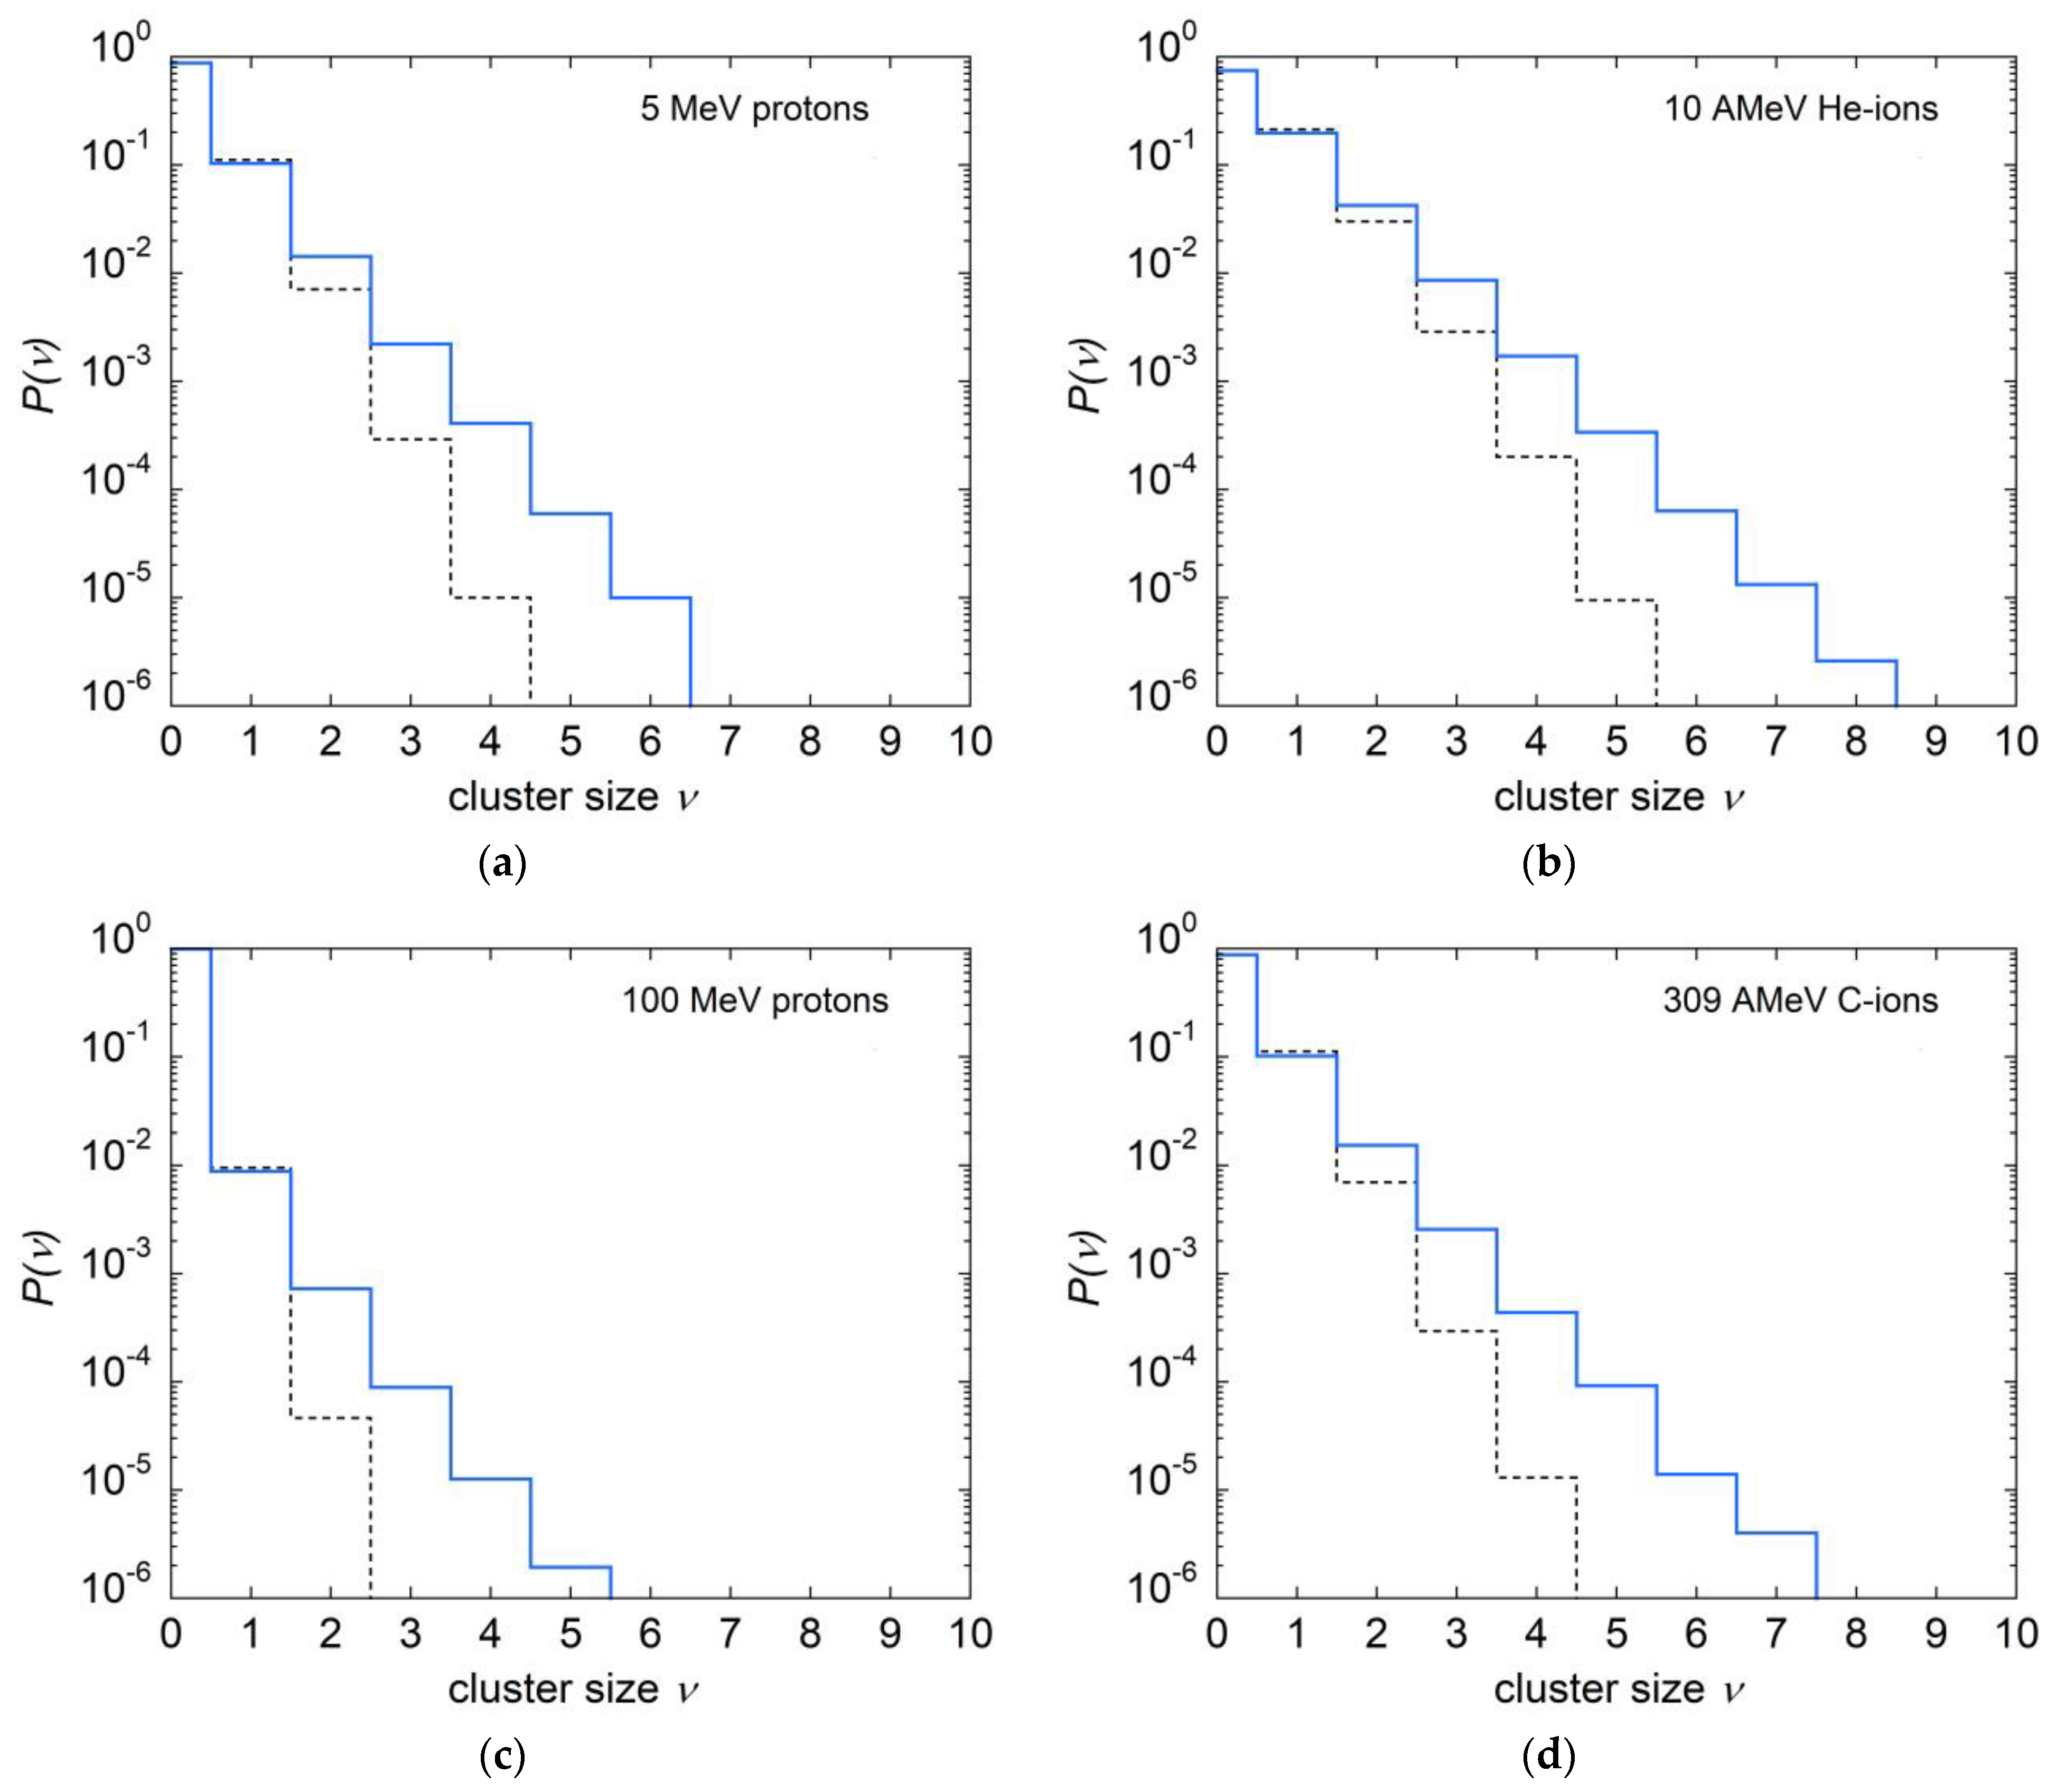
As defined in Equation (18), the reciprocal of represents the mean ionization yield per single primary ionization; thus, it is a measure of the additional contribution by the δ-electrons to the primary ionization. According to Table 1, the contribution of δ-electrons to the total average ionization yield amounts to about 10%, 17%, 27% and 33% of the total for site sizes of 1, 2, 5 and 10 nm, respectively. Figure 1 shows, in particular, that all values for protons, helium and carbon ions lie on a unique curve. The parameter is independent of particle type and velocity, which can be interpreted in the sense that, on average, each δ-electron contributes to the ionization cluster with an additional mean number of ionizations that is largely independent of particle type and velocity. To confirm this finding, Figure 7 shows the cluster size distributions in 1 nm site size, due to the total contribution by primary particles and δ-electrons, and that due to ionizations of the primary particle only, for different radiation qualities. The results for the mean cluster sizes and their ratios are given in Table 2. The values of the quotient found by direct simulation of ICSD for several radiation qualities are almost invariant with particle velocity and are in very good agreement with the value of the parameter , given in Table 1 for 1 nm site size. This implies that also depends negligibly on radiation quality.
Equation (19) implies that the probability that the single primary ionization results in a cluster of size ν = 1, , is also largely independent of particle type and velocity, but depends on site diameter D. Recursively, the same conclusion can be drawn for the probability .
In the works by Conte et al. [16,17], a good correlation was found between radiobiological cross sections at 5% survival and measured in a volume of 1 nm diameter, and between the cross sections at low doses, , and , measured in a volume of diameter 1.5 nm. The proportionality factors were slightly different in the two cases. These results were based on the assumption of a unique dependence of and on the mean cluster size , also independent of target size. Consistently, only the values were simulated for radiation qualities at which biological data were available, and then, values of and were assigned, based on experimental results obtained at larger target volumes, neglecting the dependence of the functions on target size. In this work, more accurate simulations of ionization cluster size distributions and derived cumulative distributions were performed at the different radiation qualities investigated. It was found out that the biological cross sections, and at least for V79 and HSG cells, depend on linear combinations of and calculated in a simulated spherical volume of 1 nm in diameter:
Note that the proportionality factor is the same for both cross sections and corresponds to their unique saturation value. It is a parameter that depends on the specific cell line and corresponds approximately to the nucleus size; it was found to be 50 μm2 for V79 cells and 75 μm2 for HSG cells.
In terms of , and , Equations (20) and (21) can be rewritten as:
Equations (23) and (24) express that the biological cross sections are strongly correlated with the probability of cluster sizes ν = 0, 1 and 2.
4. Materials and Methods
The Monte Carlo simulations of the cluster size distributions were performed with the so-called MC-Startrack model, developed by Grosswendt in 2002 to simulate the experimental response of the Startrack counter [9], and later upgraded in 2014 [14]. It is a homemade code, not freely distributed, capable of simulating the stochastic ionization yield in propane gas volumes, and it can also include the efficiency map of the Startrack counter. It has been validated against a great number of experimental data [17,18]. In this work, the simulations were performed in gaseous spherical volumes filled with propane gas at 300 Pa, for diameters of 0.15, 0.3, 0.75 and 1.5 mm, equivalent to diameters of 1, 2 5 and 10 nm in water [8]. The model assumes that in thin layers of gaseous propane elastic scattering, charge-changing effects and impact excitation processes of the primary particles can be neglected. According to this assumption, the cluster-size distributions caused by ionizing particles penetrating through a specified target volume are determined exclusively by the path lengths of the light ions between successive ionizing interactions, by the spectral and angular distributions of δ-electrons set in motion at the interaction points, and by the properties of electron degradation in the target medium. In the present work, the total and the differential ionization cross section for light ions was calculated by applying the model of Rudd et al. [18,26]. For details of the Monte Carlo model and its experimental validation, see References [9,10,18].
The target volume was immersed in a larger interaction volume at the same gas density, the size of which was determined to ensure that δ-electrons generated along the primary particle track but outside the sensitive volume can interact with it. A total number of histories was simulated varying between 105 for large mean ionization yields and 108 for small values of .
Calculations were performed on a Windows desktop PC, CPU type: Intel(R) Core(TM) i9-9900K CPU @ 3.60GHz, RAM 64 GB. The biological inactivation cross sections at survival level = l were calculated with the following equation, as described in [23]:
where is the particle fluence, sl is the slope of the cell-survival curve in semi-logarithmic scale at dose D = Dl. In the framework of the linear quadratic model for cell survival, sl is given by:
Inactivation cross sections σl were calculated at initial survival ( and from the final slope at l = 0.05, i.e., at 5% survival:
where is given in units of μm2 if LET is keV/μm, in Gy−1 and in Gy−2.
To study the correlation of radiobiological data to nanodosimetric quantities, Monte Carlo simulations were performed to calculate, for any specific particle type and energy (as reported in the PIDE database), the ionization cluster size distributions in simulated site sizes of 1, 2, 5 and 10 nm. The first moment was calculated afterward.
In this work, data for asynchronous V79 cells irradiated by monoenergetic protons, helium and carbon ions and for asynchronous HSG cells irradiated by monoenergetic helium and carbon ions were taken from the GSI-PIDE library [24].
5. Conclusions
Monte Carlo track-structure simulations were performed to simulate the ionization component of particle track structure for protons, helium and carbon ions at different energies, corresponding to different radiation qualities . Calculations were performed for spherical volumes filled with low-density propane gas to simulate water spheres of diameters = 1, 2, 5 and 10 nm, and for particles crossing the target volume with impact parameter set to zero. From the full probabilities of the number of ionizations ν, the mean ionization yield and the complementary cumulative probability , and , representing the probabilities of at least 1, at least 2 and at least 3 ionizations, were derived. It was highlighted that the functional dependency of on clearly depends on the size of the target volume. Parametrizations of , and on were found that depend only on D and not on particle type and velocity. A strong correlation was found between inactivation cross sections for V79 and HSG cells and linear combinations of and measured in a target volume of diameter = 1 nm. The unique proportionality factor depends only on cell line and corresponds to the saturation value of biological cross sections.
The nanodosimetric quantities measured for the particles that pass through the target volume at its center (impact parameter set to zero) clearly do not offer a complete description of the radiation interaction at the cellular and sub-cellular levels; similarly, not even the LET or the microdosimetric linear energy distributions do. The purpose of nanodosimetry, and of this work in particular, is to identify measurable physical quantities that characterize the radiation quality in relation to the induced biological damage. The complementary cumulative probabilities , and , measured in a volume of 1 nm in size for particles’ central passage, seem to be good candidates: they are correlated to inactivation biological cross sections better than LET, at least for V79 and HSG cells irradiated by broad beams of protons, He and C ions.
Author Contributions
Conceptualization, V.C.; methodology, V.C. and A.S; validation, V.C. and A.S.; formal analysis, V.C.; investigation, A.S.; resources, V.C.; data curation, V.C.; writing—original draft preparation, V.C.; writing—review and editing, V.C., A.B. and A.S.; supervision, V.C. All authors have read and agreed to the published version of the manuscript.
Funding
This research received no external funding.
Data Availability Statement
Nanodosimetric characteristics , , and calculated in a simulated spherical water site of diameter D = 1 nm for protons, helium and carbon ions at different velocities are available in Appendix A.
Conflicts of Interest
The authors declare no conflict of interest.
Appendix A

Table A1.
Nanodosimetric quantities for protons, helium and carbon ions in a sphere of D = 1 nm.
| Particle Type | Energy per Unit Mass/MeV | ||||
|---|---|---|---|---|---|
| Protons | 1.00 | 0.510 | 0.370 | 0.105 | 0.0268 |
| 2.00 | 0.297 | 0.237 | 0.0482 | 0.00943 | |
| 5.00 | 0.140 | 0.120 | 0.0169 | 0.00260 | |
| 10.00 | 0.0785 | 0.0693 | 0.00794 | 0.00111 | |
| 20.00 | 0.0435 | 0.0390 | 0.00388 | 0.000507 | |
| 30.00 | 0.0306 | 0.0276 | 0.00261 | 0.000342 | |
| 50.00 | 0.0196 | 0.0178 | 0.00160 | 0.000203 | |
| 100.00 | 0.0106 | 0.00970 | 0.000833 | 0.000104 | |
| 200.00 | 0.00575 | 0.00524 | 0.000441 | 5.50 × 10⁻⁵ | |
| He-ions | 1.00 | 1.972 | 0.834 | 0.562 | 0.315 |
| 2.00 | 1.184 | 0.659 | 0.323 | 0.132 | |
| 5.00 | 0.562 | 0.400 | 0.120 | 0.0317 | |
| 10.00 | 0.316 | 0.250 | 0.0530 | 0.0108 | |
| 15.00 | 0.224 | 0.184 | 0.0325 | 0.00587 | |
| 20.00 | 0.176 | 0.147 | 0.0237 | 0.00423 | |
| 25.70 | 0.140 | 0.120 | 0.0171 | 0.00268 | |
| 50.00 | 0.0788 | 0.0690 | 0.00840 | 0.00116 | |
| 100.00 | 0.0431 | 0.0384 | 0.00403 | 0.000548 | |
| 200.00 | 0.0231 | 0.0207 | 0.00205 | 0.000247 | |
| C-ions | 1.00 | 13.6 | 1.00 | 1.00 | 1.000 |
| 2.00 | 9.45 | 1.000 | 0.998 | 0.992 | |
| 3.00 | 7.27 | 0.998 | 0.990 | 0.964 | |
| 5.00 | 5.01 | 0.989 | 0.944 | 0.848 | |
| 8.33 | 3.34 | 0.950 | 0.816 | 0.620 | |
| 10.00 | 2.87 | 0.924 | 0.748 | 0.525 | |
| 11.00 | 2.66 | 0.909 | 0.709 | 0.479 | |
| 12.00 | 2.46 | 0.890 | 0.674 | 0.432 | |
| 12.50 | 2.38 | 0.881 | 0.655 | 0.416 | |
| 13.00 | 2.30 | 0.872 | 0.637 | 0.393 | |
| 14.00 | 2.17 | 0.858 | 0.606 | 0.365 | |
| 15.00 | 2.04 | 0.841 | 0.576 | 0.331 | |
| 20.00 | 1.59 | 0.762 | 0.453 | 0.224 | |
| 30.00 | 1.12 | 0.636 | 0.304 | 0.121 | |
| 40.00 | 0.875 | 0.545 | 0.221 | 0.0762 | |
| 50.00 | 0.720 | 0.477 | 0.170 | 0.0526 | |
| 60.00 | 0.613 | 0.424 | 0.137 | 0.0389 | |
| 70.00 | 0.535 | 0.382 | 0.113 | 0.0304 | |
| 80.00 | 0.476 | 0.348 | 0.0962 | 0.0241 | |
| 90.00 | 0.429 | 0.320 | 0.0830 | 0.0200 | |
| 100.00 | 0.391 | 0.296 | 0.0728 | 0.0168 | |
| 200.00 | 0.211 | 0.173 | 0.0310 | 0.00576 | |
| 309.00 | 0.143 | 0.121 | 0.0185 | 0.00310 |
Table A2.
Nanodosimetric quantities for protons, helium and carbon ions in a sphere of D = 2 nm.
| Particle Type | Energy per Unit Mass/MeV | ||||
|---|---|---|---|---|---|
| Protons | 1.00 | 1.12 | 0.605 | 0.295 | 0.130 |
| 2.00 | 0.648 | 0.419 | 0.150 | 0.0520 | |
| 5.00 | 0.305 | 0.227 | 0.0562 | 0.0153 | |
| 10.00 | 0.170 | 0.134 | 0.0270 | 0.00664 | |
| 20.00 | 0.0943 | 0.0767 | 0.0134 | 0.00313 | |
| 50.00 | 0.0426 | 0.0354 | 0.00551 | 0.00124 | |
| 100.00 | 0.0231 | 0.0194 | 0.00289 | 0.000646 | |
| 200.00 | 0.0125 | 0.0105 | 0.00152 | 0.000334 | |
| He-ions | 1.00 | 4.34 | 0.972 | 0.889 | 0.752 |
| 2.00 | 2.57 | 0.884 | 0.670 | 0.447 | |
| 5.00 | 1.23 | 0.641 | 0.329 | 0.151 | |
| 10.00 | 0.689 | 0.438 | 0.162 | 0.0579 | |
| 15.00 | 0.488 | 0.336 | 0.104 | 0.0327 | |
| 20.00 | 0.383 | 0.274 | 0.0763 | 0.0227 | |
| 50.00 | 0.173 | 0.134 | 0.0281 | 0.00718 | |
| 100.00 | 0.0935 | 0.0753 | 0.0137 | 0.00328 | |
| 200.00 | 0.0505 | 0.0414 | 0.00690 | 0.00163 | |
| C-ions | 1.00 | 30.0 | 1.00 | 1.00 | 1.00 |
| 2.00 | 20.9 | 1.00 | 1.00 | 1.00 | |
| 5.00 | 11.1 | 1.000 | 0.999 | 0.995 | |
| 10.00 | 6.32 | 0.994 | 0.970 | 0.913 | |
| 12.00 | 5.43 | 0.988 | 0.945 | 0.858 | |
| 12.50 | 5.24 | 0.986 | 0.937 | 0.841 | |
| 13.00 | 5.09 | 0.985 | 0.932 | 0.829 | |
| 14.00 | 4.76 | 0.980 | 0.914 | 0.798 | |
| 15.00 | 4.50 | 0.975 | 0.897 | 0.768 | |
| 16.70 | 4.11 | 0.966 | 0.869 | 0.719 | |
| 20.00 | 3.52 | 0.944 | 0.810 | 0.628 | |
| 50.00 | 1.59 | 0.728 | 0.432 | 0.227 | |
| 100.00 | 0.863 | 0.507 | 0.216 | 0.0864 | |
| 200.00 | 0.465 | 0.317 | 0.0998 | 0.0324 |
Table A3.
Nanodosimetric quantities for protons, helium and carbon ions in a sphere of D = 5 nm.
| Particle Type | Energy per Unit Mass/MeV | ||||
|---|---|---|---|---|---|
| Protons | 1.00 | 3.23 | 0.901 | 0.725 | 0.535 |
| 2.00 | 1.85 | 0.742 | 0.468 | 0.276 | |
| 5.00 | 0.866 | 0.474 | 0.207 | 0.0937 | |
| 10.00 | 0.483 | 0.302 | 0.103 | 0.0414 | |
| 20.00 | 0.267 | 0.180 | 0.0512 | 0.0193 | |
| 50.00 | 0.121 | 0.0859 | 0.0208 | 0.00758 | |
| 100.00 | 0.0655 | 0.0476 | 0.0108 | 0.00390 | |
| 200.00 | 0.0353 | 0.0260 | 0.00565 | 0.00203 | |
| He-ions | 1.00 | 12.5 | 1.000 | 0.999 | 0.996 |
| 2.00 | 7.40 | 0.995 | 0.977 | 0.933 | |
| 5.00 | 3.54 | 0.925 | 0.771 | 0.590 | |
| 10.00 | 1.98 | 0.763 | 0.497 | 0.301 | |
| 20.00 | 1.09 | 0.549 | 0.268 | 0.132 | |
| 50.00 | 0.493 | 0.302 | 0.106 | 0.0441 | |
| 100.00 | 0.269 | 0.178 | 0.0524 | 0.0204 | |
| 200.00 | 0.145 | 0.0998 | 0.0262 | 0.0100 | |
| C-ions | 1.00 | 87.8 | 1.00 | 1.00 | 1.00 |
| 2.00 | 61.0 | 1.00 | 1.00 | 1.00 | |
| 5.00 | 32.3 | 1.00 | 1.00 | 1.00 | |
| 10.00 | 18.5 | 1.00 | 1.00 | 1.000 | |
| 20.00 | 10.3 | 0.999 | 0.995 | 0.983 | |
| 40.00 | 5.64 | 0.981 | 0.923 | 0.826 | |
| 50.00 | 4.64 | 0.961 | 0.866 | 0.730 | |
| 100.00 | 2.52 | 0.828 | 0.600 | 0.403 | |
| 200.00 | 1.36 | 0.614 | 0.337 | 0.183 |
Table A4.
Nanodosimetric quantities for protons, helium and carbon ions in a sphere of D = 10 nm.
| Particle Type | Energy per Unit Mass/MeV | ||||
|---|---|---|---|---|---|
| Protons | 1.00 | 7.08 | 0.990 | 0.956 | 0.890 |
| 2.00 | 4.03 | 0.933 | 0.795 | 0.628 | |
| 5.00 | 1.87 | 0.722 | 0.447 | 0.265 | |
| 10.00 | 1.04 | 0.511 | 0.241 | 0.120 | |
| 20.00 | 0.578 | 0.327 | 0.121 | 0.0545 | |
| 50.00 | 0.261 | 0.164 | 0.0482 | 0.0205 | |
| 100.00 | 0.141 | 0.0925 | 0.0245 | 0.0103 | |
| 200.00 | 0.0763 | 0.0510 | 0.0126 | 0.00527 | |
| He-ions | 1.00 | 27.4 | 1.00 | 1.00 | 1.00 |
| 2.00 | 16.1 | 1.00 | 1.00 | 0.999 | |
| 5.00 | 7.69 | 0.994 | 0.971 | 0.922 | |
| 10.00 | 4.30 | 0.943 | 0.819 | 0.663 | |
| 20.00 | 2.38 | 0.796 | 0.549 | 0.357 | |
| 50.00 | 1.08 | 0.511 | 0.246 | 0.127 | |
| 100.00 | 0.583 | 0.322 | 0.122 | 0.0569 | |
| 200.00 | 0.315 | 0.189 | 0.0603 | 0.0268 | |
| C-ions | 1.00 | 194 | 1.00 | 1.00 | 1.00 |
| 2.00 | 135 | 1.00 | 1.00 | 1.00 | |
| 5.00 | 71.3 | 1.00 | 1.00 | 1.00 | |
| 10.00 | 40.8 | 1.00 | 1.00 | 1.00 | |
| 20.00 | 22.7 | 1.00 | 1.00 | 1.000 | |
| 50.00 | 10.2 | 0.998 | 0.991 | 0.972 | |
| 100.00 | 5.56 | 0.970 | 0.893 | 0.779 | |
| 200.00 | 3.00 | 0.849 | 0.641 | 0.455 |
References
- Ward, J.F. DNA damage produced by ionizing radiation in mammalian cells: Identities, mechanisms of formation, and reparability. Prog. Nucleic Acid Res. Mol. Biol. 1988, 35, 95–125. [Google Scholar] [CrossRef]
- Goodhead, D.T. The initial physical damage produced by ionizing radiations. Int. J. Radiat. Biol. 1989, 56, 623–634. [Google Scholar] [CrossRef]
- Goodhead, D.T. Initial events in the cellular effects of ionizing radiations: Clustered damage in DNA. Int. J. Radiat. Biol. 1994, 65, 7–17. [Google Scholar] [CrossRef]
- Nikjoo, H.; Uehara, S.; Emfietzoglou, D.; Cucinotta, F.A. Track-structure codes in radiation research. Radiat. Meas. 2006, 41, 1052–1074. [Google Scholar] [CrossRef]
- Amols, H.I.; Wuu, C.S.; Zaider, M. On Possible Limitations of Experimental Nanodosimetry. Radiat. Prot. Dosim. 1990, 31, 125–128. [Google Scholar] [CrossRef]
- Selva, A.; Bolst, D.; Guatelli, S.; Conte, V. Energy imparted and ionization yield in nanometre-sized volumes. Radiat. Phys. Chem. 2022, 192, 109910. [Google Scholar] [CrossRef]
- Taioli, S.; Trevisanutto, P.E.; de Vera, P.; Simonucci, S.; Abril, I.; García-Molina, R.; Dapor, M. Relative Role of Physical Mechanisms on Complex Biodamage Induced by Carbon Irradiation. J. Phys. Chem. Lett. 2020, 12, 487–493. [Google Scholar] [CrossRef]
- Grosswendt, B. Formation of ionization clusters in nanometric structures of propane-based tissue-equivalent gas or liquid water by electrons and α-particles. Radiat. Environ. Biophys. 2002, 41, 103–112. [Google Scholar] [CrossRef] [PubMed]
- De Nardo, L.; Colautti, P.; Conte, V.; Baek, W.Y.; Grosswendt, B.; Tornielli, G. Ionization-cluster distributions of a-particles in nanometric volumes of propane: Measurement and calculation. Radiat. Environ. Biophys. 2002, 41, 235–256. [Google Scholar] [CrossRef]
- Conte, V.; Colautti, P.; Grosswendt, B.; Moro, D.; De Nardo, L. Track structure of light ions: Experiment and simulations. New. J. Phys. 2012, 14, 093010. [Google Scholar] [CrossRef]
- Conte, V.; Colautti, P.; Moro, D.; Grosswendt, B. Track structure of carbon ions: Measurements and simulations. Radiat. Prot. Dosim. 2014, 161, 445–448. [Google Scholar] [CrossRef] [PubMed]
- Bantsar, A.; Pietrzak, M.; Jaskóła, M.; Korman, A.; Pszona, S.; Szefliński, Z. Status report: Nanodosimetry of carbon ion beam at HIL. Rep. Pract. Oncol. Radiother. 2014, 19, S42–S46. [Google Scholar] [CrossRef] [Green Version]
- Bantsar, A.; Hilgers, G.; Pszona, S.; Rabus, H.; Szeflinski, Z. Experimental investigation of ionisation track structure of carbon ions at HIL Warsaw. Radiat. Prot. Dosim. 2015, 166, 253–256. [Google Scholar] [CrossRef]
- Bantsar, A.; Hilgers, G.; Pszona, S.; Rabus, H.; Szeflinski, Z. Nanodosimetric characterization of ion beams. Eur. Phys. J. D 2014, 68, 217. [Google Scholar] [CrossRef]
- Hilgers, G.; Bug, M.U.; Rabus, H. Measurement of track structure parameters of low and medium energy helium and carbon ions in nanometric volumes. Phys. Med. Biol. 2017, 62, 7569–7597. [Google Scholar] [CrossRef] [Green Version]
- Conte, V.; Selva, A.; Colautti, P.; Hilgers, G.; Rabus, H. Track structure characterization and its link to radiobiology. Radiat. Meas. 2017, 106, 506–511. [Google Scholar] [CrossRef]
- Conte, V.; Selva, A.; Colautti, P.; Hilgers, G.; Rabus, H.; Bantsar, A.; Pietrzak, M.; Pszona, S. Nanodosimetry: Towards a New Concept of Radiation Quality. Radiat. Prot. Dosim. 2018, 180, 150–156. [Google Scholar] [CrossRef] [PubMed]
- Grosswendt, B.; Conte, V.; Colautti, P. An upgraded track structure model: Experimental validation. Radiat. Prot. Dosim. 2014, 161, 464–468. [Google Scholar] [CrossRef] [PubMed]
- Grosswendt, B. Recent advances of nanodosimetry. Radiat. Prot. Dosim. 2004, 110, 789–799. [Google Scholar] [CrossRef]
- Alexander, F.; Villagrasa, C.; Rabus, H.; Wilkens, J.J. Local weighting of nanometric track structure properties in macroscopic voxel geometries for particle beam treatment planning. Phys. Med. Biol. 2015, 60, 9145–9156. [Google Scholar] [CrossRef]
- Ramos-Méndez, J.; Burigo, L.N.; Schulte, R.; Chuang, C.; Faddegon, B. Fast calculation of nanodosimetric quantities in treatment planning of proton and ion therapy. Phys. Med. Biol. 2018, 63, 235015. [Google Scholar] [CrossRef]
- Dai, T.; Li, Q.; Liu, X.; Dai, Z.; He, P.; Ma, Y.; Shen, G.; Chen, W.; Zhang, H.; Meng, Q.; et al. Nanodosimetric quantities and RBE of a clinically relevant carbon-ion beam. Med. Phys. 2020, 47, 772–780. [Google Scholar] [CrossRef] [PubMed]
- Belloni, F.; Bettega, D.; Calzolari, P.; Cherubini, R.; Massariello, P.; Tallone, L. Inactivation Cross Sections for Mammalian Cells Exposed to Charged Particles: A Phenomenological Approach. Radiat. Prot. Dosim. 2002, 99, 199–202. [Google Scholar] [CrossRef]
- Friedrich, T.; Scholz, U.; Elsässer, T.; Durante, M.; Scholz, M. Systematic analysis of RBE and related quantities using a database of cell survival experiments with ion beam irradiation. J. Radiat. Res. 2013, 54, 494–514. [Google Scholar] [CrossRef] [PubMed] [Green Version]
- Monini, C.; Cunha, M.; Testa, E.; Beuve, M. Study of the Influence of NanOx Parameters. Cancers 2018, 10, 87. [Google Scholar] [CrossRef] [PubMed] [Green Version]
- Rudd, M.E.; Kim, Y.-K.; Madison, D.H.; Gay, T.J. Electron production in proton collisions with atoms and molecules: Energy distributions. Rev. Mod. Phys. 1992, 64, 441–490. [Google Scholar] [CrossRef] [Green Version]
Figure 1.
The cumulative probabilities , for k = 1, 2, 3, plotted as a function of the mean cluster size , for different site sizes. Simulations performed for protons, helium and carbon ions (see legend) at different kinetic energies. Lines are the best fit according to Equations (3)–(5).
Figure 1.
The cumulative probabilities , for k = 1, 2, 3, plotted as a function of the mean cluster size , for different site sizes. Simulations performed for protons, helium and carbon ions (see legend) at different kinetic energies. Lines are the best fit according to Equations (3)–(5).

Figure 2.
The cumulative probabilities calculated at different site sizes and compared with the corresponding values deriving from a pure Poisson distribution for the probability of cluster size ν. (a) The functional dependency of . (b) The functional dependency of . (c) The functional dependency of .

Figure 3.
(a): The cumulative probabilities , calculated in target volumes with D = 1 nm and D = 2 nm, are plotted versus the ratio . (b) The biological inactivation cross sections at 5% survival level for V79 cells irradiated by protons, helium and carbon ions [17], plotted versus the ratio . See text for more details.

Figure 4.
Biological inactivation cross sections at 5% survival, , for asynchronous V79 cells irradiated by carbon ions as a function of the cumulative probabilities calculated in simulated target volumes of diameters 0.5 (green), 1 (blue) or 2 nm (red). Symbols represent biological cross sections derived from data available in literature [24]. Lines are the linear through zero fits of biological data.

Figure 5.
(a) Biological inactivation cross sections at 5% survival, , for asynchronous V 79 cells irradiated by protons (diamonds), helium (squares) and carbon ions (circles) as a function of the cumulative probabilities in target volumes of diameter 1 nm. The bottom panel shows the relative residuals with respect to the function . (b) Biological inactivation cross sections at high survival, , for asynchronous V79 cells irradiated by protons, helium and carbon ions as a function of the cumulative probabilities in a target volume of diameter 1 nm. The bottom panels (a,b) show the relative residuals of and with respect to the functions and , respectively.

Figure 6.
(a) Biological inactivation cross sections for asynchronous HSG cells irradiated by helium (empty squares) and carbon ions (filled circles) as a function of the cumulative probabilities in a target volume of diameter D = 1 nm. (b) Biological inactivation cross sections at high survival, , for asynchronous HSG cells irradiated by helium (empty squares) and carbon ions (filled circles) as a function of the cumulative probabilities in a simulated target volume of diameter D = 1 nm.

Figure 7.
Total ionization cluster size distributions (blue lines) and distributions of the number of ionizations due to direct interaction of the primary particles (dashed lines) for (a): 5 MeV protons, (b): 10 AMeV He-ions, (c): 100 MeV protons and (d): 309 AMeV carbon ions.
Figure 7.
Total ionization cluster size distributions (blue lines) and distributions of the number of ionizations due to direct interaction of the primary particles (dashed lines) for (a): 5 MeV protons, (b): 10 AMeV He-ions, (c): 100 MeV protons and (d): 309 AMeV carbon ions.

Table 1.
The parameters of the fitting functions given in Equations (3)–(5) for the different site sizes.
Table 1.
The parameters of the fitting functions given in Equations (3)–(5) for the different site sizes.
| Diameter D * | |||
|---|---|---|---|
| 1 nm | 0.907 | 0.831 | 0.898 |
| 2 nm | 0.831 | 0.705 | 0.804 |
| 5 nm | 0.735 | 0.579 | 0.678 |
| 10 nm | 0.670 | 0.520 | 0.612 |
* The target volume diameter is given in terms of the equivalent water sphere.
Table 2.
Total mean ionization yield , mean number of ionizations due to primary interactions only, and ratio for several radiation qualities in a target volume of 1 nm.
Table 2.
Total mean ionization yield , mean number of ionizations due to primary interactions only, and ratio for several radiation qualities in a target volume of 1 nm.
| Q | |||
|---|---|---|---|
| 1H 5 AMeV | 0.14090 | 0.12670 | 0.899 |
| 4He 10 AMeV | 0.31640 | 0.28300 | 0.894 |
| He 25.7 AMeV | 0.14030 | 0.12640 | 0.901 |
| 1H 50 AMeV | 0.01963 | 0.01769 | 0.901 |
| 1H 100 AMeV | 0.01065 | 0.00961 | 0.902 |
| 12C 309 AMeV | 0.14291 | 0.12692 | 0.888 |
Disclaimer/Publisher’s Note: The statements, opinions and data contained in all publications are solely those of the individual author(s) and contributor(s) and not of MDPI and/or the editor(s). MDPI and/or the editor(s) disclaim responsibility for any injury to people or property resulting from any ideas, methods, instructions or products referred to in the content. |
© 2023 by the authors. Licensee MDPI, Basel, Switzerland. This article is an open access article distributed under the terms and conditions of the Creative Commons Attribution (CC BY) license (https://creativecommons.org/licenses/by/4.0/).
Share and Cite
MDPI and ACS Style
Conte, V.; Bianchi, A.; Selva, A. Track Structure of Light Ions: The Link to Radiobiology. Int. J. Mol. Sci. 2023, 24, 5826. https://0-doi-org.brum.beds.ac.uk/10.3390/ijms24065826
AMA Style
Conte V, Bianchi A, Selva A. Track Structure of Light Ions: The Link to Radiobiology. International Journal of Molecular Sciences. 2023; 24(6):5826. https://0-doi-org.brum.beds.ac.uk/10.3390/ijms24065826
Chicago/Turabian StyleConte, Valeria, Anna Bianchi, and Anna Selva. 2023. "Track Structure of Light Ions: The Link to Radiobiology" International Journal of Molecular Sciences 24, no. 6: 5826. https://0-doi-org.brum.beds.ac.uk/10.3390/ijms24065826
Note that from the first issue of 2016, this journal uses article numbers instead of page numbers. See further details here.