
Cooperativity of ESPT and Aggregation-Induced Emission Effects—An Experimental and Theoretical Analysis of a 1,3,4-Thiadiazole Derivative
 , , , , , , ,
  , , and
Abstract
:1. Introduction
2. Results and Discussion
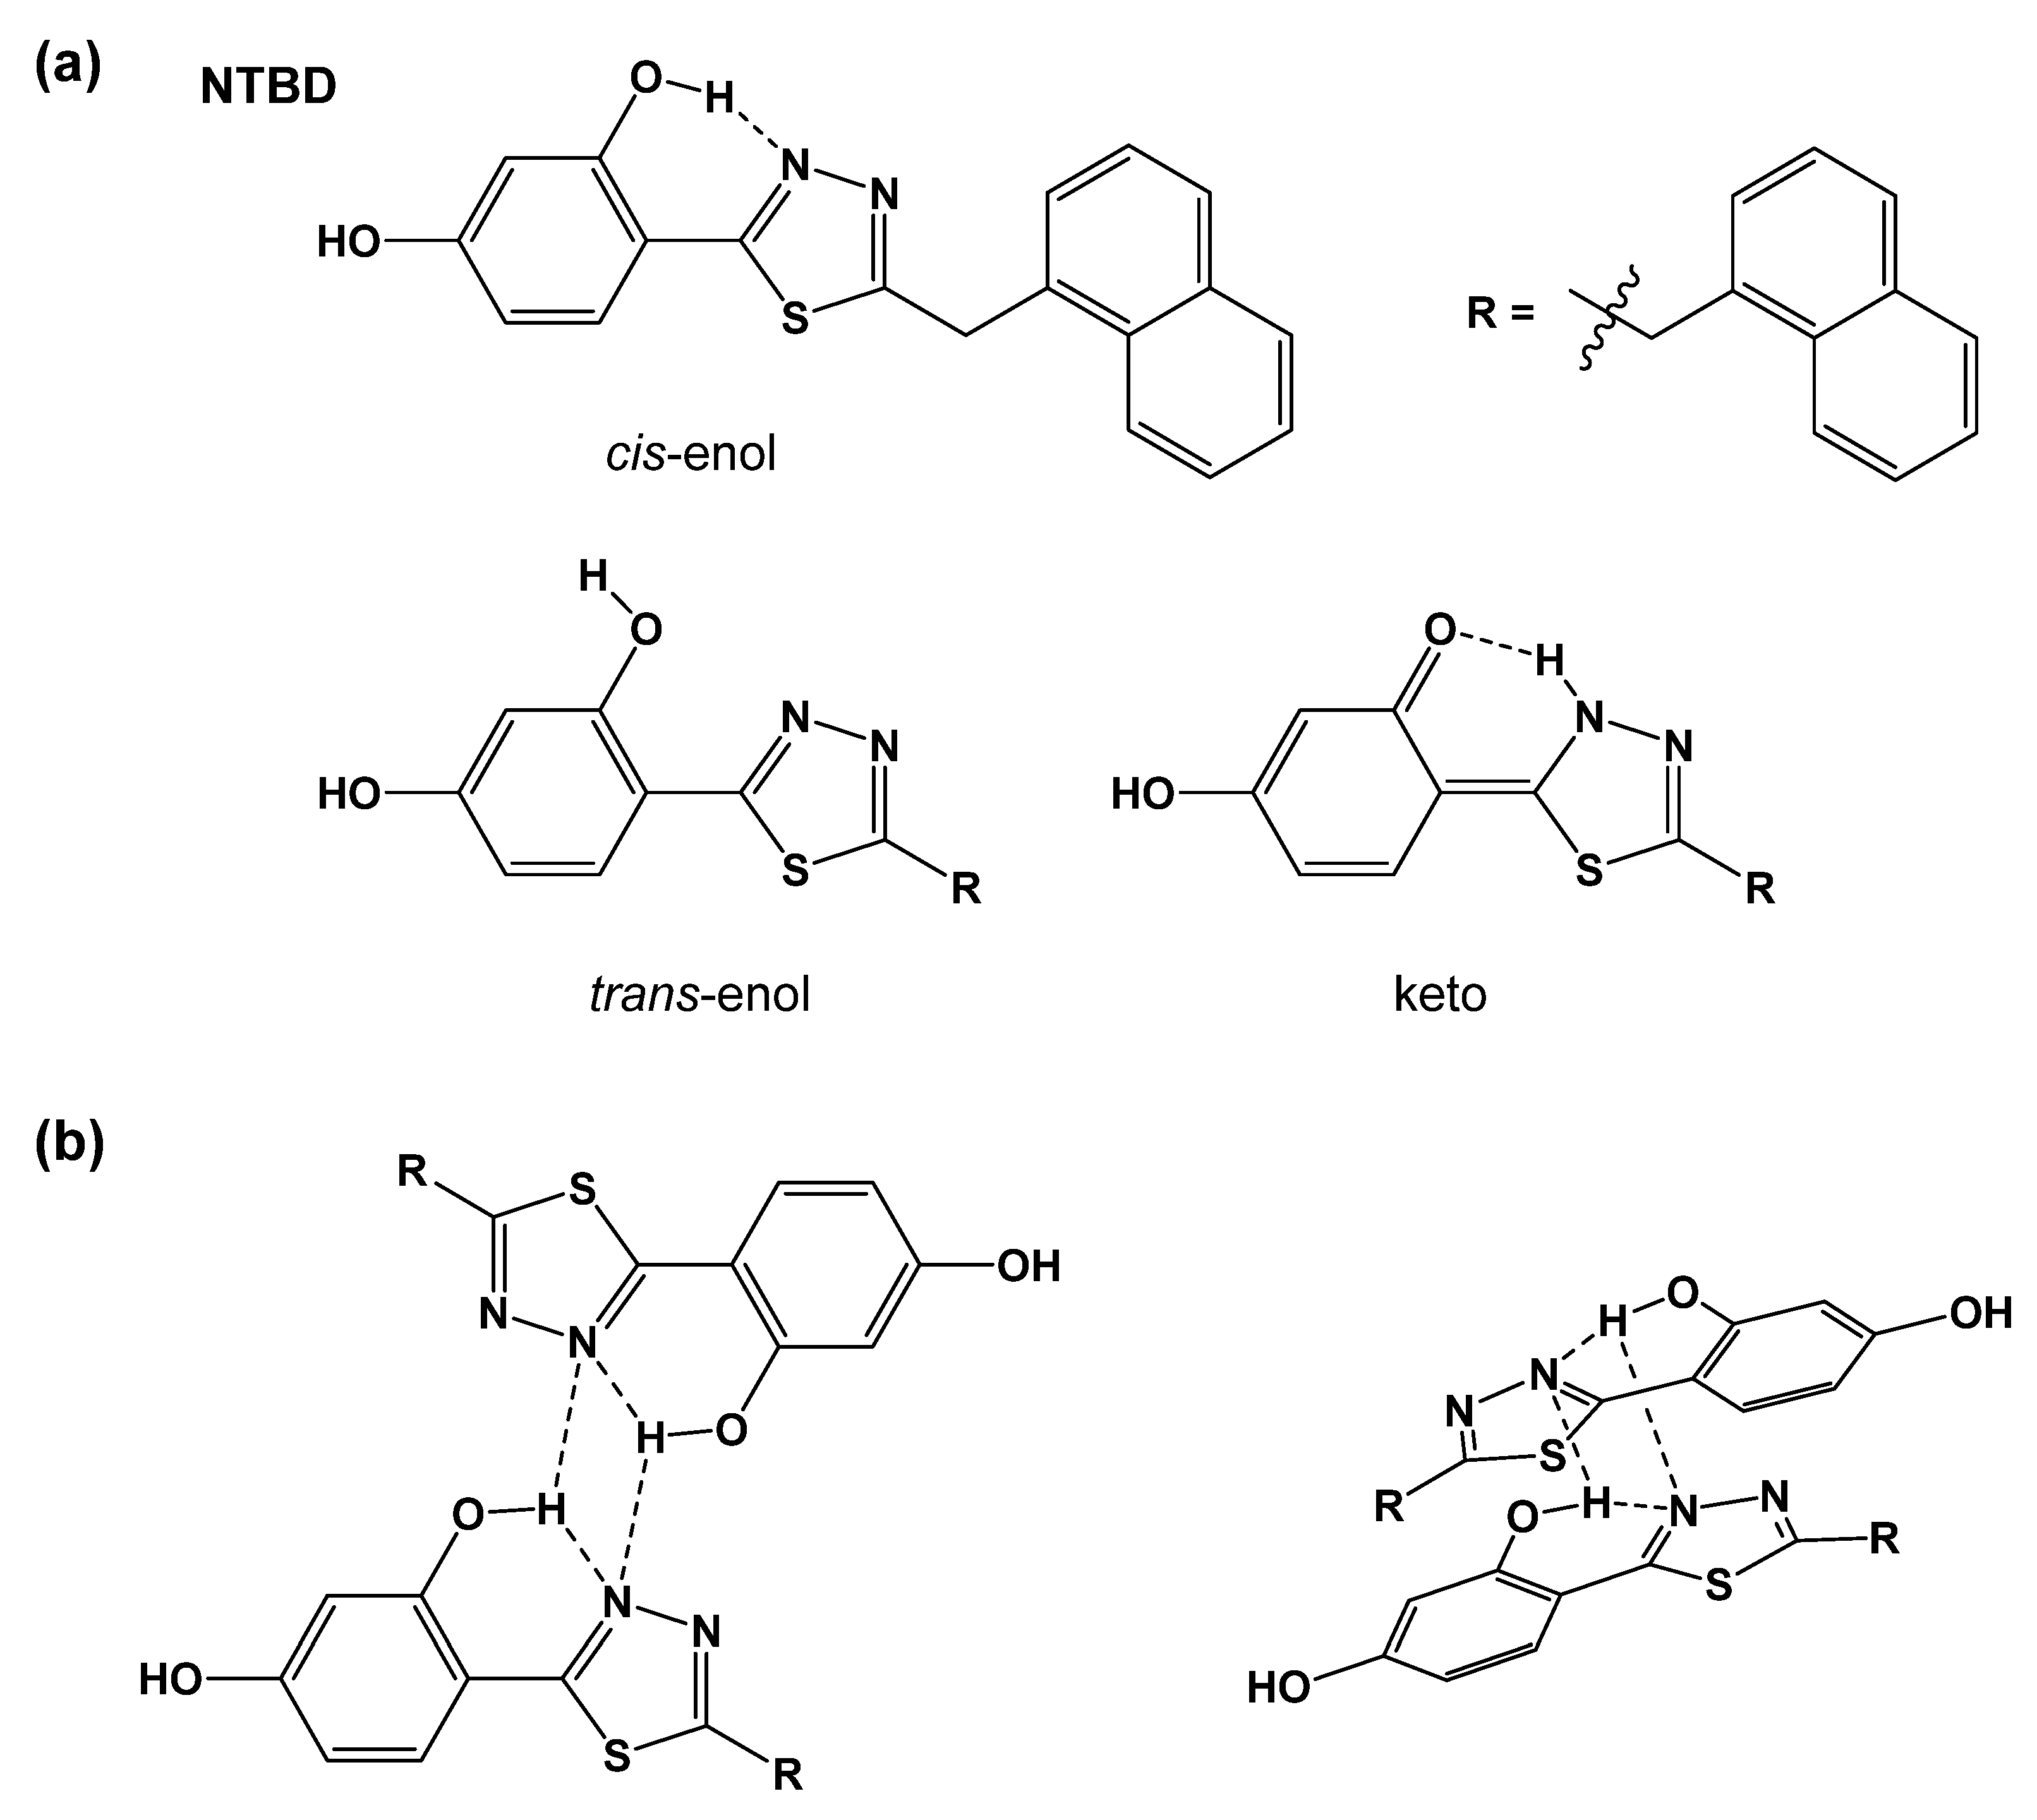
2.1. Structural Preferences Analysis
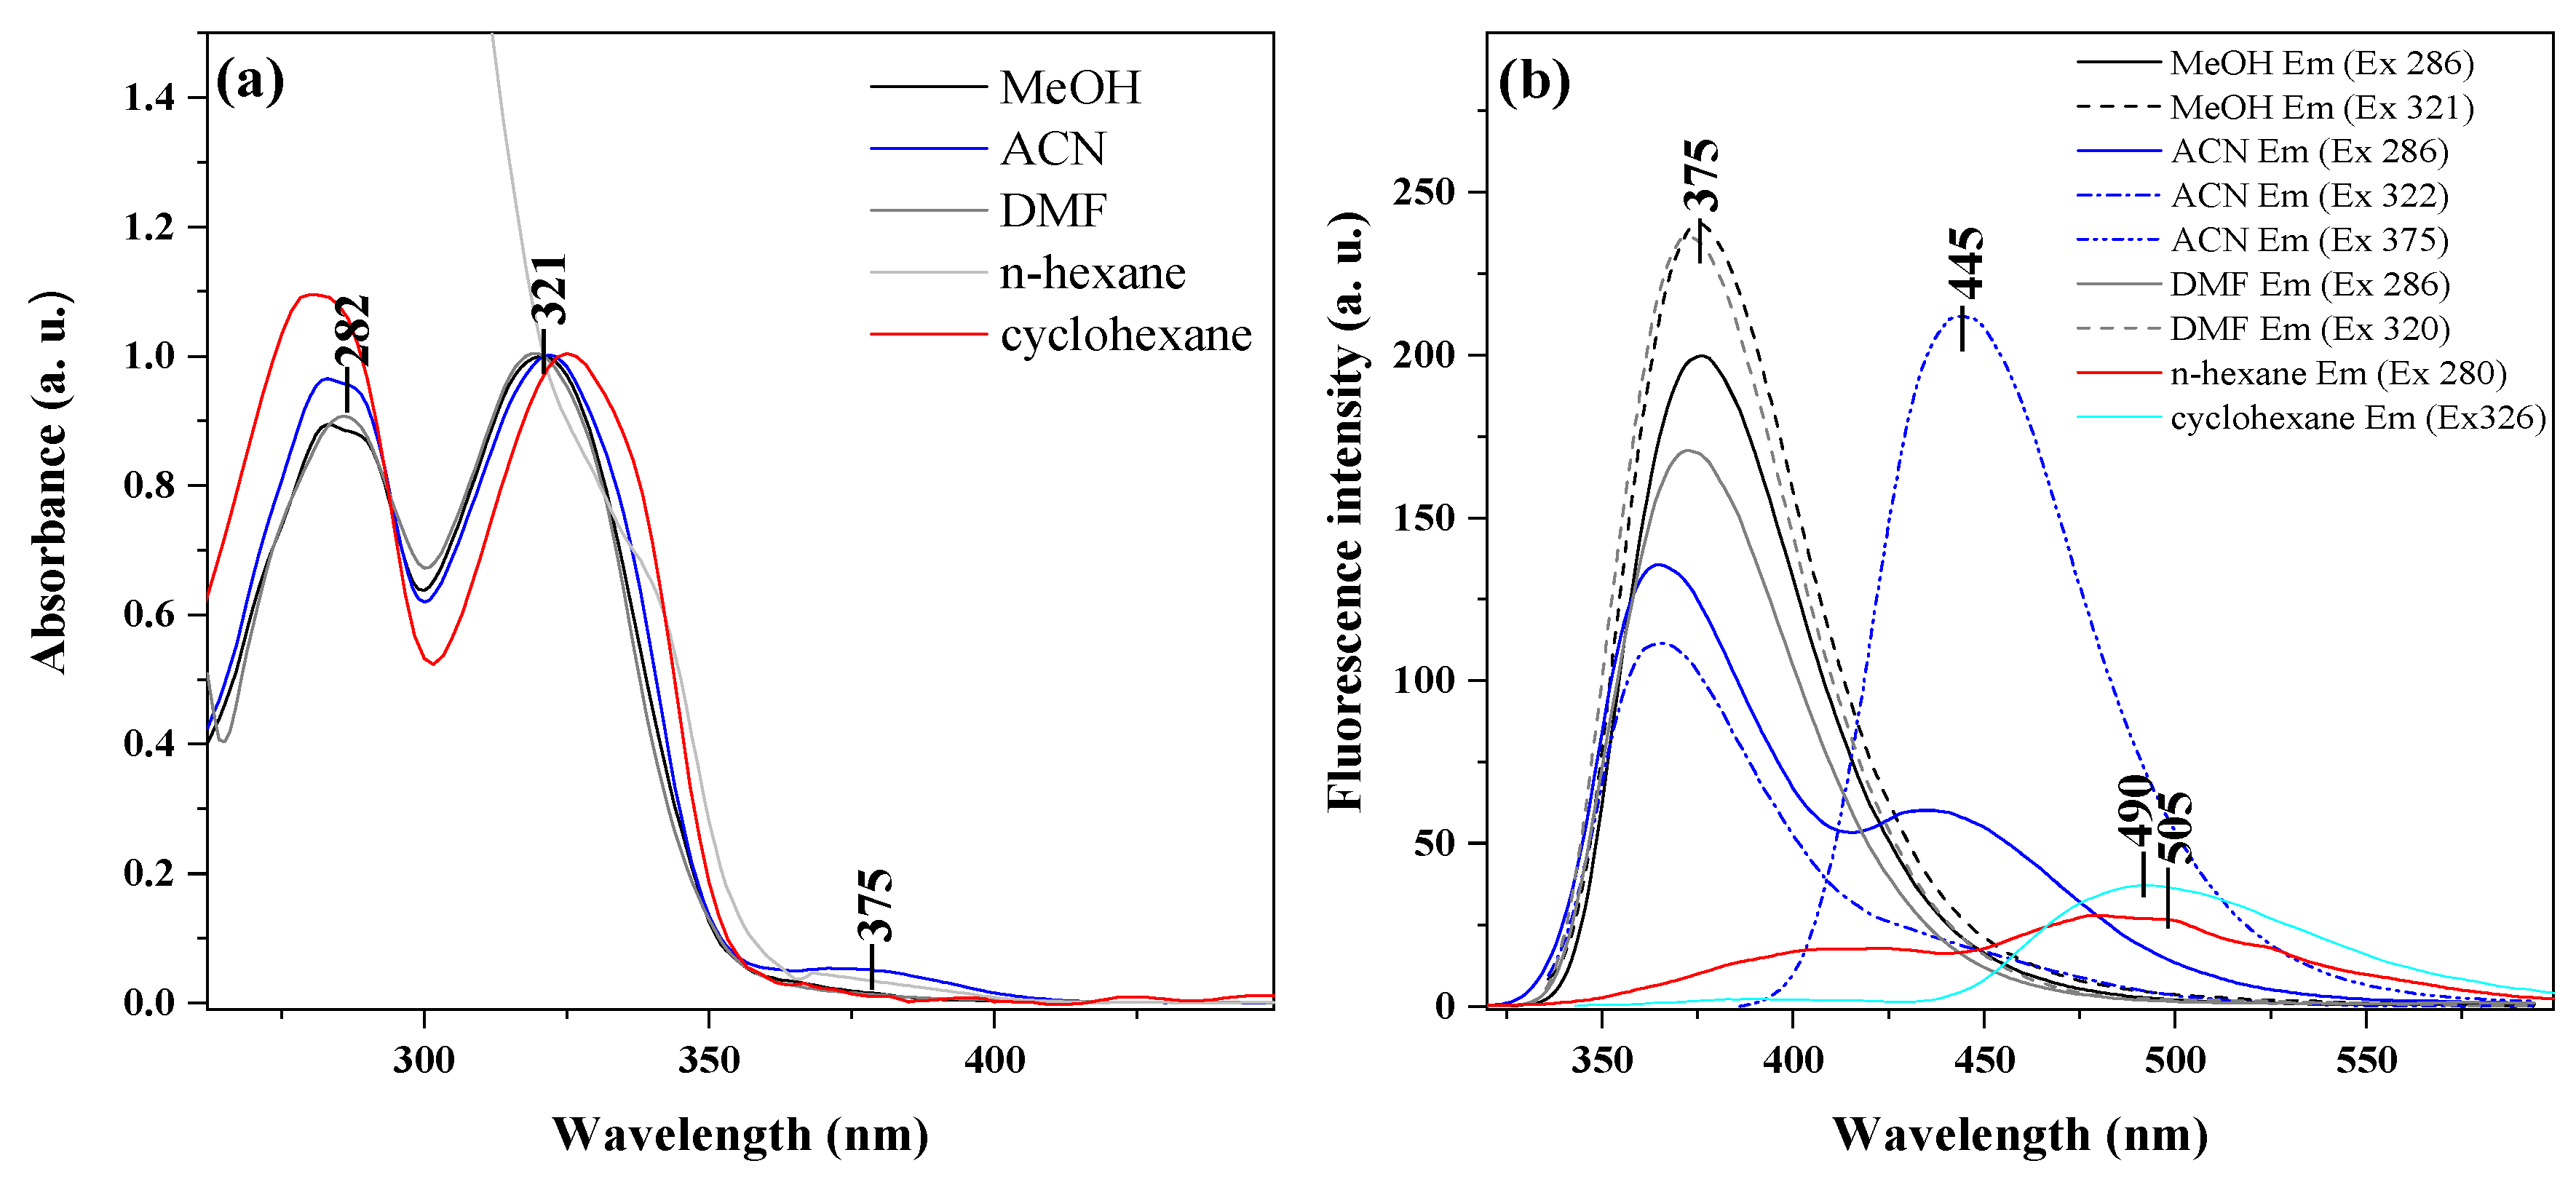
2.2. Studies of Electronic Absorption in Pure Solvents
2.3. Fluorescence Emission and Resonance Light Scattering Measurements in Pure Solvents
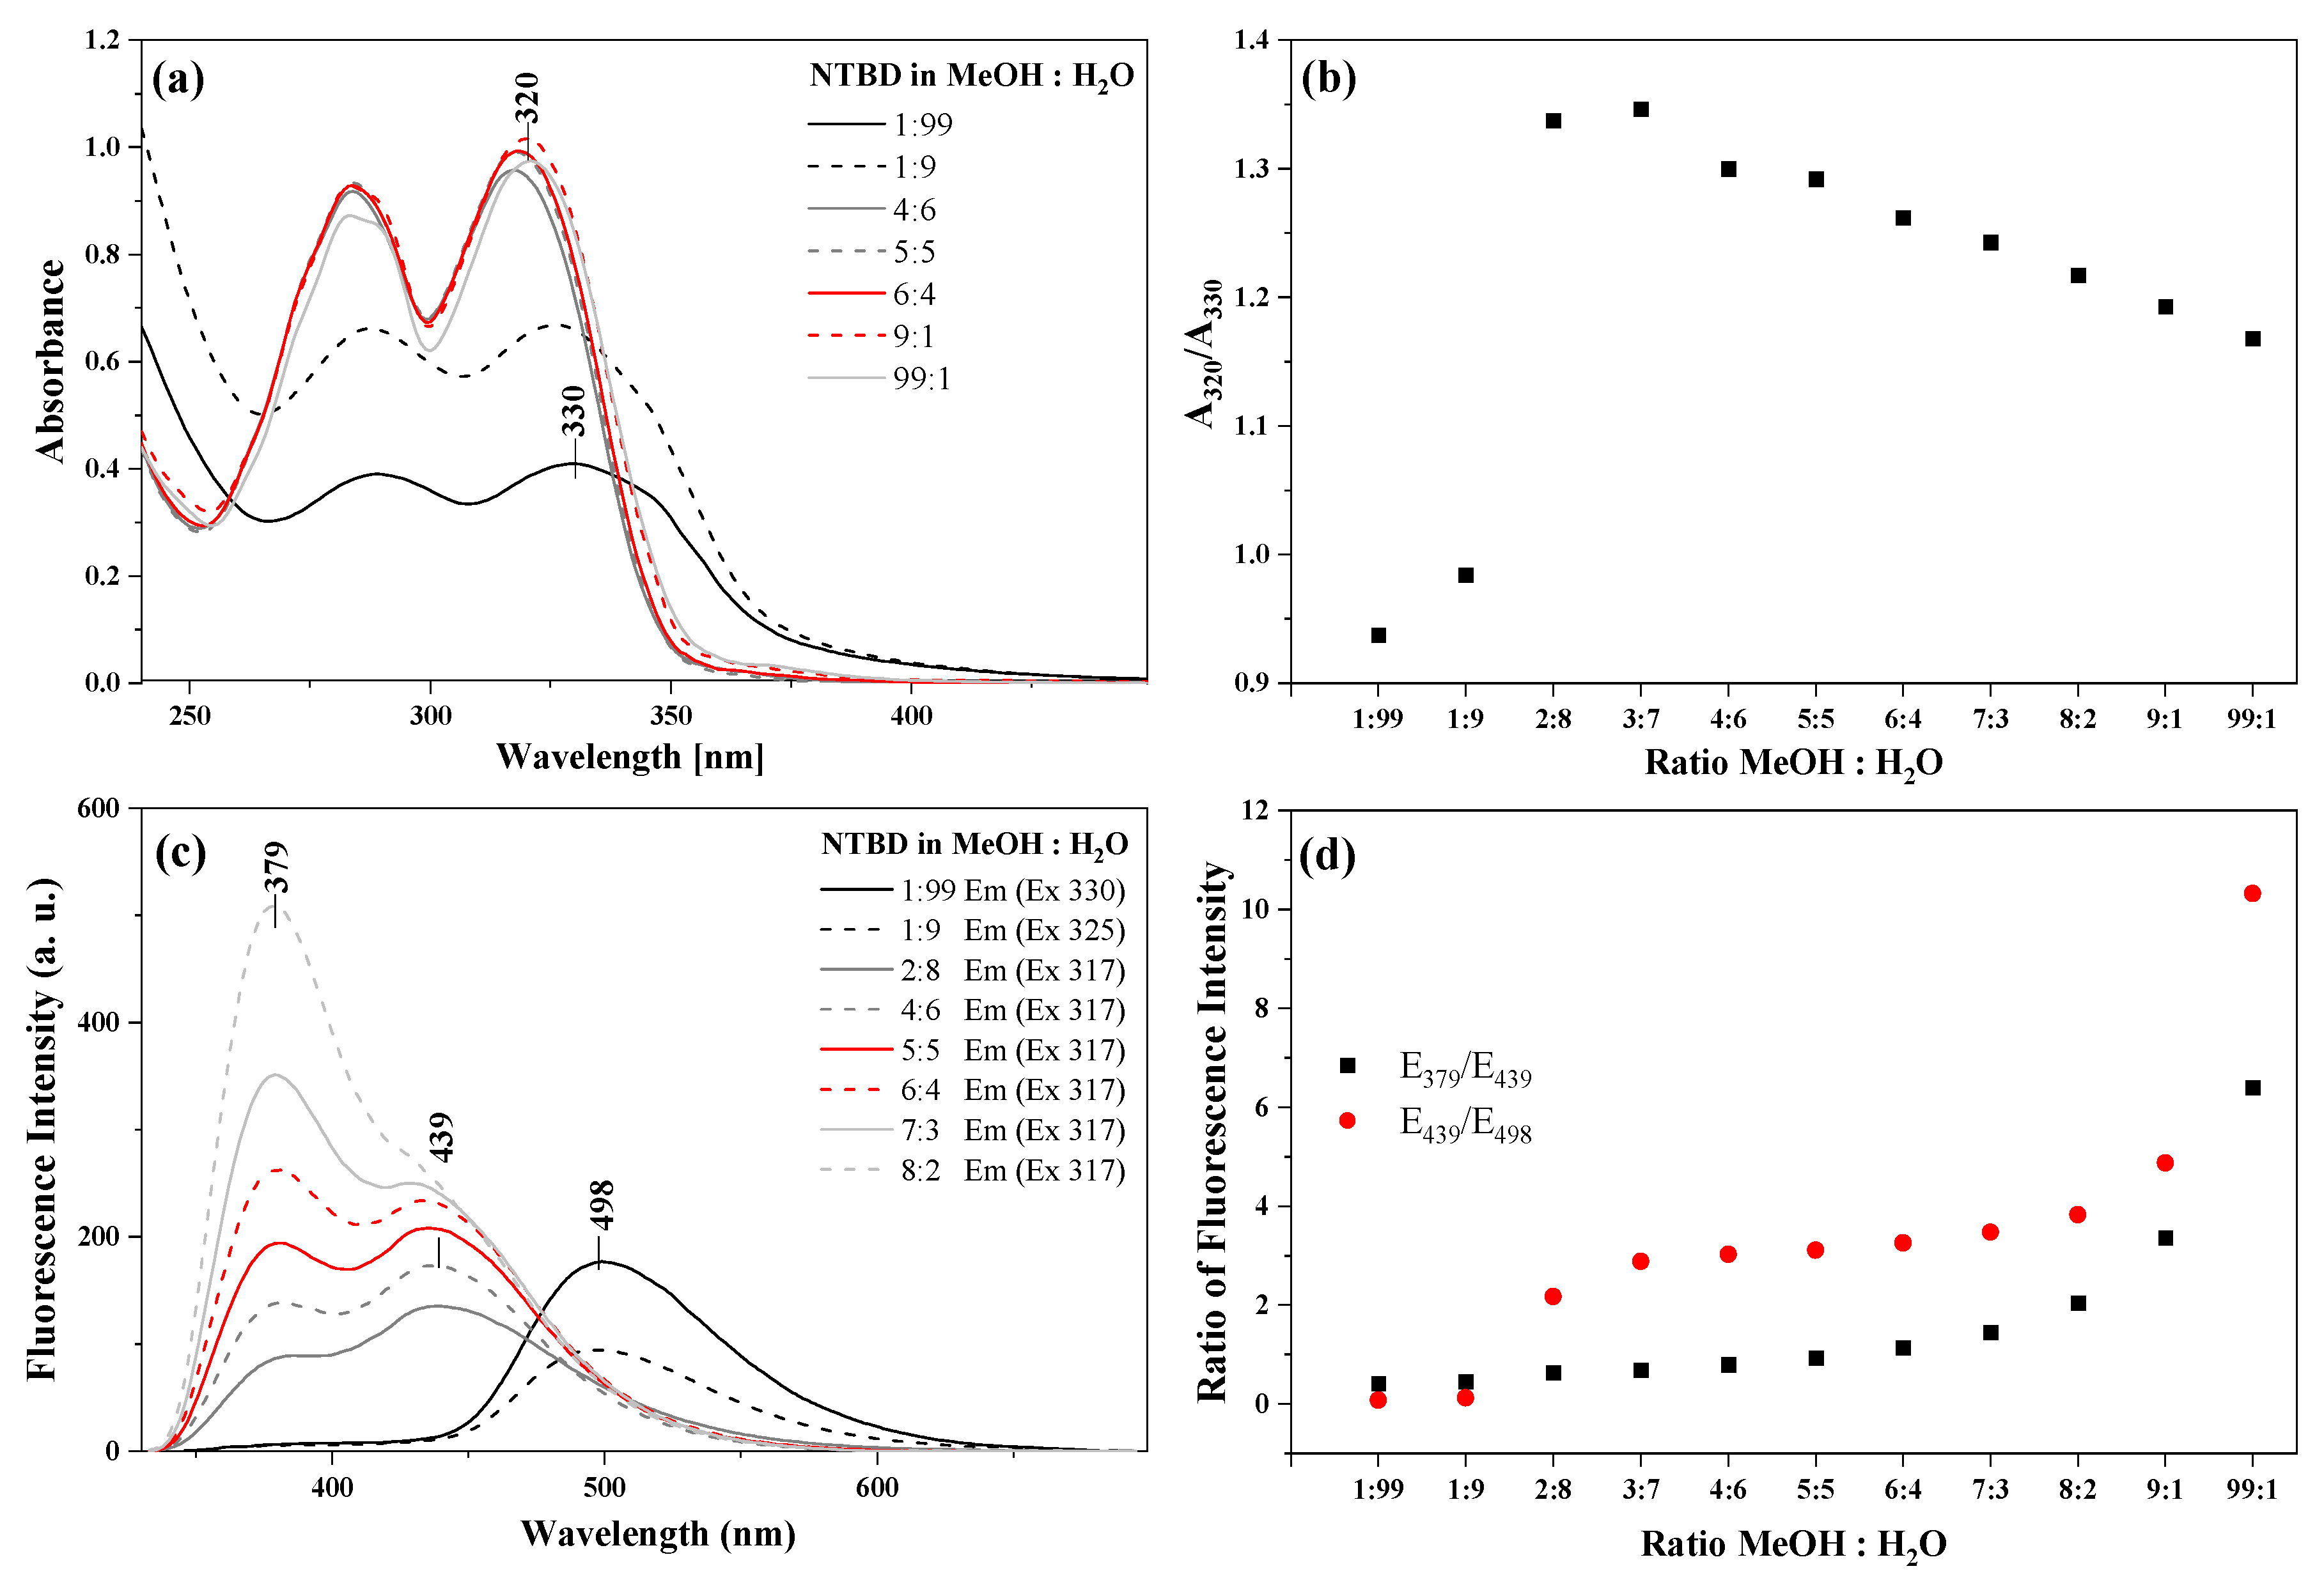
2.4. Experimental Studies of Photophysical Features in Methanol/Water Solutions
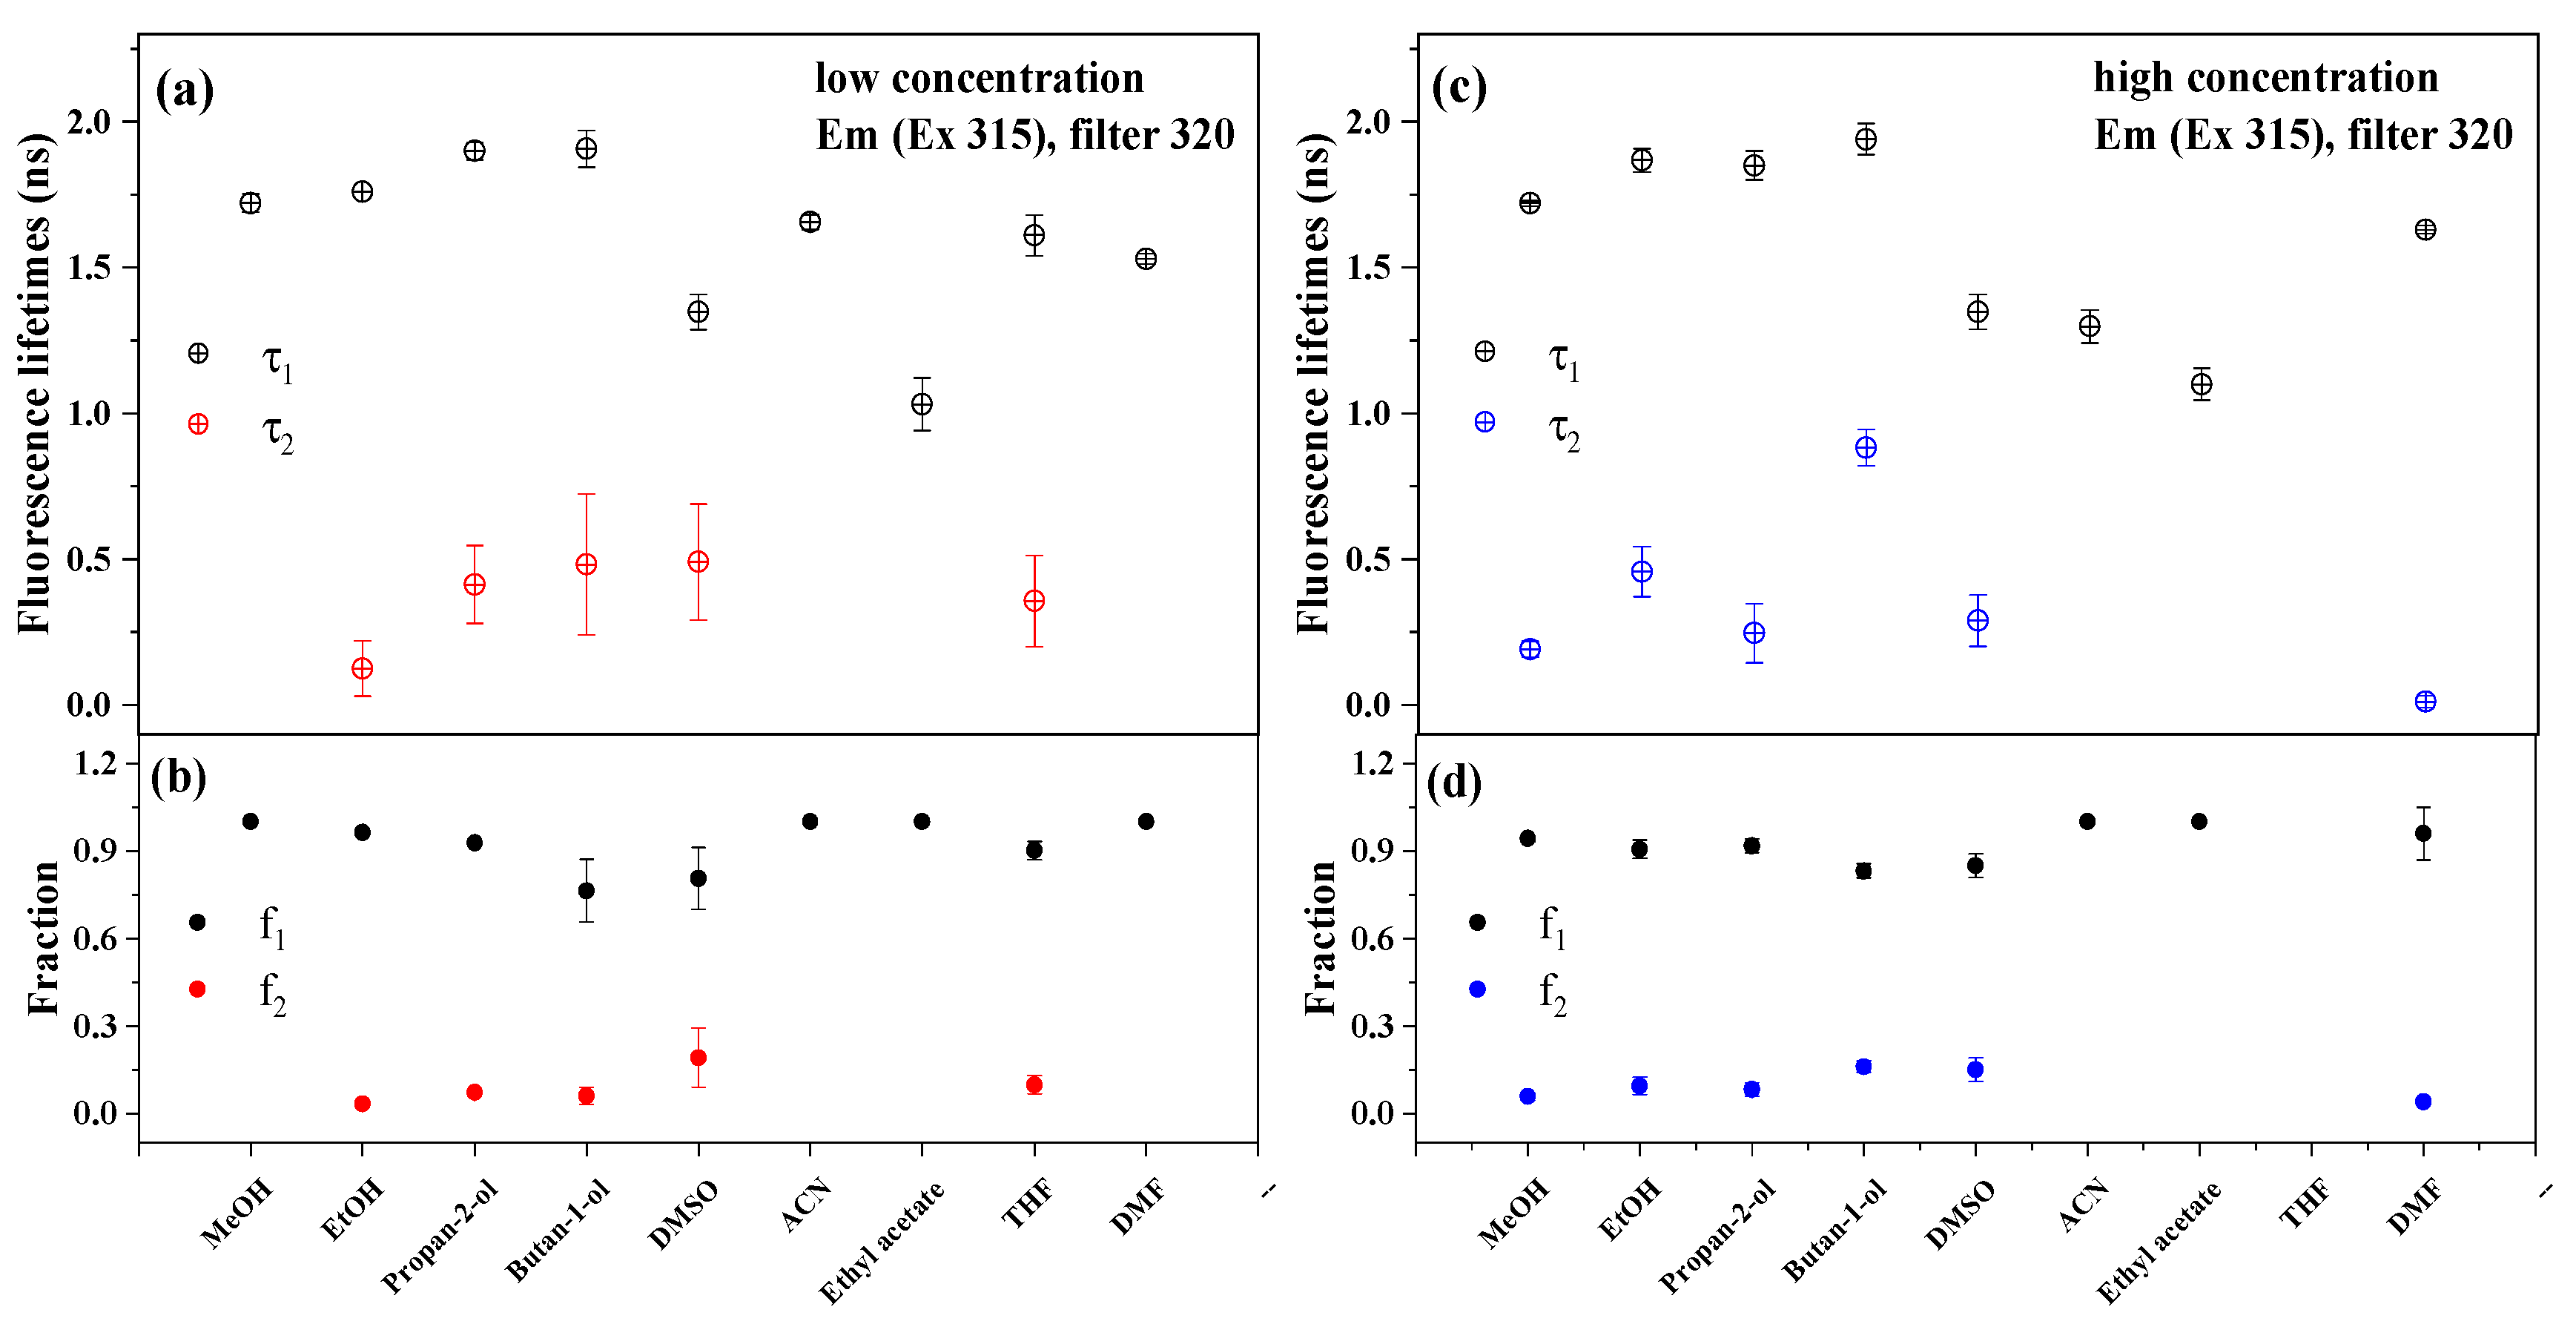
2.5. Time-Resolved Fluorescence Spectroscopy Studies in Pure and Mixed Systems
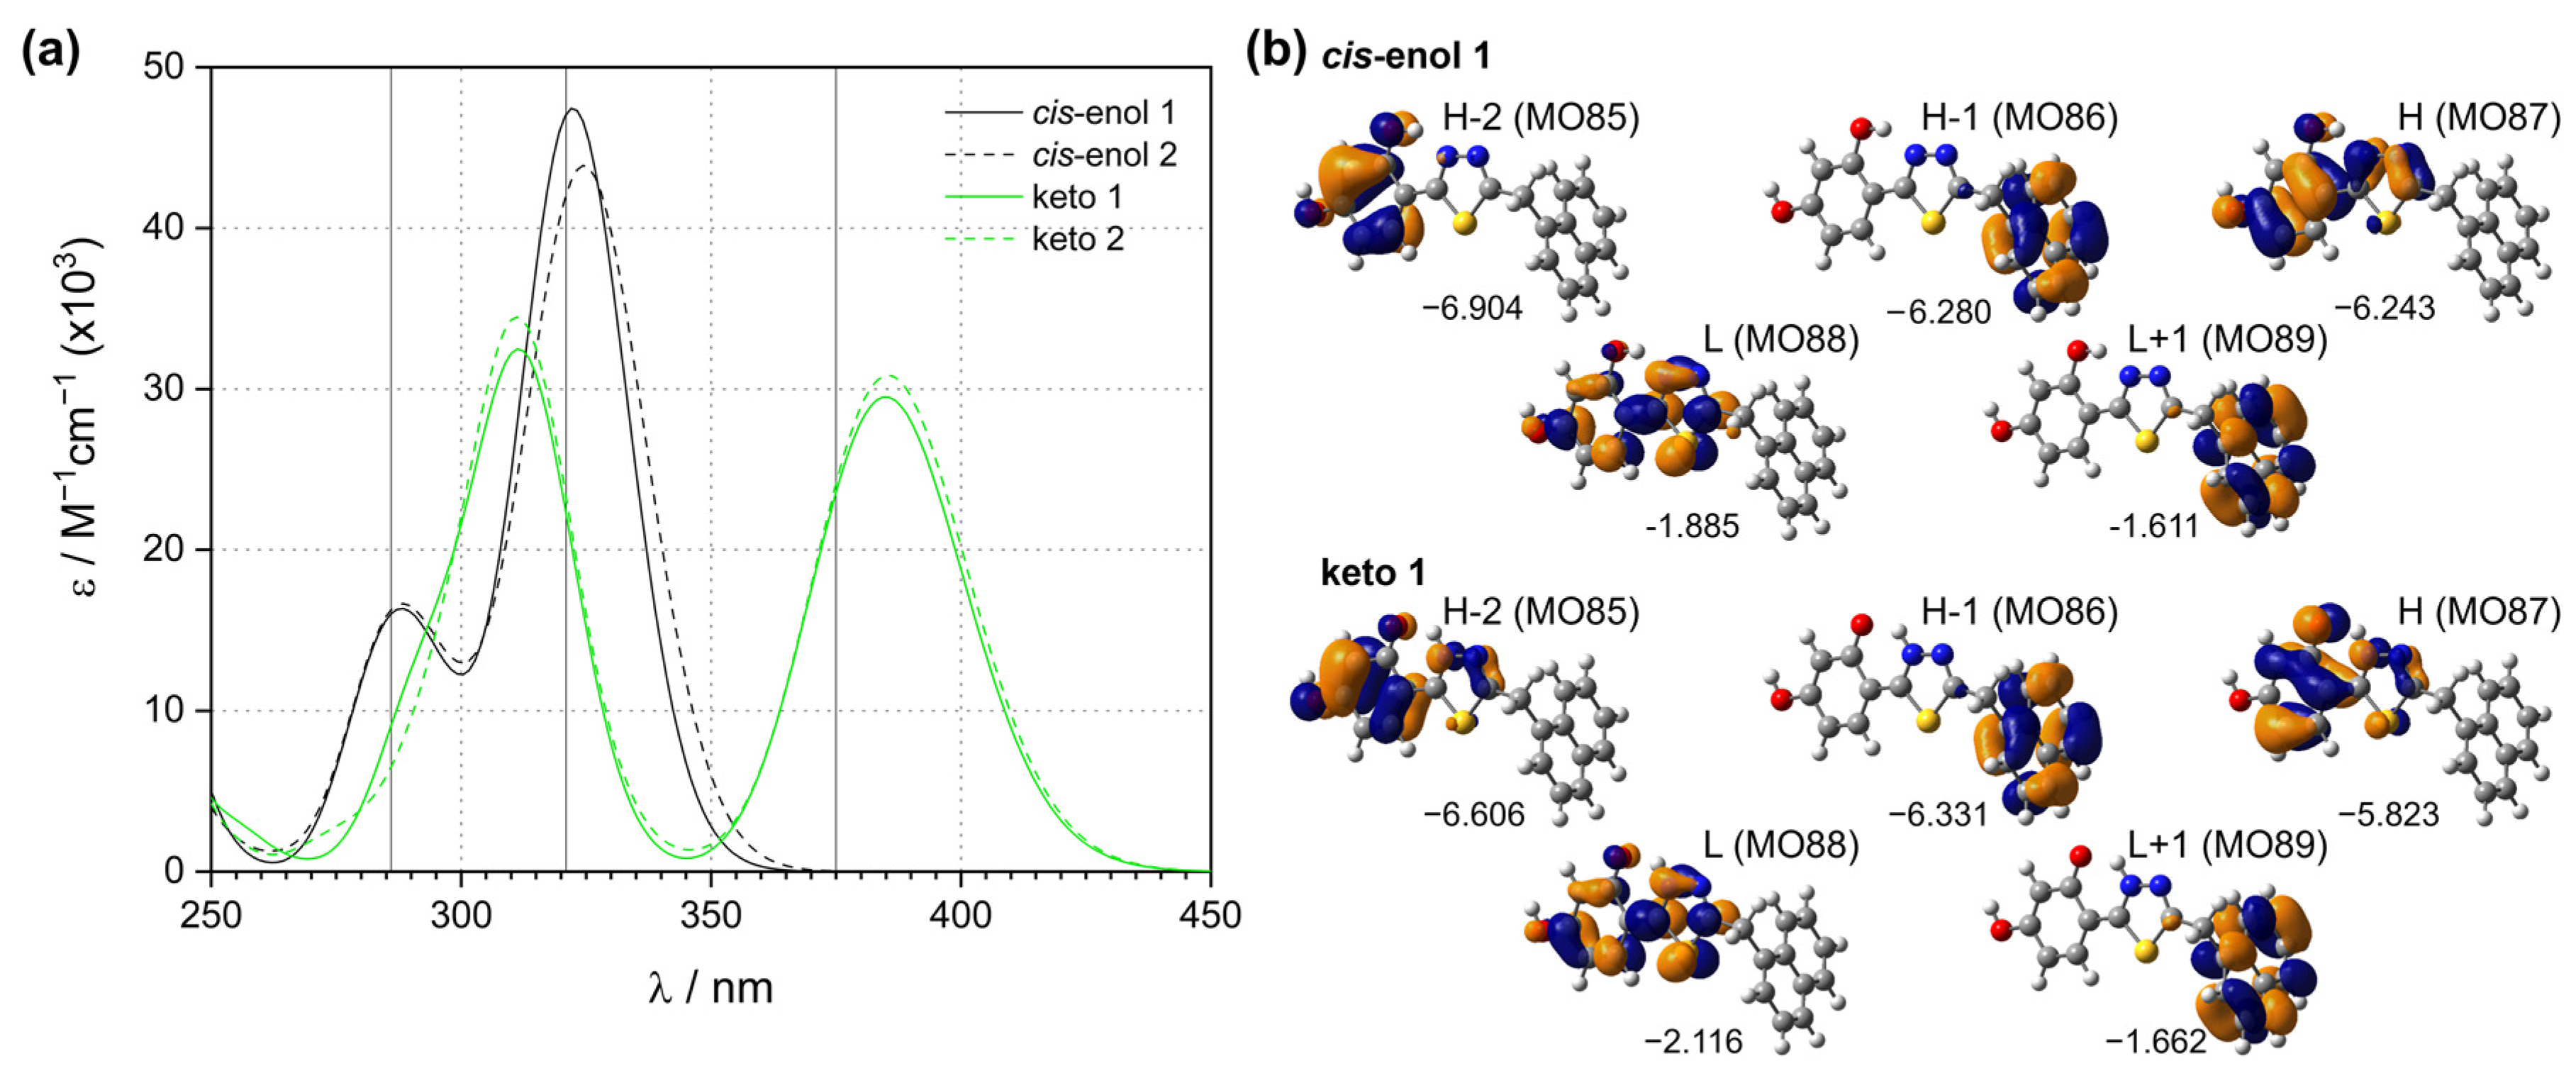
2.6. Quantum Chemical Analysis of Fluorescence Emission
2.7. Analysis of Stokes Shifts, Fluorescence Quantum Yields, and Radiative and Non-Radiative Decay Constants
3. Materials and Methods
3.1. Materials
3.2. Methods
3.2.1. General Experimental Techniques
3.2.2. Fluorescence Lifetimes
3.2.3. Quantum Chemical Calculations
4. Conclusions
Supplementary Materials
Author Contributions
Funding
Data Availability Statement
Acknowledgments
Conflicts of Interest
References
- Chhikara, B.S.; Parang, K. Global Cancer Statistics 2022: The trends projection analysis. Chem. Biol. Lett. 2023, 10, 451. [Google Scholar]
- Bondock, S.; Nasr, T.; Alqahtanti, S. Synthesis and In Vitro Antitumor Evaluation of Some Carbazole-Based Thiazole, Thiophene, and 1,3,4-Thiadiazole Derivatives. ChemistrySelect 2020, 5, 12087–12097. [Google Scholar] [CrossRef]
- Han, X.; Yu, Y.L.; Hu, Y.S.; Liu, X.H. 1,3,4-thiadiazole: A privileged scaffold for drug design and development. Curr. Top. Med. Chem. 2021, 21, 2546–2573. [Google Scholar] [CrossRef] [PubMed]
- Ghomi, M.K.; Noori, M.; Montazer, M.N.; Zomorodian, K.; Dastyafteh, N.; Yazdanpanah, S.; Sayahi, M.H.; Javanshir, S.; Nouri, A.; Asadi, M.; et al. [1,2,4]triazolo[3,4-b][1,3,4]thiadiazole derivatives as new therapeutic candidates against urease positive microorganisms: Design, synthesis, pharmacological evaluations, and in silico studies. Sci. Rep. 2023, 13, 10136. [Google Scholar] [CrossRef] [PubMed]
- Mehra, A.; Sangwan, R.; Mehra, A.; Sharma, S.; Wadhwa, P.; Mittal, A. Therapeutic charisma of imidazo [2,1-b] [1,3,4]-thiadiazole analogues: A patent review. Pharm. Pat. Anal. 2023, 12, 177–191. [Google Scholar] [CrossRef] [PubMed]
- Pham, E.C.; Truong, T.N.; Dong, N.H.; Vo, D.D.; Do, T.T.H. Synthesis of a Series of Novel 2-Amino-5-substituted 1,3,4-oxadiazole and 1,3,4-thiadiazole Derivatives as Potential Anticancer, Antifungal and Antibacterial Agents. Med. Chem. 2022, 18, 558–573. [Google Scholar] [CrossRef] [PubMed]
- Chukwuemeka, P.O.; Umar, H.I.; Iwaloye, O.; Oretade, O.M.; Olowosoke, C.B.; Oretade, O.J.; Elabiyi, M.O. Predictive hybrid paradigm for cytotoxic activity of 1,3,4-thiadiazole derivatives as CDK6 inhibitors against human (MCF-7) breast cancer cell line and its structural modifications: Rational for novel cancer therapeutics. J. Biomol. Struct. Dyn. 2022, 40, 8518–8537. [Google Scholar] [CrossRef]
- Kakekochi, V.; Nikhil, P.P.; Chandrasekharan, K.; Udayakumar, D. Impact of donor-acceptor alternation on optical power limiting behavior of H-Shaped thiophene-imidazo 2,1-b 1,3,4 thiadiazole flanked conjugated oligomers. Dye. Pigment. 2020, 175, 108181. [Google Scholar] [CrossRef]
- Hussain, R.; Shah, M.; Iqbal, S.; Rehman, W.; Khan, S.; Rasheed, L.; Naz, H.; Al-ghulikah, H.A.; Elkaeed, E.B.; Pashameah, T.A.; et al. Molecular iodine-promoted oxidative cyclization for the synthesis of 1,3,4-thiadiazole-fused-1,2,4-thiadiazole incorporating 1,4-benzodioxine moiety as potent inhibitors of a-amylase and a-glucosidase: In vitro and In silico study. Front. Chem. 2022, 10, 1023316. [Google Scholar] [CrossRef]
- Karcz, D.; Matwijczuk, A.; Kamiński, D.; Creaven, B.; Ciszkowicz, E.; Lecka-Szlachta, K.; Starzak, K. Structural Features of 1,3,4-Thiadiazole-Derived Ligands and Their Zn(II) and Cu(II) Complexes Which Demonstrate Synergistic Antibacterial Effects with Kanamycin. Int. J. Mol. Sci. 2020, 21, 5735. [Google Scholar] [CrossRef]
- Lavrenova, L.G.; Sukhikh, T.S.; Glinskaya, L.A.; Trubina, S.V.; Zvereva, V.V.; Lavrov, A.N.; Klyushova, L.S.; Artem’ev, A.V. Synthesis, Structure, and Magnetic and Biological Properties of Copper(II) Complexes with 1,3,4-Thiadiazole Derivatives. Int. J. Mol. Sci. 2023, 24, 13024. [Google Scholar] [CrossRef]
- Bharati, P.; Bharti, A.; Nath, P.; Kumari, S.; Singh, N.; Bharty, M. Square planar Pd(II) complexes derived from 1-ethyl-3-phenylthiourea, 3-mercapto-4-methyl-1,2,4-triazole and 2-mercapto-5-methyl-1,3,4-thiadiazole: Syntheses, spectral, structural characterization and photoluminescence properties. Inorg. Chim. Acta 2016, 443, 160–169. [Google Scholar] [CrossRef]
- David, M.; Budziak-Wieczorek, I.; Karcz, D.; Florescu, M.; Matwijczuk, A. Insight into dual fluorescence effects induced by molecular aggregation occurring in membrane model systems containing 1,3,4-thiadiazole derivatives. Eur. Biophys. J. Biophys. Lett. 2021, 50, 1083–1101. [Google Scholar] [CrossRef]
- Kluczyk, D.; Matwijczuk, A.; Górecki, A.; Karpińska, M.M.; Szymanek, M.; Niewiadomy, A.; Gagoś, M. Molecular Organization of Dipalmitoylphosphatidylcholine Bilayers Containing Bioactive Compounds 4-(5-Heptyl-1,3,4-thiadiazol-2-yl)Benzene-1,3-diol and 4-(5-Methyl-1,3,4-thiadiazol-2-yl) Benzene-1,3-diols. J. Phys. Chem. B 2016, 120, 12047–12063. [Google Scholar] [CrossRef] [PubMed]
- Dong, H.; Yang, H.; Zhao, J.; Liu, X.; Zheng, Y. Modulation of excited state proton transfer. J. Lumin. 2021, 231, 117840. [Google Scholar] [CrossRef]
- Meenatchi, V.; Zo, S.M.; Won, S.Y.; Nam, J.-W.; Cheng, L.; Han, S.S. Cuminaldehyde-3-hydroxy-2-napthoichydrazone: Synthesis, effect of solvents, nonlinear optical activity, antioxidant activity, antimicrobial activity, and DFT analysis. Spectrochim. Acta Part A Mol. Biomol. Spectrosc. 2023, 302, 123071. [Google Scholar] [CrossRef]
- Sasaki, S.; Drummen, G.P.C.; Konishi, G. Recent advances in twisted intramolecular charge transfer (TICT) fluorescence and related phenomena in materials chemistry. J. Mater. Chem. C 2016, 4, 2731–2743. [Google Scholar] [CrossRef]
- Wang, H.; Wang, J.; Zhang, Z.; Xie, Z.; Zhang, X.; Sun, H.; Xiao, Y.; Yu, T.; Huang, W. Breaching Kasha’s rule for dual emission: Mechanisms, materials and applications. J. Mater. Chem. C 2021, 9, 10154–10172. [Google Scholar] [CrossRef]
- Younis, O.; Al-Hossainy, A.F.; Sayed, M.; El-dean, A.M.K.; Tolba, M.S. Synthesis and intriguing single-component white-light emission from oxadiazole or thiadiazole integrated with coumarin luminescent core. J. Photochem. Photobiol. A Chem. 2022, 431, 113992. [Google Scholar] [CrossRef]
- Forster, T. Excimers. Angew. Chem. Int. Ed. 1969, 8, 333–343. [Google Scholar] [CrossRef]
- Saigusa, H.; Lim, E.C. Excimer formation in van der Waals dimers and clusters of aromatic molecules. Acc. Chem. Res. 1996, 29, 171–178. [Google Scholar] [CrossRef]
- Yang, R.X.; Gong, S.S.; Chen, L.L.; Peng, X.C.; You, X.L.; Shi, R.; Sun, Q. Benzothiazole-based Schiff bases as novel AIE(E)gens: Mechanistic insights into distinction between dimethylphenylamine and triphenylamine fragments in double bond-bridged D-A system. Dye. Pigment. 2023, 208, 110849. [Google Scholar] [CrossRef]
- Joshi, H.C.; Antonov, L. Excited-State Intramolecular Proton Transfer: A Short Introductory Review. Molecules 2021, 26, 1475. [Google Scholar] [CrossRef] [PubMed]
- Czernel, G.; Budziak, I.; Oniszczuk, A.; Karcz, D.; Pustuła, K.; Górecki, A.; Matwijczuk, A.; Gładyszewska, B.; Gagoś, M.; Niewiadomy, A.; et al. ESIPT-Related Origin of Dual Fluorescence in the Selected Model 1,3,4-Thiadiazole Derivatives. Molecules 2020, 25, 4168. [Google Scholar] [CrossRef] [PubMed]
- Ila, R.D.; Verma, S.P.; Krishnamoorthy, G. The origin of the longer wavelength emission in 2-(4-fluorophenylamino)-5-(2,4-dihydroxybenzeno)-1,3,4-thiadiazole and its analogue 2-phenylamino-5-(2-hydroxybenzono)-1,3,4-thiadiazole. Photochem. Photobiol. Sci. 2020, 19, 844–853. [Google Scholar] [CrossRef] [PubMed]
- Shekhovtsov, N.A.; Nikolaenkova, E.B.; Ryadun, A.A.; Vorobyeva, S.N.; Krivopalov, V.P.; Bushuev, M.B. Dual emission of ESIPT-capable 2-(2-hydroxyphenyl)-4-(1H-pyrazol-1-yl)pyrimidines: Interplay of fluorescence and phosphorescence. New J. Chem. 2023, 47, 6361–6377. [Google Scholar] [CrossRef]
- Czernel, G.; Matwijczuk, A.; Karcz, D.; Górecki, A.; Niemczynowicz, A.; Szcześ, A.; Gładyszewski, G.; Matwijczuk, A.; Gładyszewska, B.; Niewiadomy, A. Spectroscopic Studies of Dual Fluorescence in 2-(4-Fluorophenylamino)-5-(2,4-dihydroxybenzeno)-1,3,4-thiadiazole: Effect of Molecular Aggregation in a Micellar System. Molecules 2018, 23, 2861. [Google Scholar] [CrossRef] [PubMed]
- Wang, Y.; Wei, S.; Miao, L.; Lü, C.; An, Y. A new 1,3,4-thiadiazole-based ESIPT probe for detection of Hcy/Cys and GSH by two-channel fluorescent procedure and its potential applications. Res. Chem. Intermed. 2023, 49, 2191–2208. [Google Scholar] [CrossRef]
- Chen, R.; Li, Q.; Zhang, Z.; Xu, K.; Sun, L.; Ma, J.; Wang, T.; Mu, X.; Xi, Y.; Cao, L.; et al. Solvent effect on ESIPT process of N-(8-Quinolyl) salicylaldimine: A DFT/TD-DFT calculation. J. Photochem. Photobiol. A Chem. 2023, 436, 114335. [Google Scholar] [CrossRef]
- Song, P.; Ma, F.C. Intermolecular hydrogen-bonding effects on photophysics and photochemistry. Int. Rev. Phys. Chem. 2013, 32, 589–609. [Google Scholar] [CrossRef]
- Zhao, J.; Ji, S.; Chen, Y.; Guo, H.; Yang, P. Excited state intramolecular proton transfer (ESIPT): From principal photophysics to the development of new chromophores and applications in fluorescent molecular probes and luminescent materials. Phys. Chem. Chem. Phys. 2012, 14, 8803–8817. [Google Scholar] [CrossRef]
- Yan, C.C.; Wang, X.D.; Liao, L.S. Organic Lasers Harnessing Excited State Intramolecular Proton Transfer Process. ACS Photon. 2020, 7, 1355–1366. [Google Scholar] [CrossRef]
- Anand, S.; Muthusamy, A. Synthesis, characterization, electrochemical, electrical, thermal and ESIPT behaviour of oligobenzimidazoles of certain substituted benzimidazole carboxylic acids and their diode applications. J. Mol. Struct. 2019, 1177, 78–89. [Google Scholar] [CrossRef]
- Misra, V.; Mishra, H. Photoinduced proton transfer coupled with energy transfer: Mechanism of sensitized luminescence of terbium ion by salicylic acid doped in polymer. J. Chem. Phys. 2008, 128, 244701. [Google Scholar] [CrossRef]
- Zhang, Z.Y.; Chen, Y.A.; Hung, W.Y.; Tang, W.F.; Hsu, Y.H.; Chen, C.L.; Meng, F.Y.; Chou, P.T. Control of the Reversibility of Excited-State Intramolecular Proton Transfer (ESIPT) Reaction: Host-Polarity Tuning White Organic Light Emitting Diode on a New Thiazolo 5,4-d thiazole ESIPT System. Chem. Mater. 2016, 28, 8815–8824. [Google Scholar] [CrossRef]
- Liu, B.; Wang, H.; Wang, T.; Bao, Y.; Du, F.; Tian, J.; Li, Q.; Bai, R. A new ratiometric ESIPT sensor for detection of palladium species in aqueous solution. Chem. Commun. 2012, 48, 2867–2869. [Google Scholar] [CrossRef]
- Ren, H.; Huo, F.; Wen, W.; Yin, C. Engineering an ESIPT-based fluorescent probe for dual-channel (Vis/NIR) ratiometric monitoring of intracellular sulfur dioxide by single wavelength excitation. Dye. Pigment. 2022, 199, 110111. [Google Scholar] [CrossRef]
- Li, Y.; Dahal, D.; Abeywickrama, C.S.; Pang, Y. Progress in Tuning Emission of the Excited-State Intramolecular Proton Transfer (ESIPT)-Based Fluorescent Probes. ACS Omega 2021, 6, 6547–6553. [Google Scholar] [CrossRef]
- Gong, Y.; Wang, Z.; Zhang, S.; Luo, Z.; Gao, F.; Li, H. New ESIPT-Inspired Photostabilizers of Two-Photon Absorption Coumarin-Benzotriazole Dyads: From Experiments to Molecular Modeling. Ind. Eng. Chem. Res. 2016, 55, 5223–5230. [Google Scholar] [CrossRef]
- Le, H.N. Development of Dual Emissive Adenosine Analogs for Nucleic Acid Labeling and Life Sciences. Ph.D. Thesis, Institut de Chimie de Nice, Université Côte d’Azur, Nice, France, 2020. [Google Scholar]
- Le, H.N.; Zilio, C.; Barnoin, G.; Barthes, N.P.; Guigonis, J.M.; Martinet, N.; Michel, B.Y.; Burger, A. Rational design, synthesis, and photophysics of dual-emissive deoxyadenosine analogs. Dye. Pigment. 2019, 170, 107553. [Google Scholar] [CrossRef]
- Sahu, S.; Das, M.; Bharti, A.K.; Krishnamoorthy, G. Proton transfer triggered proton transfer: A self-assisted twin excited state intramolecular proton transfer. Phys. Chem. Chem. Phys. 2018, 20, 27131–27139. [Google Scholar] [CrossRef]
- Matysiak, J.; Nasulewicz, A.; Pełczyńska, M.; Świtalska, M.; Jaroszewicz, I.; Opolski, A. Synthesis and antiproliferative activity of some 5-substituted 2-(2,4-dihydroxyphenyl)-1,3,4-thiadiazoles. Eur. J. Med. Chem. 2006, 41, 475–482. [Google Scholar] [CrossRef]
- Budziak-Wieczorek, I.; Ślusarczyk, L.; Myśliwa-Kurdziel, B.; Kurdziel, M.; Srebro-Hooper, M.; Korona-Glowniak, I.; Gagoś, M.; Gładyszewski, G.; Stepulak, A.; Kluczyk, D.; et al. Spectroscopic characterization and assessment of microbiological potential of 1,3,4-thiadiazole derivative showing ESIPT dual fluorescence enhanced by aggregation effects. Sci. Rep. 2022, 12, 22140. [Google Scholar] [CrossRef]
- Matwijczuk, A.; Kamiński, D.; Górecki, A.; Ludwiczuk, A.; Niewiadomy, A.; Maćkowski, S.; Gagoś, M. Spectroscopic Studies of Dual Fluorescence in 2-((4-Fluorophenyl)amino)-5-(2,4-dihydroxybenzeno)-1,3,4-thiadiazole. J. Phys. Chem. A 2015, 119, 10791–10805. [Google Scholar] [CrossRef]
- Antonov, L.; Gergov, G.; Petrov, V.; Kubista, M.; Nygren, J. UV-Vis spectroscopic and chemometric study on the aggregation of ionic dyes in water. Talanta 1999, 49, 99–106. [Google Scholar] [CrossRef]
- Goftar, M.K.; Moradi, K.; Kor, N.M. Spectroscopic studies on aggregation phenomena of dyes. Eur. J. Exp. Biol. 2014, 4, 72–81. [Google Scholar]
- Herbert, J.M. Visualizing and characterizing excited states from time-dependent density functional theory. Phys. Chem. Chem. Phys. 2024, 26, 3755–3794. [Google Scholar] [CrossRef]
- Lewandowska-Andralojc, A.; Marciniak, B. Five major sins in fluorescence spectroscopy of light-harvesting hybrid materials. ACS Energy Lett. 2019, 4, 1898–1901. [Google Scholar] [CrossRef]
- Stoerkler, T.; Laurent, A.D.; Ulrich, G.; Jacquemin, D.; Massue, J. Influence of ethynyl extension on the dual-state emission properties of pyridinium-substituted ESIPT fluorophores. Dye. Pigment. 2022, 208, 110872. [Google Scholar] [CrossRef]
- Ma, S.; Du, S.; Pan, G.; Dai, S.; Xu, B.; Tian, W. Organic molecular aggregates: From aggregation structure to emission property. Aggregate 2021, 2, e96. [Google Scholar] [CrossRef]
- Pasternack, R.F.; Collings, P.J. Resonance light scattering: A new technique for studying chromophore aggregation. Science 1995, 269, 935–939. [Google Scholar] [CrossRef] [PubMed]
- Brixner, T.; Hildner, R.; Köhler, J.; Lambert, C.; Würthner, F. Exciton Transport in Molecular Aggregates—From Natural Antennas to Synthetic Chromophore Systems. Adv. Energy Mater. 2017, 7, 1700236. [Google Scholar] [CrossRef]
- Budziak, I.; Karcz, D.; Makowski, M.; Rachwał, K.; Starzak, K.; Matwijczuk, A.; Myśliwa-Kurdziel, B.; Oniszczuk, A.; Combrzyński, M.; Podleśna, A.; et al. Non-Typical Fluorescence Effects and Biological Activity in Selected 1,3,4-thiadiazole Derivatives: Spectroscopic and Theoretical Studies on Substituent, Molecular Aggregation, and pH Effects. Int. J. Mol. Sci. 2019, 20, 5494. [Google Scholar] [CrossRef] [PubMed]
- Li, Y.; Dahal, D.; Pang, Y. Fluorescence Lifetimes of NIR-Emitting Molecules with Excited-State Intramolecular Proton Transfer. Molecules 2022, 28, 125. [Google Scholar] [CrossRef] [PubMed]
- Bräuer, M.; Mosquera, M.; Pérez-Lustres, J.L.; Rodríguez-Prieto, F. Ground-state tautomerism and excited-state proton-transfer processes in 4,5-dimethyl-2-(2′-hydroxyphenyl)imidazole in solution: Fluorescence spectroscopy and quantum mechanical calculations. J. Phys. Chem. A 1998, 102, 10736–10745. [Google Scholar] [CrossRef]
- Matwijczuk, A.; Górecki, A.; Kamiński, D.; Myśliwa-Kurdziel, B.; Fiedor, L.; Niewiadomy, A.; Karwasz, G.P.; Gagoś, M. Influence of Solvent Polarizability on the Keto-Enol Equilibrium in 4-[5-(naphthalen-1-ylmethyl)-1,3,4-thiadiazol-2-yl]benzene-1,3-diol. J. Fluoresc. 2015, 25, 1867–1874. [Google Scholar] [CrossRef]
- Das, D.; Choudhury, A.R. Water- assisted ground state intra- molecular proton transfer in 2,5-dihydroxy-substituted azobenzenes: Experimental and computational studies. Crystengcomm 2019, 21, 2373–2380. [Google Scholar] [CrossRef]
- Tong, Y.P.; Fu, J.; Ma, J.T. A theoretical investigation about the excited state behavior for 2-(6′-hydroxy-2′-pyridyl)benzimidazole: The water-assisted excited state proton transfer process. J. Chin. Chem. Soc. 2018, 65, 822–827. [Google Scholar] [CrossRef]
- Paul, L.; Das, S. Dangling Water Molecules Bridge for ESIPT in Aggregated TMP: A Theoretical Study. J. Phys. Chem. A 2023, 127, 6892–6901. [Google Scholar] [CrossRef]
- Li, Y.; Wang, Y.; Feng, X.; Zhao, Y. Spectroscopic and mechanistic insights into solvent mediated excited-state proton transfer and aggregation-induced emission: Introduction of methyl group onto 2-(o-hydroxyphenyl)benzoxazole. Phys. Chem. Chem. Phys. 2022, 24, 26297–26306. [Google Scholar] [CrossRef]
- Zhou, P.W.; Han, K.L. ESIPT-based AIE luminogens: Design strategies, applications, and mechanisms. Aggregate 2022, 3, e160. [Google Scholar] [CrossRef]
- Dhar, S.; Rana, D.K.; Roy, S.S.; Roy, S.; Bhattacharya, S.; Bhattacharya, S.C. Effect of solvent environment on the Photophysics of a newly synthesized bioactive 7-oxy(5-selenocyanato-pentyl)-2H-1-benzopyran-2-one. J. Lumin. 2012, 132, 957–964. [Google Scholar] [CrossRef]
- Jones, G.; Jackson, W.R.; Choi, C.Y.; Bergmark, W.R. Solvent effects on emission yield and lifetime for coumarin laser dyes—Requirements for a rotatory decay mechanism. J. Phys. Chem. 1985, 89, 294–300. [Google Scholar] [CrossRef]
- Valiev, R.R.; Cherepanov, V.N.; Baryshnikov, G.V.; Sundholm, D. First-principles method for calculating the rate constants of internal-conversion and intersystem-crossing transitions. Phys. Chem. Chem. Phys. 2018, 20, 6121–6133. [Google Scholar] [CrossRef] [PubMed]
- Tomasi, J.; Mennucci, B.; Cammi, R. Quantum mechanical continuum solvation models. Chem. Rev. 2005, 105, 2999–3094. [Google Scholar] [CrossRef] [PubMed]
- Becke, A.D. Density-functional thermochemistry. III. The role of exact exchange. J. Chem. Phys. 1993, 98, 5648–5652. [Google Scholar] [CrossRef]
- Lee, C.T.; Yang, W.T.; Parr, R.G. Development of the Colle-Salvetti correlation-energy formula into a functional of the electron-density. Phys. Rev. B 1988, 37, 785–789. [Google Scholar] [CrossRef] [PubMed]
- Stephens, P.J.; Devlin, F.J.; Chabalowski, C.F.; Frisch, M.J. Ab-initio calculation of vibrational absorption and circular-dichroism spectra using density-functional force-fields. J. Phys. Chem. 1994, 98, 11623–11627. [Google Scholar] [CrossRef]
- Krishnan, R.B.; Binkley, J.S.; Seeger, R.; Pople, J.A. Self-consistent molecular orbital methods. XX. A basis set for correlated wave functions. J. Chem. Phys. 1980, 72, 650–654. [Google Scholar] [CrossRef]
- Clark, T.; Chandrasekhar, J.; Spitznagel, G.W.; Schleyer, P.V.R. Efficient diffuse function-augmented basis sets for anion calculations. III. The 3-21+g basis set for first-row elements, Li-F. J. Comput. Chem. 1983, 4, 294–301. [Google Scholar] [CrossRef]
- Grimme, S.; Antony, J.; Ehrlich, S.; Krieg, H. A consistent and accurate ab initio parametrization of density functional dispersion correction (DFT-D) for the 94 elements H-Pu. J. Chem. Phys. 2010, 132, 154104–154119. [Google Scholar] [CrossRef]
- Grimme, S.; Ehrlich, S.; Goerigk, L. Effect of the damping function in dispersion corrected density functional theory. J. Comput. Chem. 2011, 32, 1456–1465. [Google Scholar] [CrossRef]
- Dunning, T.H., Jr. Gaussian basis sets for use in correlated molecular calculations. I. The atoms boron through neon and hydrogen. J. Chem. Phys. 1989, 90, 1007–1023. [Google Scholar] [CrossRef]
- Kendall, R.A.; Dunning, T.H., Jr.; Harrison, R.J. Electron affinities of the first-row atoms revisited. Systematic basis sets and wave functions. J. Chem. Phys. 1992, 96, 6796–6806. [Google Scholar] [CrossRef]
- Frisch, M.J.; Trucks, G.W.; Schlegel, H.B.; Scuseria, G.E.; Robb, M.A.; Cheeseman, J.R.; Scalmani, G.; Barone, V.; Petersson, G.A.; Nakatsuji, H.; et al. Gaussian 16, Revision C.01; Gaussian, Inc.: Wallingford, CT, USA, 2016. [Google Scholar]
- Cossi, M.; Barone, V.; Cammi, R.; Tomasi, J. Ab initio study of solvated molecules: A new implementation of the polarizable continuum model. Chem. Phys. Lett. 1996, 255, 327–335. [Google Scholar] [CrossRef]
- Cossi, M.; Barone, V. Time-dependent density functional theory for molecules in liquid solutions. J. Chem. Phys. 2001, 115, 4708–4717. [Google Scholar] [CrossRef]
- Dennington, R.; Keith, T.A.; Millam, J.M. GaussView, Version 5.0.9; Semichem Inc.: Shawnee Mission, KS, USA, 2009.
- Matwijczuk, A.; Karcz, D.; Pustuła, K.; Makowski, M.; Górecki, A.; Kluczyk, D.; Karpińska, M.M.; Niewiadomy, A.; Gagoś, M. Spectroscopic and theoretical studies of fluorescence effects in bio-active: 4-(5-(methyl-1,3,4-thiadiazol-2-yl))benzene-1,3-diol and 4-(5-(methylamino-1,3,4-thiadiazol-2-yl))benzene-1,3-diol compounds: Effect of molecular aggregation and amino group position. J. Lumin. 2018, 201, 44–56. [Google Scholar]
- Matwijczuk, A.; Górecki, A.; Makowski, M.; Pustuła, K.; Skrzypek, A.; Waś, J.; Niewiadomy, A.; Gagoś, M. Spectroscopic and Theoretical Studies of Fluorescence Effects in 2-Methylamino-5-(2,4-dihydroxyphenyl)-1,3,4-thiadiazole Induced by Molecular Aggregation. J. Fluoresc. 2018, 28, 65–77. [Google Scholar] [CrossRef] [PubMed]
- Budziak, I.; Karcz, D.; Makowski, M.; Myśliwa-Kurdziel, B.; Kasprzak, K.; Matwijczuk, A.; Chruściel, E.; Oniszczuk, A.; Adwent, L.; Matwijczuk, A. Spectroscopic and theoretical investigation into substituent- and aggregation-related dual fluorescence effects in the selected 2-amino-1,3,4-thiadiazoles. J. Mol. Liq. 2019, 291, 111261. [Google Scholar] [CrossRef]
- Kudelko, A.; Olesiejuk, M.; Luczynski, M.; Swiatkowski, M.; Sieranski, T.; Kruszynski, R. 1,3,4-Thiadiazole-Containing Azo Dyes: Synthesis, Spectroscopic Properties and Molecular Structure. Molecules 2020, 25, 2822. [Google Scholar] [CrossRef]
- Scalmani, G.; Frisch, M.J.; Mennucci, B.; Tomasi, J.; Cammi, R.; Barone, V. Geometries and properties of excited states in the gas phase and in solution: Theory and application of a time-dependent density functional theory polarizable continuum model. J. Chem. Phys. 2006, 124, 094107. [Google Scholar] [CrossRef] [PubMed]


| Solvent/Low Concentration | τ1 ± sd | f1 ± sd | τ2 ± sd | f2 ± sd |
|---|---|---|---|---|
| MeOH | 1.721 ± 0.032 | 1.000 | - | - |
| EtOH | 1.760 ± 0.001 | 0.964 ± 0.002 | 0.125 ± 0.095 | 0.033 ± 0.003 |
| Propan-2-ol | 1.900 ± 0.029 | 0.928 ± 0.012 | 0.413 ± 0.134 | 0.072 ± 0.012 |
| Butan-1-ol | 1.908 ± 0.062 | 0.764 ± 0.108 | 0.483 ± 0.241 | 0.061 ± 0.029 |
| DMSO | 1.348 ± 0.060 | 0.806 ± 0.106 | 0.491 ± 0.199 | 0.192 ± 0.101 |
| ACN | 1.656 ± 0.026 | 1.000 | - | - |
| Ethyl acetate | 1.032 ± 0.090 | 1.000 | - | - |
| THF | 1.610 ± 0.070 | 0.901 ± 0.032 | 0.357 ± 0.156 | 0.099 ± 0.032 |
| DMF | 1.530 ± 0.017 | 1.000 | - | - |
| Solvent/High Concentration | τ1 ± sd | f1 ± sd | τ2 ± sd | f2 ± sd |
| MeOH | 1.720 ± 0.010 | 0.942 ± 0.011 | 0.191 ± 0.027 | 0.059 ± 0.013 |
| EtOH | 1.868 ± 0.040 | 0.906 ± 0.031 | 0.457 ± 0.087 | 0.095 ± 0.030 |
| Propan-2-ol | 1.850 ± 0.050 | 0.918 ± 0.024 | 0.247 ± 0.101 | 0.083 ± 0.024 |
| Butan-1-ol | 1.940 ± 0.053 | 0.832 ± 0.025 | 0.883 ± 0.063 | 0.161 ± 0.019 |
| DMSO | 1.348 ± 0.060 | 0.850 ± 0.040 | 0.290 ± 0.088 | 0.150 ± 0.040 |
| ACN | 1.298 ± 0.057 | 1.000 | - | - |
| Ethyl acetate | 1.100 ± 0.056 | 1.000 | - | - |
| THF | - | - | - | - |
| DMF | 1.630 ± 0.015 | 0.959 ± 0.090 | 0.012 ± 0.020 | 0.040 ± 0.010 |
| MeOH:H2O | τ1 ± sd | f1 ± sd | τ2 ± sd | f2 ± sd |
| 99:1 | 1.520 ± 0.010 | - | - | - |
| 9:1 | 1.233 ± 0.300 | 0.612 ± 0.549 | - | - |
| 7:3 | 0.417 ± 0.055 | 0.745 ± 0.112 | 1.297 ± 0.346 | 0.255 ± 0.112 |
| 5:5 | 0.262 ± 0.031 | 0.687 ± 0.069 | 1.019 ± 0.119 | 0.312 ± 0.069 |
| 3:7 | 0.296 ± 0.010 | - | - | - |
| 1:9 | 0.109 ± 0.008 | - | - | - |
| 1:99 | 0.049 ± 0.038 | 0.744 ± 0.040 | 2.840 ± 0.979 | 0.256 ± 0.034 |
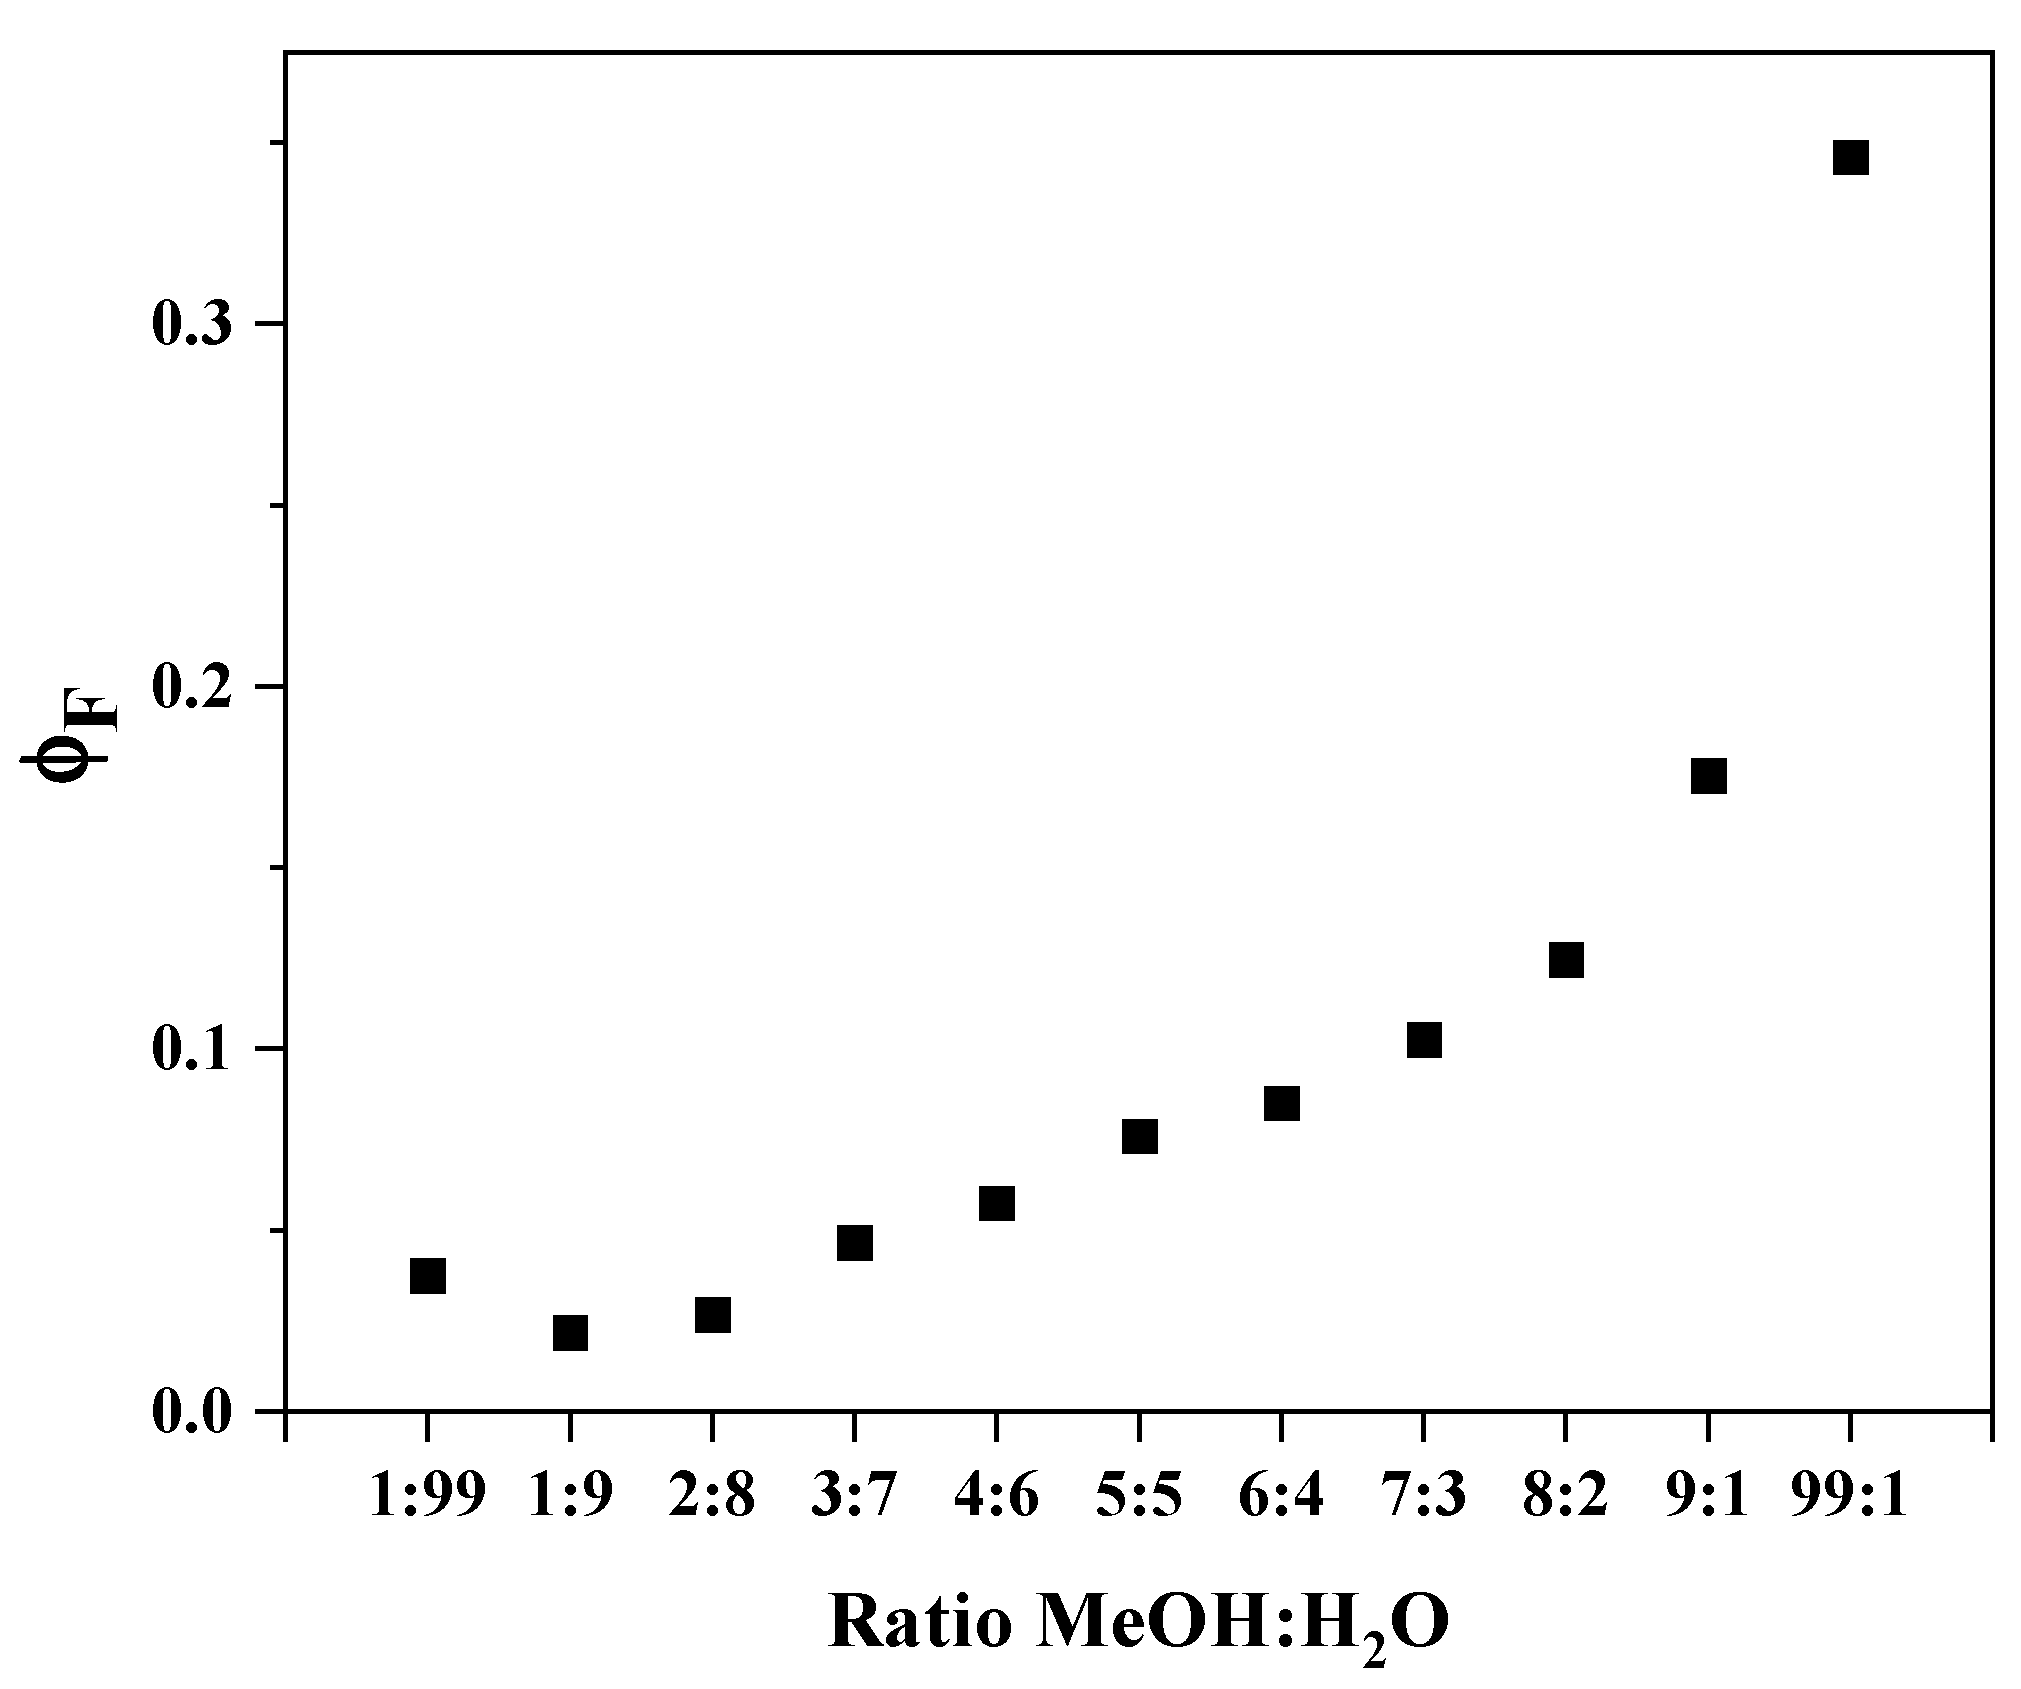
| MeOH:H2O Ratio | I | ex [nm] | F |
|---|---|---|---|
| 1:9 | 1653.8901 | 300 | 0.0218 |
| 2:8 | 1976.1527 | 295 | 0.0266 |
| 3:7 | 3475.7911 | 296 | 0.0468 |
| 4:6 | 4286.1414 | 297 | 0.0576 |
| 5:5 | 5619.5849 | 297 | 0.0760 |
| 6:4 | 6285.8308 | 297 | 0.0850 |
| 7:3 | 7589.6019 | 297 | 0.1026 |
| 8:2 | 9290.4997 | 298 | 0.1246 |
| 9:1 | 13,236.4568 | 299 | 0.1754 |
| 1:99 | 2882.5170 | 303 | 0.0375 |
| 99:1 | 26,455.8364 | 300 | 0.3461 |
| MeOH:H2O Ratio | τ1 | kr [ns−1] | kr [s−1] | knr [ns−1] | knr [s−1] | |
|---|---|---|---|---|---|---|
| 99:1 | 1.52 | 0.35 | 0.23 | 2.28 × 10⁻¹⁰ | 0.43 | 4.30 × 10⁻¹⁰ |
| 9:1 | 1.23 | 0.18 | 0.14 | 1.43 × 10⁻¹⁰ | 0.67 | 6.70 × 10⁻¹⁰ |
| 7:3 | 0.41 | 0.10 | 0.25 | 2.50 × 10⁻¹⁰ | 2.19 | 2.19 × 10⁻⁹ |
| 5:5 | 0.26 | 0.08 | 0.29 | 2.92 × 10⁻¹⁰ | 3.55 | 3.55 × 10⁻⁹ |
| 3:7 | 0.29 | 0.05 | 0.16 | 1.61 × 10⁻¹⁰ | 3.29 | 3.29 × 10⁻⁹ |
| 1:9 | 0.10 | 0.02 | 0.22 | 2.18 × 10⁻¹⁰ | 9.78 | 9.78 × 10⁻⁹ |
| 1:99 | 0.04 | 0.04 | 0.94 | 9.37 × 10⁻⁹ | 24.06 | 2.41 × 10⁻⁸ |
| Solvent | τ1 | kr [ns−1] | kr [s−1] | knr [ns−1] | knr [s−1] | |
| Methanol | 1.72 | 0.82 | 0.48 | 4.78 × 10⁻¹⁰ | 0.10 | 1.03 × 10⁻¹⁰ |
Disclaimer/Publisher’s Note: The statements, opinions and data contained in all publications are solely those of the individual author(s) and contributor(s) and not of MDPI and/or the editor(s). MDPI and/or the editor(s) disclaim responsibility for any injury to people or property resulting from any ideas, methods, instructions or products referred to in the content. |
© 2024 by the authors. Licensee MDPI, Basel, Switzerland. This article is an open access article distributed under the terms and conditions of the Creative Commons Attribution (CC BY) license (https://creativecommons.org/licenses/by/4.0/).
Share and Cite
Budziak-Wieczorek, I.; Kaczmarczyk, D.; Rząd, K.; Gagoś, M.; Stepulak, A.; Myśliwa-Kurdziel, B.; Karcz, D.; Starzak, K.; Burdziński, G.; Srebro-Hooper, M.; et al. Cooperativity of ESPT and Aggregation-Induced Emission Effects—An Experimental and Theoretical Analysis of a 1,3,4-Thiadiazole Derivative. Int. J. Mol. Sci. 2024, 25, 3352. https://0-doi-org.brum.beds.ac.uk/10.3390/ijms25063352
Budziak-Wieczorek I, Kaczmarczyk D, Rząd K, Gagoś M, Stepulak A, Myśliwa-Kurdziel B, Karcz D, Starzak K, Burdziński G, Srebro-Hooper M, et al. Cooperativity of ESPT and Aggregation-Induced Emission Effects—An Experimental and Theoretical Analysis of a 1,3,4-Thiadiazole Derivative. International Journal of Molecular Sciences. 2024; 25(6):3352. https://0-doi-org.brum.beds.ac.uk/10.3390/ijms25063352
Chicago/Turabian StyleBudziak-Wieczorek, Iwona, Dominika Kaczmarczyk, Klaudia Rząd, Mariusz Gagoś, Andrzej Stepulak, Beata Myśliwa-Kurdziel, Dariusz Karcz, Karolina Starzak, Gotard Burdziński, Monika Srebro-Hooper, and et al. 2024. "Cooperativity of ESPT and Aggregation-Induced Emission Effects—An Experimental and Theoretical Analysis of a 1,3,4-Thiadiazole Derivative" International Journal of Molecular Sciences 25, no. 6: 3352. https://0-doi-org.brum.beds.ac.uk/10.3390/ijms25063352