Article

New Insights Into Nematode DNA-metabarcoding as Revealed by the Characterization of Artificial and Spiked Nematode Communities

1
ILVO-Flanders Research Institute for Agriculture, Fisheries and Food, Plant Sciences Unit, Burg. Van Gansberghelaan 96, 9820 Merelbeke, Belgium
2
Department of Biology, Ghent University, K.L. Ledeganckstraat 35, 9000 Ghent, Belgium
*
Author to whom correspondence should be addressed.
Submission received: 15 March 2019 / Revised: 26 March 2019 / Accepted: 27 March 2019 / Published: 2 April 2019

Abstract

:
Nematodes are ideal biological indicators to monitor soil biodiversity and ecosystem functioning. For this reason, they have been receiving increasing attention from a broad range of scientists. The main method to characterize soil nematode communities until at least genus level is still based on microscopic observations of nematode morphology. Such an approach is time-consuming, labor-intensive, and requires specialized personnel. The first studies on the potential use of DNA-metabarcoding to characterize nematode communities showed some shortcomings: under- or overestimation of species richness caused by failure to detect a number of nematode species or caused by intraspecific sequence variants increasing the number of OTUs (operational taxonomic units) or ‘molecular’ species, and flaws in quantification. We set up experiments to optimize this metabarcoding approach. Our results provided new insights such as the drastic effect of different DNA-extraction methods on nematode species richness due to variation in lysis efficacy. Our newly designed primer set (18S rRNA gene, V4-V5 region) showed in silico an improved taxonomic coverage compared with a published primer set (18S rRNA gene, V6-V8 region). However, results of DNA-metabarcoding with the new primer set showed less taxonomic coverage, and more non-nematode reads. Thus, the new primer set might be more suitable for whole soil faunal analysis. Species-specific correction factors calculated from a mock community with equal amounts of different nematode species were applied on another mock community with different amounts of the same nematode species and on a biological sample spiked with four selected nematode species. Results showed an improved molecular quantification. In conclusion, DNA-metabarcoding of soil nematode communities is useful for monitoring shifts in nematode composition but the technique still needs further optimization to enhance its precision.

1. Introduction

Nematodes are among the most diverse and highly specialized multicellular eukaryotes on earth. In the soil, they occur in high numbers across multiple trophic levels making them vitally important in the soil environment [1]. In addition, (i) nematodes can easily be extracted from the soil using simple extraction procedures; (ii) they are more sensitive to changes in the soil environment than other organisms due to their permeable cuticle; (iii) numerous species can withstand anaerobic conditions and desiccation which benefits their survival; (iv) they can be detected in all seasons [2,3]; and (v) their generation time (days to years) is longer than metabolically active microbes (hours to days), making them more temporally stable and less fluctuating with nutrient flushes [4]. These arguments assure nematodes to be ideal biological indicators suited for monitoring soil biodiversity and ecosystem functioning as recently confirmed by a panel of approximately 50 European soil biology researchers [5,6].
So far, mainly nematode species responsible for plant diseases have received a lot of attention in molecular plant pathology studies [7]. Far less is known about the majority of the nematode species that play beneficial roles in soil environments and together form a nematode community, holding valuable information for soil health assessment. The fact that these nematodes are microscopically small and live hidden between soil particles can only partially explain this paucity of knowledge. A far more important reason is that characterizing nematode communities is labor intensive and time consuming. Besides, estimates of nematode diversity and role-playing in ecosystems have been based on species-level taxonomy and trophic-level guilds [8,9]. Especially the first requires a high level of expertise, which is increasingly lacking. However, for a few years nematode communities have been receiving more attention from a broader range of scientists and the demand for widely accessible and quicker methods, for example DNA-based methods, is rising.
Only a few studies investigated the potential of DNA-metabarcoding based on amplicon sequencing for soil nematode community characterization [10,11,12,13,14,15,16]. All these studies applied primer sets from the same region within the 18S rRNA gene and reported a number of shortcomings. Firstly, the 18S rRNA gene primer sets cannot recover all nematode species in a nematode community causing an underestimation of species richness. Sequence variation can impede the primer to bind its recognition site causing failure of amplification and thus detection of the concerned species. Additionally, taxonomic assignment can also be problematic by sequence database incompleteness or by incongruence between morphological and molecular data [17]. The addition of another locus within the rDNA, viz. D2D3 of the 28S rRNA gene, improved the detection level but still underestimated species richness [10]. Secondly, the frequency of reads representing individual biological species did not correlate with the number of individuals from these different species within a nematode community. The inclusion of a correction of the rRNA gene copy number only partially improved the accuracy of quantification [13]. Thirdly, most analysis pipelines used so far apply OTUs (operational taxonomic units) to link the obtained sequence data to a certain nematode taxon. It must be noted that these ‘molecular species’ do not necessarily correspond to a ‘biological’ nematode species: insufficient variation can create a single OTU representing different biological species while sequence variants can cause the opposite, linking one nematode species to different OTUs. The level of sequence similarity to define these clusters can provoke a drastic underestimation of species richness or make it more difficult to allocate a species. Moreover, sequence variation differs considerably between species causing the use of fixed cut-offs that are potentially not appropriate for a whole nematode community [12]. So, the overall conclusion is that further research is needed and that, until now, molecular tools can flank, but not yet replace traditional morpho-biometrical techniques for analysis of the soil nematofauna.
The goal of our experiments was not to validate the high-throughput DNA-metabarcoding method for the characterization of biological soil nematode communities. After all, the artificial communities have no resemblance to nematode communities from field samples in terms of either nematode abundance nor diversity. We merely wanted to investigate how to improve nematode community characterization by amplicon sequencing and therefore addressed some of the shortcomings stated above. To achieve this we (i) evaluated different DNA-extraction methods, (ii) designed a new 18S rRNA primer set and compared it with the slightly adapted primer set of Sapkota and Nicolaisen [14], (iii) analyzed artificial samples composed of pure nematode cultures (single species and mock communities) and a spiked biological sample, and (iv) used the recent software package DADA2 (Divisive Amplicon Denoising Algorithm) [18], which uses exact amplicon sequence variants (ASVs) instead of OTUs.

2. Materials and Methods

2.1. Sample Preparation

Pure cultures from nine nematode species were established. Pratylenchus penetrans and Ditylenchus dipsaci were multiplied on carrot disks (Daucus carota) [19]. Meloidogyne incognita was reared on tomato plants (Solanum lycopersicum cv. Moneymaker) in pots with sterilized sandy soil placed in a greenhouse (12 h day/night regime at 22 °C and 15 °C, respectively). Bursaphelenchus xylophilus was cultured on PDA-plates covered with a five-day-old non-sporulating strain of Botrytis cinerea [20]. Acrobeloides nanus, Cephalobus sp., Mesorhabitis belari, Oscheius tipulae and Plectus acuminatus were reared on nutrient agar plates with a one-day-old Escherichia coli culture [21]. Additionally, two commercial samples (Biobest Group NV, Westerlo, Belgium) containing infective juveniles of Steinernema feltiae and Heterorhabditis bacteriophora were obtained. Finally, about 65 individuals of Mesocriconema sp., 45 individuals of Paratylenchus sp. and 150 individuals of the family Dorylaimidae were handpicked from nematode suspensions, identified morphologically up to genus level using a stereo microscope (25×, Leica M80, Leica Microsystems Belgium BVBA, Diegem, Belgium), and kept separately in three counting dishes at 10 °C. We especially took care of selecting the same developmental stage: active adults from carrot disks, agar-plates, and soil nematode suspensions or infective juveniles of M. incognita and of both commercial samples.
Different types of samples were prepared by adding nematodes in 1.5 mL Eppendorf tubes containing 250 µL MilliQ-water (Table 1.) Thirty individuals of a pure culture from three nematode species with a different life style (B. xylophilus, D. dipsaci and P. acuminatus;) were transferred into separate 1.5 mL Eppendorf tubes containing 250 µL MilliQ-water. This was repeated 3 times. As cuticular differences already can occur between genera of the same family and function [22], then it is likely that nematodes with a different lifestyle have a different cuticle composition (for example, plant-parasitic nematodes have to endure the turgor pressure in plant cells opposed to non-herbivorous nematodes). This can possibly have an effect on DNA-extraction efficiency and subsequent meta-barcoding analysis. The same was done with 7 and 10 individuals of Paratylenchus sp. and Mesocriconema sp., respectively. These two species were chosen because during preliminary tests, as recently confirmed [23], we faced problems detecting these nematodes by DNA-metabarcoding (data not shown). In addition, two sets of 8 tubes were prepared in the following way: one set with a mixture of 20 individuals of each nematode culture with addition of 20 individuals belonging to the family Dorylaimidae (M20) and one set with the same mixture but with different numbers of individuals (Mvar).
A biological nematode sample was obtained by extracting the nematode community from a 500 cm3 field soil sample using automated zonal centrifuging [24]. This method has an efficiency of approximately 95% for extracting nematodes from a soil sample. We extracted five subsamples of 100 cm3 and combined the five nematode suspensions that were obtained. Nematodes were then concentrated in a 40 mL suspension using centrifugation. After thorough homogenization, 16 1.5 mL Eppendorf tubes were filled with 250 µL nematode suspension while another three subsamples of 250 µL were used to determine the number of nematodes (10×, Leica M80). One set of eight of the tubes (T1) were spiked with 40, 5, 10, and 20 individuals of B. xylophilus, H. bacteriophora, P. acuminatus, and P. penetrans, respectively. In the other eight tubes (T2) the same mixture was prepared except that only one B. xylophilus and 40 individuals of H. bacteriophora were added (Table 1).

2.2. DNA-Extraction Test

Fifteen different methods (combinations of 5 extraction methods preceded by 3 pre-treatments) to extract DNA from nematodes were compared using a nematode suspension of H. bacteriophora, established by suspending 1 g of the commercial preparation in 100 mL of MilliQ-water. The number of nematodes in 1 mL was about 4000 individuals (4009 ± 121) based on three counts (10×, Leica M80). Seventy five 2 mL Eppendorf tubes were filled with 1 mL of the H. bacteriophora suspension. After centrifugation (20,800 rcf, 20 min), 500 µL of the supernatant was removed. Twenty-five tubes were stored immediately at −20 °C (pre-treatment 1), while 25 were first submitted to −80 °C for 20 min (pre-treatment 2) or dipped in liquid nitrogen for 5 s (pre-treatment 3) before storing them all together at −20 °C. DNA was extracted from sets of 15 tubes, comprising 5 tubes of each pre-treatment, according to (i) Holterman et al. [25] with one adaptation (1% beta-mercaptoethanol replaced by 0.1 M dithiotreitol, from here on referred to as ‘adapted Holterman method’) and according to the manufacturer’s instructions of the (ii) High Pure PCR Template Preparation Kit (Roche Diagnostics, Mannheim, Germany), (iii) DNeasy Blood & Tissue Kit (Qiagen, Hilden, Germany, from here on referred to as ‘Qiagen method’ ), (iv) Wizard Magnetic DNA Purification System for Food (Promega, Madison, WI, USA), and (v) Soil DNA Isolation Kit (Norgen Biotek corporation, Thorold, ON, Canada). The first DNA-extraction method is a simple incubation step with Proteinase K and a lysis buffer to make the DNA accessible for amplification but does not further purify it. The other methods are commercial DNA purification kits using different techniques. The methods from Roche and Qiagen use silica-based glass fibers pre-packed as a membrane in a filter tube to selectively capture nucleic acids. The system from Promega applies paramagnetic beads with a high binding efficiency for nucleic acids. The method from Norgen combines a filter tube to remove soil inhibitors like humic acids, and a spin column with the silica-based glass membrane. DNA concentrations were measured fluorometrically using a Quantus fluorospectrometer (QuantiFluor dsDNA system, Promega, Madison, WI, USA).
Two microliter DNA from the DNA-extraction method yielding the highest DNA concentration and from the method showing the lowest variation in yield was used in a qPCR (PCR mixture: 10 µL 2× SensiFast SYBR Hi-Rox master mix, 400 nM of each H. bacteriophora specific primers [26], and MilliQ water up to a final volume of 20 µL; temperature profile: 10 min at 95 °C, 40 cycles of 95 °C for 15 s, 59 °C for 30 s and 72 °C for 1 min) to check whether the DNA was amplifiable.

2.3. Nematode Reference Sequence Database

DNA was extracted from a single individual of all nematode samples listed in table 1, with the exception of the sample containing different species from the Dorylaimidae family, by the adapted Holterman method. Amplicons were obtained after amplification of two overlapping parts at the 3’-region of the 18S rRNA gene using the in-house primer set 18SILVOmidF and 18SILVOmidR (see below), and the primer set 1813F and 2646R [25] (Figure 1, Table 2). PCR was performed in a final volume of 50 µL (Phusion Green Hot Start II High-Fidelity DNA Polymerase Kit, Thermo Fisher Scientific, Waltham, MA, USA) and contained 1× Phusion Green HF Buffer, 0.3 µM of each primer, 200 µM dNTPs, 0.8 U Phusion Hot Start II DNA Polymerase, and 1 µL DNA extract. The following PCR profile was used: 98 °C for 3 min; 45 cycles of 98 °C for 10 s, 64 °C for 30 s, 72 °C for 30 s; and a final step of 72 °C for 10 min. All amplicons were gel-purified (Smartpure gel DNA purification kit, Eurogentec, Liège, Belgium), quantified (Nanodrop ND-1000), and sequenced (Macrogen EU, Amsterdam, the Netherlands). The sequences were assembled using BioNumerics 7.6.2 [27]. A similarity search analysis was performed against the Genbank nucleotide collection using blastn [28] to confirm the identity of the respective nematode samples. Subsequently, the sequences were submitted to Genbank and added to the downloaded Silva 128 release (“SILVA_128_SSURef_Nr99_tax_silva_trunc_Nematoda.fasta”) [29] from which only sequences belonging to the phylum Nematoda were retained. The taxonomy of each entry in the SILVA database was retrieved from the NCBI Taxonomy database since the SILVA taxonomy was not classified properly. The final sequence database consisted of 1896 sequences (Supplementary File S1) and was used for the taxonomic assignment of the obtained sequences from the Illumina MiSeq run (2 × 300 bp).

2.4. 18S rDNA Primer Pairs for a Amplicon Sequencing

A selection of sequences from our constructed nematode reference sequence database (see Section 2.3), representing a wide taxonomic range of soil inhabiting nematode species, were used to make a multiple alignment (Supplementary File S2) and to calculate Shannon entropy values with mafft v7.215 [31] using a sequence from Caenorhabditis elegans (AY268117) as reference (Figure 1). In such a case, the Shannon entropy is a quantitative measure of sequence variability in a column in a sequence alignment. It incorporates both the frequencies of variation and number of different nucleotides. An invariant column has a Shannon entropy of zero. Based on the alignment, a new primer set (EcoF and EcoR, from here on referred to as ’eco primer set’) was developed using the ecoPrimers software [32]. Before starting the practical work, we evaluated the number of mismatches and the resolving taxonomic power of the new primer sets proposed by ecoPrimers against our sequence database by Primer Prospector [30]. The primer pair which produced the most in silico amplicons was chosen to be tested in practice. Based on the Primer Prospector output and on alignments, the selected primer pair was further optimized by extending its length with an extra base to both the forward and reverse primer to improve the GC content and by including two degenerate bases in the forward primer to improve the taxonomic coverage. This optimization was also done on the already published primers NemF and 18Sr2b [14]. A degenerated position was incorporated for maximum 2 polymorphic sites. They were called NemFopt and 18Sr2bRopt to distinguish them from the original ones (and from here on referred to as ‘adapted primer set’).
A gradient PCR (KAPA HiFi HotStart Ready Mix PCR kit, KAPA biosystems, Boston, MA, USA) was conducted to determine the most optimal annealing temperature for both primer sets (EcoF/EcoR and NemFopt/18Sr2bRopt, Figure 1). The master mix contained 12,5 mL of the 2× KAPA HiFi HotStart ReadyMix, 0.3 µM of each primer, 1 µL DNA extract and MilliQ water up to a volume of 25 µL. The temperature profile was as follows: 95 °C for 3 min; 30 cycles of 98 °C for 20 s, 55–68 °C for 15 s, 72 °C for 30 s; and a final step of 72 °C for 2 min.

2.5. NGS Library Preparation

Pure DNA was extracted from half of the replications of each nematode sample (Table 1) by the Qiagen method, while for the other half of the replications the adapted Holterman method was applied. A qPCR was executed on the extracted DNA to determine the maximum number of cycles allowed to prevent the amplification from going too far into the non-exponential phase causing an increased variation in yield of amplicons. The qPCR mix contained 10 µL of 2× SensiFast SYBR Hi-Rox master mix, 500 nM of the forward and reverse primers of one of the primer sets, and MilliQ water up to a final volume of 20 µL. The temperature profile was as follows: 10 min at 95 °C, 40 cycles of 95 °C for 15 s, 64 °C for 30 s, and 72 °C for 1 min. After the number of cycles was determined, a PCR, referred to as ‘amplicon PCR’, was executed. The amplicon PCR mix contained 12.5 mL of 2× KAPA HiFi HotStart ReadyMix, 0.75 µM of each primer elongated with the Illumina adapter overhang nucleotide sequence (5’-TCGTCGGCAGCGTCAGATGTGTATAAGAGACAG-3’ for a forward primer and 5’- GTCTCGTGGGCTCGGAGATGTGTATAAGAGACAG-3’ for a reverse primer), 2 µL DNA extract, and MilliQ water up to a volume of 25 µL. The temperature profile of this PCR was 95 °C for 3 min; the previously determined number of cycles of 98 °C for 20 s, 64 °C for 15 s, 72 °C for 30 s; and a final step of 72 °C for 2 min. To verify the amplification, an agarose gel electrophoresis with Midori Green Advanced DNA stain (Nippon Genetics Europe GmbH, Düren, Germany) was performed. The amplicons were visualized in a gel imaging system (Azure Biosystems c150, Dublin, CA, USA) and separated from unincorporated primers, dNTPs, and primer dimers using a DNA-purification method with magnetic beads (CleanNA, GC Biotech BV., Alphen aan den Rijn, the Netherlands). The same temperature profile, with 10 cycles only, was used during the next PCR, referred to as ‘index PCR’. Also the master mix was identical to that of the amplicon PCR but with the replacement of the primers by a different combination of index primers for each amplicon PCR sample. Each index primer was composed of a sequence specific for Illumina sequencing, a unique 8 bp multiplex identifier (N7xx or S5xx, Illumina Nextera XT Index Kit v2, Illumina Inc., San Diego, CA, USA) and the Illumina adapter overhang sequence. Some of the amplicons were visualized by electrophoresis as mentioned before and all of the amplicons were purified using the same method as mentioned before. Finally, the amplicons were quantified fluorometrically and pooled in equimolar concentrations (10 nM) for sequencing. The pooled sample was sent to a service institute for sequencing on an Illumina MiSeq sequencer with PE300 reads (Oklahoma Medical Center, Oklahoma City, OK, USA).

2.6. Data Analysis

The normal distribution and homogeneity of variance of the data retrieved from the DNA-extraction test were checked by a Normal Probability Plot and Levene’s test. Data were then analyzed by a one-factor ANOVA followed by the Tukey’s Honest Significant Differences test to reveal which DNA-extraction combinations (DNA-extraction method with pre-treatment) significantly differed from each other and yielded the highest concentration of DNA (Dell Statistica version 12, Dell Inc., 2015).
Primer sequences were removed from the obtained reads using Trimmomatic v0.32 [33]. All subsequent analyses were done in R 3.4.3 [34] using the package DADA2 [18]. This software package does not use the concept of OTU clustering, but infers sequence variants directly. The authors stated that in mock communities DADA identifies more real variants and outputs fewer spurious sequences than other methods. The successor, DADA2, an open-source R package, extends and improves the DADA algorithm by implementing a new quality-aware model of Illumina-amplicon errors and the full amplicon workflow starting from filtering, dereplication, chimera identification, until merging paired-end reads. In the filtering step, forward reads were trimmed to 276 bp and 3 errors were allowed (maxEE), while reverse reads were trimmed to 250 bp with a maxEE of 5. Other steps were done using the default parameters. Finally, the sequences were compared with our sequence database to link them to a certain nematode taxon using the naive Bayesian classifier method [35] assigning taxonomy across multiple ranks (e.g. Kingdom to Genus) with minimum bootstrapping support of 80. In addition, all sequences were blasted against the non-redundant database (nr) of Genbank (standard nucleotide blast, [28]) to confirm their taxonomic assignment. Relative abundances for each sequence variant per sample were calculated and exploratory barplots were made.

3. Results

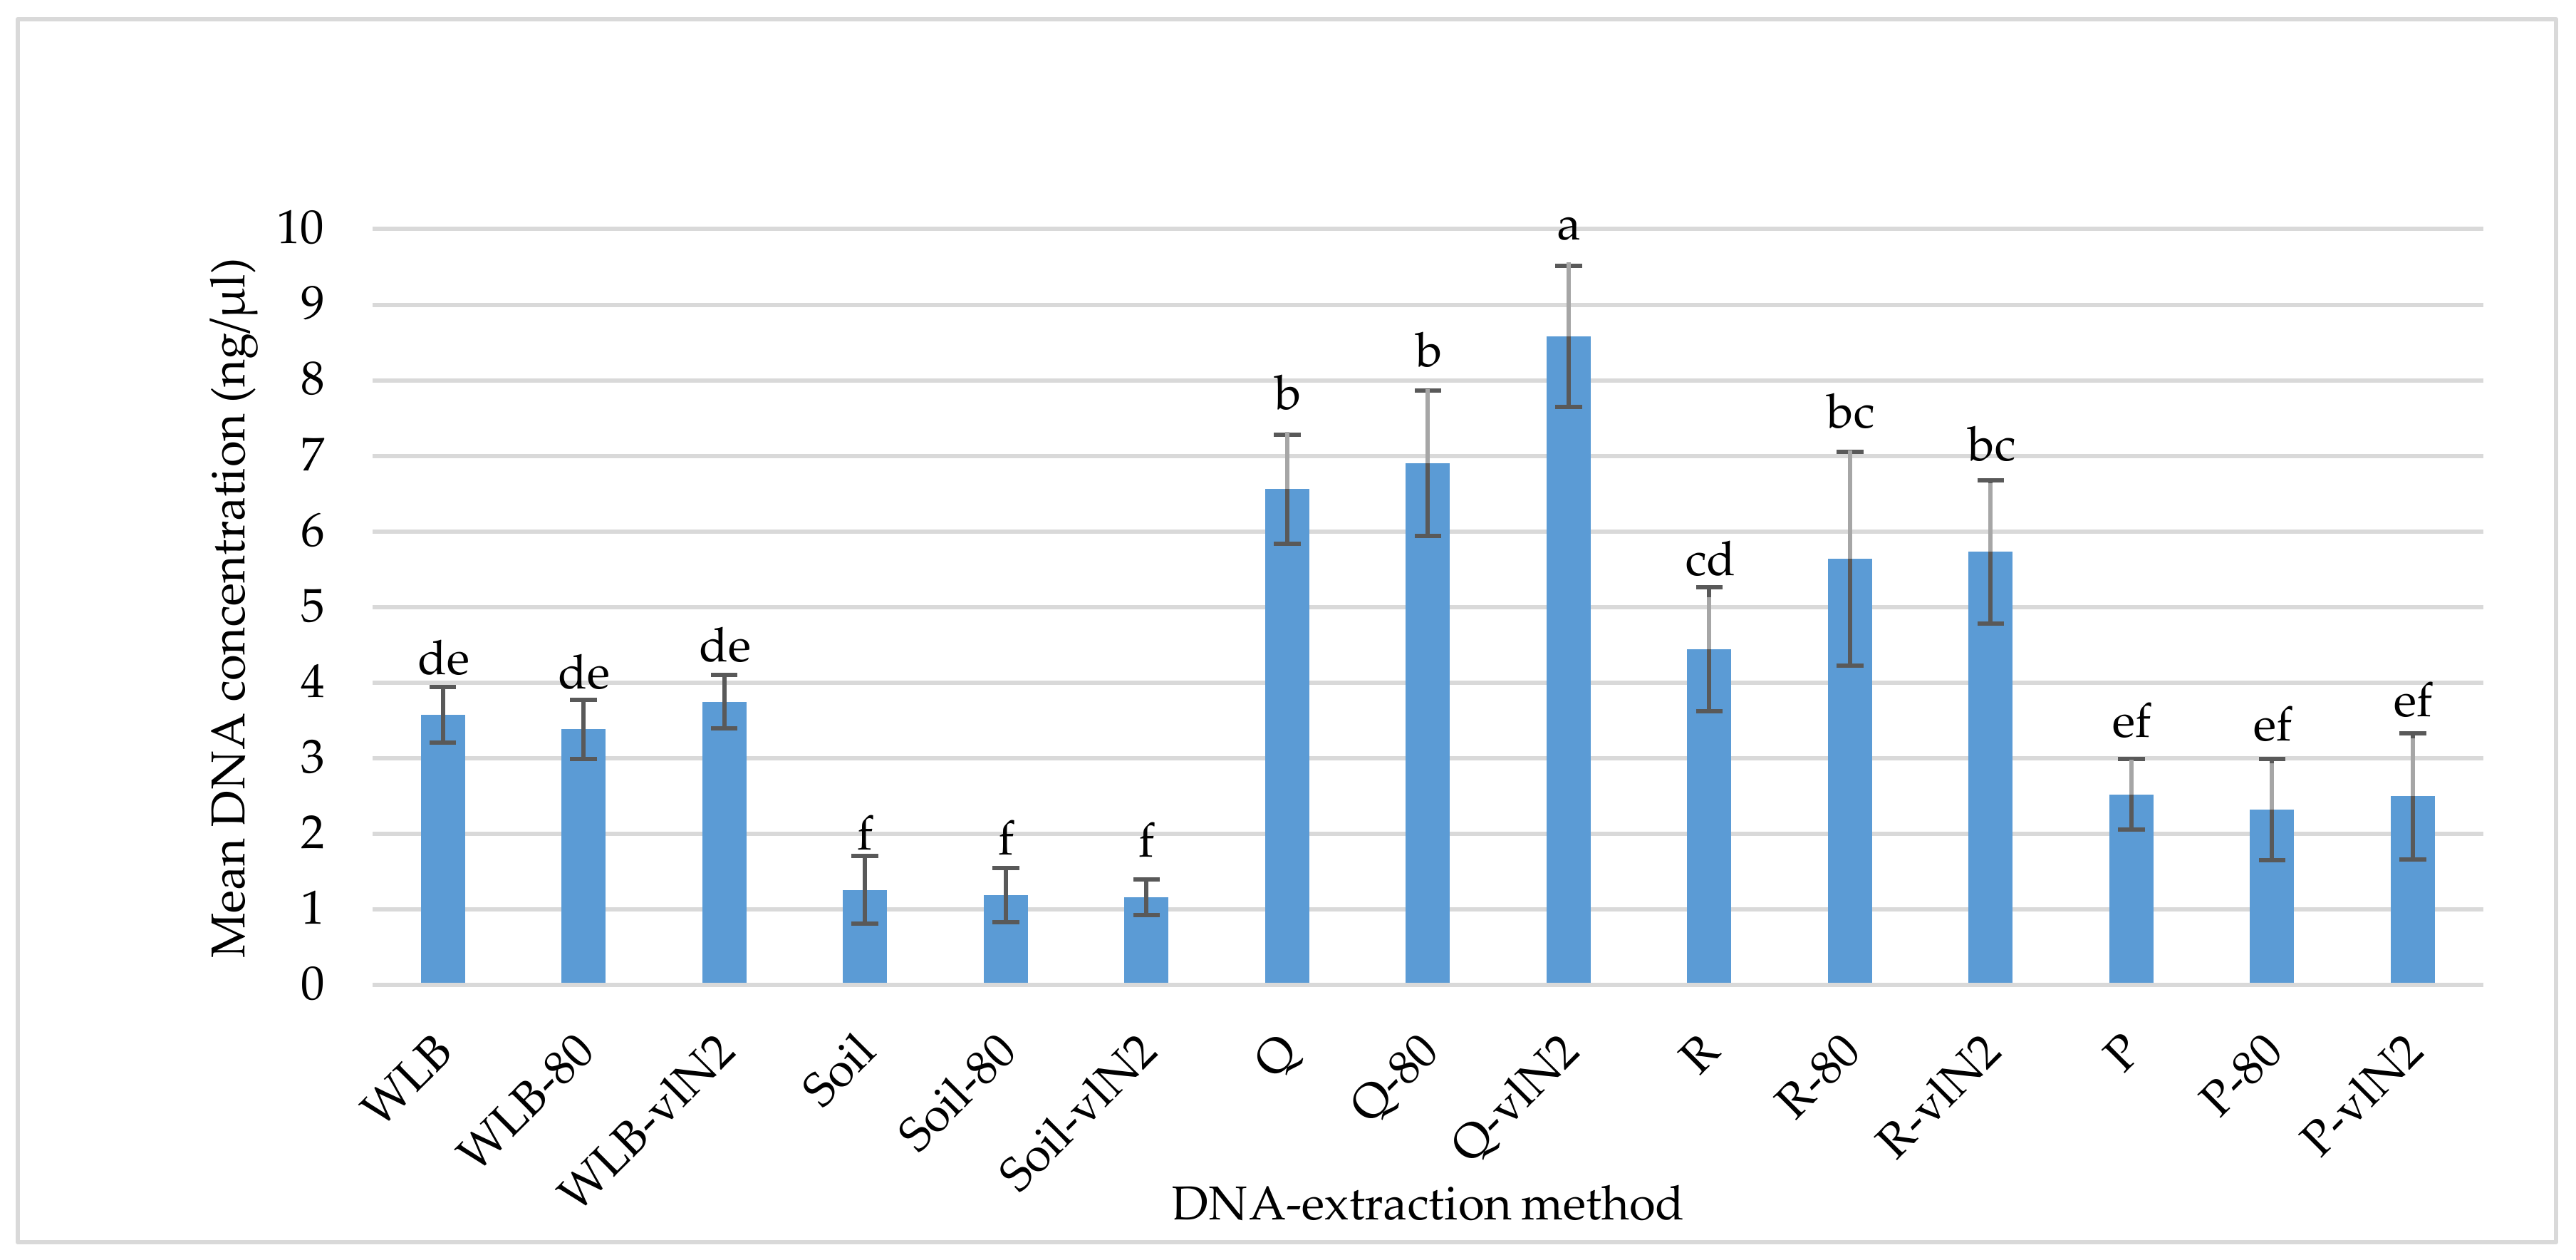
3.1. DNA-extraction Test

The 15 DNA-extraction procedures yielded different amounts of DNA from the nematode suspensions containing about 4000 individuals (p < 0.001) (Figure 2). The procedure yielding most DNA was the pre-treatment in liquid nitrogen followed by the Qiagen method (Figure 2, Supplementary File S3). Quantitative PCR demonstrated amplifiability of these DNA-extracts (Ct between 10.22 and 10.99; Mean Ct = 10.68; StDev. = 0.29). So, the Qiagen method combined with the liquid nitrogen step was selected for the DNA-metabarcoding tests.
One additional DNA-extraction method was retained: the adapted Holterman method. Firstly, statistical analysis revealed that this method was very repeatable, irrespective of the pre-treatment (VC 10.6%, Supplementary File S3). However, we retained the combination with the liquid nitrogen pre-treatment because this combination showed the lowest VC (9.5%) compared to the other pre-treatments (VC 10.3 and 11.6%), and it made the DNA-extraction procedure more uniform with the other selected method. Secondly, the results of the qPCR demonstrated less variable Ct-values (Ct between 11.73 and 12.23; Mean Ct = 11.97; StDev. = 0.21; VC = 1.77%) compared with the selected Qiagen method combined with the liquid nitrogen pre-treatment (Supplementary File S3). From here onwards, each reference to the Qiagen or adapted Holterman method includes the liquid nitrogen pre-treatment.

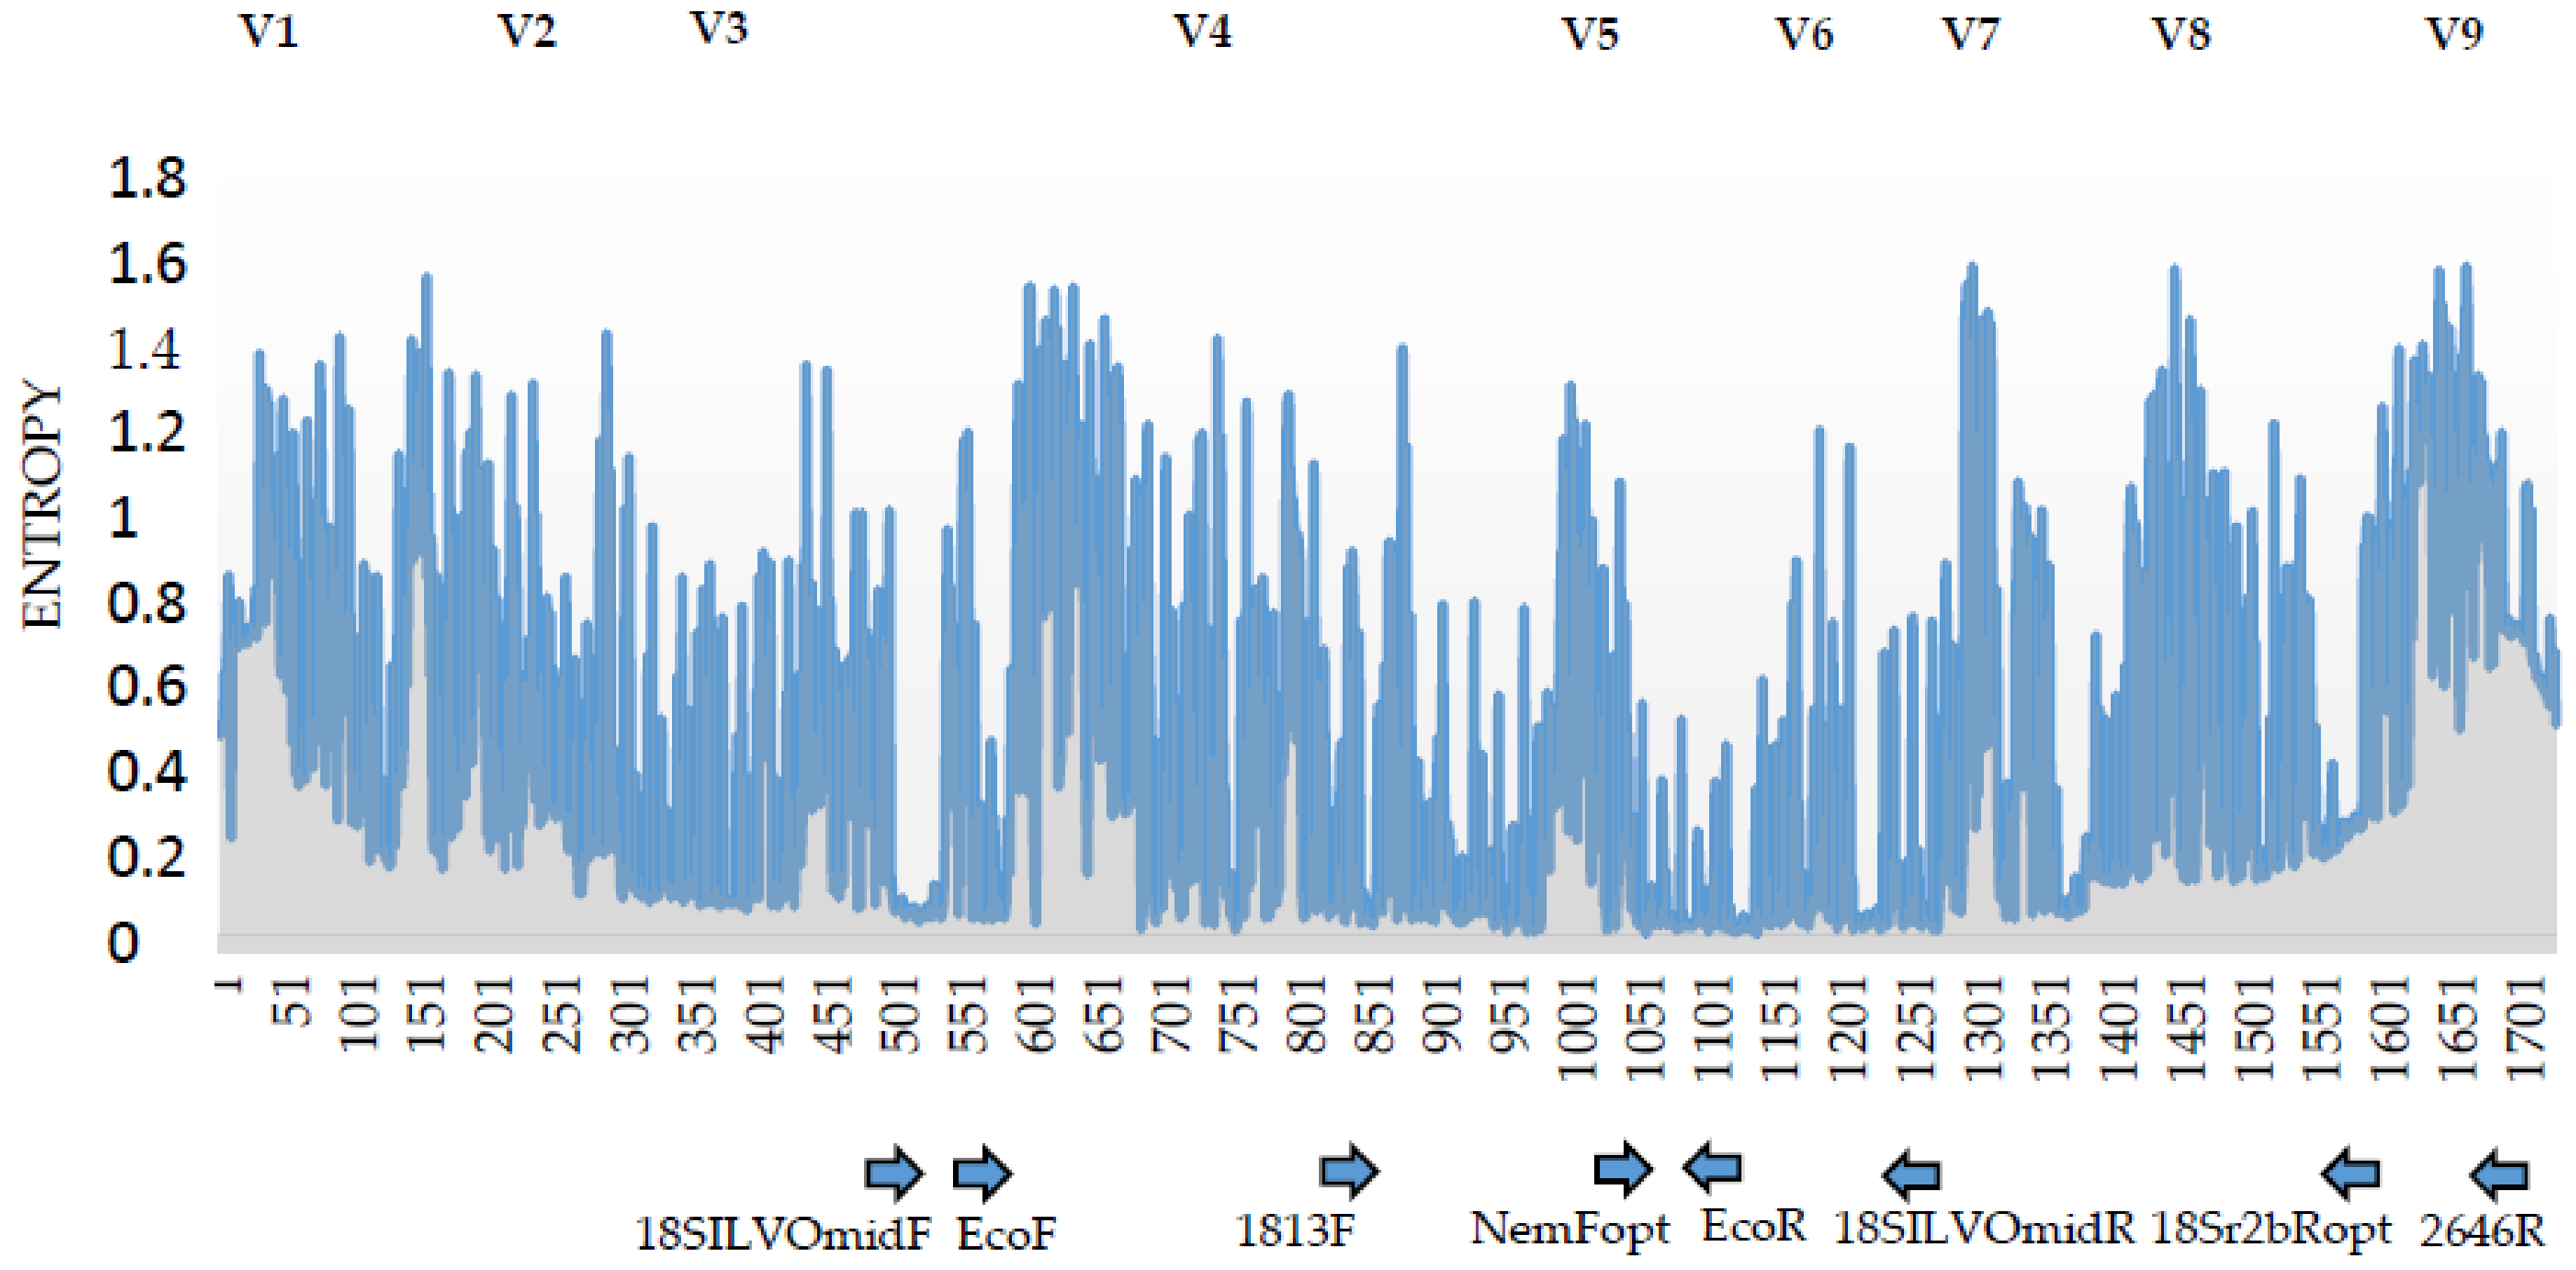
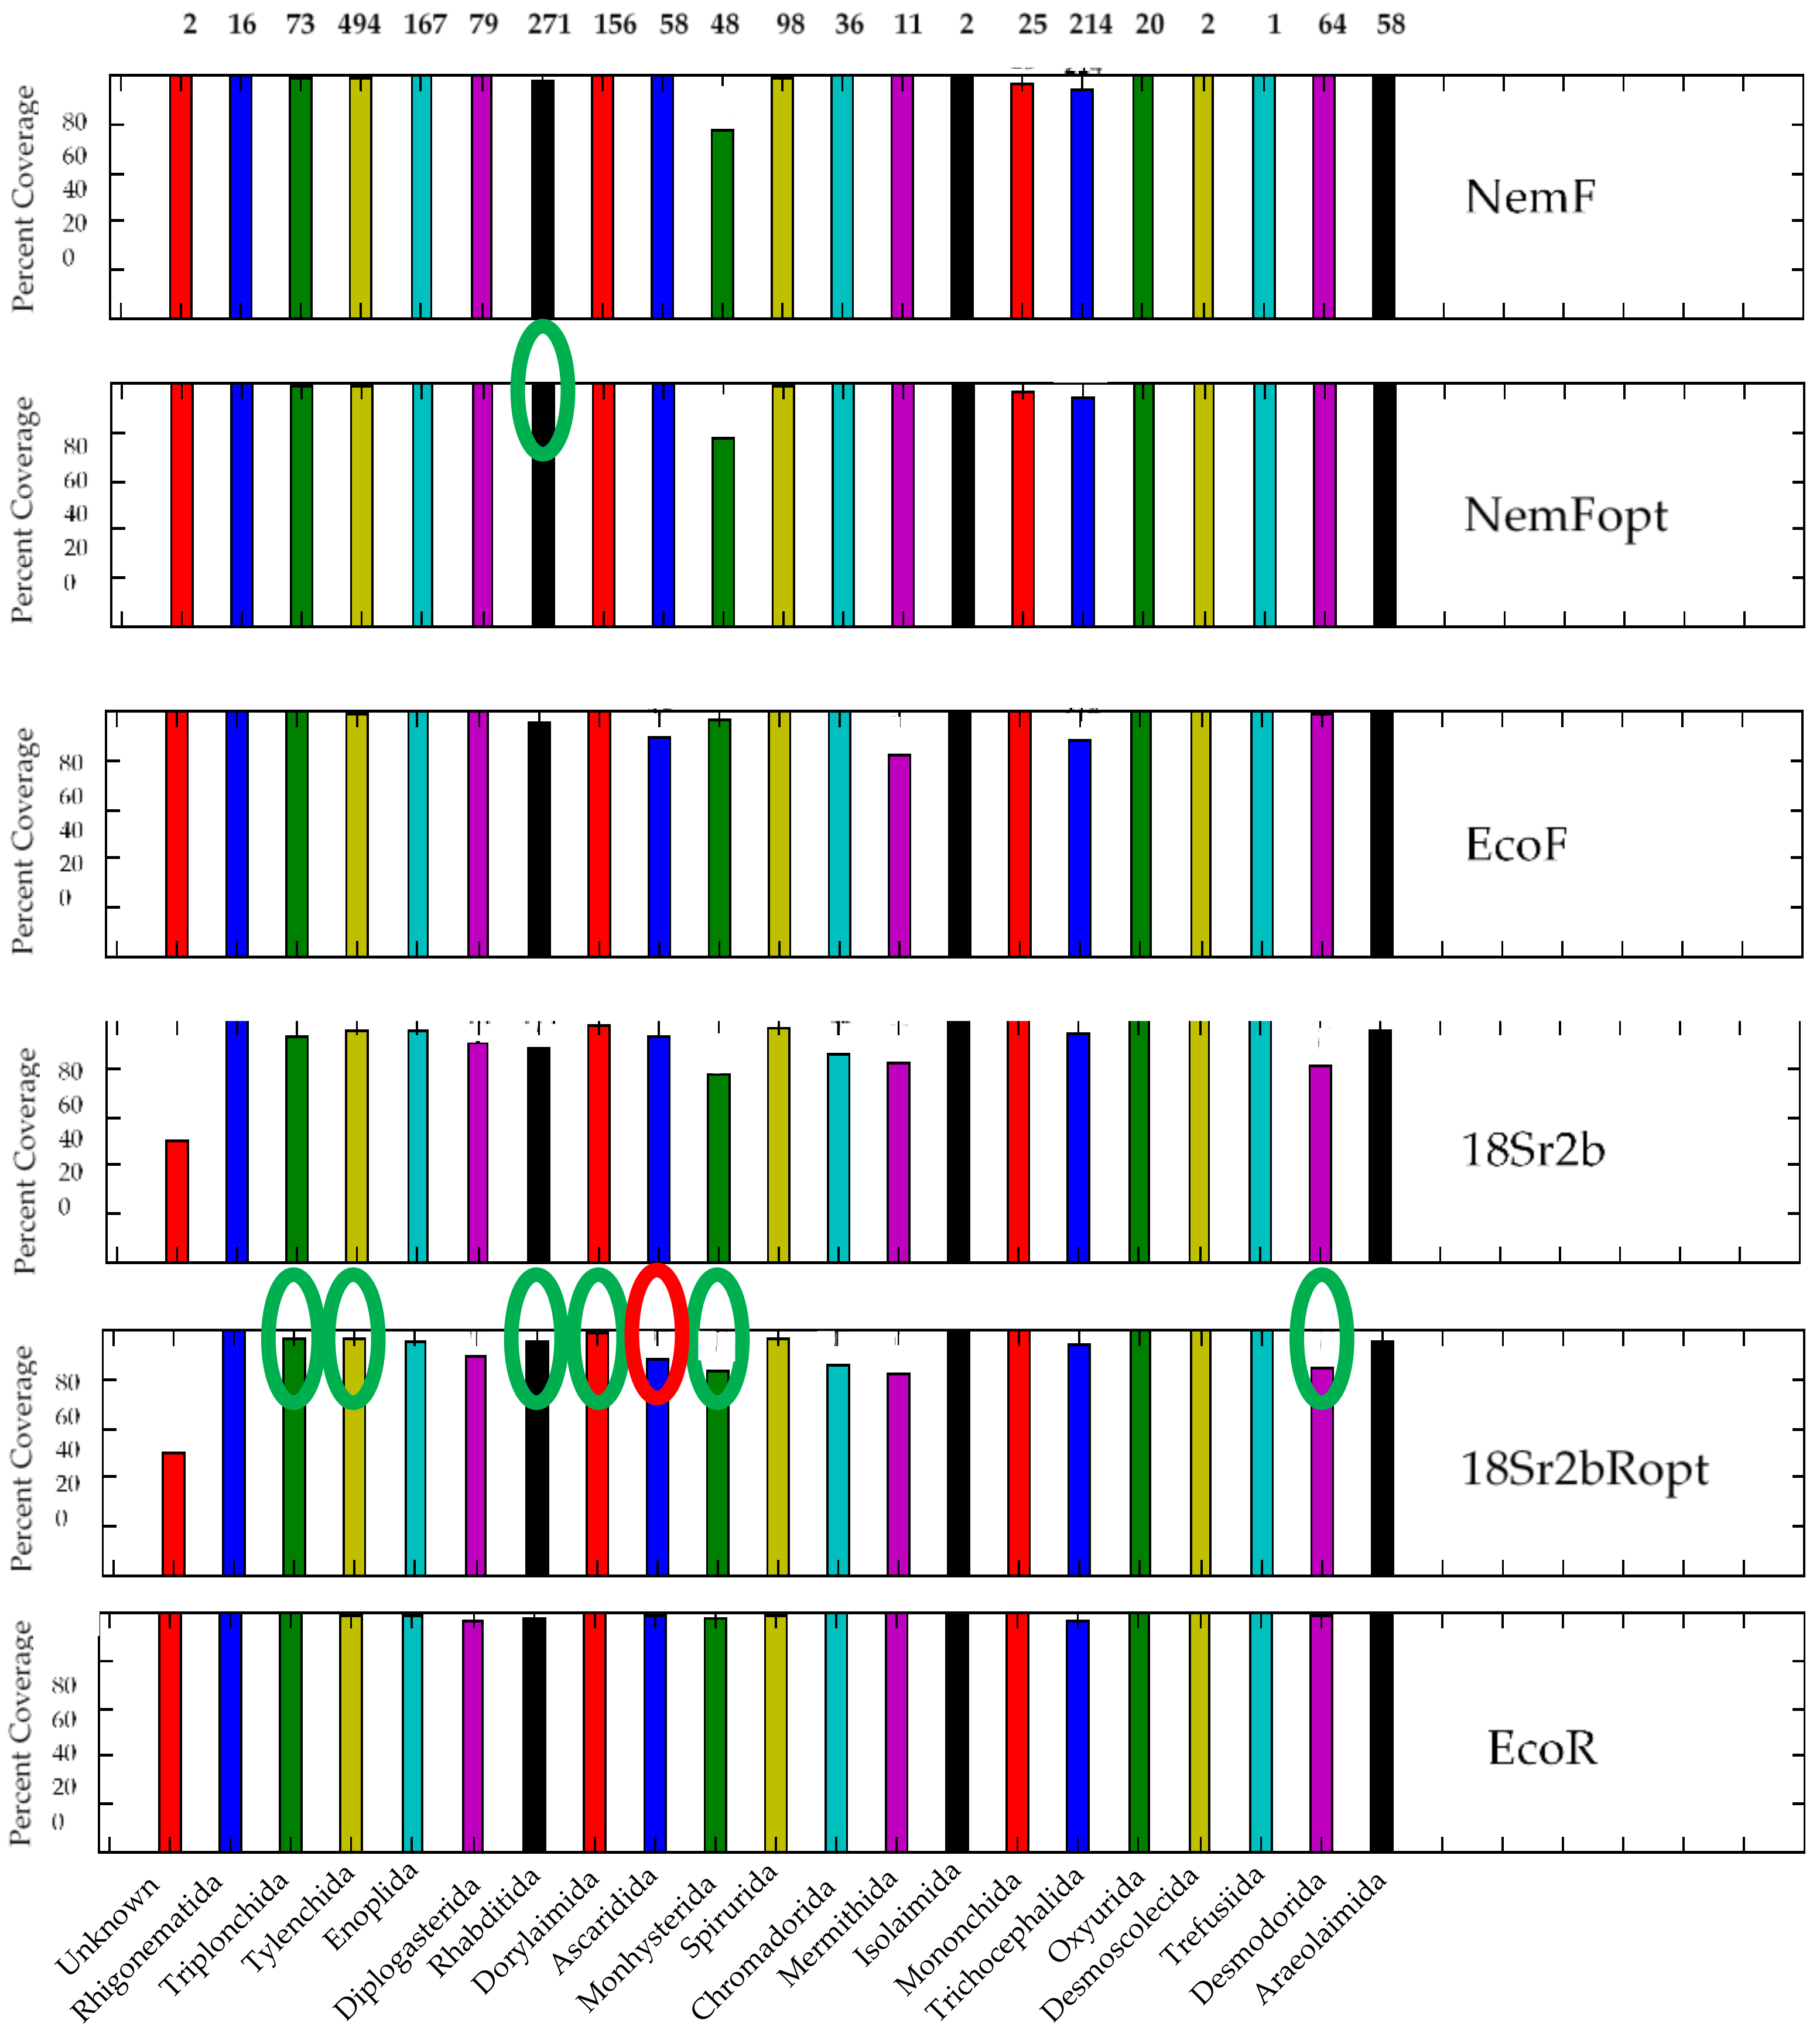
3.2. Analysis of the 18S rDNA Primer Pairs for Nematode DNA-Metabarcoding

An alignment with sequences from a wide taxonomic range of 63 primarily soil inhabiting nematode species was made. The alignment (Supplementary File S2) showed several conserved and less conserved regions in agreement with the V1-V9 nomenclature for variable regions of the 18S rRNA gene [36] (Figure 1). The alignment made it practically more easy to select a part of the 18S gene more downstream compared to the primers from Sapkota and Nicholaisen [14] to design a new set of primers (EcoF and EcoR) amplifying the V4-V5 regions and to introduce two degenerate positions in the forward primer to improve taxonomic coverage. We changed the primers amplifying the V6-V8 region of the 18S rRNA gene reported in Sapkota and Nicolaisen [14] by adding one and two degenerated positions in the sequences of the forward (NemFopt) and reverse (18Sr2bRopt) primer, respectively, also to improve the taxonomic coverage. Moreover, the reverse primer was shifted 4bp upstream into a more conserved region (Supplementary File S2), in an attempt to avoid missing certain nematode species, e.g., those belonging to the family Rhabditidae as reported by Darby et al. [13].
PrimerProspector [30] showed that the resolving taxonomic power of the adapted primer set NemFopt and 18Sr2bRopt should be better than that of the original primer set when evaluated with our database containing 1896 sequences (Figure 3). The taxonomic coverage included the Rhabditida for which problems were reported before [13]. PrimerProspector also demonstrated that the taxonomic coverage of our newly designed primer set is expected to be even better compared to the adapted primer set (Figure 3). They should be able to produce an amplicon from 95.6% of the sequences in our database with an average length of 510.4 bp compared with 92.5% with an average length of 489.9 bp of the adapted primer set (max. 1 mismatch per primer allowed).
The gradient PCR revealed that the annealing temperature for amplicon PCR can be set between 55 °C and 68 °C. It is generally accepted that higher annealing temperatures increase the specificity but tend to reduce the yield of the amplification, while lower temperatures cause the opposite. That is why we retained an annealing temperature of 64 °C which should provide a good yield and specificity. Based on the results of the qPCR, we selected for the amplicon PCR assay 30 cycles for the single species samples using the primers EcoF and EcoR, 25 cycles for the single species samples using the primers NemFopt and 18Sr2bRopt, and 20 cycles for the mock community samples independent of which primer set was used.

3.3. DNA-Metabarcoding Data

The DNA-metabarcoding data used for this paper are submitted at the NCBI SRA databank under bioproject code PRJNA497979.

3.3.1. The Number of Reads Per Sample and Taxonomic Assignment Depends on the DNA-Extraction Method and Primer Pair

The number of read clusters for all samples together was 2,851,024. After quality filtering, merging forward and reverse reads, and removal of chimeric sequences, 1,529,449 or 53.65% were used for further analysis. The number of retained sequences for each sample with exclusion of the NTC’s (No Template Controls) ranged between 1720 and 67,219, except for one sample (M20WLB218S, Supplementary File S4, tab 2) with 98 reads. This sample contained 240 individuals which is much more than the number of reads, and was therefore excluded for further analysis. The NTC’s contained an average of 70 reads only and were considered as clean. The number of retained sequences was higher with DNA extracted with the Qiagen method (1,025,970 reads representing 60.4% of all reads, average of 19,730 reads) than with DNA extracted with the adapted Holterman method (492,696 representing 32.21% of all reads, average of 9475 reads) despite pooling the samples at equimolar levels. Also, the number of retained sequences was higher when amplicons were prepared with the NemFopt and 18Sr2bRopt primers (985,089 reads representing 64.4% of all reads, average of 18,944 reads) compared with our primers EcoF and EcoR (533,577 reads representing 34.9% of all reads, average of 10261 reads). The length of the retained sequences after amplification using the adapted primer set ranged between 92 and 507 bp, with approximately 86% between 484 and 493 bp, and between 223 and 536 bp with approximately 85% between 501 and 518 bp when using the eco primer set. Only 0.6% of the sequences using the adapted and eco primer set were shorter than 400 bp. More details can be found in Supplementary File S4, tab 1. These shorter fragments are sequences from Streptophyta, Gastrotricha, and nematode species that could not be identified as revealed after blasting against the non-redundant database of GenBank [28].
More than 95% of the sequences obtained from the samples consisting of one species derived from the pure cultures Bx, Dd, and Pa (Table 1) resulted in correct identifications at genus level, regardless of the selected DNA-extraction method. For the other samples with one species (Cr and Par), however, <20% of the sequences of the Par samples were attributed to the genus Paratylenchus and none (0%) of the sequences were identified as belonging to the genus Mesocriconema for the Cr samples when using the Qiagen method. While for the adapted Holterman method around 90% of the sequences were correctly attributed to either Paratylenchus (except for one sample with only 14%) or Mesocriconema (except for one sample with 62%). More data on the composition of the samples can be found in Supplementary File S4, tab 3 (counts) and tab 4 (percentages).
We tested two primer sets amplifying different regions of the 18S rDNA: the adapted primer set NemFopt and 18Sr2bRopt based on Sapkota and Nicolaisen [14] (V6-V8 region), and our newly developed primer set EcoF and EcoR (V4-V5 region). For the M20 samples of which amplicons were generated using the adapted primer set, nine out of 11 nematode cultures—the 12th nematode culture contained individuals of the Dorylaimidae family not further identified—were characterized at genus level of which seven even up to species level. Acrobeloides nanus and Cephalobus sp. were annotated together as family Cephalobidae. When using the eco primer set, A. nanus and Cephalobus sp. were annotated together as genus Acrobeloides, Steinernema feltiae was identified at genus level but not at species level and Mesorhabditis sp. was not detected. So, it seems that the eco primer set yields, on the one hand, slightly better taxonomic resolution at the genus level, but on the other hand makes more mistakes on species level and causes a drop in sensitivity. The results obtained with the artificial community Mvar were similar to those for the M20 samples. Oscheius tipulae could not be detected in some of the replicates where only two individuals of this species were present in a total of 232 individuals (relative abundance <1%), independent of the primer set that was used. Apparently this amount is very close to the detection limit of our DNA-metabarcoding procedure for this species. More detailed data can be found in Supplementary File S4, tab 4.

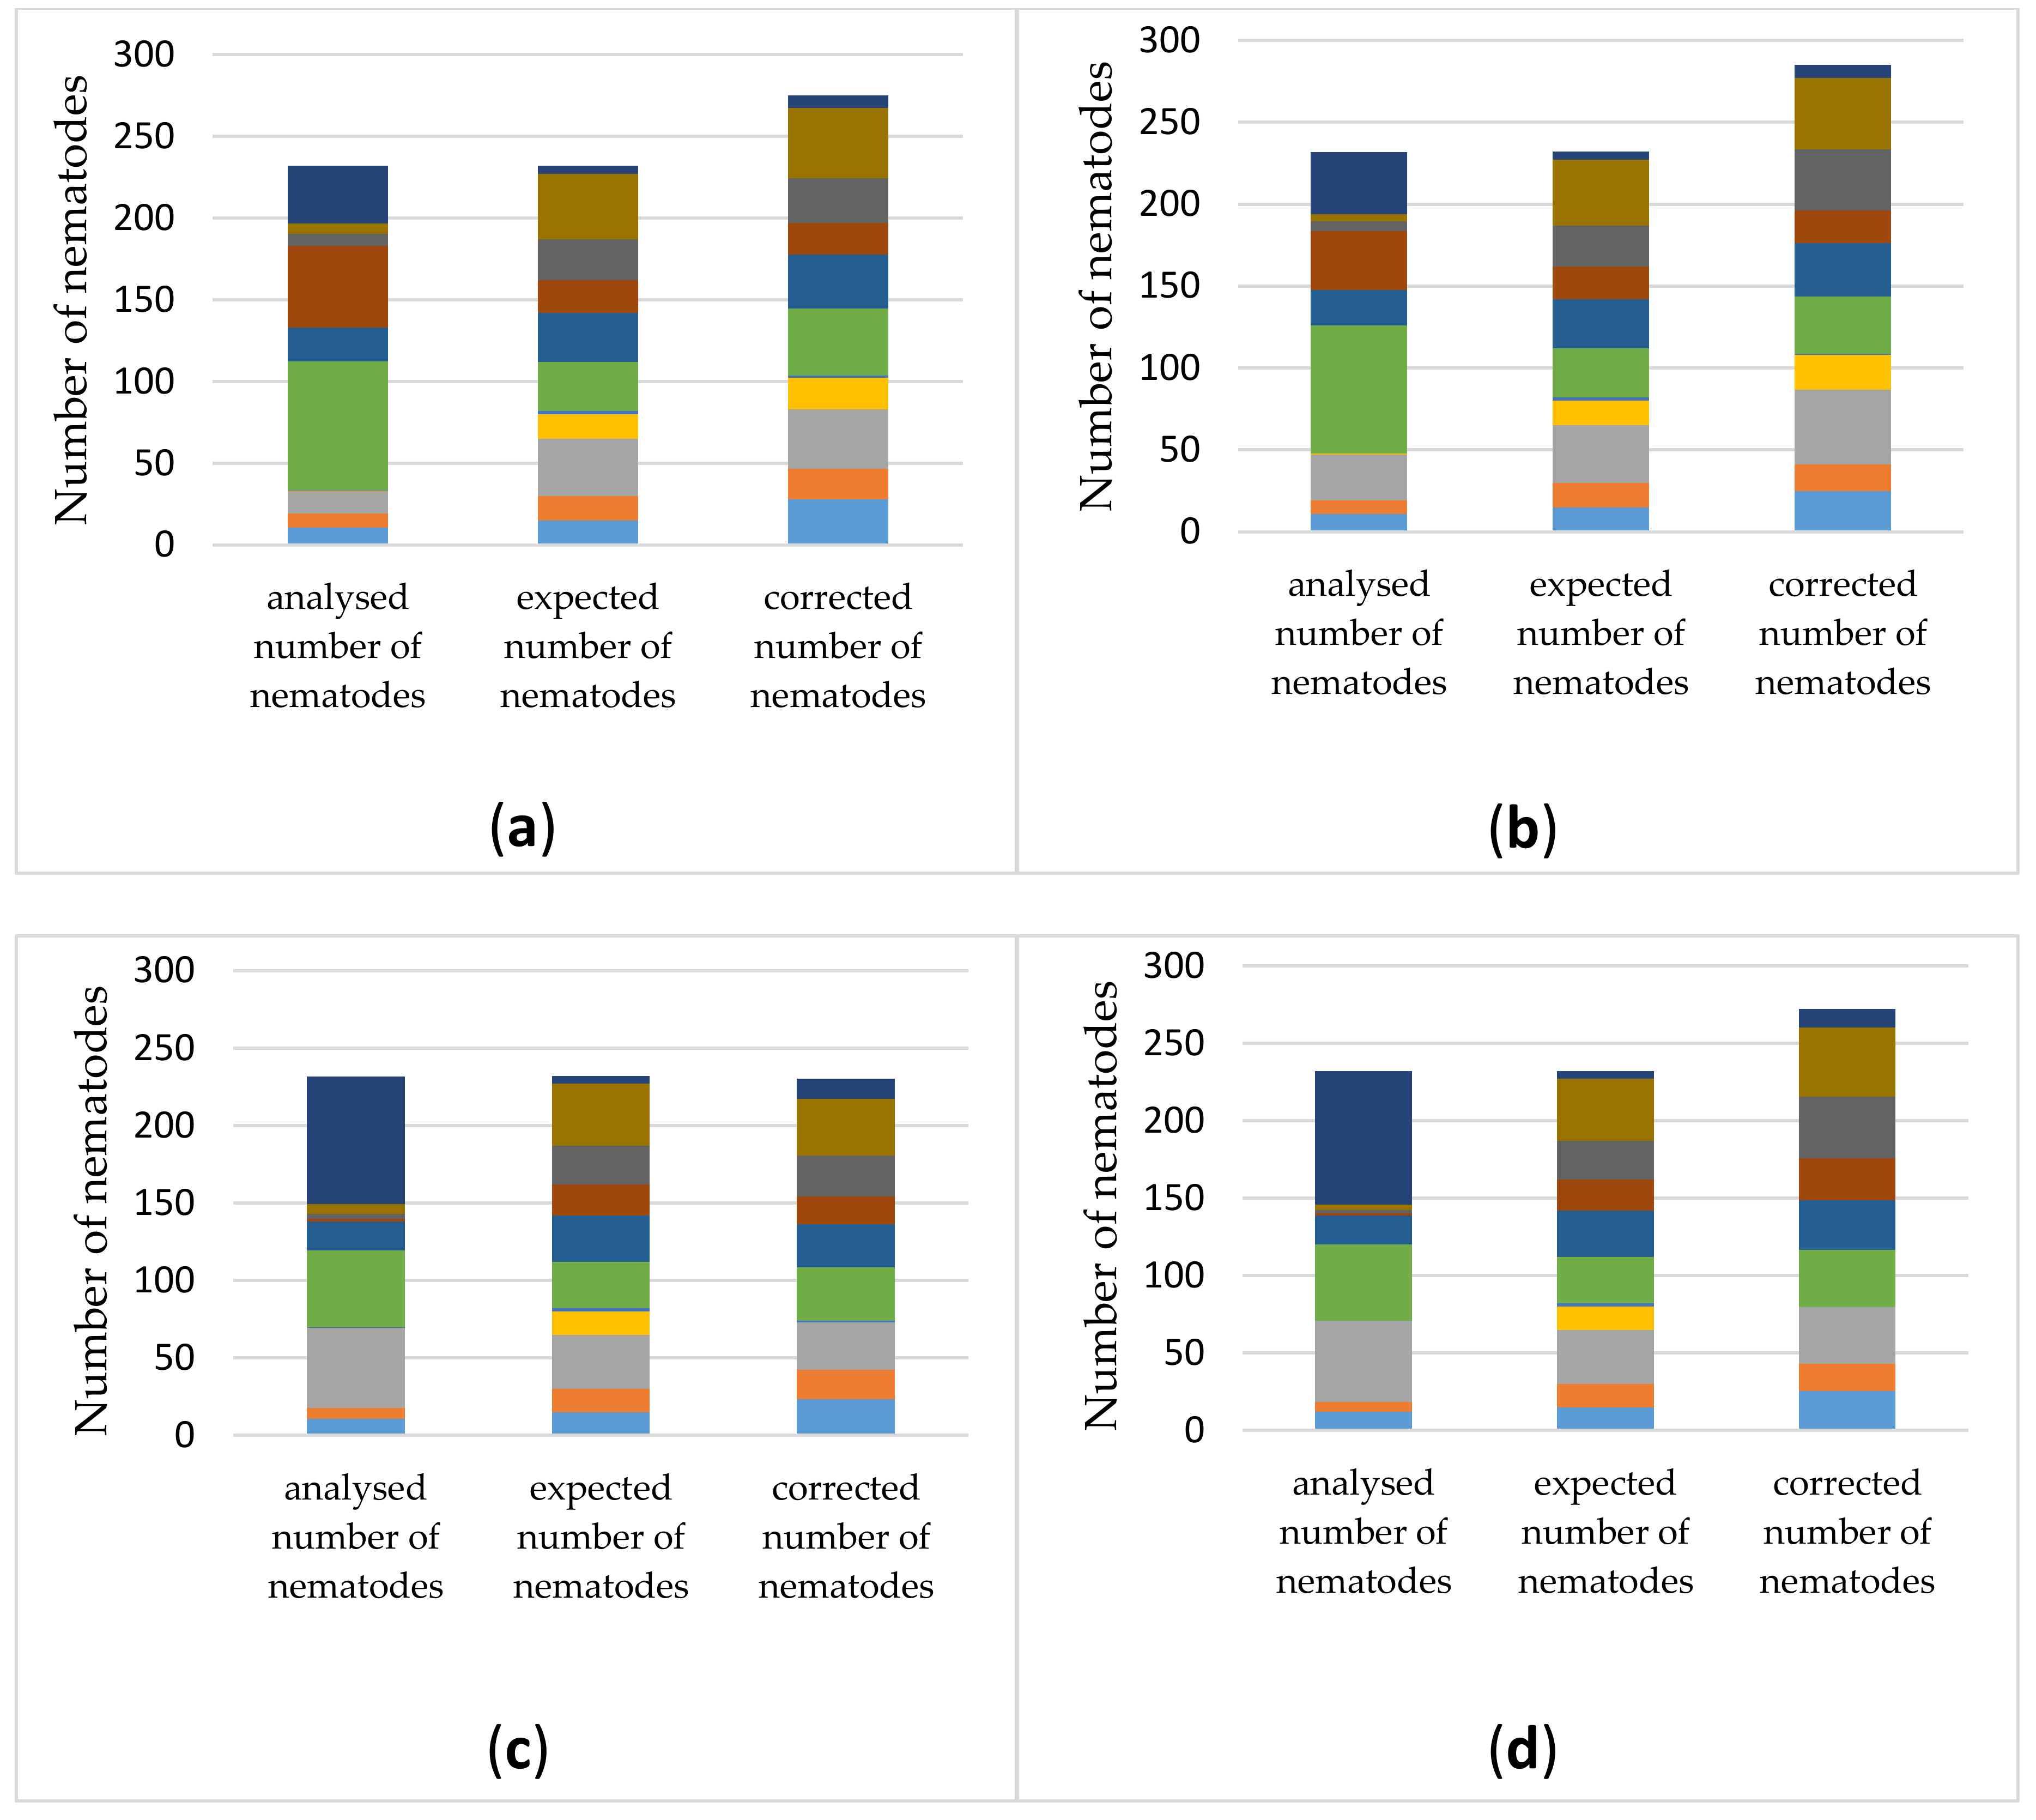
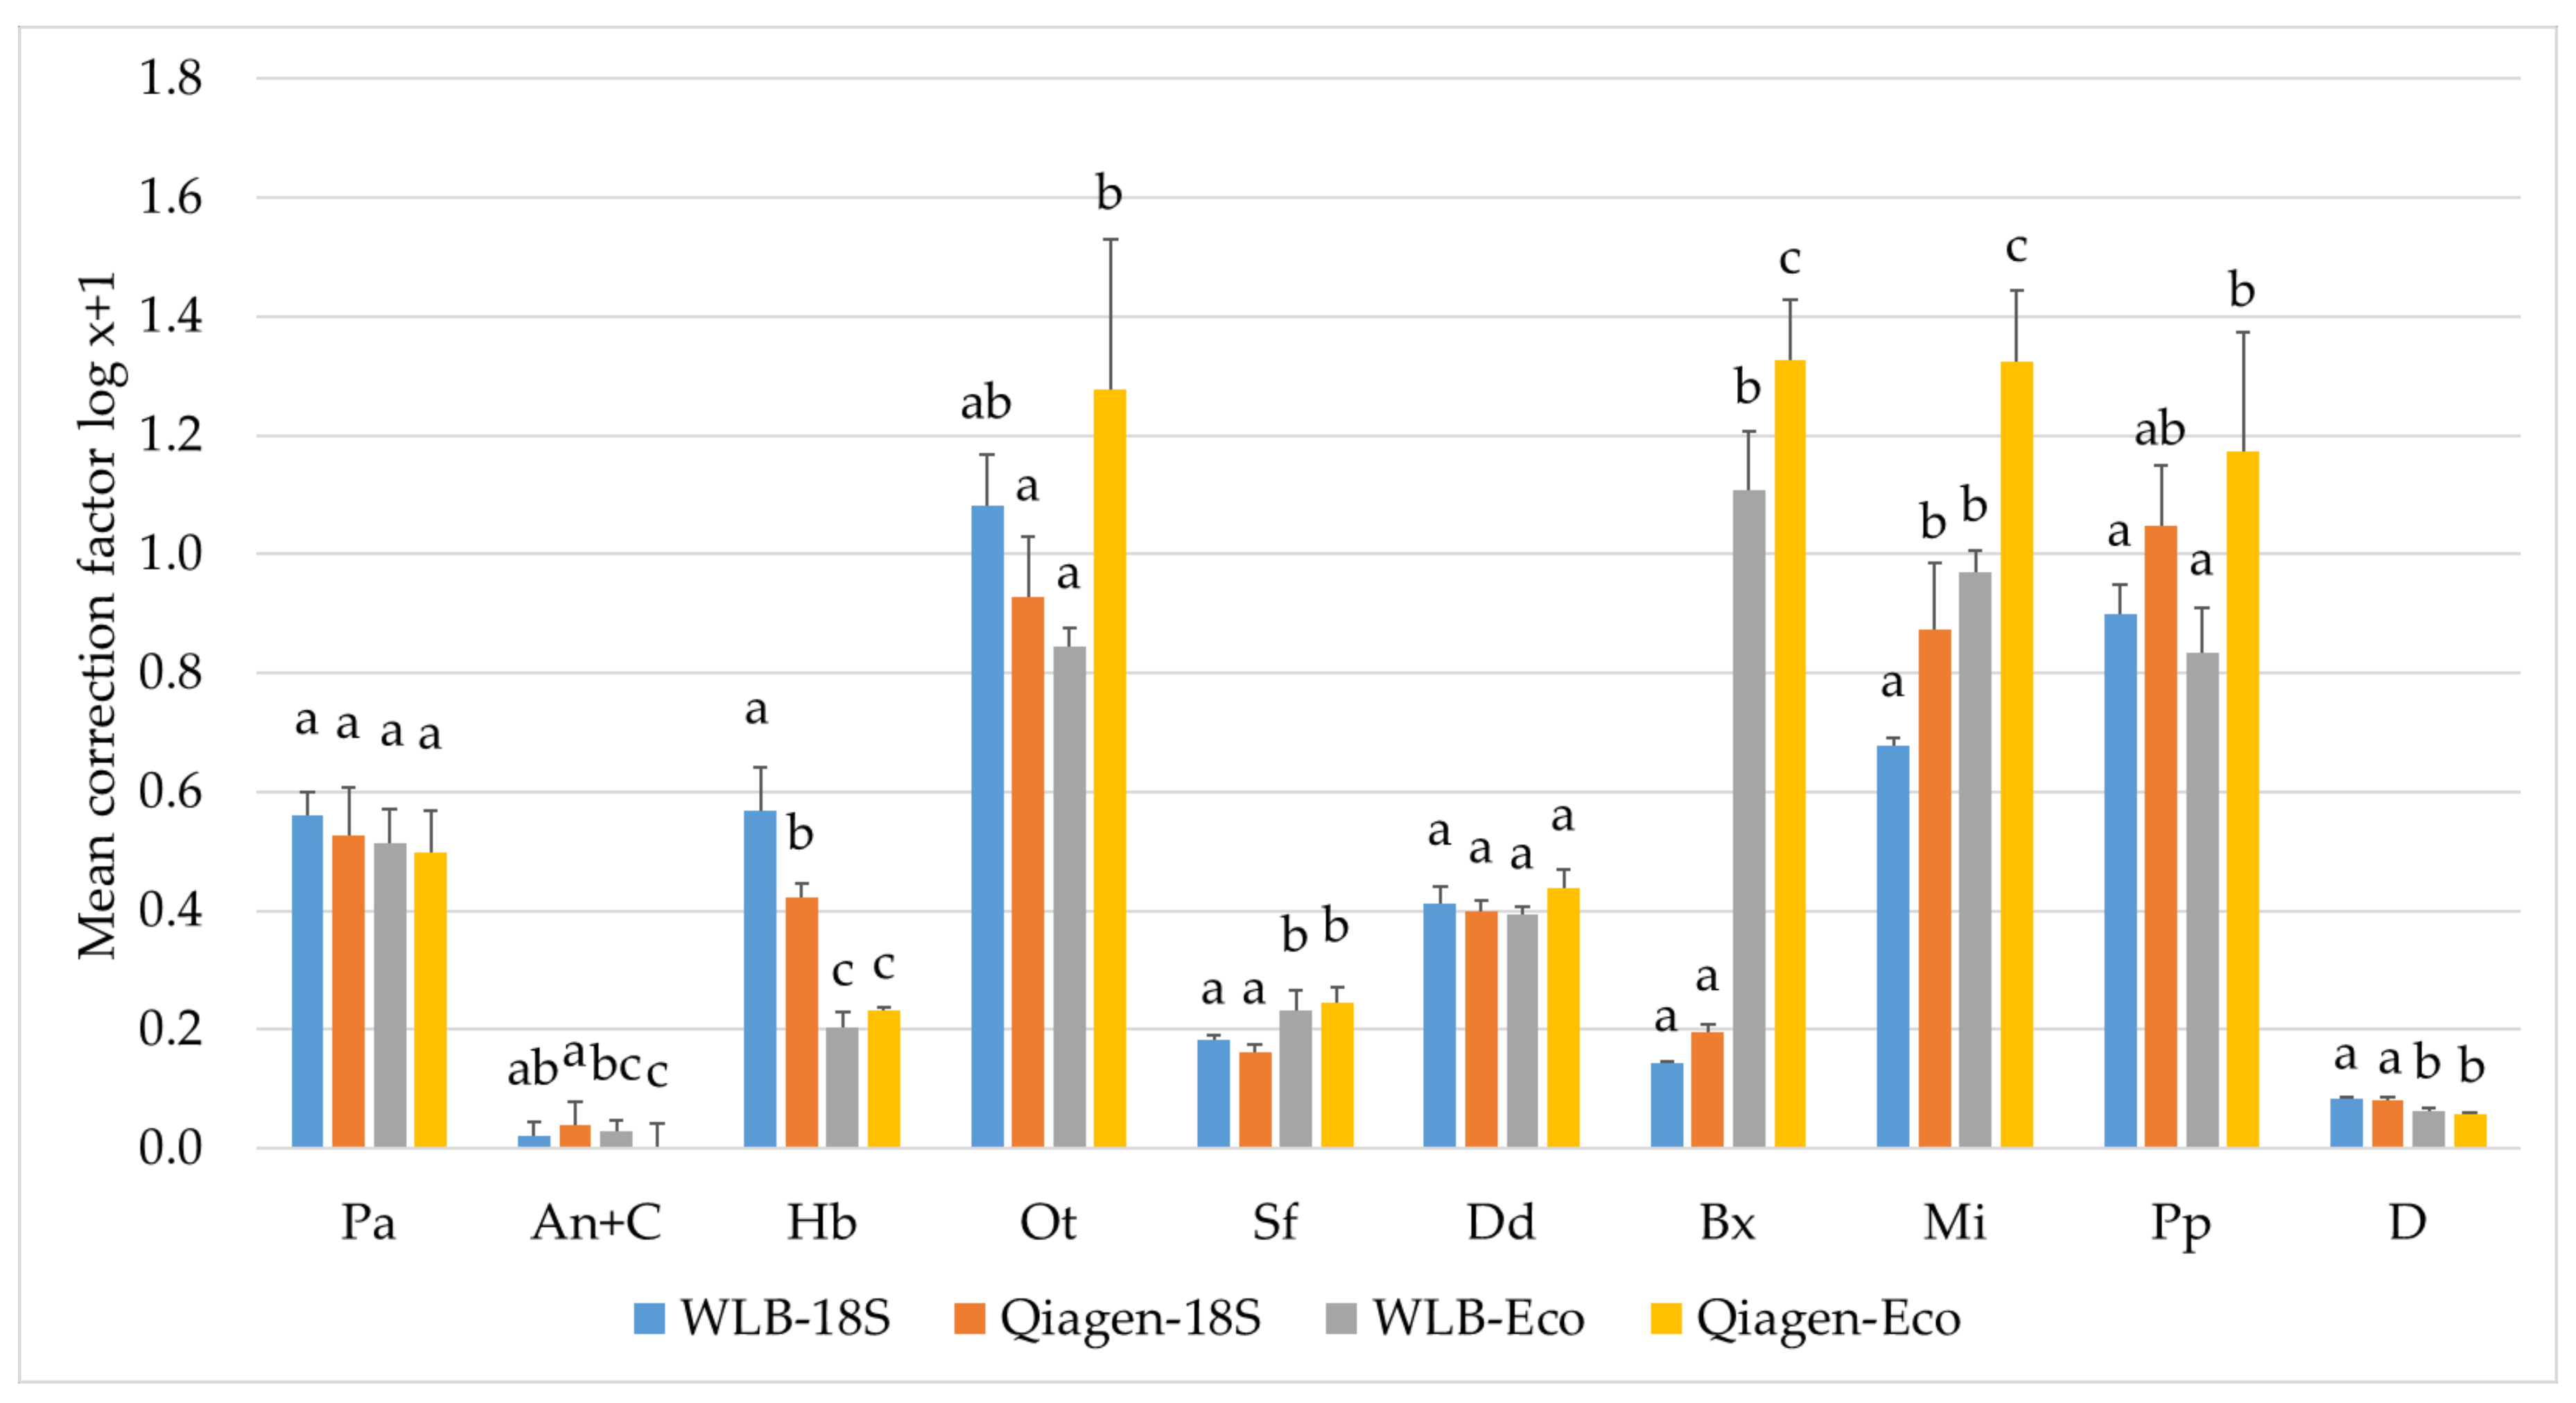
3.3.2. Estimating Relative Abundances Is More Accurate When Using Protocol-Specific Correction Factors

The results of the mock communities Mvar and M20 confirmed that estimating nematode abundances is inaccurate when using DNA-metabarcoding (Figure 4). Although the M20 samples contained the same number of individuals of each nematode species present, their relative abundance based on the results of the DNA-metabarcoding was not the same. This is in agreement with previous results [13]. Some genera were overrepresented (e.g., S. feltiae), while others were underrepresented (e.g., P. penetrans) (Figure 4). To correct this over- or under-estimation of nematode abundance, a correction factor was calculated for each nematode species present in a M20 sample and this for each of the four methods (a combination of the two retained DNA-extraction methods and applied primer sets) separately. The correction factors were calculated as follows: resulting mean percentage relative abundance (four repeats)/8.33% (representing 20 individuals of each nematode species in a total of 240 individuals). When applying the correction factor based on an M20 sample to the Mvar sample with corresponding DNA-extraction method and primer set combination, the agreement between DNA-based and real relative abundance of each nematode taxa of the Mvar samples improved a lot (Figure 4). Although it is clear that for some nematode genera the correction factor is stable across the methods used (for example Pa and Dd), statistical analysis revealed that applying a set of correction factors from one method to the other is not justified as the correction factors for some nematode species vary significantly between methods (Figure 5). The effect of the primer is larger than the effect of the DNA-extraction method in this M20 nematode mixture. For example, Heterorhabditis sp. are overrepresented in the eco primer set, but underrepresented in the adapted primer set regardless of the DNA-extraction method; while for Bursaphelenchus sp. it is the other way around. When looking at the different DNA-extraction methods but using the same primers, the over- or underrepresentations are always following the same trend. More details can be found in Supplementary File S4, tab 5 and 6.

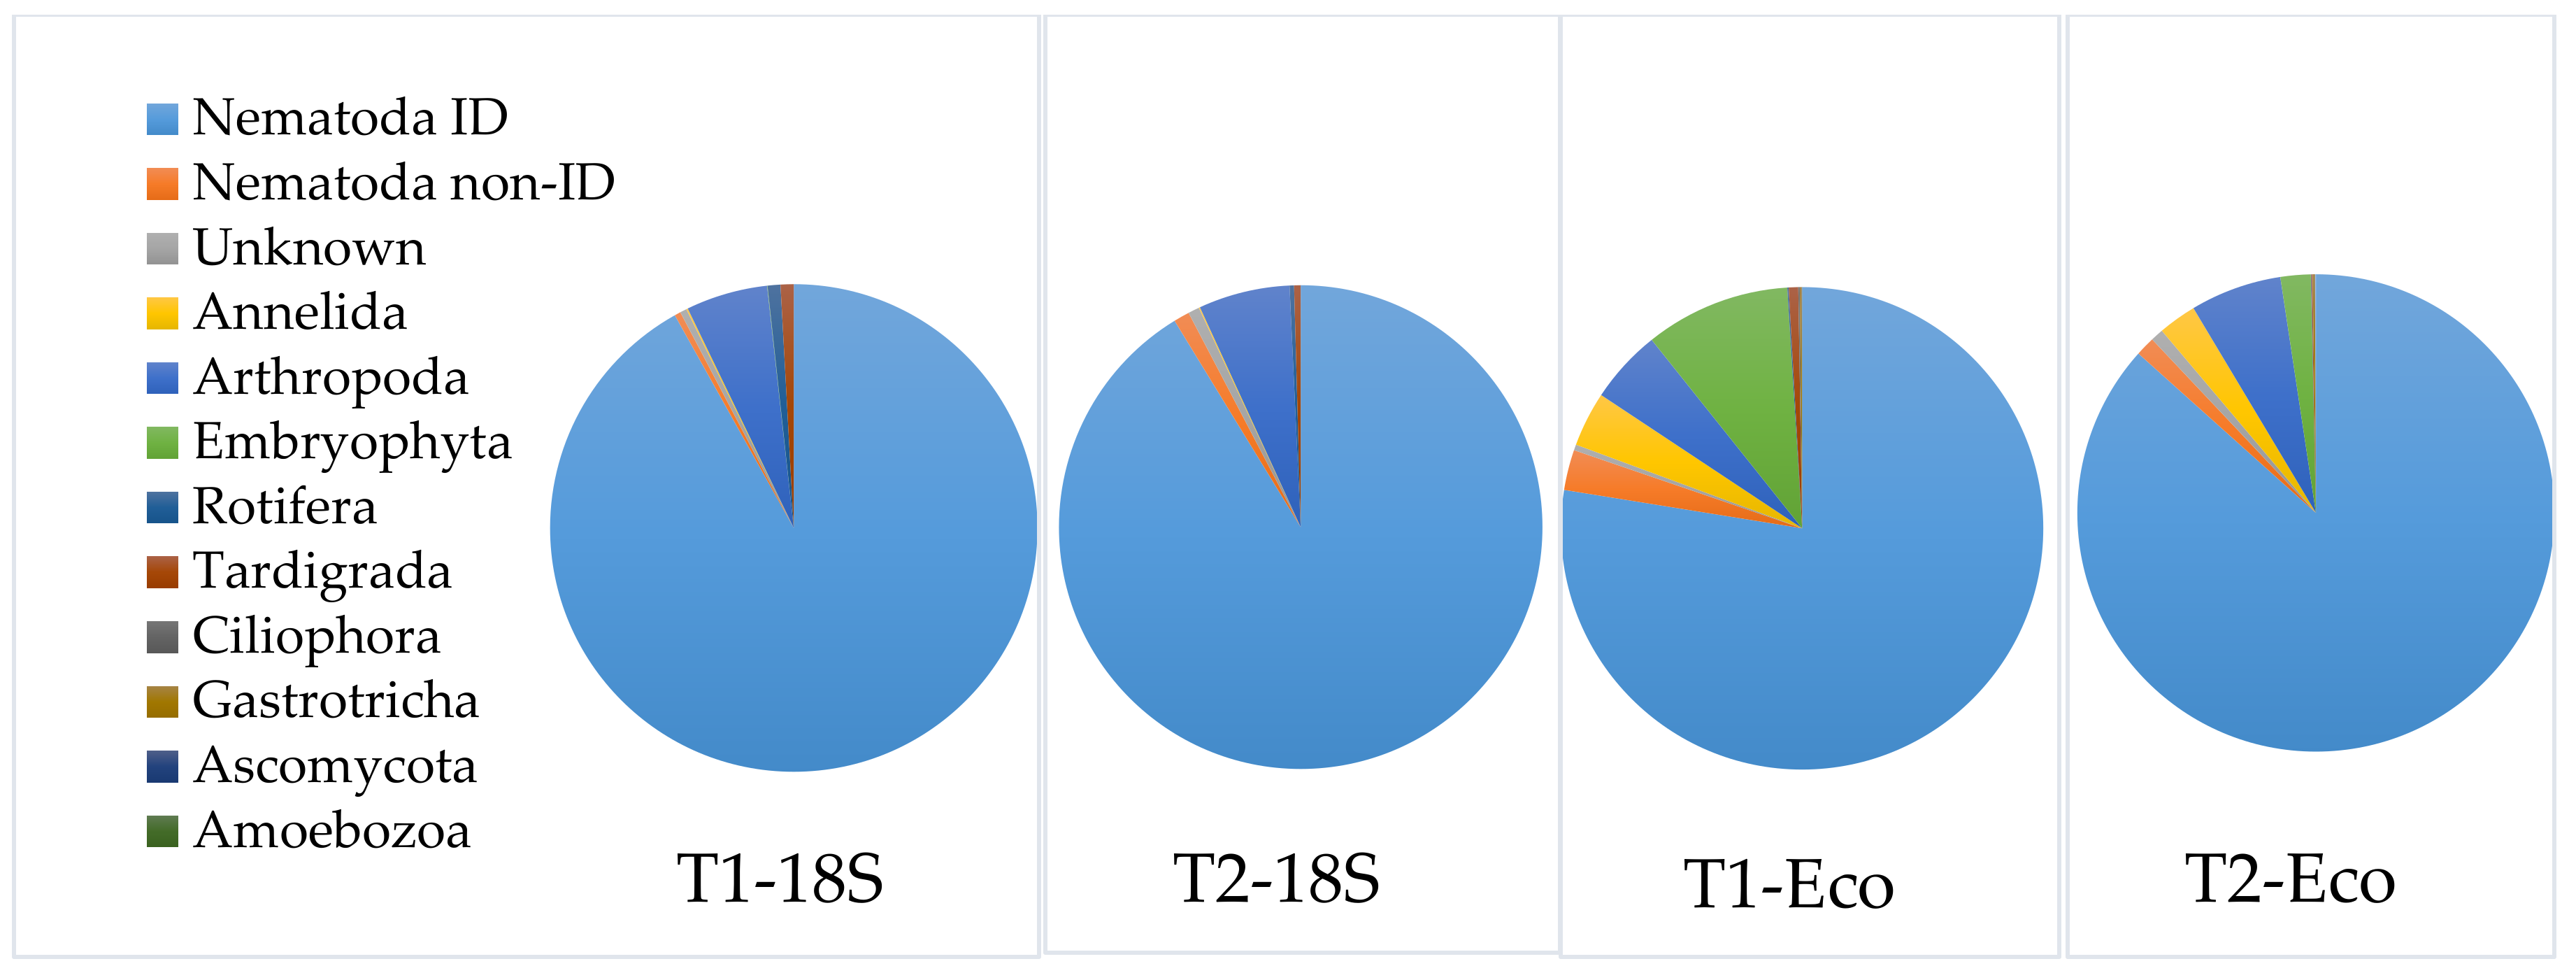
3.3.3. Application of the Selected DNA-Extraction Methods, Primer Sets and Correction Factors on a Spiked Biological Sample

Next to the obvious presence of different nematode genera, members of other groups within the Eukaryota were detected in the biological sample. However, compared with all nematodes, their presence is rather low (less than 20%). Blasting against the non-redundant database of GenBank revealed that these sequences belong to Arthropoda, Tardigrada, Rotifera, Annelida, Ascomycota, Ciliophora, Embryophyta, Gastrotricha, Basiodiomycota, and Tracheophyta. A few sequences (less than 1%) could not be appointed to any taxon. More phyla were found when using the eco primer set than when using the adapted primer set. Also the number of reads for these groups was higher compared to the adapted primer set (Figure 6). More detailed data on the composition of the samples as identified by the naïve Bayesian classifier can be found in Supplementary File S4, tab 3 (counts) and tab 4 (percentages).
The samples T1 and T2 consist of a nematode community extracted from soil spiked with varying numbers of cultured specimens belonging to four different nematode species (Table 1). The adapted primer set in combination with the Qiagen method identified the highest number of genera (mean number of genera identified = 27.8 (StDev. = 2), versus 17.1 - 22.5 for the other methods). The drop in sensitivity of the eco primer set illustrated by the mock communities M20 and Mvar (see above) translated into fewer identified nematode genera (mean number of genera identified = 19.8, StDev. = 5.6 versus 24.4, StDev. = 4.1 for the adapted primer set). However, if we consider the taxonomic resolution of both primer sets, we conclude that it was more or less equal as we noticed the same percentage of nematode sequences classified up to genus level (79.6% for the adapted primer set versus 78.3% for the eco primer set). Both DNA-extraction methods approximately identified the same number of genera. More details can be found in Supplementary File S4, tab 7.
The spiked nematodes in the biological samples T1 and T2 could be detected up to genus level with each method although the detection limit was sometimes higher than one individual. We compared the abundance of Bursaphelenchus with and without applying the correction factor on both T1 and T2. The correction factor improved its quantification considerably in most cases (Supplementary File S4, tab 5). More details can be found in Supplementary File S4, tab 4.

4. Discussion

Recently much attention has been paid to the potential of extracellular DNA (eDNA), sometimes also called environmental DNA, to be used as an indicator for biodiversity in general in various environments [36,37,38,39]. However, in the case of nematodes, this method may not be suitable [15,16]. Some of the problems with eDNA to detect nematodes from soil are (1) efficiency and low capacity (0.25–10 g soil) of the soil DNA-extraction methods and (2) limited availability of suitable primers. Methods using eDNA typically rely on degraded DNA and hence primers should flank short, very variable fragments, which are to date not available specifically for nematodes. The primers used during our studies demonstrated they are not nematode specific because still almost 20% of the sequence reads can be assigned to non-nematode taxa. Also the ‘original’ primer set NemF and 18Sr2b [14], although improved to use them without the need for nematode enrichment, assigned only around 65% of the number of sequences to Nematoda. The consequence is that with the current techniques and knowledge, it is almost impossible to create reliable nematode profiles derived from soil DNA. Therefore, in our opinion, it is better to first extract nematodes from larger soil samples using traditional methods to obtain nematode-enriched samples before DNA-extraction. We have used the automated zonal centrifuge [24] to extract nematodes from a soil sample. The extraction procedure is based on centrifugation in combination with a separation fluid and, thus, organisms with the same specific density as soil nematodes are also retained in the separation fluid and will show up in the resulting data set. However, DNA from a broad range of eukaryotes is detected as can be seen in Figure 6. A possible explanation is that next to the detection of relic DNA preserved in the soil long after the organisms is gone [40], DNA from a wide range of organisms is detected because it is present in the nematode gut content. Indeed, soil nematodes have a large variety of food sources ranging from micro- to macro-organisms [41]. After the decision to apply enriched nematode suspensions, still many questions remain, such as which DNA-extraction method and which primer set is most suitable for this metabarcoding strategy, or whether the relative abundances derived from metabarcoding are accurate enough to reflect the real relative abundance of nematode individuals.
After the evaluation of five DNA-extraction methods combined with three pre-treatments, we retained two methods to be tested in our metabarcoding study. One is a DNA-extraction/purification method, the other a simple DNA-releasing method. Both were combined with the pre-treatment of submerging the sample tubes in liquid nitrogen for 5 s before storing them at −20 °C until use for DNA-extraction. The statistical analysis did not show a convincing difference between the pre-treatments. Only for the Qiagen-method could a significant difference be noted. However, it was demonstrated before that a mechanical step improves the extraction of nematode community DNA [42]. The inconsistency in results between both DNA-extraction methods in relation to the nematode species is most probably caused by differences in the ability of releasing DNA. The adapted Holterman method was able to extract DNA from Paratylenchus sp. and Mesocriconema sp., while the Qiagen-method was not. Donn et al., [42] concluded that DNA-extraction suitability using commercial DNA-extraction kits should be tested for each habitat under investigation because failure of PCR can cause inhibition of the reaction by compounds present in the extract. It should be noted that we did not use community DNA from soil samples but instead prepared samples with isolated, hand-picked nematode individuals from cultures in sterile water. Peham et al. [15] stated that differences in lysis efficiency, next to the performance of the washing and elution steps, can limit DNA-extraction success or might lead to the removal of substantial amounts of target DNA. Our results show that the adapted Holterman method based on Holterman et al. [25] performs better in terms of lysis efficiency compared to the selected DNA-extraction/purification method. As a consequence, certain nematode species could not be detected by the latter method as was demonstrated with pure nematode cultures. The nematode genera that were identified based on the sequences obtained with DNA extracted from the Par and Cr samples using the Qiagen method were mostly genera used to prepare the artificial communities and thus are most probably cross-contaminations introduced during different preparation steps, especially the step in which amplified DNA-products are used as template for the index PCR’s. As stated before, individuals of both species were handpicked, transferred into separate tubes and hence physically isolated from any other nematode species before DNA-extraction. Moreover, both species are plant-parasitic and thus, on the contrary to plant DNA, it is as good as impossible to expect DNA from other nematode species in their gut content as can be possible for carnivorous or omnivorous nematode species feeding on nematodes. So, when DNA is not efficiently released and because of its extreme sensitivity, the amplification process is picking up other unwanted DNA sources. This outcome could explain the absence of a nematode species in the results after DNA-metabarcoding compared to a morphological analysis, even though the sequence is present in the database and a detectable number of individuals are present in the sample. The first barrier the DNA-extraction method has to break through is the outer protective layer, the cuticle. The cuticle is a critical structure of nematodes which acts as a hydroskeleton to maintain body shape, permit mobility, and interact with the external environment. It is a complex, though, flexible structure being composed of up to six layers. The presence of these layers and their thickness is dependent on the nematode stage and species [43]. Different cuticle compositions probably can withstand differently mechanical breakup and the lysing characteristics of certain chemicals and enzymes. Members of the family Criconematidae, like Mesocriconema, have a more rigid cuticle due to distinctive coarse ridges known as annulations around the body [44]. Members of the families Paratylenchidae and Criconematidae also were not found in soil samples from fields with three different cropping systems via DNA-metabarcoding analysis although proven to be present by a morphological analysis [23]. The authors could not give any explanation for this discrepancy but we could demonstrate by single-species tests that the lysis buffer of the DNA-extraction/purification method could not release DNA of these species efficiently, even after treatment with liquid nitrogen, while the lysis buffer of the DNA-releasing method could. In the mock communities, this effect was not visible since the species included in these communities suffered less from the difference in lysis efficiency of the two extraction methods. Unexpectedly, the lysis-efficient DNA-releasing method on average detected less genera in the (spiked) biological samples compared with the Qiagen method. This inconsistency can be explained by the presence of PCR inhibitors having an adverse effect on the amplification process. Also the number of reads was much lower, probably due to substances that interfere with the DNA concentration measurement used for pooling. Thus, although the DNA-releasing method can release DNA from more nematode species transferred into a clean incubation mixture, this positive effect can be reversed by the non-removal of PCR inhibitors still present in a nematode suspension derived from a soil sample. In conclusion, adding a method to improve mechanical breakup, like dipping the sample in liquid nitrogen, before following the instructions provided with a commercial DNA-extraction/purification kit, might not be sufficient. A more efficient ‘broad-spectrum’ cell-lysing buffer combined with a mechanical pre-treatment and DNA-purification steps, could increase the quality of many nematode species richness assessments.
Most bioinformatics pipelines for DNA-metabarcoding cluster sequences into OTUs before taxonomic assignment to reduce computational time. The number of OTUs depend on the level of sequence similarity set to define these clusters. Setting a high or lower level of sequence similarity can provoke an under- or overestimation of species richness. For nematodes usually a similarity of 99% is set as this can recover all nematode species although the number of OTUs exceed the actual number of nematode species. A similarity of 95% underestimate species richness by approximately 30% [12]. However, sequence variation differs considerably between biological species causing the use of fixed cut-offs not appropriate for a whole nematode community. To avoid this, a cluster-free pipeline, like DADA2 [18], can be used. DADA2 not only infers amplicon sequence variants (ASV) directly, the reads are ‘corrected’ by a quality-aware model of Illumina amplicon errors. Whether this approach yields a better evaluation of soil nematode communities compared to the use of OTUs was not investigated. However, it has been recently reported that the cluster-free DADA2 pipeline produced the most realistic estimates of species richness yet taxonomic assignment of ASVs were reduced [45]. Of course, independent of the pipeline applied, using sequences to identify ‘biological’ species is not without problems. A combined effect of incomplete databases, inaccurate designations—whether or not caused by incongruence between morphological and molecular data [17]—and the restricted amount of information in short amplicons generated by high-throughput sequencing platforms still makes it possible to over- or underestimate species richness. The need for a larger, high-quality, taxon-specific reference database cannot be overstated.
Two regions within the 18S rDNA locus of the nuclear ribosomal DNA were selected as diagnostic markers. The reason for their selection is that within the relatively conserved 18S rDNA gene, variable sequence regions covering the required taxonomic resolution for nematodes are alternated by short conserved sequences needed for universal primer design [46]. Moreover, an extensive number of 18S rDNA sequences of different nematode species are available for diagnostic purposes [47]. The success of DNA-metabarcoding heavily depends on the primers used for PCR. Full complementarity between primer and template sequences is generally considered crucial for the specific amplification of a nucleic acid sequence, especially for mixed templates [48]. However, Peham et al. [15] demonstrated the lack of specificity of the available DNA-metabarcoding primers using a cloning approach. So we adapted the primer set most frequently used for nematodes [10,14] and designed an additional primer set located in another region (V4–V5) of the 18S rRNA gene. This region was selected because Hadziavdic et al. [46] concluded that the V2, V4, and V9 regions were best suited for biodiversity assessments. To evaluate the ability of the adapted and newly developed primer sets to amplify the target from diverse nematodes, an alignment of a selection of nematodes was made to assess the nucleotide variation at these priming sites. For each primer, except EcoR, we introduced a degenerated position to limit the number of mismatches and thus reduce the lack of specificity during amplification. This was not done before in nematode DNA-metabarcoding studies but was recommended for the increase of specificity, sensitivity, and efficiency in qPCR assays [49]. In the latter study, it was demonstrated that single mismatches, irrespective of their location within the primer sequence, can instigate a variety of effects on PCR specificity potentially leading to biased results or even PCR failure. We did not compare results with the original primer set or with our newly designed primer set without a degenerate position because we decided to address the discovered problems of DNA-extraction first, to limit this source of variation in nematode composition before moving to the next step. All cultured nematode species used in the mock communities could be detected and the repeats showed low variation of their relative abundances, which suggests specific amplification.
The in silico tests of both primer sets used in our study on the database containing our own sequences and the non-redundant list of nematode 18S-sequences compiled from the SILVA 128 database predicted an improvement of the taxonomic coverage on genus-level, with the newly designed primer set performing better than the other set. This was true for the Rhabditida, for which an underrepresentation of species richness was detected in previous DNA-metabarcoding assays [13]. Results from the mock communities demonstrated that both members of the Cephalobidae family, Acrobeloides nanus and Cephalobus sp., were characterized only up to family level for the adapted primer set but to genus level for the eco primer set. Although the eco primer set annotated both as genus Acrobeloides, this result can be regarded as correct because phylogenetic analysis of a portion of the nuclear 28S rDNA for 33 cultures of Acrobeloides and Cephalobus, plus sequences representing other members of Cephalobina, revealed a core clade of 22 closely related taxa, but did not represent Acrobeloides and Cephalobus as monophyletic [50]. On the contrary, results from the mock communities showed a better taxonomic resolution with the adapted primer set than with the eco primer set for most of the other nematode species. However, we should not make a general conclusion based on only a few species. The spiked biological samples, containing a larger range of nematode species, also showed that the adapted primer set could on average detect more genera compared with the newly designed primer set. Again, the latter is not necessarily due to the lower taxonomic resolution of the amplified V4-V5 region compared to the V6-V8 region on genus-level because our data showed comparable portions of nematode sequences classified up to genus level for both primer sets. The eco primer set detected more non-nematode reads than the adapted primer set. Therefore the eco primer set might be more suitable for whole soil faunal analysis compared to the adapted primer set. Although the newly designed primer set predicts a better coverage in silico for nematodes, we do not recommend this primer set for nematode species richness assessments on the Illumina platform.
A large portion of the variation in amplicon detection frequency is due to primer mismatches [51] and differential lysis efficiencies between nematode species, as demonstrated, but also between different developmental stages of the same species. In particular, dauer larvae may be harder to lyse because of the increased presence of highly cross-linked cuticlins, an insoluble and unusual structural component that remains after extensive ionic detergent and reducing agent extraction of the cuticle [52]. However, the use of the 18S rRNA gene as target introduces another problem for quantification: variation in rRNA gene copy number. A six-fold variation in copy number has been discovered amongst six studied nematode species [53]. Darby et al. [13] stated that the high and low numbers of, respectively, Rhabditidae and Tylenchidae obtained after DNA-metabarcoding—although the first are bacterivores being less abundant in most undisturbed, natural soils while the second are most common in specimen-based counts of the same field samples—are probably due to an over- and underrepresentation, respectively, caused by variation in rRNA gene copy numbers. The authors postulated that correction factors for variation in rRNA operon copy number could convert absolute counts of metabarcoding reads into virtual specimen counts comparable with actual specimen counts. They decided to use an iterative optimization algorithm allowing multiple plausible solutions until the system converges into one sufficiently optimal solution that maximizes a fitness function. Unfortunately, this did not result in accurate correction factors for each nematode family present in the samples. The authors concluded that rRNA gene copy numbers will need to be quantified for different nematode species separately if amplicon-sequencing data are to be used quantitatively. Therefore, we decided to use a species-specific analytical method by creating a mock community with equal numbers of different nematode species and calculate a correction factor for each species separately. Our correction factors yielded good results: variation in relative abundances was low between repeats and there were hardly any unknown and non-nematode reads. Application of the obtained correction factors on another mock community and on B. xylophilus in a biological sample—B. xylophilus is the only species not expected to be present in soil—resulted in most cases in an amelioration of the quantification. Our results demonstrated that it is not possible to apply one correction factor per order of nematodes, but we could not determine whether correction factors can be fixed on the level of a nematode family as we did not study different nematode representatives from one family. It has been demonstrated that variation between rRNA operon copy numbers can exist between species of one nematode genus [53]. We assume that rRNA copy number variation are constrained by selective forces in natural populations, but this remains to be studied.
To improve DNA-metabarcoding quantification, another potential solution is to use other non-rRNA genes as metabarcoding loci, such as conserved single-copy nuclear orthologs or mitochondrial loci. This would help avoid the pitfalls of multicopy rRNA. The mitochondrial COI-gene has been investigated before on free-living marine nematode communities [46] but it was concluded that the ribosomal marker outperformed the mitochondrial marker in terms of species- and genus-level detection. The COI gene is in fact less suitable for nematode molecular taxonomic identification because it has high mutational rates. As a consequence, the primers designed are poorly conserved across the phylum Nematoda and alternate conserved regions for primer design are not evident [54,55]. There are still no records on using single-copy nuclear loci for DNA-metabarcoding, however, despite using such a locus, absolute quantification of metazoan specimens by DNA-metabarcoding will still remain difficult since metazoans are not single celled. Different developmental stages contain different numbers of cells and thus different number of DNA-copies [56]. To entirely avoid the issues of quantification, researchers could choose to apply DNA-metabarcoding for detection (presence/absence) and/or relative comparisons between samples only. Such approaches are, for example, very useful and adequate for environmental monitoring including subsequent management decisions for restoration and conservation planning [38,57,58], invasion biology assessments [38], phylogeography studies [59,60], and exploring the relationships between biological diversity and ecosystem functioning [61,62].
Both morpho-taxonomic and molecular techniques are useful in characterizing nematode communities but both have disadvantages. Morpho-taxonomy is time-consuming, probably misses a number of nematode species due to unidentifiable individuals (eggs, juveniles with insufficient morphological characteristics, dauer-larvae, pieces of nematodes, dead nematodes) and requires a lot of skills. A molecular analysis easily picks up cross-contamination and nematodes that are not present due to the DNA relicts (dead or pieces of nematodes). Nematode quantification using microscopy is assumed to be more reliable while this is not the case yet for molecular analyses. A meta-analytical approach suggested that a weak quantitative relationship may exist between the biomass and sequences produced, albeit with a large degree of uncertainty. Our current understanding of the factors affecting the quantitative performance of metabarcoding is still limited and additional research is required [63]. However, without exactly knowing the reasons causing inaccurate quantification, we demonstrated that introducing species-specific correction factors can be an important step towards reliable absolute quantification. From a practical point of view, it is probably not feasible to determine a correction factor for all soil nematode species separately. Moreover, it still needs to be proven how stably the correction factors behave when the species composition of the samples vary, since template competition in the PCR can also influence the outcome. Also, the correction can only be successful if the analysis method from DNA-extraction until DNA-metabarcoding is fixed, since we showed that correction factors are method-specific. This emphasizes the importance of standardization once more as already pointed out by Griffiths et al. [16].
For now, we could not improve the DNA-metabarcoding for absolute quantification of nematode communities. Moreover, if the presence of a certain genus or species in monitoring nematode communities is important, one should make sure to optimize the DNA lysis/extraction/purification method to prove that the nematode of interest can be detected. Therefore, in our opinion the technique is only suitable for monitoring and the results should be treated with caution. However, the new insights from this study open the door for further optimizations in the nematode metabarcoding field.

Supplementary Materials

The following are available online at https://0-www-mdpi-com.brum.beds.ac.uk/1424-2818/11/4/52/s1, File S1: The nematode sequence database used in this study, File S2: Multiple alignment of a selection of sequences from our nematode sequence database, File S3: Statistical analysis of the DNA-extraction test, File S4: Data analysis of the DNA-metabarcoding results, tab 1: length distribution, tab 2: absolute number of reads par sample, tab 3: absolute number of reads for each taxonomic assignment par sample, tab 4: relative (%) number of reads for each taxonomic assignment par sample, tab 5: calculation of the Correction Factors, tab 6: statistical evaluation of the Correction Factors, tab 7: number of genera in the spiked biological samples T1 and T2.

Author Contributions

Conceptualization, methodology, data curation, and formal analysis, L.W. and A.H.; software (NGS pipeline), A.H.; investigation, L.W. and N.S.; resources, N.S.; writing—original draft preparation, L.W.; writing—review and editing, A.H. and N.V.; supervision, A.H.; project administration, L.W.

Funding

This research received no external funding.

Acknowledgments

The authors wish to thank Martine Maes for commending this research in the framework of soil biome studies, and Wim Bert and Marjolein Couvreur from the Nematology Research Unit, Department of Biology, Ghent University, Ghent, Belgium, for the provision of pure cultures from different free-living nematode species.

Conflicts of Interest

The authors declare no conflict of interest.

References

  1. Yeates, G.W. Soil nematodes in terrestrial ecosystems. J. Nematol. 1979, 11, 213–229. [Google Scholar] [PubMed]
  2. Bongers, T. The maturity index: An ecological measure of environmental disturbance based on nematode species composition. Oecologia 1990, 83, 14–19. [Google Scholar] [CrossRef]
  3. Ferris, H.; Bongers, T.; de Goede, R.G.M. A framework for soil food web diagnostics: Extension of the nematode faunal analysis concept. Appl. Soil Ecol. 2001, 18, 13–29. [Google Scholar] [CrossRef]
  4. Nannipieri, P.; Grego, S.; Ceccanti, B. Ecological significance of the biological activity in soil. In Soil Biochemistry; Bollag, J.-M., Stotzky, G., Eds.; Marcel Dekker Inc.: New York, NY, USA, 1990; Volume 6, pp. 293–355. [Google Scholar]
  5. Ritz, K.; Black, H.I.J.; Campbell, C.D.; Harris, J.A.; Wood, C. Selecting biological indicators for monitoring soils: A framework for balancing scientific and technical opinion to assist policy development. Ecol. Ind. 2009, 9, 1212–1221. [Google Scholar] [CrossRef] [Green Version]
  6. Griffiths, B.S.; Römbke, J.; Schmelz, R.M.; Scheffczyk, A.; Faber, J.H.; Bloem, J.; Pérès, G.; Cluzeau, D.; Chabbi, A.; Suhadolc, M.; et al. Selecting cost effective and policy-relevant biological indicators for European monitoring of soil biodiversity and ecosystem function. Ecol. Indic. 2016, 69, 213–223. [Google Scholar] [CrossRef] [Green Version]
  7. Jones, J.T.; Haegeman, A.; Danchin, E.G.J.; Gaur, H.S.; Helder, J.; Jones, M.G.K.; Kikuchi, T.; Manzanilla-López, R.; Palomares-Rius, J.E.; Wesemael, W.M.L.; et al. Top 10 plant-parasitic nematodes in molecular plant pathology. Mol. Plant Pathol. 2013, 14, 946–961. [Google Scholar] [CrossRef] [PubMed] [Green Version]
  8. Ritz, K.; Trudgill, D.L. Utility of nematode community analysis as an integrated measure of the functional state of soils: Perspectives and challenges. Plant Soil 1999, 212, 1–11. [Google Scholar] [CrossRef]
  9. Neher, D. Role of nematodes in soil health and their use as indicators. J. Nematol. 2001, 33, 161–168. [Google Scholar]
  10. Porazinska, D.L.; Giblin-Davis, R.M.; Faller, L.; Farmerie, W.; Kanzaki, N.; Morris, K.; Powers, T.O.; Tucker, A.E.; Sung, W.; Thomas, W.K. Evaluating high-throughput sequencing as a method for metagenomics analysis of nematode diversity. Mol. Ecol. Resour. 2009, 9, 1439–1450. [Google Scholar] [CrossRef]
  11. Porazinska, D.L.; Giblin-Davis, R.M.; Esquivel, A.; Powers, T.O.; Sung, W.; Thomas, W.K. Ecometagenetics confirms high tropical rainforest nematode diversity. Mol. Ecol. 2010, 19, 5521–5530. [Google Scholar] [CrossRef]
  12. Porazinska, D.L.; Giblin-Davis, R.M.; Sung, W.; Thomas, W.K. Linking operational clustered taxonomic units (OCTUs) from parallel ultra sequencing (PUS) to nematode species. Zootaxa 2010, 2427, 55–63. [Google Scholar] [CrossRef]
  13. Darby, B.J.; Todd, T.C.; Herman, M.A. High-throughput amplicon sequencing of rRNA genes requires a copy number correction to accurately reflect the effects of management practices on soil nematode community structure. Mol. Ecol. 2013, 22, 5456–5471. [Google Scholar] [CrossRef] [Green Version]
  14. Sapkota, R.; Nicolaisen, M. High-throughput sequencing of nematode communities from total soil DNA-extractions. BMC Ecol. 2015, 15, 3. [Google Scholar] [CrossRef] [PubMed]
  15. Peham, T.; Steiner, F.M.; Schlick-Steiner, B.C.; Arthofer, W. Are we ready to detect nematode diversity by next generation sequencing? Ecol. Evol. 2016, 7, 4147–4151. [Google Scholar] [CrossRef]
  16. Griffiths, B.S.; de Groot, G.A.; Laros, I.; Stone, D.; Geisen, S. The need for standardisation: Exemplified by a description of the diversity, community structure and ecological indices of soil nematodes. Ecol. Indic. 2018, 87, 43–46. [Google Scholar] [CrossRef]
  17. Wu, T.; Ayres, E.; Li, G.; Bardgett, R.D.; Wall, D.H.; Garey, J.R. Molecular profiling of soil animal diversity in natural ecosystems: Incongruence of molecular and morphological results. Soil Biol. Biochem. 2009, 41, 849–857. [Google Scholar] [CrossRef]
  18. Callahan, B.J.; McMurdie, P.J.; Rosen, M.J.; Han, A.W.; Johnson, A.J.A.; Holmes, S.P. DADA2: High resolution sample inference from illumine amplicon data. Nat. Methods 2016, 13, 581–583. [Google Scholar] [CrossRef]
  19. O’Bannon, J.H.; Taylor, A.L. Migratory endoparasitic nematodes reared on carrot disks. Phytopathology 1968, 58, 385. [Google Scholar]
  20. Kobayashi, T.; Saski, K.; Mamiya, Y. Fungi associated with Bursaphelenchus lignicolus the pine wood nematode. J. Jpn. For. Soc. 1975, 57, 184–193. [Google Scholar] [CrossRef]
  21. Brenner, S. The genetics of Caenorhabditis elegans. Genetics 1974, 77, 71–94. [Google Scholar] [CrossRef]
  22. Decraemer, W.; Brown, D.; Karanastasi, E.; Zheng, J.; De Almeida, M.T.M. Interspecific differences in the fine structure of the body cuticle of Trichodoridae Thorne, 1935 (Nematoda: Diphtherophorina) and review of anchoring structures of the epidermis. Nematology 2001, 3, 525–533. [Google Scholar] [CrossRef]
  23. Treonis, A.M.; Unangst, S.K.; Kepler, R.M.; Buyer, J.S.; Cavigelli, M.A.; Mirsky, S.B.; Maul, J.E. Characterization of soil nematode communities in three cropping systems through morphological and DNA metabarcoding approaches. Sci. Rep. 2018, 8, 2004. [Google Scholar] [CrossRef] [Green Version]
  24. Hendrickx, G. An automatic apparatus for extracting free-living nematode stages from soil. Nematologica 1995, 41, 308. [Google Scholar]
  25. Holterman, M.; van der Wurff, A.; van den Elsen, S.; van Megen, H.; Bongers, T.; Holovachov, O.; Bakker, J.; Helder, J. Phylum-Wide Analysis of SSU rDNA Reveals Deep Phylogenetic Relationships among Nematodes and Accelerated Evolution towards Crown Clades. Mol. Biol. Evol. 2006, 23, 1792–1800. [Google Scholar] [CrossRef] [PubMed]
  26. Campos-Herrera, R.; El-Borai, F.E.; Stuart, R.J.; Graham, J.H.; Duncan, L.W. Entomopathogenic nematodes, phoretic Paenibacillus spp., and the use of real time quantitative PCR to explore soil food webs in Florida citrus groves. J. Invertebr. Pathol. 2011, 108, 30–39. [Google Scholar] [CrossRef] [PubMed]
  27. BioNumerics. Available online: http://www.applied-maths.com/ (accessed on 14 March 2019).
  28. Welcome to NVBI. Available online: https://0-www-ncbi-nlm-nih-gov.brum.beds.ac.uk/ (accessed on 14 March 2019).
  29. Quast, C.; Pruesse, E.; Yilmaz, P.; Gerken, J.; Schweer, T.; Yarza, P.; Peplies, J.; Glöckner, F.O. The SILVA ribosomal RNA gene database project: Improved data processing and web-based tools. Nucleic Acids Res. 2013, 41, D590–D596. [Google Scholar] [CrossRef] [PubMed]
  30. Walters, W.A.; Caporaso, J.G.; Lauber, C.L.; Berg-Lyons, D.; Fierer, N.; Knight, R. PrimerProspector: De novo design and taxonomic analysis of PCR primers. Bioinformatics 2011, 27, 1159–1161. [Google Scholar] [CrossRef] [PubMed]
  31. Katoh, K.; Standley, D.M. MAFFT Multiple Sequence Alignment Software Version 7: Improvements in performance and usability. Mol. Biol. Evol. 2013, 30, 772–780. [Google Scholar] [CrossRef]
  32. Riaz, T.; Shehzad, W.; Viari, A.; Pompanon, F.; Taberlet, P.; Coissac, E. ecoPrimers: Inference of new DNA barcode markers from whole genome sequence analysis. Nucleic Acids Res. 2011, 39, e145. [Google Scholar] [CrossRef]
  33. Bolger, A.M.; Lohse, M.; Usadel, B. Trimmomatic: A flexible trimmer for Illumina sequence data. Bioinformatics 2014, 30, 2114–2120. [Google Scholar] [CrossRef]
  34. R Core Team. R: A Language and Environment for Statistical Computing. R Foundation for Statistical Computing, Vienna, Austria. Available online: https://www.r-project.org/ (accessed on 31 August 2017).
  35. Wang, Q.; Garrity, G.M.; Tiedje, J.M.; Cole, J.R. Naïve Bayesian classifier for rapid assignment of rRNA sequences into the new bacterial taxonomy. Appl. Environ. Microb. 2007, 73, 5261–5267. [Google Scholar] [CrossRef] [PubMed]
  36. Neefs, J.M.; Van de Peer, Y.; De Rijk, P.; Chapelle, S.; De Wachter, R. Compilation of small ribosomal subunit structures. Nucleic Acids Res. 1993, 21, 3025–3049. [Google Scholar] [CrossRef] [PubMed]
  37. Thomsen, P.F.; Willerslev, E. Environmental DNA—An emerging tool in conservation for monitoring past and present biodiversity. Biol. Conserv. 2015, 183, 4–18. [Google Scholar] [CrossRef]
  38. Deiner, K.; Bik, H.M.; Mächler, E.; Seymour, M.; Lacoursière-Roussel, A.; Altermatt, F.; Creer, S.; Bista, I.; Lodge, D.M.; de Vere, N.; et al. Environmental DNA metabarcoding: Transforming how we survey animal and plant communities. Mol. Ecol. 2017, 26, 5872–5895. [Google Scholar] [CrossRef] [Green Version]
  39. Deiner, K.; Fronhofer, E.A.; Mächler, E.; Walser, J.-C.; Altermatt, F. Environmental DNA reveals that rivers are conveyer belts of biodiversity information. Nat. Commun. 2016, 7, 12544. [Google Scholar] [CrossRef] [Green Version]
  40. Carini, P.; Marsden, P.J.; Leff, J.W.; Morgan, E.E.; Strickland, M.S.; Fierer, N. Relic DNA is abundant in soil and obscures estimates of soil microbial diversity. Nat. Microbiol. 2016, 2, 16242. [Google Scholar] [CrossRef]
  41. Yeates, G.W.; Bongers, T.; de Goede, R.G.M.; Freckman, D.W.; Georgieva, S.S. Feeding habits in soil nematode families and genera-an outline for soil ecologists. J. Nematol. 1993, 3, 315–331. [Google Scholar]
  42. Donn, S.; Griffiths, B.S.; Neilson, R.; Daniell, T.J. DNA extraction from soil nematodes for multi-sample community studies. Appl. Soil Ecol. 2008, 38, 20–26. [Google Scholar] [CrossRef]
  43. Bird, A.F. The exoskeleton. In The Structure of Nematodes, 1st ed.; Academic Press: New York, NY, USA, 1971; pp. 45–79. [Google Scholar]
  44. Cordero, M.A.; Robbins, R.T.; Szalanski, A.L. Taxonomic and molecular identification of Mesocriconema and Criconemoides species (Nematoda: Criconematidae). J. Nematol. 2012, 44, 399–426. [Google Scholar]
  45. Macheriotou, L.; Guilini, K.; Bezerra, T.N.; Tytgat, B.; Nguyen, D.T.; Nguyen, T.X.P.; Noppe, F.; Armenteros, M.; Boufahja, F.; Rigaux, A.; et al. Metabarcoding free-living marine nematodes using curated 18S and CO1 reference sequence databases for species-level taxonomic assignments. Ecol. Evol. 2018, 9, 1211–1226. [Google Scholar] [CrossRef]
  46. Hadziavdic, K.; Lekang, K.; Lanzen, A.; Jonassen, I.; Thompson, E.M.; Troedsson, C. Characterization of the 18S rRNA gene for designing universal Eukaryote specific primers. PLoS ONE 2014, 9, e87624. [Google Scholar] [CrossRef] [PubMed]
  47. Van Megen, H.; Van den Elsen, S.; Holterman, M.; Karssen, G.; Mooyman, P.; Bongers, T.; Holovachov, O.; Bakker, J.; Helder, J. A phylogenetic tree of nematodes based on about 1200 full-length small subunit ribosomal DNA sequences. Nematology 2009, 11, 927–950. [Google Scholar] [CrossRef]
  48. Donn, S.; Neilson, R.; Griffiths, B.S.; Daniell, T.J. Greater coverage of the phylum Nematoda in SSU rDNA studies. Biol. Fertil. Soils 2011, 47, 333–339. [Google Scholar] [CrossRef]
  49. Stadhouders, R.; Pas, S.D.; Anber, J.; Voermans, J.; Mes, T.H.M.; Schutten, M. The effect of primer-template mismatches on the detection and quantification of nucleic acids using the 5′ nuclease assay. J. Mol. Diagn. 2010, 12, 109–117. [Google Scholar] [CrossRef]
  50. Smythe, A.B.; Nadler, S.A. Molecular phylogeny of Acrobeloides and Cephalobus (Nematoda: Cephalobidae) reveals paraphyletic taxa and recurrent evolution of simple labial morphology. Nematology 2006, 8, 819–836. [Google Scholar] [CrossRef]
  51. Piñol, J.; Mir, G.; Gomez-Polo, P.; Agusti, N. Universal and blocking primer mismatches limit the use of high-throughput DNA sequencing for the quantitative metabarcoding of arthropods. Mol. Ecol. Resour. 2015, 15, 819–830. [Google Scholar] [CrossRef]
  52. Page, A.P.; Johnstone, I.L. The cuticle. WormBook Online Rev. C. Elegans Boil. 2007, 1–15. [Google Scholar] [CrossRef]
  53. Bik, H.M.; Fournier, D.; Sung, W.; Bergeron, R.D.; Thomas, W.K. Intra-genomic variation in the ribosomal repeats of nematodes. PLoS ONE 2013, 8, e78230. [Google Scholar] [CrossRef] [PubMed]
  54. Blouin, M.S.; Yowell, C.A.; Courtney, C.H.; Dame, J.B. Substitution bias, rapid saturation, and the use of mtDNA for nematode systematics. Mol. Biol. Evol. 1998, 15, 1719–1727. [Google Scholar] [CrossRef] [PubMed] [Green Version]
  55. Deagle, B.E.; Jarman, S.N.; Coissac, E.; Pompanon, F.; Taberlet, P. DNA metabarcoding and the cytochrome c oxidase subunit I marker: Not a perfect match. Biol. Lett. 2014, 10, 20140562. [Google Scholar] [CrossRef] [PubMed]
  56. Lopes, E.A.; Roberts, D.M.; Blok, V.C. Variable ITS-copy number at different developmental stages of Meloidogyne hapla and M. chitwoodi. Eur. J. Plant Pathol. 2019. [Google Scholar] [CrossRef]
  57. Yang, C.; Wang, X.; Miller, J.A.; de Blécourt, M.; Ji, Y.; Yang, C.; Harrison, R.D.; Yu, D.W. Using metabarcoding to ask if easily collected soil and leaf-litter samples can be used as a general biodiversity indicator. Ecol. Indic. 2014, 46, 379–389. [Google Scholar] [CrossRef] [Green Version]
  58. Hajibabaei, M.; Shokralla, S.; Zhou, X.; Singer, G.A.C.; Baird, D.J. Environmental barcoding: A next-generation sequencing approach for biomonitoring applications using river benthos. PLoS ONE 2011, 6, e17497. [Google Scholar] [CrossRef] [PubMed]
  59. Emerson, B.; Cicconardi, F.; Fanciulli, P.P.; Shaw, P.J.A. Phylogeny, phylogeography, phylobetadiversity and the molecular analysis of biological communities. Philos. Trans. R. Soc. B 2011, 366, 2391–2402. [Google Scholar] [CrossRef] [PubMed] [Green Version]
  60. Bik, H.M.; Sung, W.; De Ley, P.; Baldwin, J.G.; Sharma, J.; Rocha-Olivares, A.; Thomas, W.K. Metagenetic community analysis of microbial eukaryotes illuminates biogeographic patterns in deep-sea and shallow water sediments. Mol. Ecol. 2012, 21, 1048–1059. [Google Scholar] [CrossRef]
  61. Purdy, K.J.; Hurd, P.J.; Moya-Larano, J.; Trimmer, M.; Oakley, B.B.; Woodward, G. Systems biology for ecology: From molecules to ecosystems. Adv. Ecol. Res. 2010, 43, 87–149. [Google Scholar] [CrossRef]
  62. Lamb, P.D.; Hunter, E.; Pinnegar, J.K.; Creer, S.; Davies, R.G.; Taylor, M.I. How quantitative is metabarcoding: A meta-analytical approach. Mol. Ecol. 2018. [Google Scholar] [CrossRef]
  63. Creer, S.; Deiner, K.; Frey, S.; Porazinska, D.; Taberlet, P.; Thomas, W.K.; Potter, C.; Bik, H.M. The ecologist’s field guide to sequence-based identification of biodiversity. Methods Ecol. Evol. 2016, 7, 1008–1018. [Google Scholar] [CrossRef]
Figure 1. Shannon entropy values of all positions (bp) in the alignment derived from the nematode sequences from SILVA 128 along the 18S rRNA gene of Caenorhabditis elegans (AY268117) with positions of the DNA-(meta)barcoding primers. More nucleotide variable positions in the sequence are represented by a higher entropy value, a more conserved position by a lower entropy value. A region composed of a string of nucleotide positions with consistently low entropy values is most suited for primer design for DNA-metabarcoding. The variable regions V1-V9 and the positions of the primers used during this study are indicated. The arrows reveal the direction of the amplification. More information about the primers can be found in table 2.
Diversity 11 00052 g001
Figure 2. Concentrations of DNA extracted from 4000 nematodes using 15 DNA-extraction procedures combining five methods (WLB = adapted Holterman method; soil = Soil DNA Isolation Kit, Norgen Biotek; Q = Qiagen method; R = High Pure PCR Template Prep Kit, Roche; and P = Wizard Magnetic DNA Purification System for Food, Promega) with either no pre-treatment (no suffix), cooling at −80 °C (suffix-80) or liquid nitrogen (suffix vlN2). Error bars indicate the standard deviation (n = 5). Different letters on top of the bars represent significant differences between the DNA-extraction procedures (p < 0.001). More details can be found in Supplementary File S3.
Diversity 11 00052 g002
Figure 3. In silico evaluation of the taxonomic coverage of each primer NemF [14], NemFopt (this study), EcoF (this study), 18Sr2b [10], 18Sr2bRopt (this study), and EcoR (this study) by PrimerProspector [30] against our 18S rRNA sequence database. Taxonomic level: Order. Green and red circles refer to, respectively, a better or worse taxonomic coverage for the annotated nematode Order by the adapted primer compared to the original one (NemFopt compared to NemF and 18Sr2bRopt compared to 18Sr2b).
Diversity 11 00052 g003
Figure 4. Number of nematodes (first column, analyzed number; second column, expected number; third column, corrected number based on the calculated correction factors from the corresponding M20 samples). (a) DNA-extraction based on the adapted Holterman method and NemFopt and 18Sr2bRopt primer set; (b) DNA-extraction based on the adapted Holterman method and EcoF and EcoR primer set; (c) DNA-extraction based on the Qiagen method and NemFopt and 18Sr2bRopt primer set; (d) DNA-extraction based on the Qiagen method and EcoF and EcoR primer set. Information about the color scales can be found in Supplementary File S4, tab 5.
Diversity 11 00052 g004
Figure 5. Mean correction factors (log x+1) calculated for each nematode species (see Table 1) and procedure (WLB-18S: DNA-extraction based on the adapted Holterman method and NemFopt and 18Sr2bRopt primer set; Qiagen-18S: DNA-extraction based on the Qiagen method and NemFopt and 18Sr2bRopt primer set; WLB-Eco: DNA-extraction based on the adapted Holterman method and EcoF and EcoR primer set; Qiagen-Eco: DNA-extraction based on the Qiagen method and EcoF and EcoR primer set). Error bars indicate the standard deviation across four repeats within each procedure. Different letters on top of the error bars represents significant differences between the procedures. Correction factors below 1 indicate that this nematode species is overrepresented, while factors above 1 indicate that this nematode species is underrepresented.
Diversity 11 00052 g005
Figure 6. Mean of the relative abundance of sequence reads for samples T1 and T2 (Table 1) for each primer set (18S: NemFopt and 18Sr2bRopt primer set, Eco: EcoF and EcoR primer set) at phylum rank. Each color represents another phylum. Only the phylum Nematoda is further subdivided into a group that could be identified up to at least order level (Nematode ID) and a group that could not (Nematode non-ID). More details can be found in Supplementary File S4, tab 4.
Diversity 11 00052 g006
Table 1. Composition of the different sample types (single-species, mock-community, and spiked nematode suspension) used in this study. The identity of the nematode isolates was confirmed by DNA-barcoding. The Genbank accession numbers are provided.
Nematode Isolate and Genbank Accession NumberTaxonomic Lineage: Class/Order/FamilyCode of Single-Species SampleNumber of Individuals in Single-Species SamplesNumber of Individuals in Mock Community M20Number of Individuals in Mock Community MvarNumber of Spiked Individuals in Nematode Suspension T1Number of Spiked Individuals in Nematode Suspension T2
Acrobeloides nanus MH983014Chromadorea/
Rhabditida/
Cephalobidae
An-2010--
Bursaphelenchus xylophilus MH983015Chromadorea/
Tylenchida/
Aphelenchoididae
Bx302020401
Cephalobus sp. MH983016Chromadorea/
Rhabditida/
Cephalobidae
C-205--
Ditylenchus dipsaci MH983018Chromadorea/
Tylenchida/
Anguinidae
Dd302030--
Heterorhabditis bacteriophora MH983019Chromadorea/
Rhabditida/
Heterorhabditidae
Hb-2035540
Meloidogyne incognita MH983020Chromadorea/
Tylenchida/
Meloidogynidae
Mi-2025--
Mesocriconema sp. MH983017Chromadorea/
Tylenchida/
Criconematidae
Cr10----
Mesorhabditis belari MH983024Chromadorea/
Rhabditida/
Rhabditidae
Rb-2015--
Oscheius tipulae MH983026Chromadorea/
Rhabditida/
Rhabditidae
Ot-202--
Paratylenchus sp. MH983022Chromadorea/
Tylenchida/
Paratylenchidae
Par7----
Plectus acuminatus MH983021Chromadorea/
Plectida/
Plectidae
Pa3020151010
Pratylenchus penetrans MH983023Chromadorea/
Tylenchida/
Pratylenchidae
Pp-20402020
Steinernema feltiae MH983025Chromadorea/
Rhabditida/
Steinernematidae
Sf-2030--
Dorylaimidae fam. (not sequenced)Enoplea/
Dorylaimida
D-205--
Table 2. Information on the primers used in this study.
Primer CodeColloquial Primer Set NameNucleotide Sequence (5’-3’)Amplicon Length (bp)ApplicationSource
18SILVOmidF-CAAGTCTGGTGCCAGCAG-763 1Sanger-sequencingILVO
18SILVOmidRGAGTCTCGCTCGTTATCGG
1813F-CTGCGTGAGAGGTGAAAT870 1Sanger-sequencing[23]
2646RGCTACCTTGTTACGACTTTT
NemFoptAdapted primer setGGGGWAGTATGGTTGCAAA489.9 2DNA-metabarcoding[13]
18Sr2bRoptTGTGTACAAAKGRCAGGGAC
EcoFEco primer setGGTTAAAAMGYTCGTAGTTG510.4 2DNA-metabarcodingThis study
EcoRTGGTGGTGCCCTTCCGTCA
1 Amplicon length inferred from Caenorhabditis elegans (AY268117); 2 average amplicon length as predicted by PrimerProspector [30] based on our database containing 1896 nematode sequences.

