The Prevalence of Single-Specimen/Locality Species in Insect Taxonomy: An Empirical Analysis


State Key Laboratory of Ecological Pest Control for Fujian and Taiwan Crops, College of Plant Protection, Fujian Agriculture and Forestry University, Fuzhou 350002, Fujian, China
*
Author to whom correspondence should be addressed.
Diversity 2019, 11(7), 106; https://0-doi-org.brum.beds.ac.uk/10.3390/d11070106
Submission received: 18 June 2019
/
Revised: 3 July 2019
/
Accepted: 4 July 2019
/
Published: 6 July 2019
(This article belongs to the Special Issue Biodiversity of Insect)
Abstract
:Although about two million species have been named, our knowledge about the biodiversity of many taxonomic groups remains inadequate and incomplete. There has been increased taxonomic effort for the discovery of more species and their geographical distribution information. During this process, species collected only from a single specimen/locality often appear. However, there are very few empirical data available to understand the current situation of single specimen/locality species in insect taxonomy. In this paper, we collected 1261 articles containing 4811 insect species from ZooKeys between 2009 and 2017, and we extracted data, including the publication date, number of specimens/locality, and DNA usage. Our analyses demonstrated that 21.53% and 21.74% of new species were described from only one specimen and one locality, respectively, and approximately half of all new species were published based on fewer than five specimens. Meanwhile, the rate of single-specimen species in papers with or without DNA data was 15.06% and 23.43%, respectively, which indicates that incorporating DNA data in species descriptions might effectively decrease the occurrence of single-specimen species. We suggest that taxonomists should adopt more beneficial practices, such as increasing specimen diversity, incorporating DNA data, and improving international collaboration, in the description of new species.
1. Introduction
Species diversity is one of the most amazing aspects of our planet, and sufficient knowledge of global biodiversity contributes to biodiversity conservation and an understanding of nature. The total species number on Earth has been estimated to be between 2 and 10 million [1,2,3], while the total number of described species has increased to approximately 1.8 million [4]. A consensus among biologists is that many species are still awaiting discovery and description. The poor knowledge of the identity of species on Earth, with many species yet to be described and recorded, is called the Linnean shortfall [5]. Moreover, geographical distributions for many species are also poorly understood and include numerous gaps [5,6]. This is the so-called Wallacean shortfall [7]. The lack of knowledge about distributional data has been considered a serious problem for reserve design [8,9], especially systematic conservation planning [10]. The discovery and description of species is still a major endeavor of the field of taxonomy. To overcome the Linnean and Wallacean shortfalls, there has been increased taxonomic effort for the discovery of more new species and new records in different regions. Costello et al. reported an increase in the number of authors describing species since the 1950s [3], and the average discovery rate of species has increased from 17,500 per year to more than 18,000 per year since 2006 [11]. Some issues, such as describing new species based on a single specimen/locality, often appear, especially from the destroyed parts of biodiversity hotspots. On the one hand, single-specimen/locality species provides the necessary information of a new species to help taxonomists know the species and relative taxa. On the other hand, incomplete distribution data and possible morphological variations associated with single specimen/locality usually require further taxonomic effort.
In general, species are identified based on several qualitative or quantitative morphological characters that are obviously distinguished from other species [12]. A detailed morphological description should be derived from observing the stable and clear characteristics of enough specimens. Unfortunately, limited specimens, even single specimens, are often used in the identification of new species for some taxa. Given that infra-specific character variation often occurs in different environments (e.g., host plants, temperatures, and altitudes) and geographical regions, limited specimens hardly represent the whole picture of character diversity within a species, which then affects the reliability of species descriptions. Dayrat even proposed that new species should never be named or described based on a single specimen [13], although this topic is considered controversial [14,15]. Although the phenomenon of single specimen/locality species has been mentioned in some previous literature [16,17], there are still very few comprehensive empirical data available to understand the current situation and dynamic tendency of this issue.
With the development of DNA sequencing techniques, new methods based on DNA barcoding are commonly used for species delimitation [18]; these methods include the general mixed Yule coalescent (GMYC) [19], Poisson tree process (PTP), and automatic barcode gap discovery (ABGD) [20,21]. Compared to traditional morphological identification, these new methods provide numerical or quantitative analysis, and can find slight differences in gene sequences (even one base-change) for species identification. Furthermore, these techniques often require a larger sample size for accurate species delimitation. For example, DNA barcoding requires multiple samples (ideally at least 20 individuals as suggested by Luo et al., though this may be hard to achieve for describing new species in most cases) to calculate inter-/intra-genetic distances to show distinct species boundaries [22]. Hence, it should be interesting to know whether the use of DNA data can help decrease the occurrence rate of new species based on only one specimen/locality.
Insects are the most diverse group and have the highest species richness on Earth, including approximately half of all described species [3,4]. To date, the number of described insects has increased to 854,031 species [4]. Therefore, insects are ideal candidates to assess the current taxonomic practices in terms of species description. In the present study, we compiled a dataset of 4811 species described in 1261 articles between 2009 and 2017 from ZooKeys, one of the top-ranked journals publishing a large number of insect new taxa. Then, we examined the prevalence of using single-specimen/locality for new species and investigated whether the use of DNA data in species description accompanies a lower rate of single-specimen/locality species. This empirical analysis may promote our understanding of the issue of single-specimen/locality species and other related issues in taxonomy.
2. Materials and Methods
Our data collection was based on articles about insect new taxa from 2009 to 2017 in the taxonomic journal ZooKeys, which is ranked second in Thomson Reuters’ Index of Organism names of the top 10 journals publishing the greatest number of new taxa in zoology (detailed in the ZooKeys website). As an open access journal from which all papers can be downloaded, data extraction was also convenient and efficient.
A literature survey was carried out on the ZooKeys website using the search text of ‘new species’ and then filtered by taxon (Insecta) to keep only articles reporting new insect species. The following data were extracted: (i) Date of publication of new species, (ii) locality of holotype, (iii) numbers of type specimens as well as collection localities, (iv) countries of the first and corresponding authors, (v) use of DNA data, and other information. A total of 57 fossil insects were excluded from the final dataset. The paper by Blahnik and Holzenthal was also excluded because the paper used 11,562 specimens for Oecetis houghtoni sp. n. [23], which indicated an extreme data record, while the specimen numbers used in all the other papers were below 2000. Our final dataset contained a total of 1261 papers with 4811 new species between 2009 and 2017 (Supporting Information Table S1). In this work, additional material examined in Table S1 was not included for the calculation of the specimens number, because the proportion of papers including additional material examined was very low (335/4811 = 7%) and some values of additional material examined were huge (e.g., Mathis and Zatwarnicki examined 987 specimens for Polytrichophora adarca sp. n.) [24], which might lead to a bias.
The number of specimens and localities per new species were summarized, and the temporal trend of specimen/locality number was investigated from 2009 to 2017. To show the geographical pattern of usage of a single specimen/locality, we also analyzed the rates of these species published by authors from different countries. Data for the top 10 countries were plotted as histograms. In addition, we compared the rates of single-specimen/locality species among different insect orders.
To test whether the use of DNA data can decrease the rate of single-specimen/locality species, the proportion and temporal trend of species and papers with DNA data were analyzed for the period of 2009 to 2017. Our expectation was that the rates of single-specimen/locality species in papers with DNA data should be lower. We also calculated the average specimen number for each species (including additional material examined) with/without DNA data.
A distribution map of the holotypes at the global scale was constructed to show the taxonomic effort published in ZooKeys. In addition, the distribution patterns of holotypes of new species published by corresponding authors from the top four countries that described the greatest number of species were also constructed. Finally, a Venn diagram was constructed to show the relationship between three variables, including the first author’s country (FAC), corresponding author’s country (CAC), and collecting country of holotype (CC), which can indicate international collaboration efforts in insect species descriptions.
3. Results
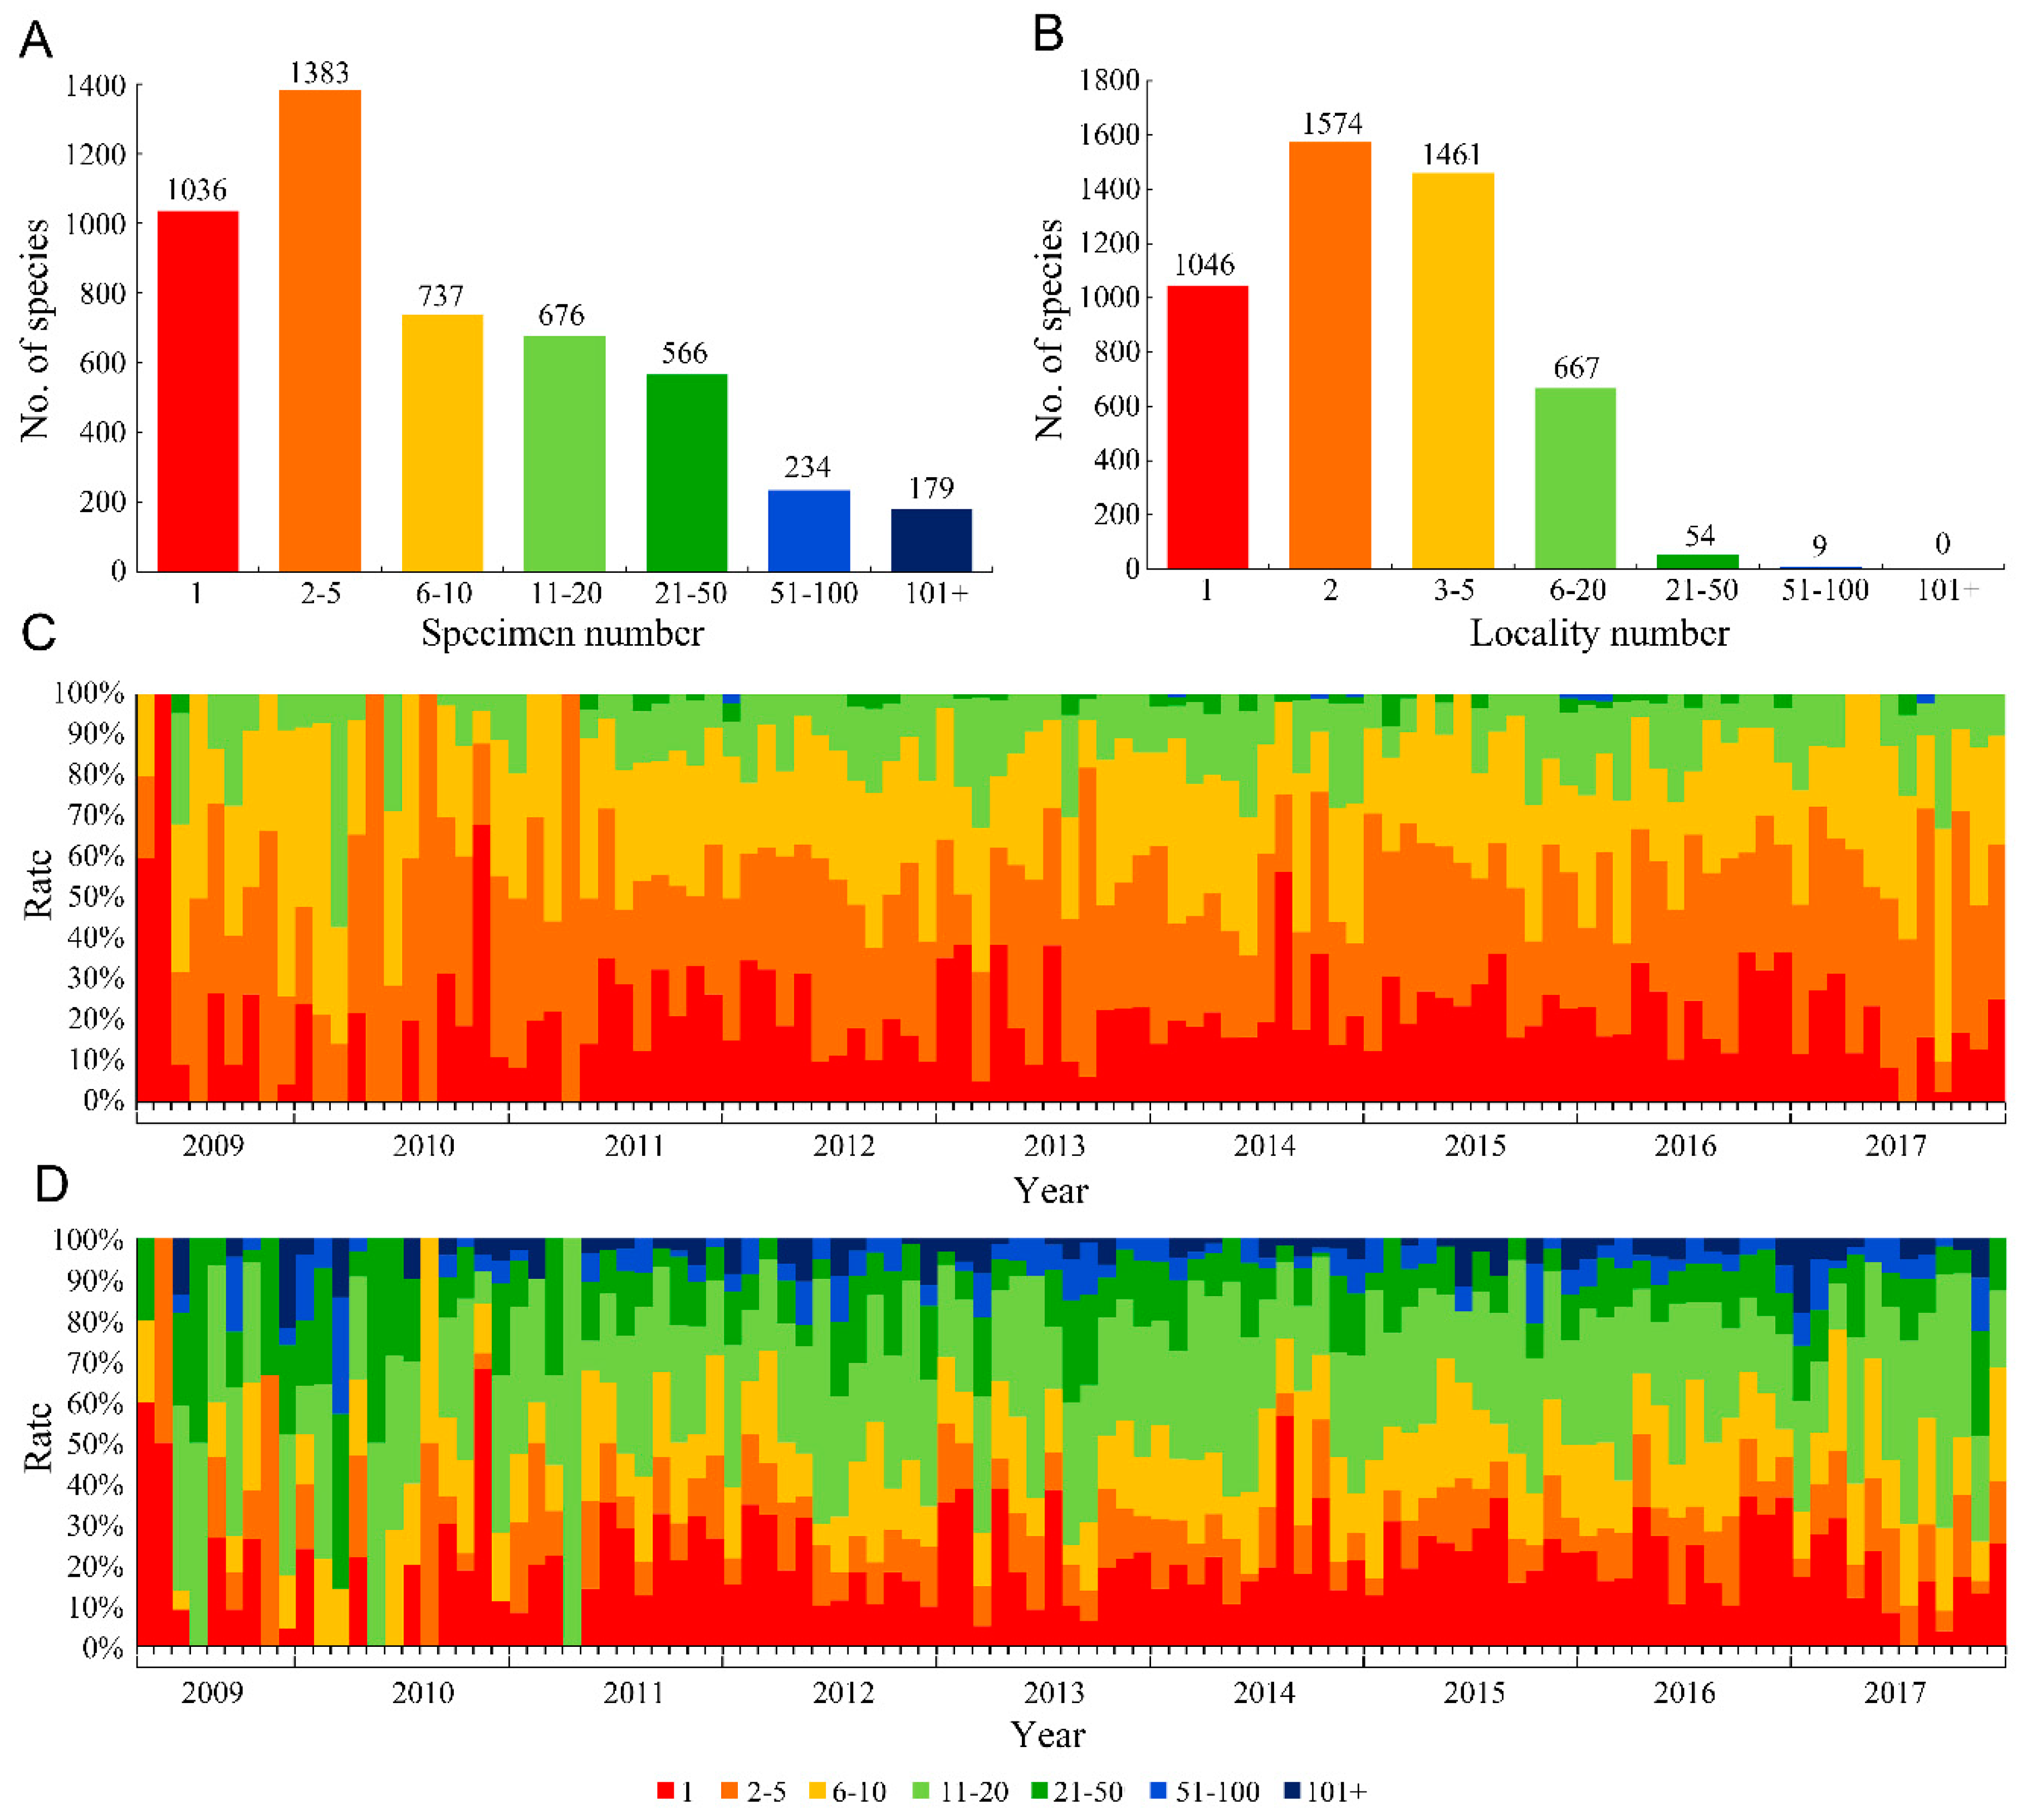
Our results showed that among all 4811 new insect species, 1036 (21.53%) were described based on a single specimen and 2419 (50.28%) were based on fewer than five specimens (Figure 1A). For the number of collection localities, 1046 species (21.74%) were described based on specimens from only a single locality, and 2620 species (54.46%) were described from specimens from two or fewer localities (Figure 1B). Furthermore, the temporal trend of the rate of species established using a single or very limited specimens was basically constant (Figure 1C), indicating that the problem of using few specimens did not change over time. Based on the trend of the numbers of collection localities between 2009 and 2017 (Figure 1D), the species from only a single locality or limited localities occupied a relatively stable proportion.
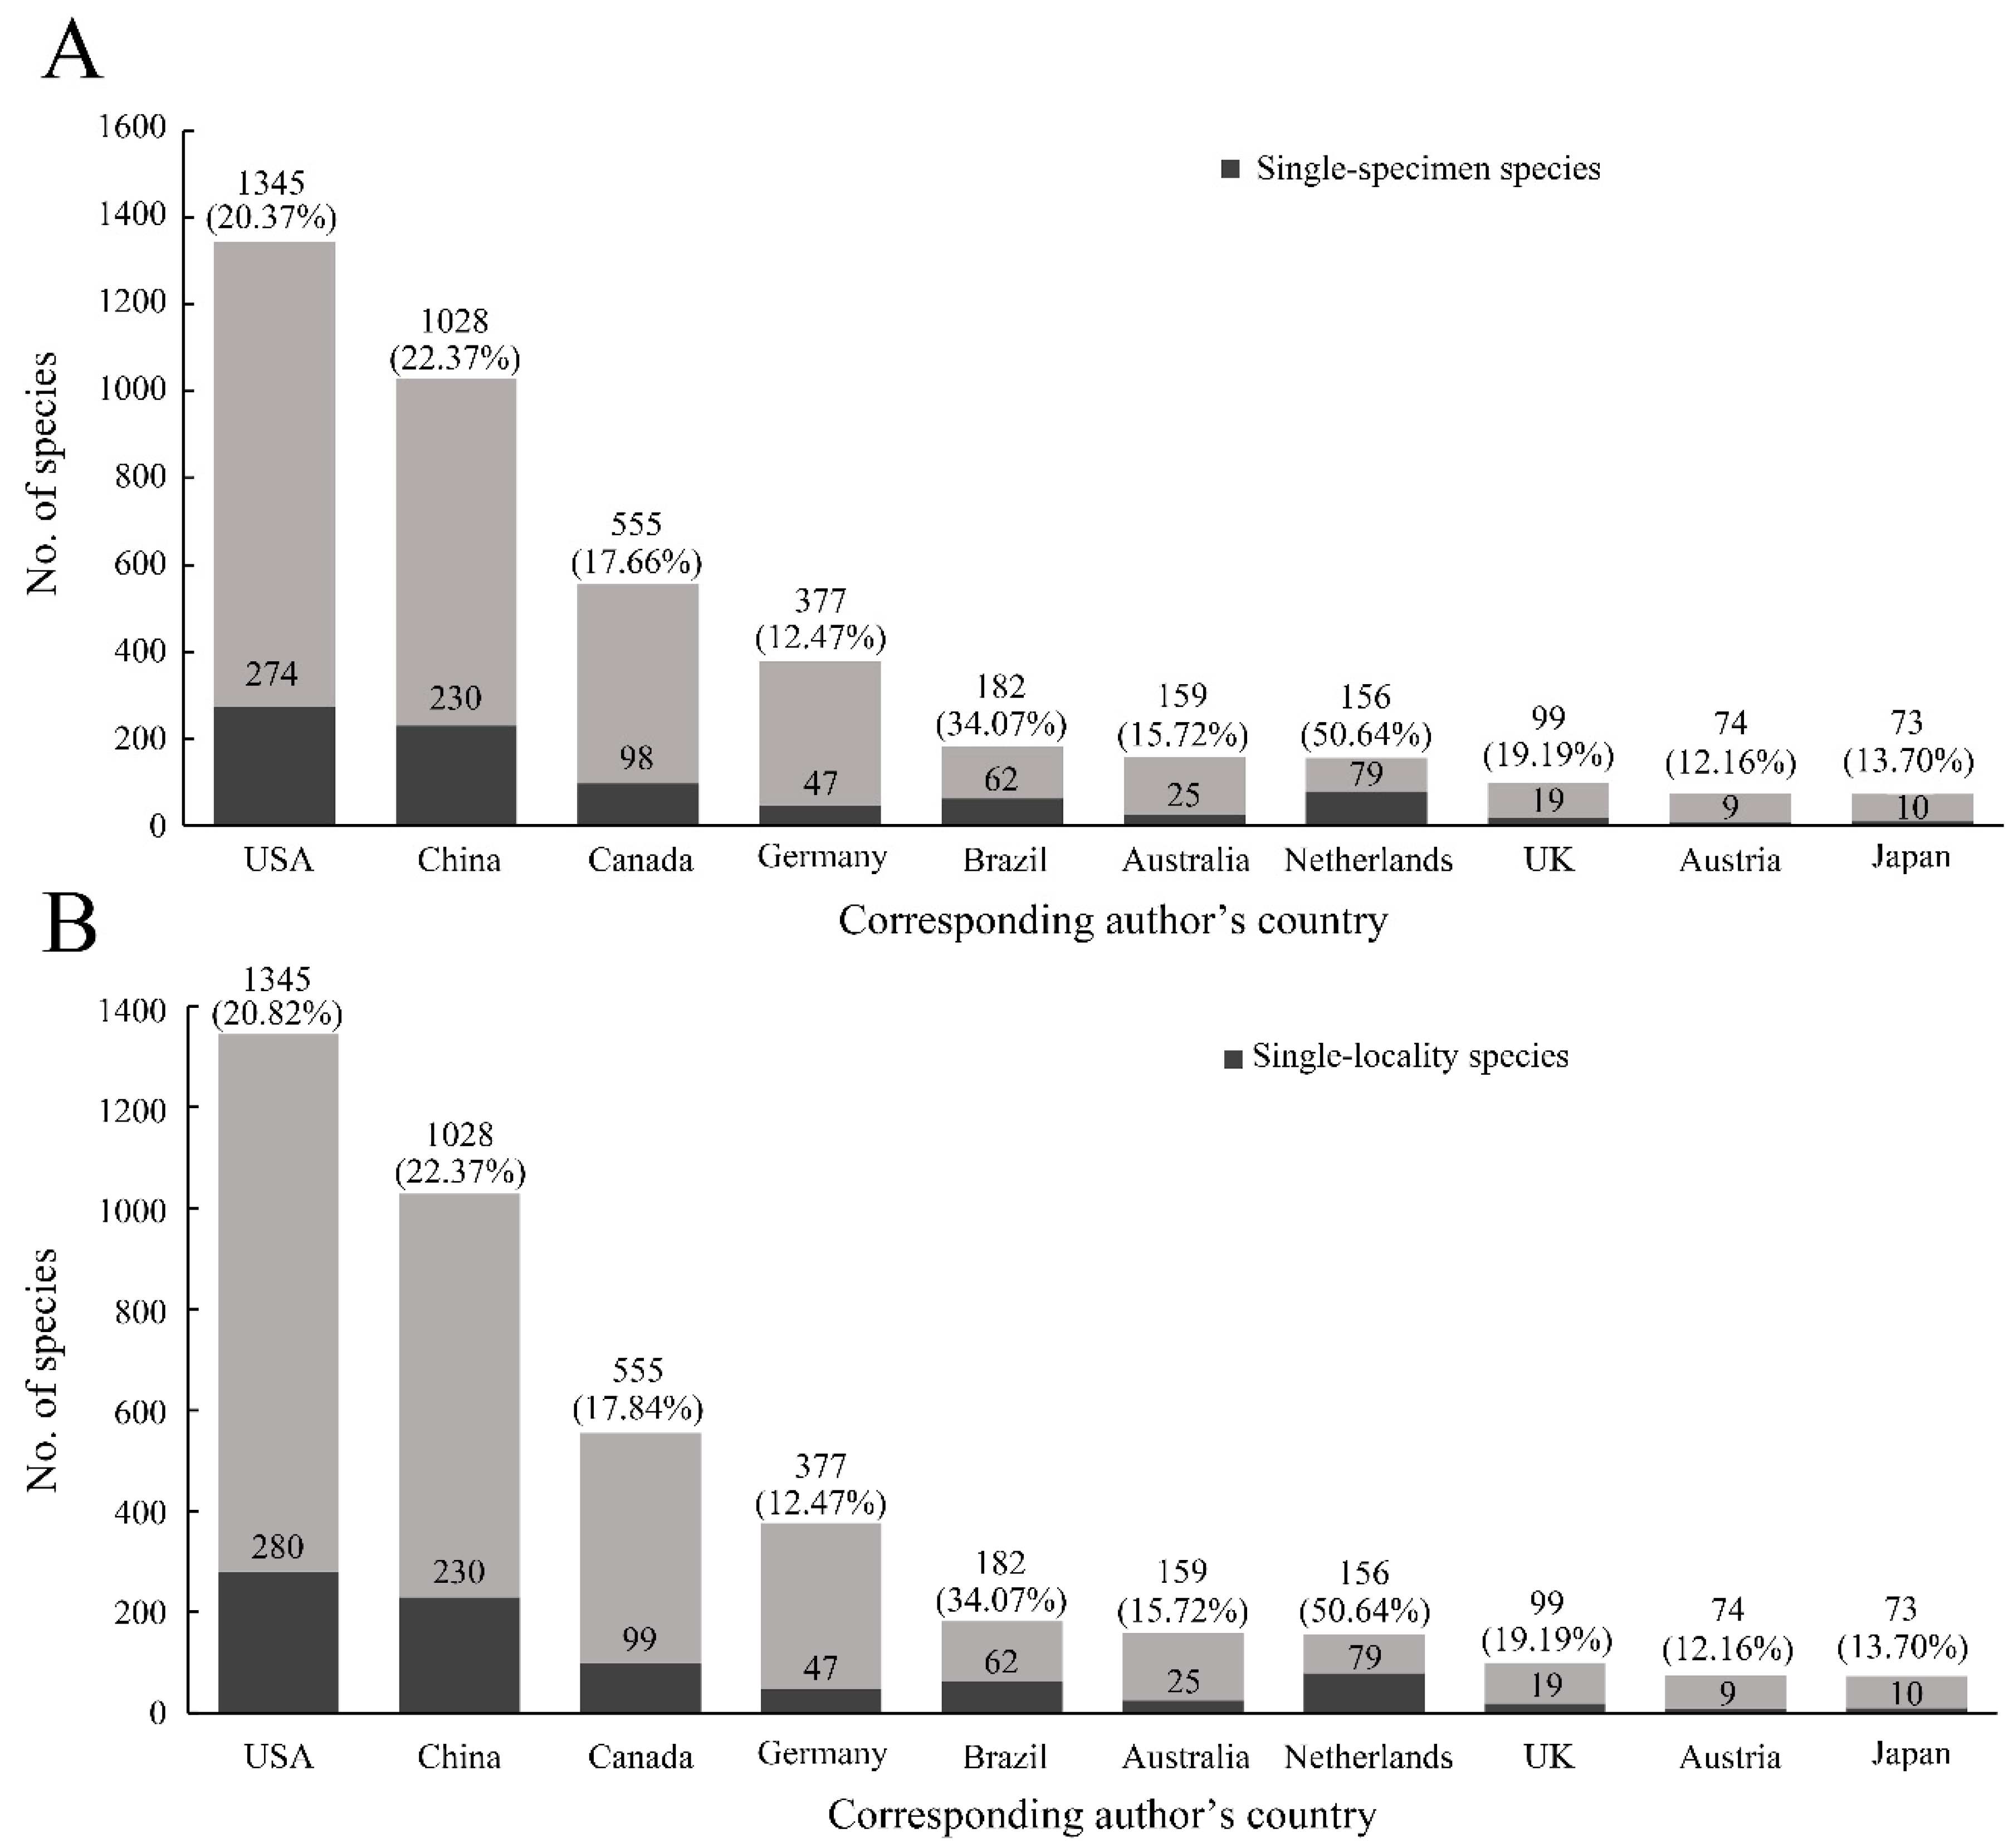
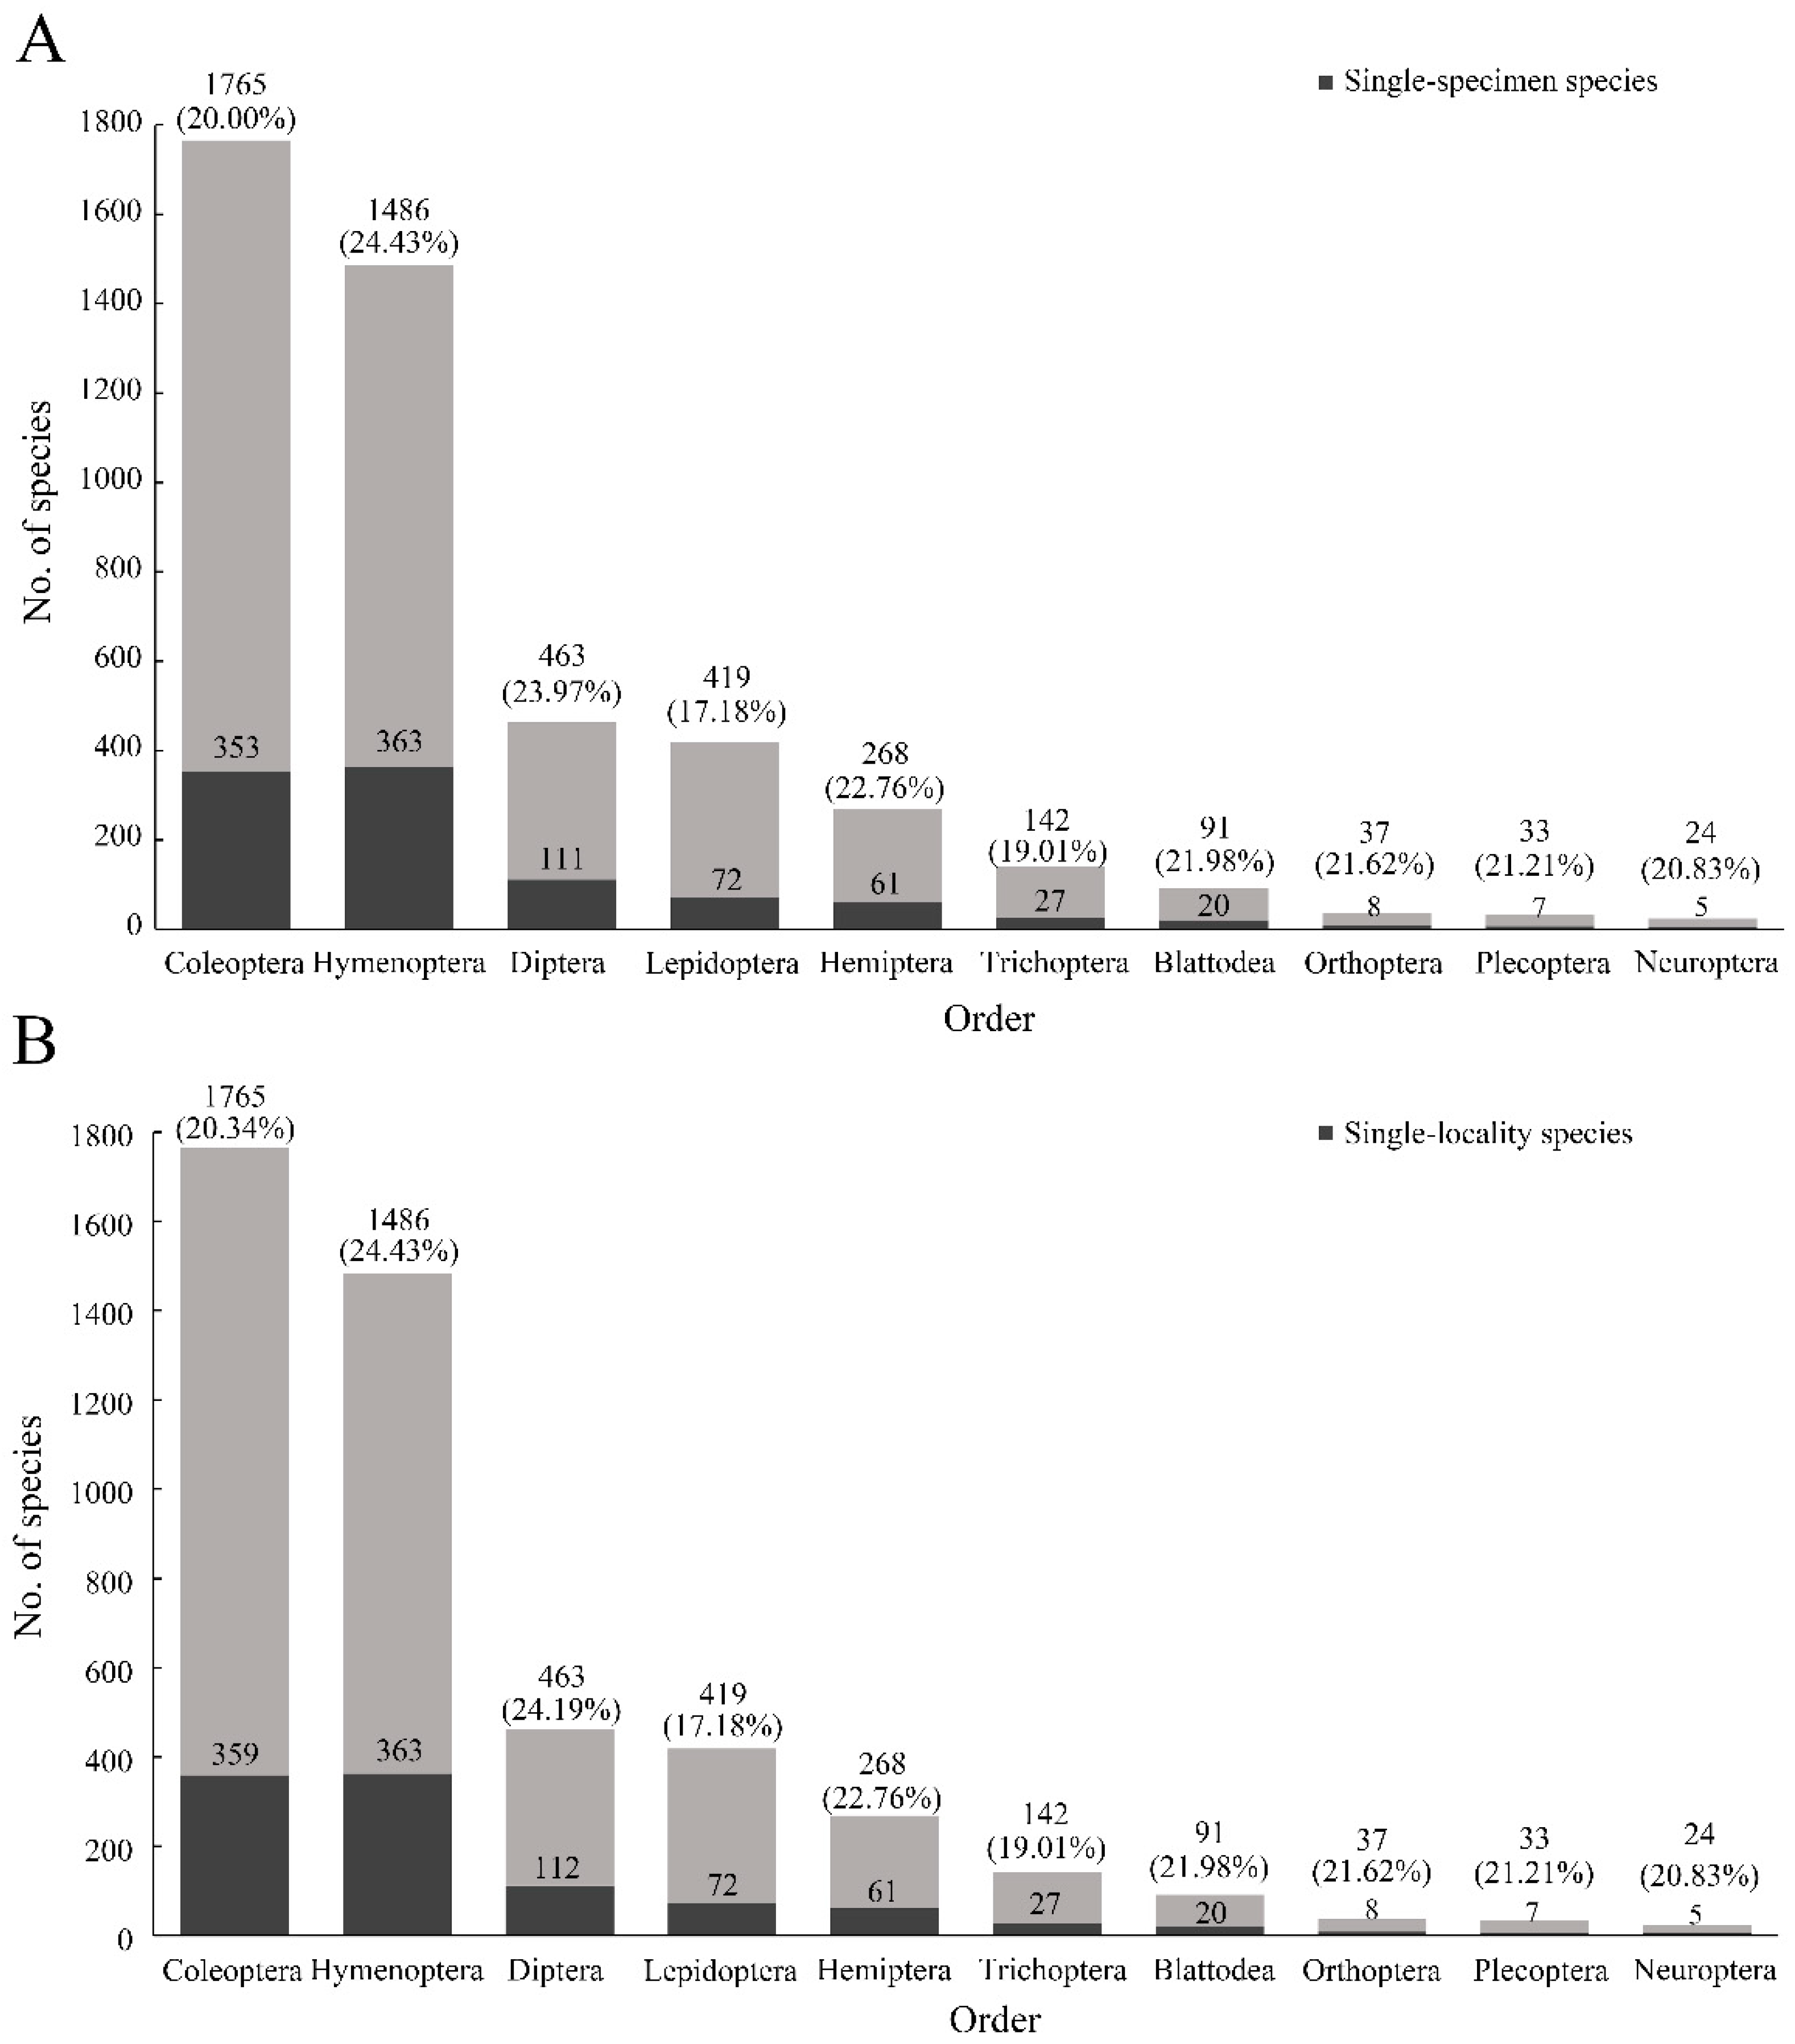
The proportions of single-specimen/locality species in different countries fluctuated. The top 10 countries described more than 84.46% of single-specimen species and 84.32% of single-locality species (Figure 2A). The proportions of single-specimen species were highest in Egypt, Belgium, and Costa Rica, at 100.00%, 66.67%, and 62.86%, respectively. Although the number of single-specimen species from the USA and China were the highest in all countries, the rates of these species were not very high (approximately 20%) (Figure 2A). Similar results were shown in the rates of single-locality species (Figure 2B). In addition, the top 10 insect orders for the number of species described were Coleoptera, Hymenoptera, Diptera, Lepidoptera, Hemiptera, Trichoptera, Blattodea, Orthoptera, Plecoptera, and Neuroptera. The mean rate of single-specimen species was 21.30% (highest: 24.43%, Hymenoptera; lowest: 17.18%, Lepidoptera) (Figure 3A). The average value of single-locality species for the 10 orders was 20.88% (Figure 3B).
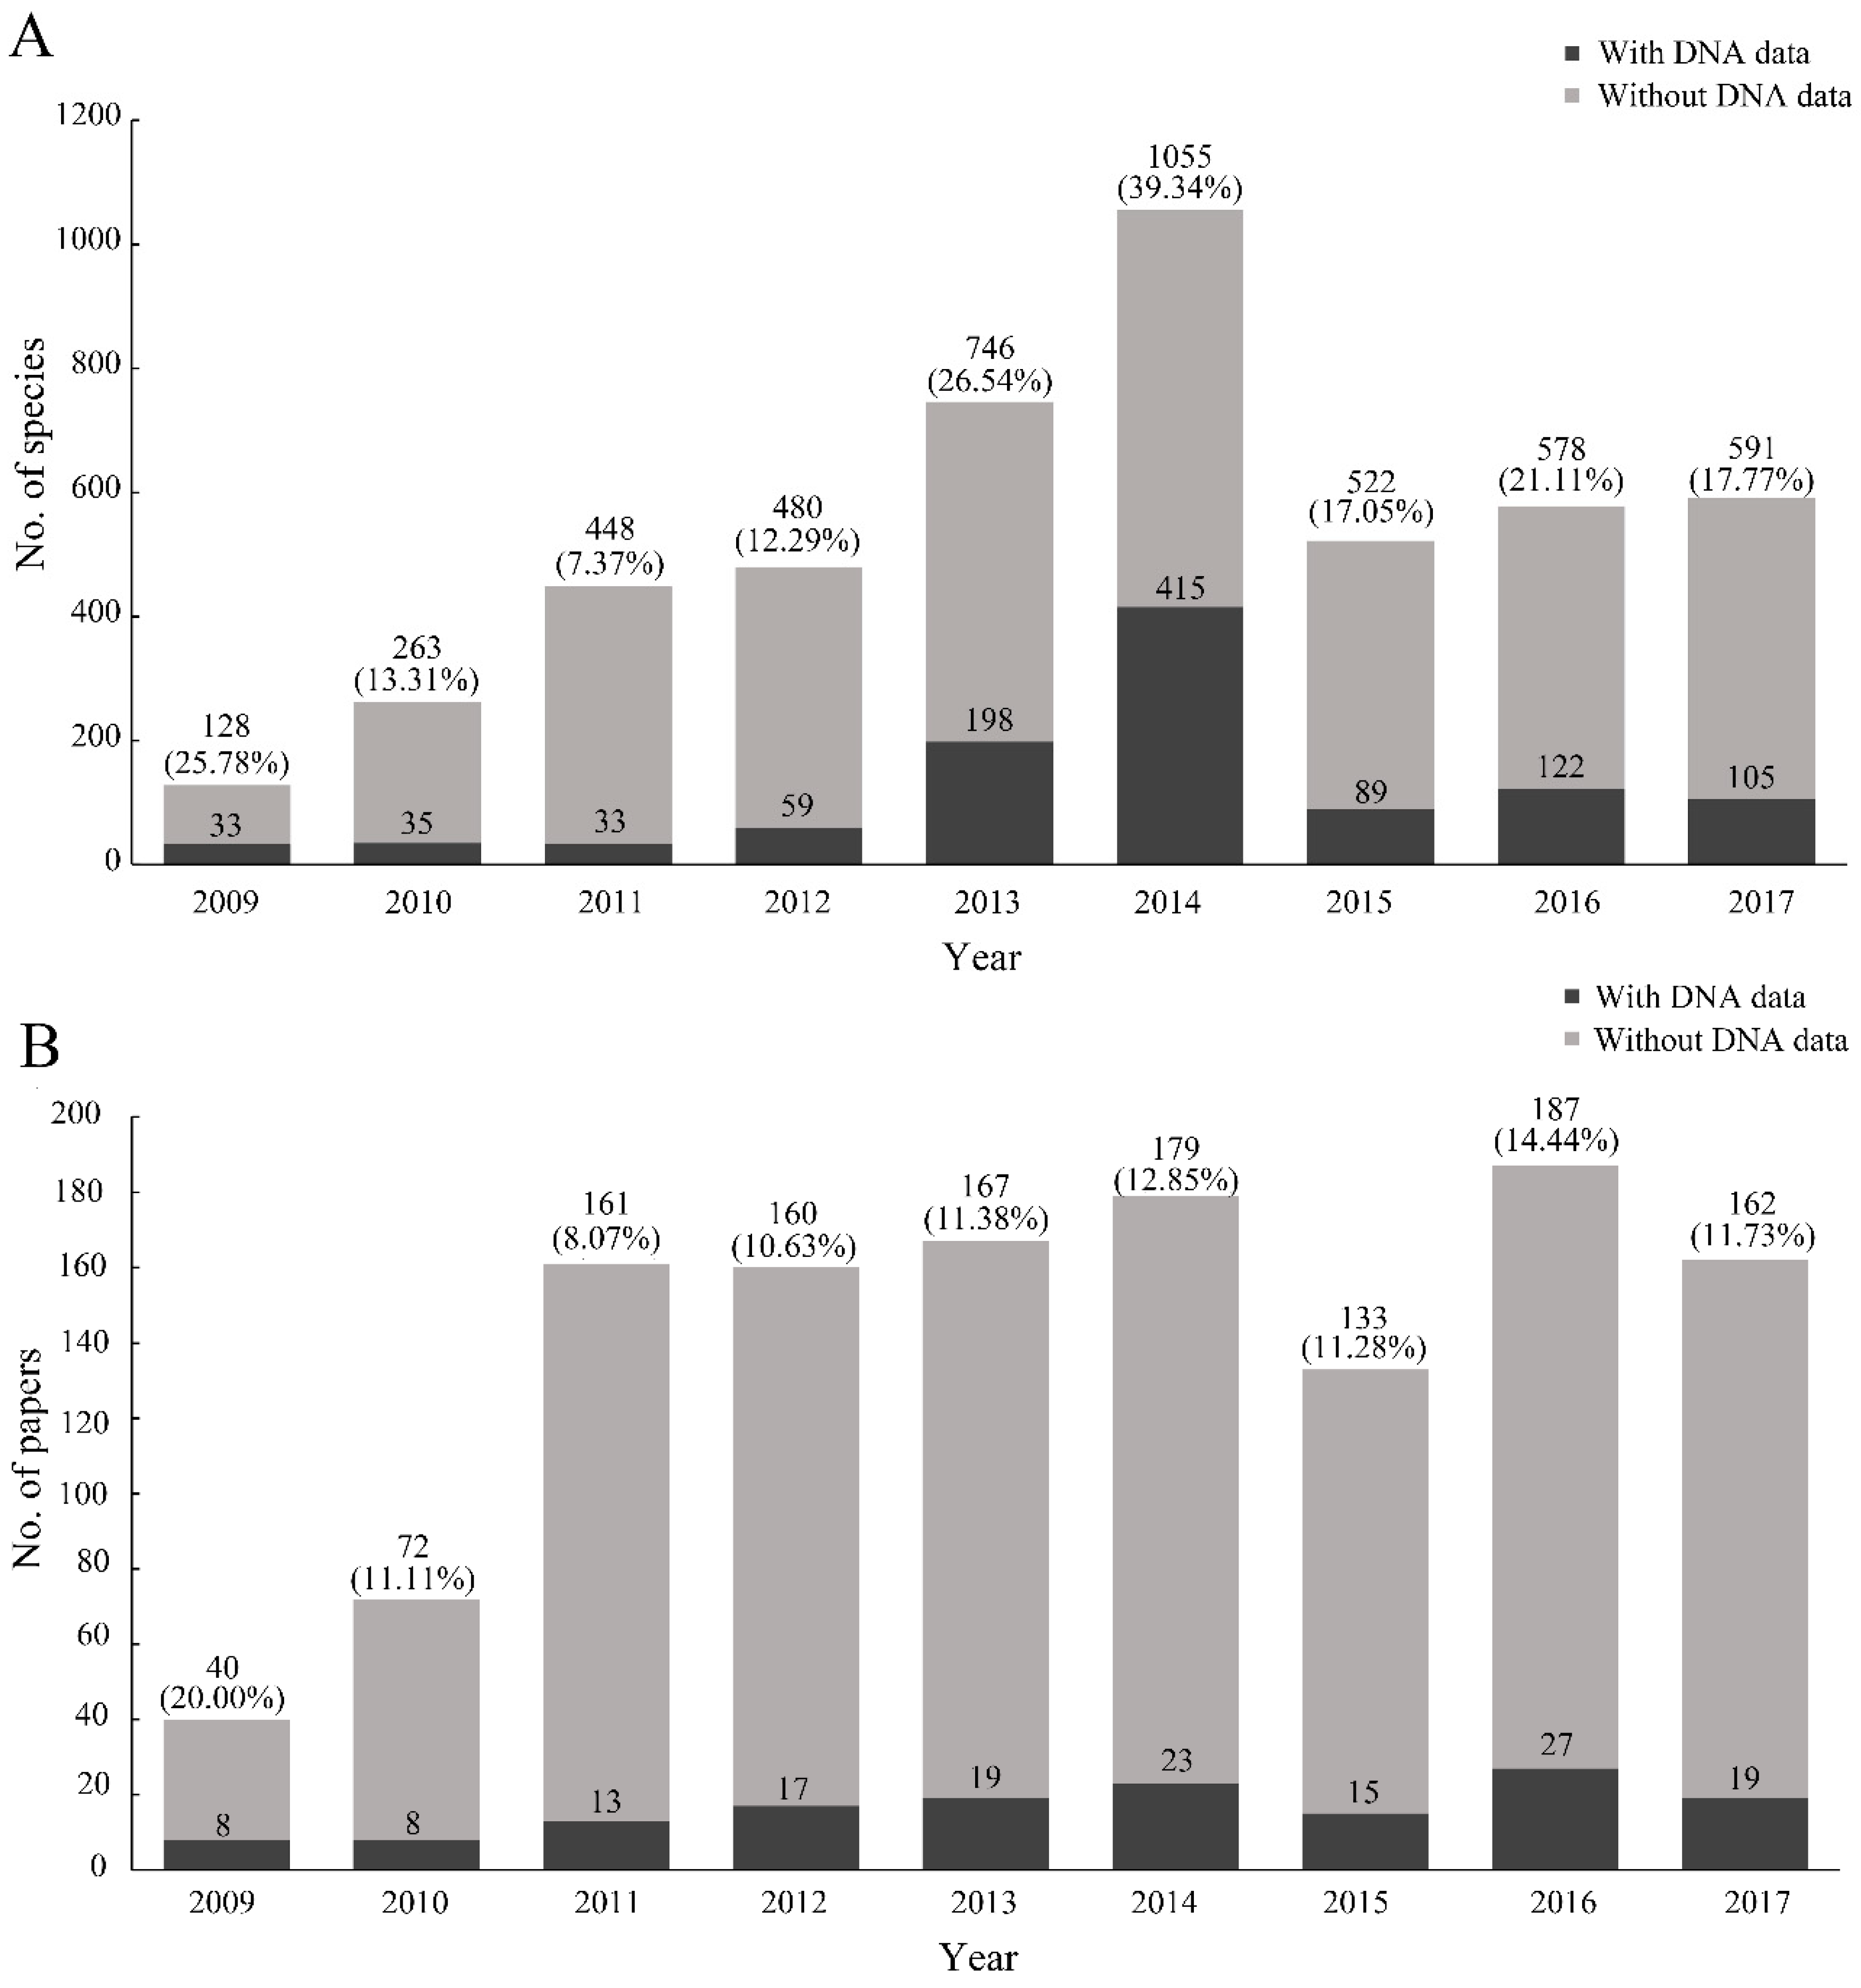
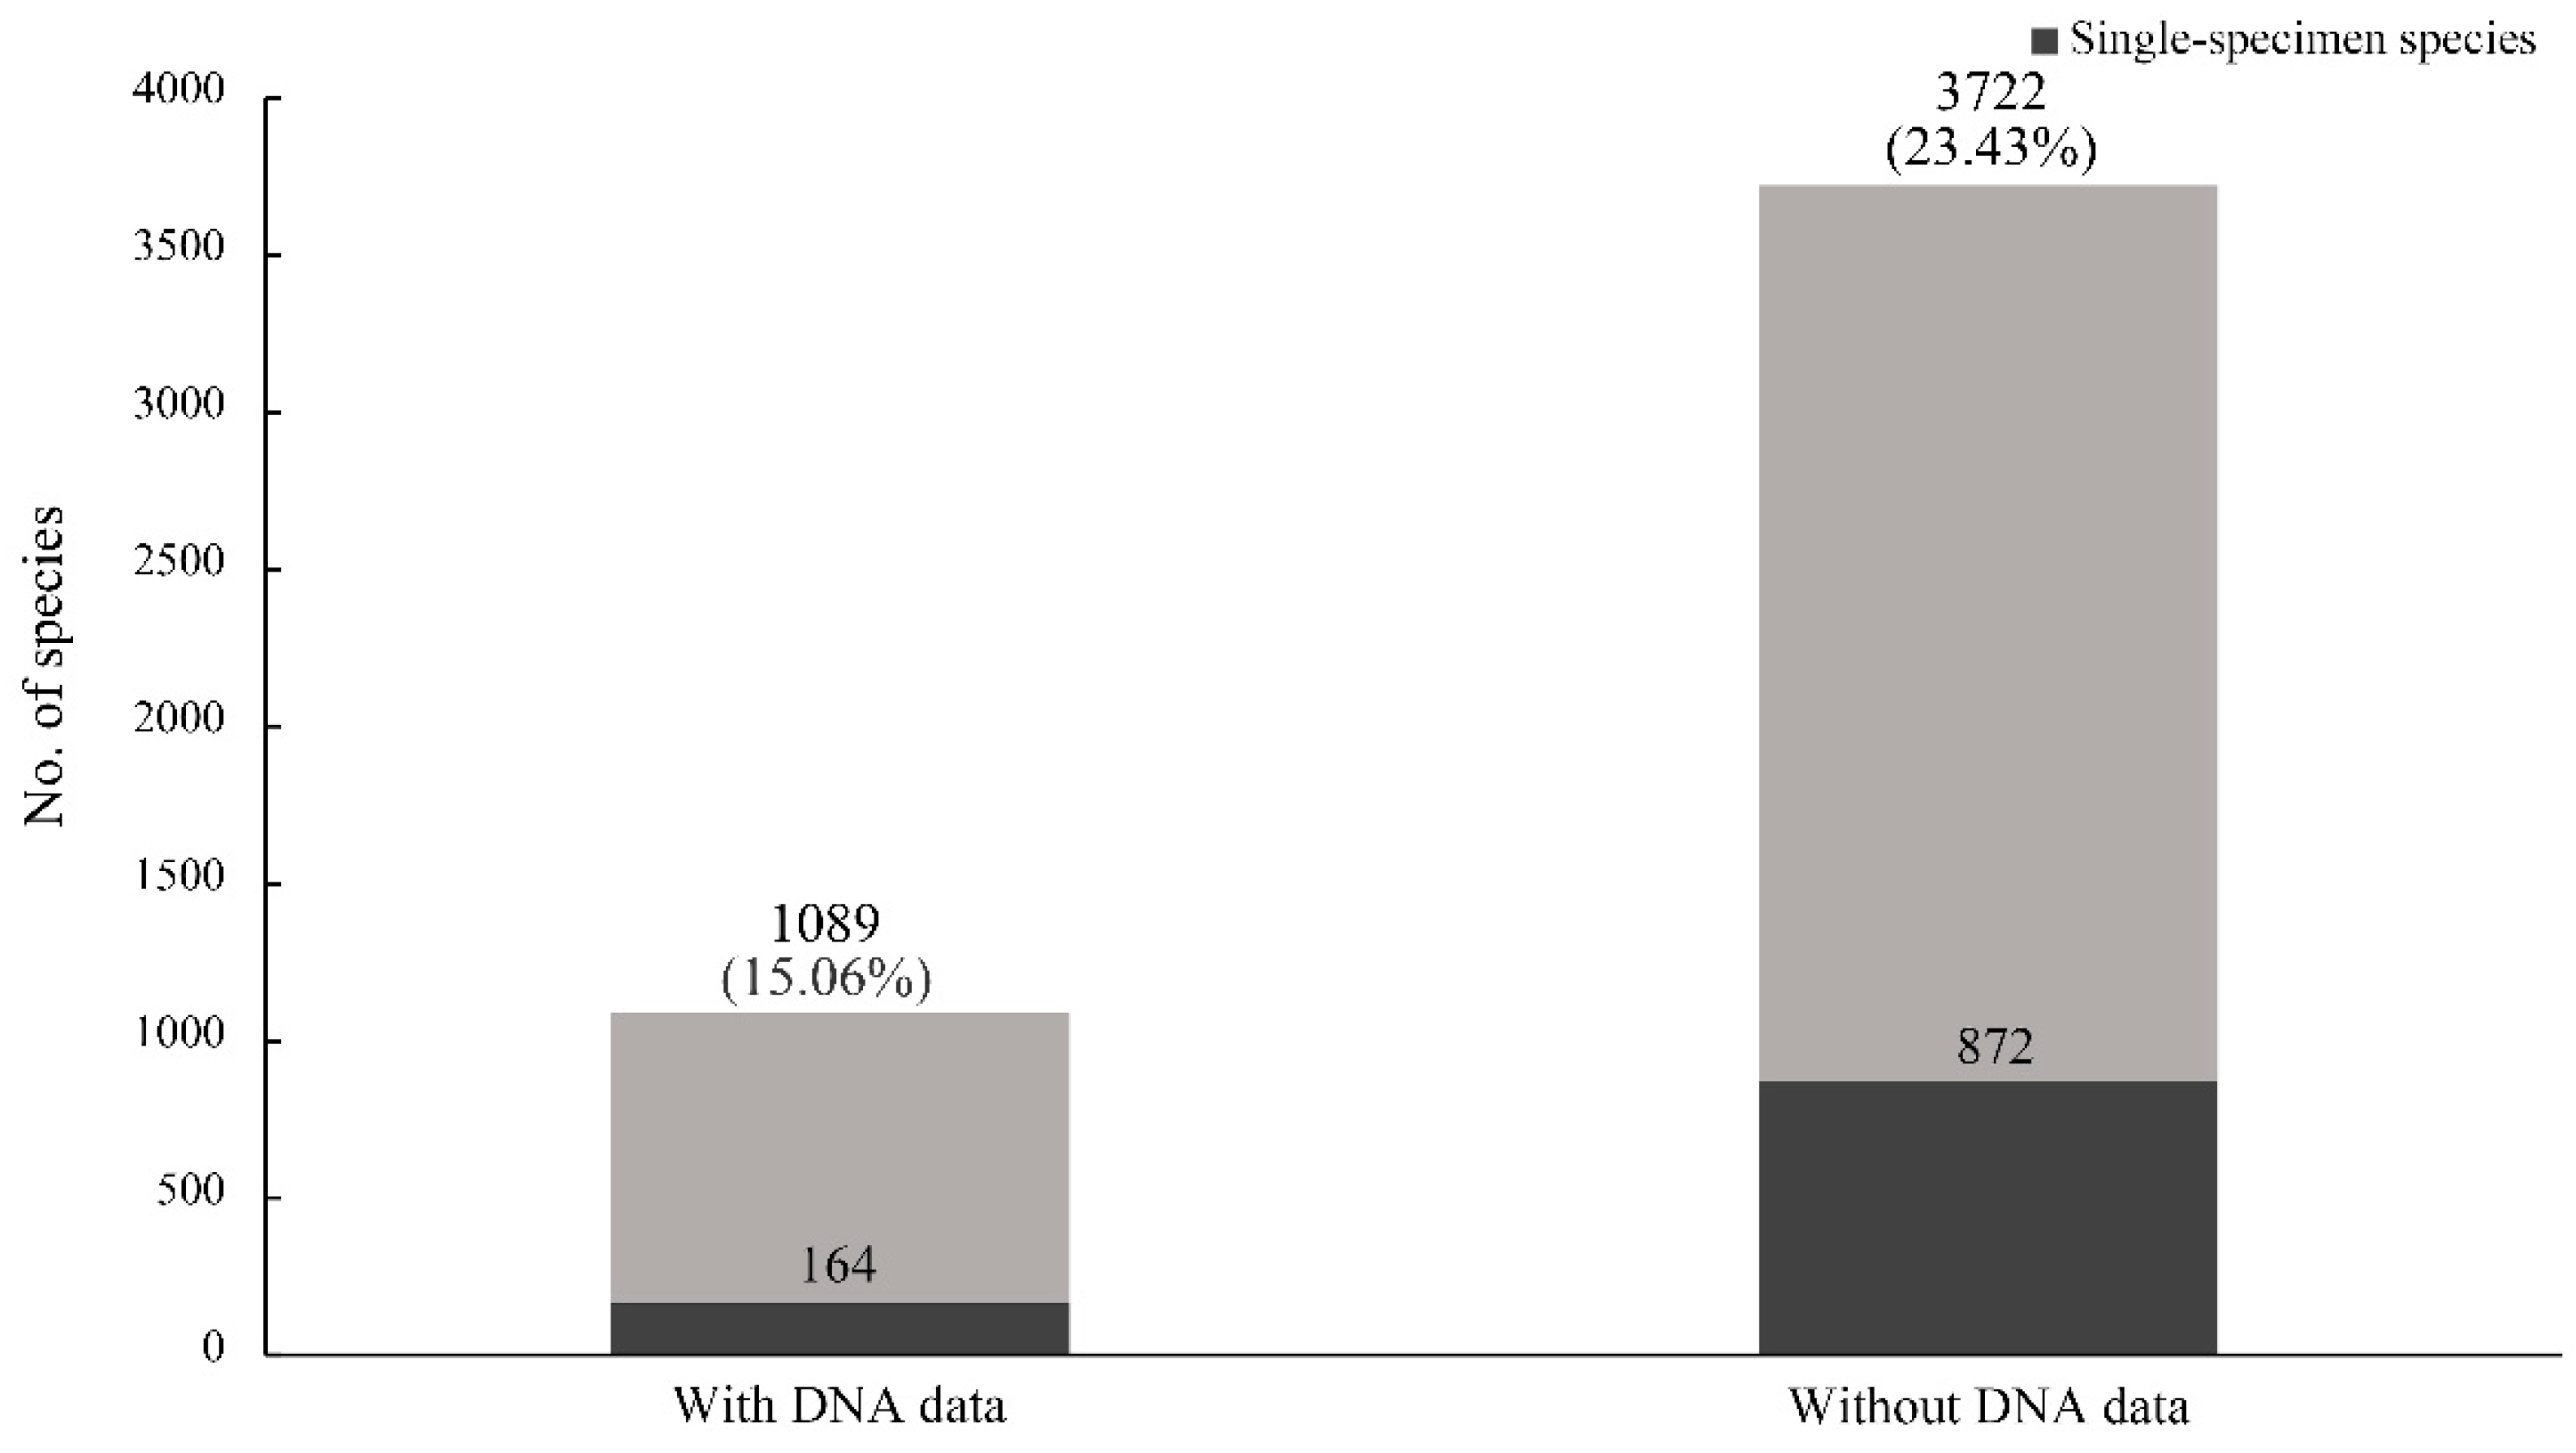
The number of species with DNA data increased since 2009 and then rapidly declined since 2014 (Figure 4A). The year with the highest proportion of species with DNA data (39.34%) was 2014. The possible reason was that some papers included a large number of species with DNA data, which led to the instable trend, such as the papers of Fernandez-Triana et al., Staines and García-Robledo, and Riedel et al. [25,26,27]. Meanwhile, the rate of papers including DNA data was relatively stable, with a mean value of 11.44% (Figure 4B). We found that the rate of single-specimen species with DNA data (15.06%) was lower than that without DNA data (23.43%) (Figure 5). A similar result also appeared between the rates of single-locality species with and without DNA data. The average specimen number for each species with DNA data was 30.61 (standard deviation (SD): 72.91; 95% confidence interval (CI): 26.28–34.95), which was significantly higher (p = 0.00012 < 0.001) compared to 20.89 (SD: 73.04; 95% CI: 18.54–23.23) of species without DNA data.
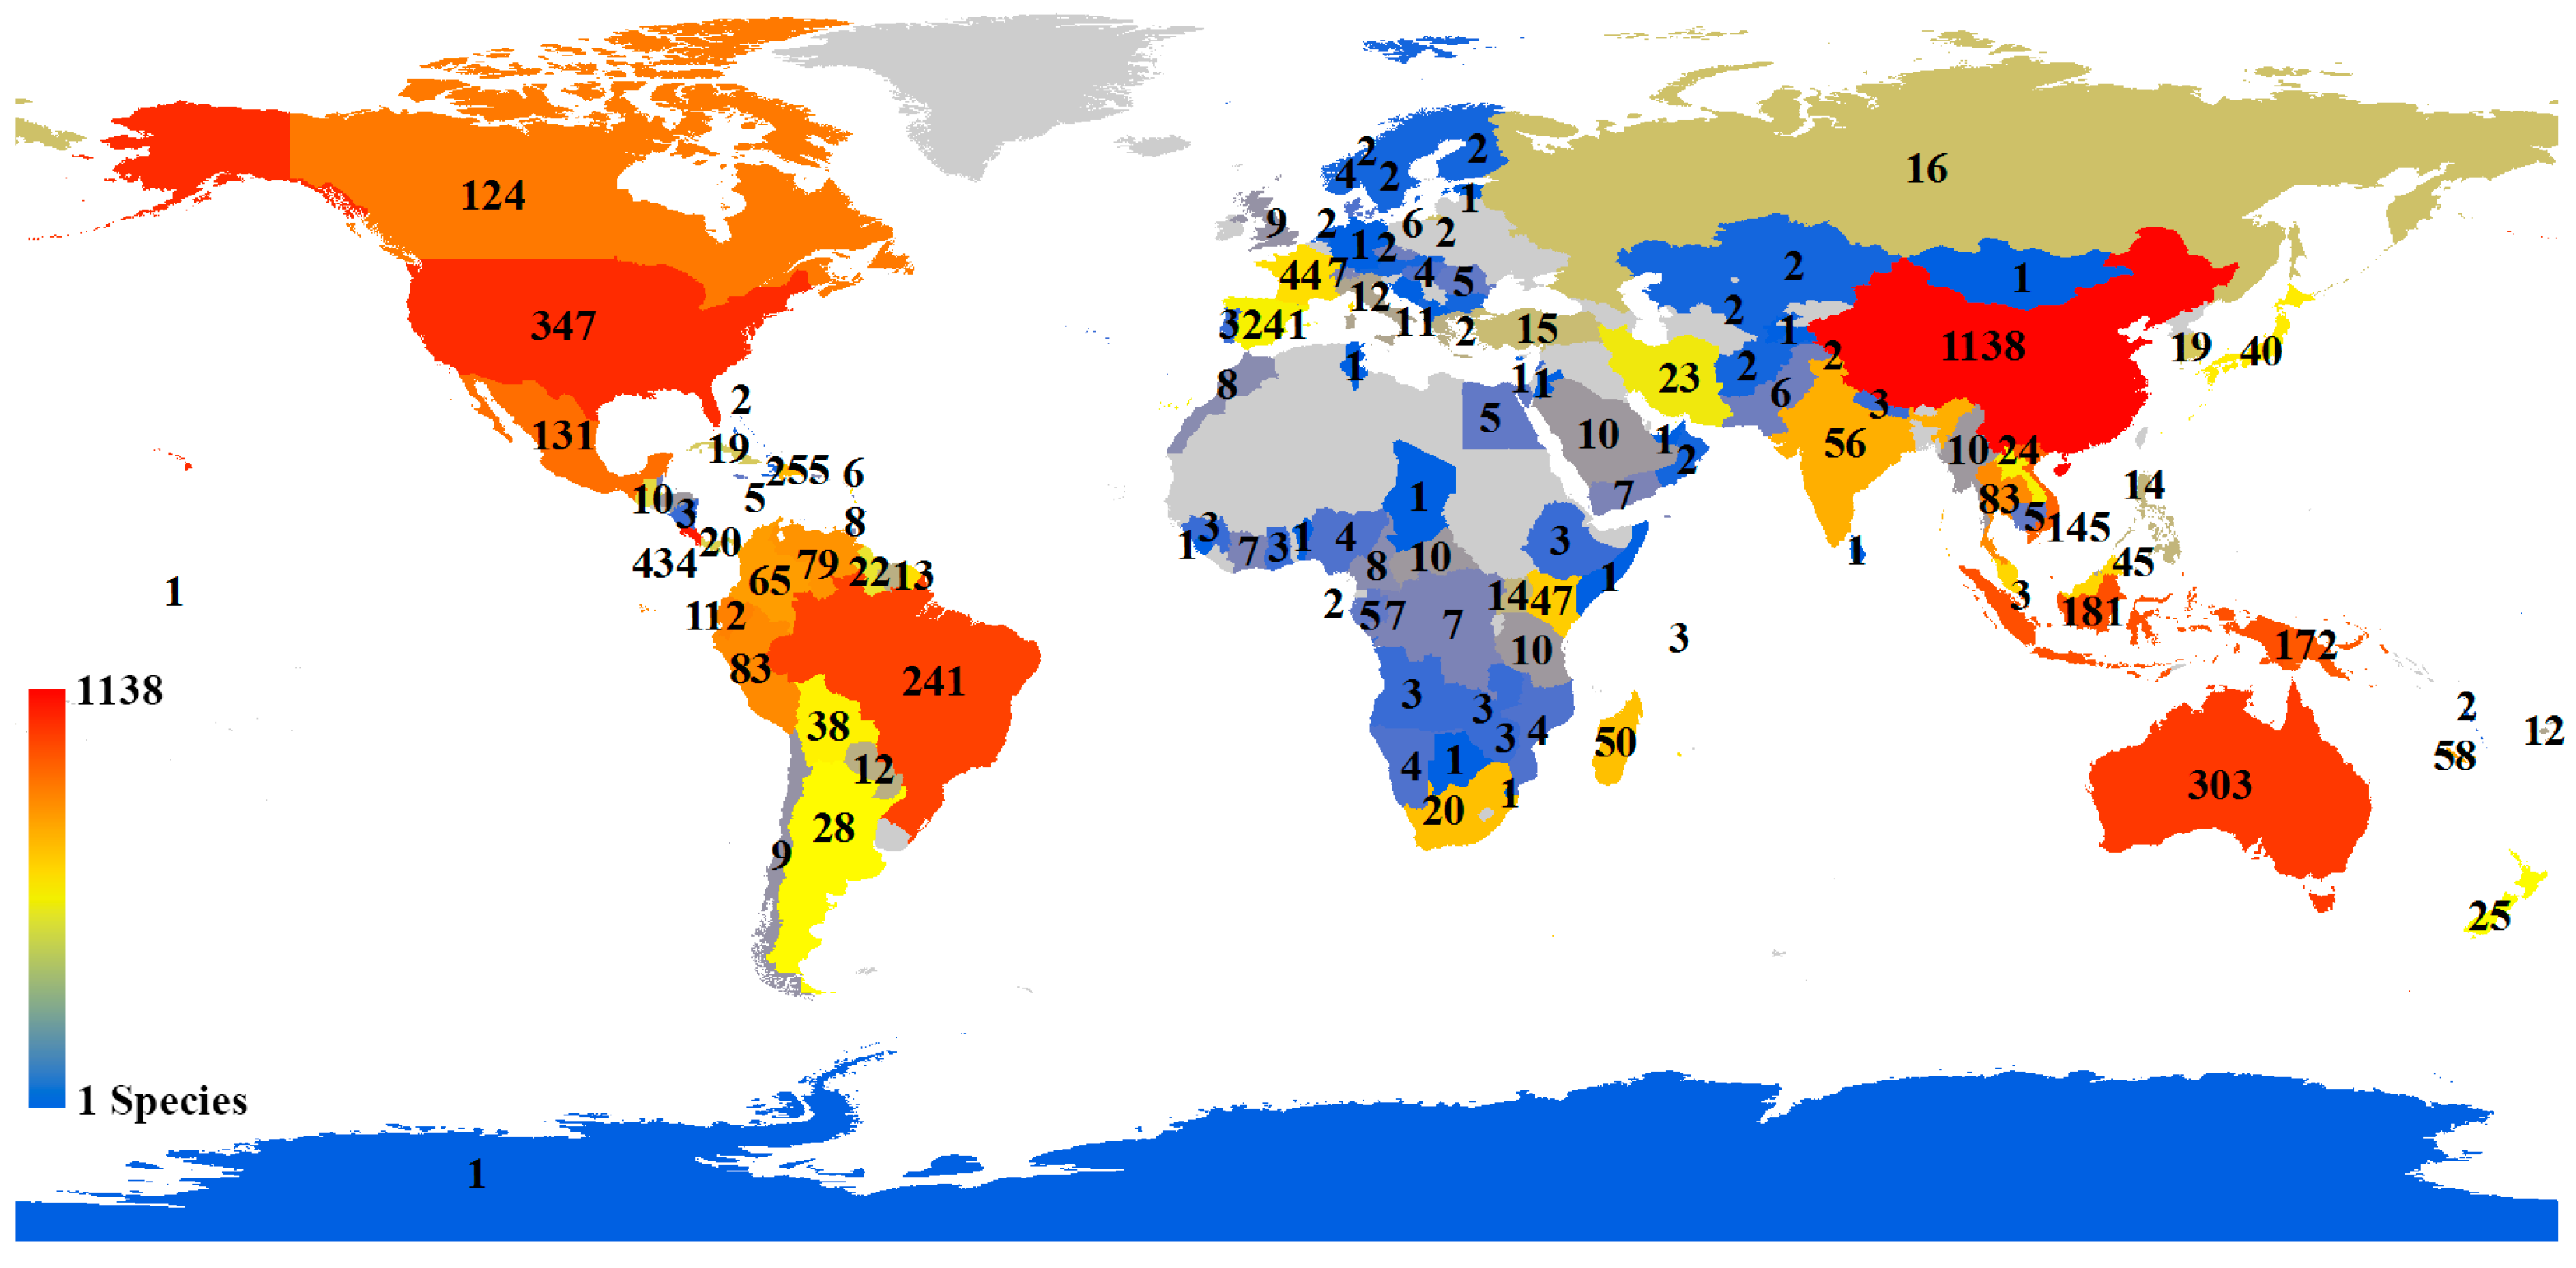
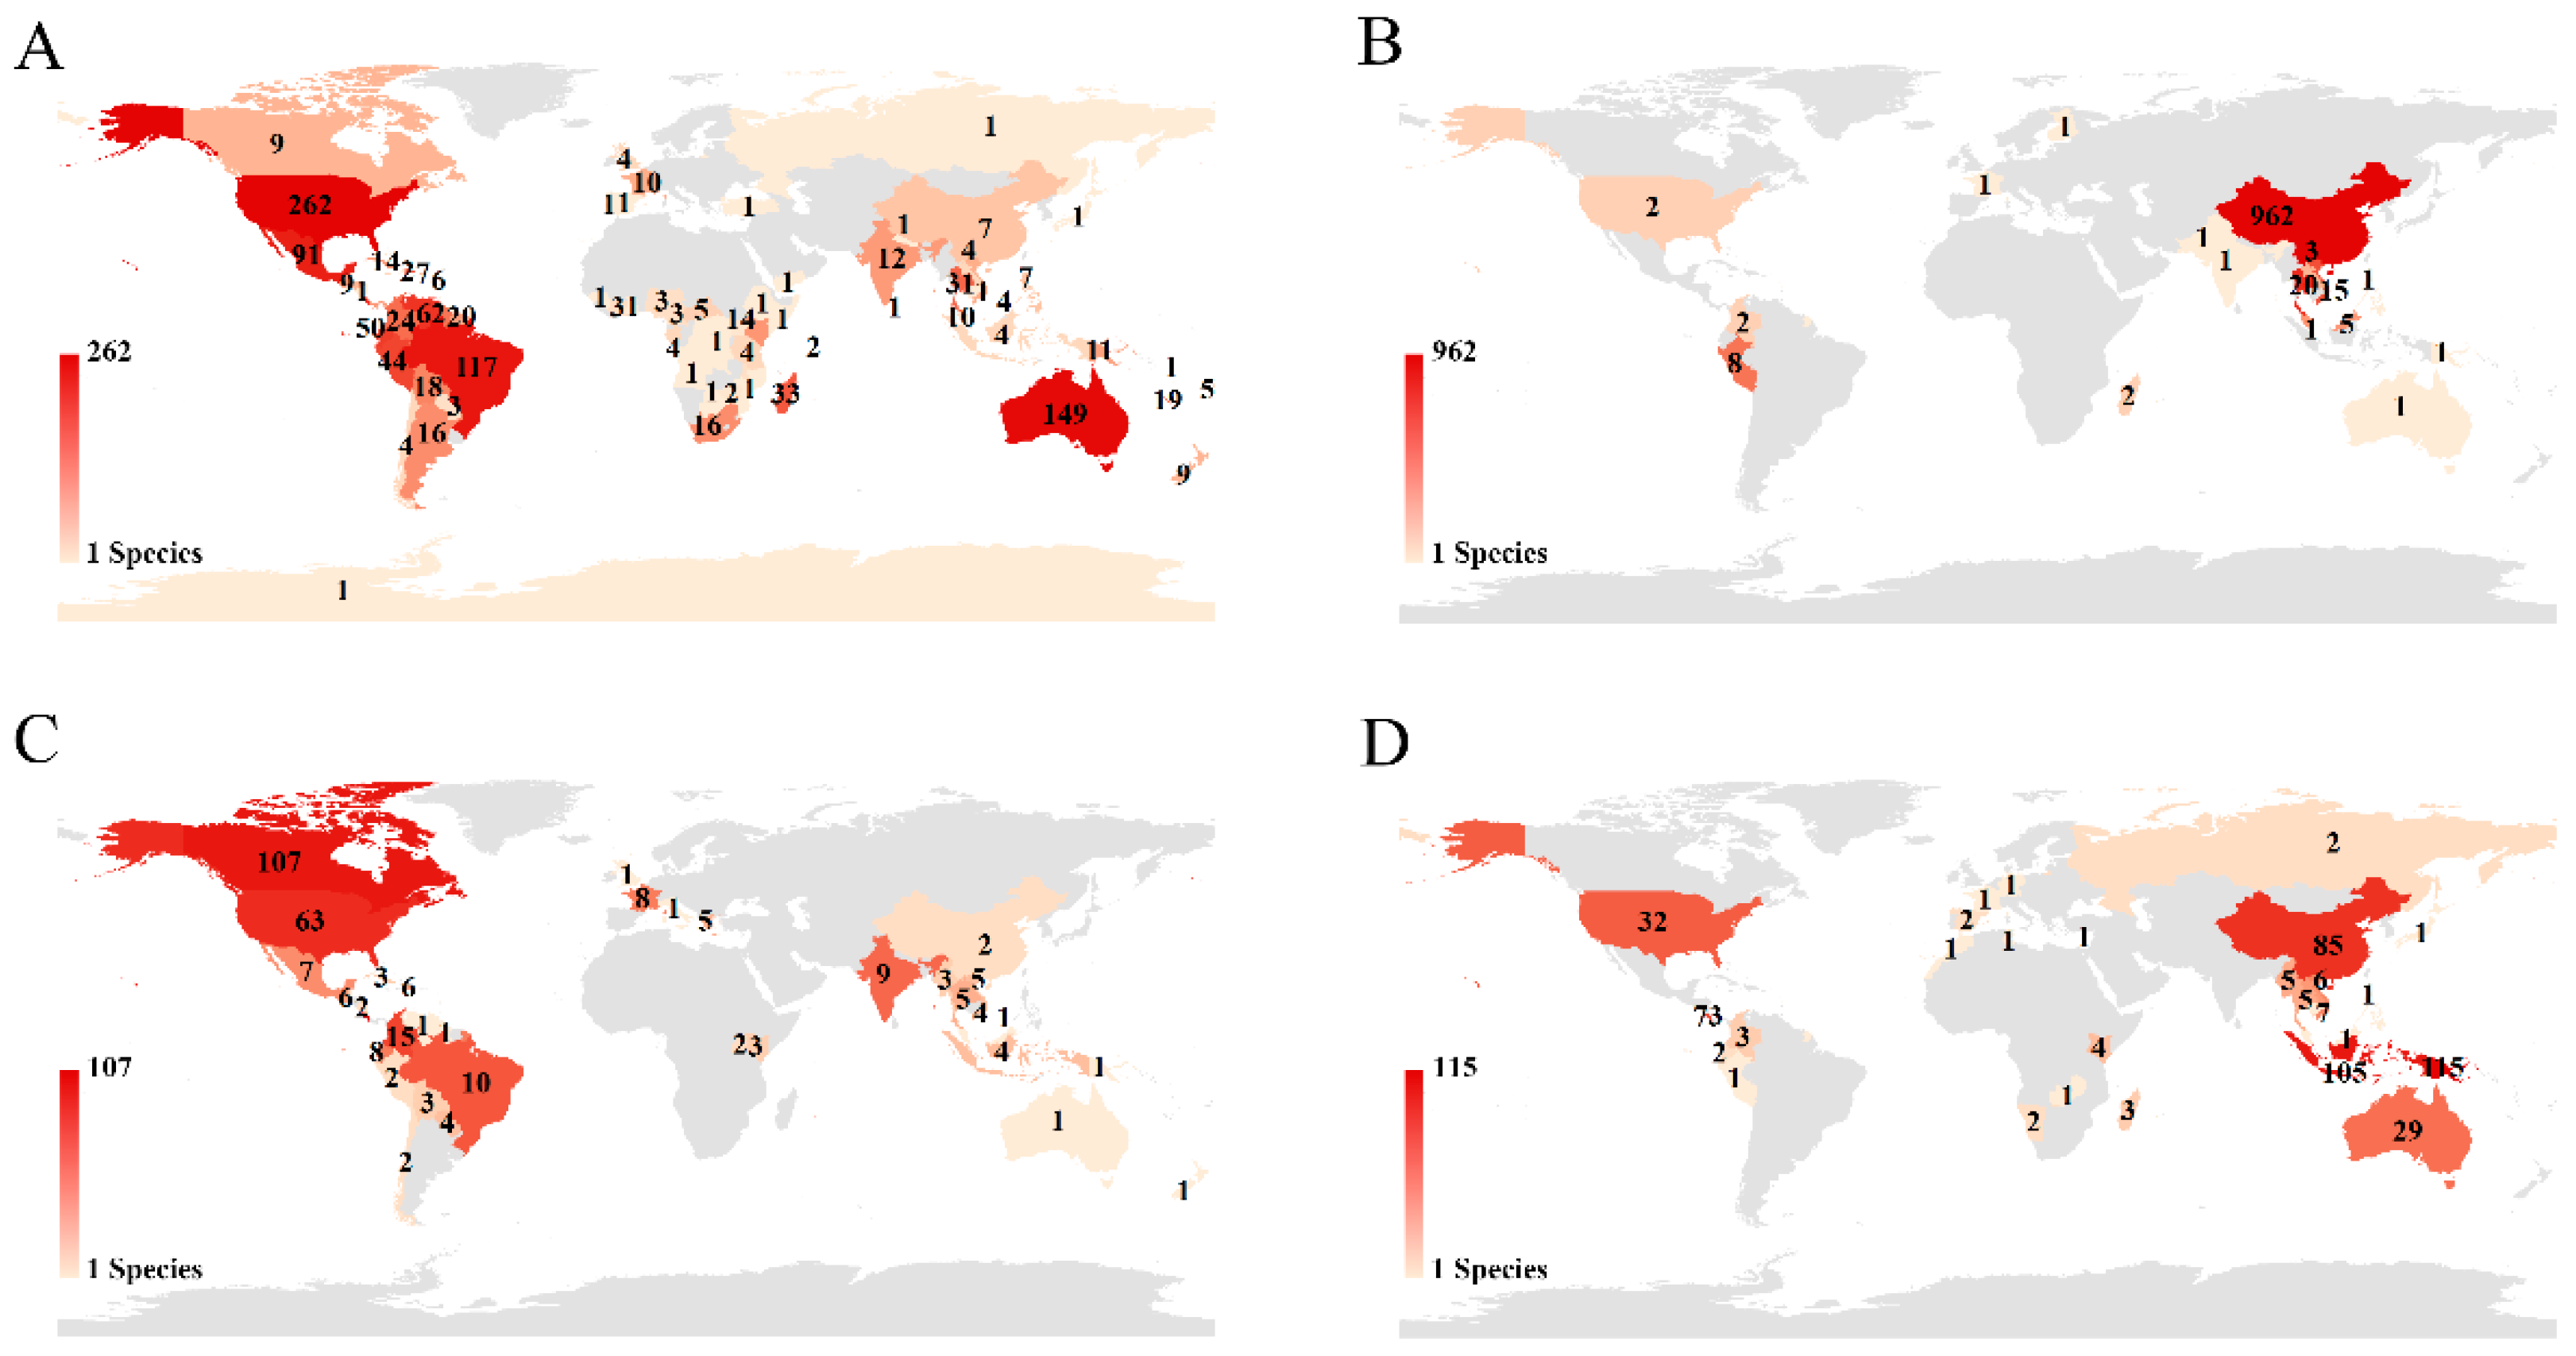
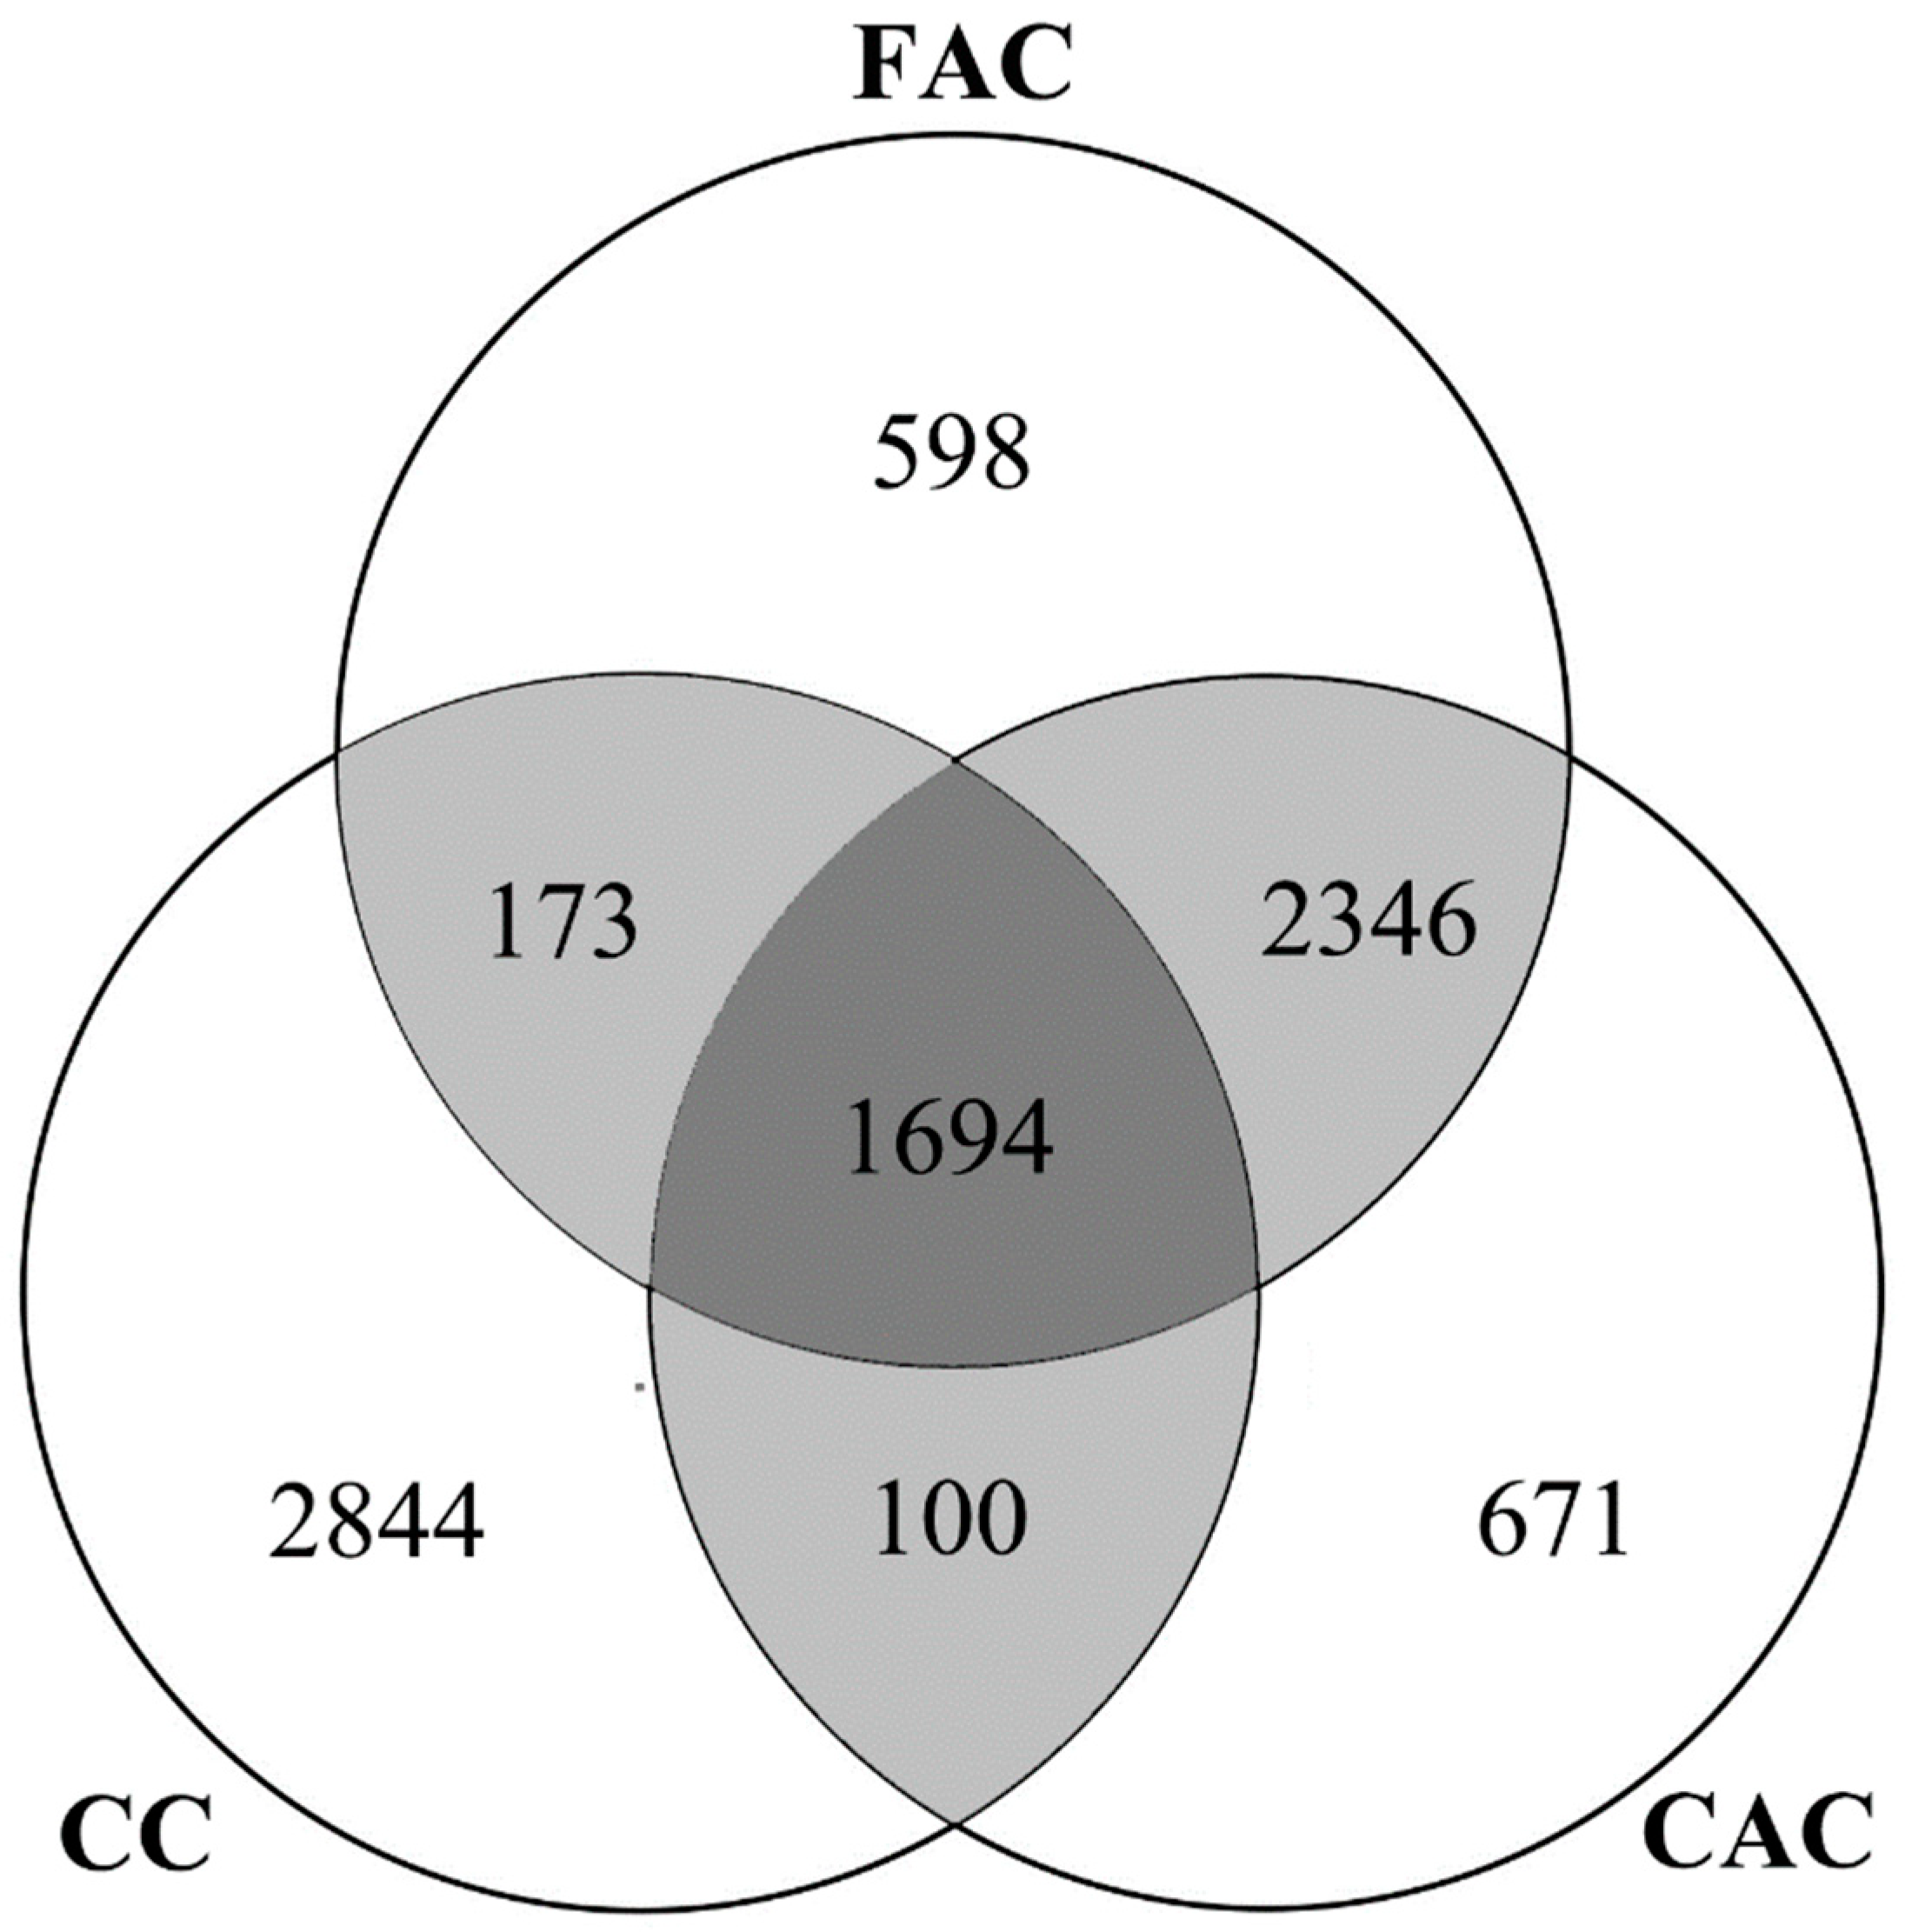
A distribution map of the holotypes of all species showed that it was very uneven for holotype collection localities, though the distributions of holotypes covered 136 countries (Figure 6). The top five countries occupied 51.10% of all holotype records (China: 23.61%; Costa Rica: 9.00%; USA: 7.20%; Australia: 6.29%; and Brazil: 5.00%). We also analyzed the distribution of holotypes of species published by corresponding authors from four countries with the highest numbers of species (Figure 2; USA 27.95%, China 21.37%, Canada 11.54%, and Germany 7.84%). The holotype specimens for USA authors were from 80 countries, especially those on the American continent (USA: 19.42%; Brazil: 8.67%; Mexico: 6.75%) and Australia (11.05%) (Figure 7A). Although Chinese authors published the second-highest number of new species, more than 93.58% holotypes were collected only in China (Figure 7B). For Canadian and German authors, their holotype specimens were from 38 and 28 countries, respectively. Costa Rica (45.95%) became a major collecting country for Canadian authors (Figure 7C), while Papua New Guinea (23.42%), Indonesia (21.38%), and China (17.31%) were popular collection areas for German authors (Figure 7D). As the Venn diagram (Figure 8) indicates, the first and corresponding authors for 4040 of the total 4811 (83.97%) species were from the same countries. There were 1694 species (35.21%) shared by the first author (FAC), the corresponding author (CAC), and the collecting country of holotype (CC), suggesting that the possibility of congruence among the country of holotype collection and the first and corresponding authors was not high. Meanwhile, the holotype collection countries of more than half of all species (2844, 59.11%) were different from the countries of the first and corresponding authors.
4. Discussion
Considering that many species remain undiscovered and undescribed [3,28], it is necessary to increase taxonomic efforts and improve the currently used taxonomic practices to describe more species and their associated information. In traditional insect taxonomy, if a species falls outside of the intraspecific variability range of closely related species, most taxonomists describe it as a new species [17]. However, for species with high phenotypic plasticity (the change in the expressed phenotype of a genotype as a function of the environment) [29], a small number of samples do not adequately represent the entire continuum of morphological variation, which causes uncertainty in species descriptions and may lead to synonyms [13,30]. It has been estimated that 20% of the currently recognized species are undiscovered synonyms [11,31]. Insufficient specimens examined and described by taxonomists might result in the occurrence of these synonyms. Our results suggest a higher proportion of single-specimen species (21.53%) for 4811 insects in comparison to 17.7% single-specimen species (123 of 695 species) in Lim et al.’s survey [17]. Based on our data, the constant temporal trend of the rate of species with single or limited specimens (Figure 1C) indicates a lack of sufficient attention to this problem.
As described by Whittaker et al., many regions of the world remain seriously under-collected for most taxa, and only some available parts of the Earth’s surface have undergone robust analyses of diversity patterns [6]. We found that more than half of new species were collected from only one or two localities, and this phenomenon lasted over time (Figure 1B,D). To overcome the Wallacean shortfall, it is necessary to obtain more available distribution data for every new species. In fact, geographical morphological variation in species is common. For example, in Trilophidia annulata (Orthoptera: Oedipodidae), different sizes of the forewing and hindwing and shapes of the forewing among populations are easily observed [32]. Both the biological and the morphological characteristics of Parthenolecanium corni (Hemiptera: Coccoidea) populations vary geographically and even between host plants within the same region [33]. Therefore, using more specimens from different localities helps represent geographical morphological variation for species identification.
Our results also showed that the rate of single-specimen species with DNA data was lower (15.06%) (Figure 5). This result suggests that incorporating DNA data in species descriptions can decrease the proportion of single-specimen species. Meanwhile, the average specimen number for each species with DNA data was significantly higher than those without DNA data, indicating less specimens might result in a reduction of the probability of using the DNA method. Additionally, another explanation can be due to the possible lack of funding and facilities, as DNA data is hard to obtain for many taxonomic researchers. With the development of molecular techniques, many new methods based on DNA sequencing have been introduced to delimit species boundaries, which commonly require sufficiently large sample sizes for accurate species identification. For example, insufficient sample sizes are considered to lead to possible species misidentification in DNA barcoding [34]. Larger samples are beneficial for the efficacy and accuracy of DNA barcoding [35]. Approximately half of the new species described are based on fewer than five individuals, and 77.36% of 4811 new species do not include DNA data. New types of data yielded from new technologies, such as DNA barcoding and integrative taxonomic practices, can help improve the quality and efficiency of taxonomy [36,37]. We advocate that more DNA data should be introduced into taxonomic practices, which provide an important complementary for morphological identification and drive taxonomists to collect and describe more specimens for each new species.
The holotype numbers from European countries were not high from 2009 to 2017 (Figure 6), but this is understandable if we consider the long history of taxonomy and the well-studied insect fauna in this region. However, by collaborating to collect specimens from other geographical regions, these countries, such as Germany, can still publish many new species, which helps promote international collaboration. The USA and Canada not only describe many new local species but also collaborate extensively with other countries (Figure 7A,C). Compared to taxonomists from these countries, Chinese authors describe most new species based on native specimens. One possible reason is that the taxonomic history in China is not long, and many new species remain to be discovered by Chinese taxonomists. Another possibility is that the international collaboration opportunities available to Chinese taxonomists are still insufficient, especially in describing species collected from other regions. As Figure 8 shows, most collaborations (83.97%) occur when the first authors and corresponding authors are from the same countries, which also indicates that international collaboration should be improved. We think governmental agencies should provide corresponding policy and funding opportunities to improve international collaboration in insect taxonomy. These can include, for example, a funding application that is open for taxonomists from other countries, and training courses in taxonomy provided for young researchers from developing countries.
5. Conclusions
In conclusion, our study shows that single-specimen/locality species are prevalent in the field of insect taxonomy. This problem may prevent a deep understanding of insect diversity patterns in many regions. The average shelf life of a species from the collection of the first specimen to its formal description as a new species is 20.7 years [38]. It seems to there is enough time for taxonomists to collect more specimens before the publication of a new species; in fact, it also possibly reflects that taxonomists cannot prepare enough specimens to describe and publish new species. Some perceived realities may hinder taxonomists from getting more specimens. For instance, some taxonomists may not achieve enough funding sources. The high cost of collecting specimens from distant areas may prevent the use of more specimens in taxonomy. Some old specimens’ lack of imprecise locality or habitat information also hinder further collection. Large funding expenditures have accelerated scientific research in China [39]. China is the second country describing the most new species in ZooKeys (Figure 2). Although our study examined the prevalence of single-specimen/locality species, we do not deny the necessity and value of single-specimen species in taxonomic work. For example, if more specimens are very difficult to obtain and a single specimen is significantly different (stable and clear morphological or genetic characteristics) from all other taxa, single-specimen/locality species should be published. However, it cannot be denied that the species descriptions based on single-specimen/locality species sometimes are unwarranted or deficient and may incur further taxonomic revisions and future time and economic costs. By reporting this empirical analysis, we hope more discussion on this issue can be stimulated. We suggest that practices, such as increasing the number of specimens and geographical coverage of sampling, the use of DNA data and integrative taxonomy, and international collaboration, might be adopted by more taxonomists in the description of new insect species.
Supplementary Materials
The following are available online at https://0-www-mdpi-com.brum.beds.ac.uk/1424-2818/11/7/106/s1, Table S1: Final dataset containing a total of 1261 papers with 4811 new species.
Author Contributions
Conceptualization, J.D. and X.H.; methodology, J.D. and Y.G.; software, Y.G. and Z.C.; formal analysis, Y.G., C.L., and Z.C.; data collection, Y.G.; writing—original draft preparation, J.D., and Y.G.; writing—review and editing, J.D. and X.H.; visualization, Z.C.
Funding
The work was supported by grants from the National Natural Science Foundation of China (Grant Numbers: 31772504, 31601860), National Key R&D Program of China (2016YFE0203100), and Fujian Provincial Department of Science & Technology (2015J06005).
Acknowledgments
The authors are grateful to suggestions from reviewers.
Conflicts of Interest
The authors declare no conflict of interest.
References
- Chapman, A.D. Numbers of Living Species in Australia and the World, 2nd ed.; Australian Biodiversity Information Services: Canberra, Australia, 2009; p. 80. [Google Scholar]
- Mora, C.; Tittensor, D.P.; Adl, S.; Simpson, A.G.; Worm, B. How many species are there on Earth and in the ocean? PLoS Biol. 2011, 9, e1001127. [Google Scholar] [CrossRef] [PubMed]
- Costello, M.J.; Wilson, S.; Houlding, B. Predicting total global species richness using rates of species description and estimates of taxonomic effort. Syst. Biol. 2012, 61, 871–883. [Google Scholar] [CrossRef] [PubMed]
- Roskov, Y.; Abucay, L.; Orrell, T.; Nicolson, D.; Bailly, N.; Kirk, P.M.; Bourgoin, T.; DeWalt, R.E.; Decock, W.; De Wever, A.; et al. Species 2000 & ITIS Catalogue of Life, 2018 Annual Checklist; Species 2000; Naturalis Biodiversity Center: Leiden, The Netherlands, 2018; ISSN 2405-884X. Available online: www.catalogueoflife.org/annual-checklist/2018 (accessed on 8 March 2018).
- Cardoso, P.; Erwin, T.L.; Borges, P.A.V.; New, T.R. The seven impediments in invertebrate conservation and how to overcome them. Biol. Conserv. 2011, 144, 2647–2655. [Google Scholar] [CrossRef] [Green Version]
- Whittaker, R.J.; Araújo, M.B.; Jepson, P.; Ladle, R.J.; Watson, J.E.M.; Willis, K.J. Conservation biogeography: Assessment and prospect. Divers. Distrib. 2005, 11, 3–23. [Google Scholar] [CrossRef]
- Lomolino, M.V.; Heaney, L.R. Frontiers of Biogeography: New Directions in the Geography of Nature; Sinauer Associates: Sunderland, MA, USA, 2004; pp. 293–296. [Google Scholar]
- Laurance, W.F. When bigger is better: The need for Amazonian mega-reserves. Trends Ecol. Evol. 2005, 20, 645–648. [Google Scholar] [CrossRef] [PubMed]
- Bini, L.M.; Diniz-Filho, J.A.F.; Rangel, T.F.; Bastos, R.P.; Pinto, M.P. Challenging Wallacean and Linnean shortfalls: Knowledge gradients and conservation planning in a biodiversity hotspot. Divers. Distrib. 2006, 12, 475–482. [Google Scholar] [CrossRef]
- Margules, C.R.; Pressey, R.L. Systematic conservation planning. Nature 2000, 405, 243–253. [Google Scholar] [CrossRef] [PubMed]
- Costello, M.J.; May, R.M.; Stork, N.E. Can we name Earth’s species before they go extinct? Science 2013, 339, 413–416. [Google Scholar] [CrossRef]
- Wiens, J.J. Species delimitation: new approaches for discovering diversity. Syst. Biol. 2007, 56, 875–878. [Google Scholar] [CrossRef]
- Dayrat, B. Toward integrative taxonomy. Biol. J. Linn. Soc. 2005, 85, 407–415. [Google Scholar] [CrossRef]
- Valdecasas, A.G.; Williams, D.; Wheeler, Q.D. Integrative taxonomy’ then and now: A response to Dayrat (2005). Biol. J. Linn. Soc. 2008, 93, 211–216. [Google Scholar] [CrossRef]
- Jörger, K.M.; Schrödl, M. How to describe a cryptic species? Practical challenges of molecular taxonomy. Front. Zool. 2013, 10, 1. [Google Scholar] [CrossRef] [PubMed]
- Fontaine, B.; van Achterberg, K.; Alonso-Zarazaga, M.A.; Araujo, R.; Asche, M.; Aspock, H.; Aspōck, U.; Audisio, P.; Aukema, B.; Bailly, N.; et al. New species in the Old World: Europe as a frontier in biodiversity exploration, a test bed for 21st century taxonomy. PLoS ONE 2012, 7, e36881. [Google Scholar] [CrossRef] [PubMed]
- Lim, G.S.; Balke, M.; Meier, R. Determining species boundaries in a world full of rarity: singletons, species delimitation methods. Syst. Biol. 2012, 61, 165–169. [Google Scholar] [CrossRef] [PubMed]
- Hebert, P.; Stoeckle, M.; Zemlak, T.; Francis, C. Identification of birds through DNA barcodes. PLoS Biol. 2004, 2, e312. [Google Scholar] [CrossRef] [PubMed]
- Pons, J.; Barraclough, T.G.; Gomez-Zurita, J.; Cardoso, A.; Duran, D.P.; Hazell, S.; Kamoun, S.; Sumlin, W.D.; Vogler, A.P. Sequence based species delimitation for the DNA taxonomy of undescribed insects. Syst. Biol. 2006, 55, 595–609. [Google Scholar] [CrossRef] [PubMed]
- Zhang, J.; Kapli, P.; Pavlidis, P.; Stamatakis, A. A general species delimitation method with applications to phylogenetic placements. Bioinformatics 2013, 29, 2869–2876. [Google Scholar] [CrossRef] [PubMed] [Green Version]
- Puillandre, N.; Lambert, A.; Brouillet, S.; Achaz, G. ABGD, Automatic Barcode Gap Discovery for primary species delimitation. Mol. Ecol. 2012, 21, 1864–1877. [Google Scholar] [CrossRef]
- Luo, A.; Lan, H.; Ling, C.; Zhang, A.; Shi, L.; Ho, S.Y.; Zhu, C. A simulation study of sample size for DNA barcoding. Ecol. Evol. 2015, 5, 5869–5879. [Google Scholar] [CrossRef] [Green Version]
- Blahnik, R.J.; Holzenthal, R.W. Review and redescription of species in the Oecetis avara group, with the description of 15 new species (Trichoptera, Leptoceridae). Zookeys 2014, 376, 1. [Google Scholar] [CrossRef]
- Mathis, W.N.; Zatwarnicki, T. A revision of the new world species of Polytrichophora Cresson and Facitrichophora, new genus (Diptera, Ephydridae). ZooKeys 2012, 231, 1. [Google Scholar] [CrossRef] [PubMed]
- Fernández-Triana, J.L.; Whitfield, J.B.; Rodriguez, J.J.; Smith, M.A.; Janzen, D.H.; Hallwachs, W.D.; Hajibabaei, M.; Burns, J.M.; Solis, M.A.; Brown, J.; et al. Review of Apanteles sensu stricto (Hymenoptera, Braconidae, Microgastrinae) from Area de Conservación Guanacaste, northwestern Costa Rica, with keys to all described species from Mesoamerica. ZooKeys 2014, 383, 1. [Google Scholar] [CrossRef] [PubMed]
- Staines, C.L.; García-Robledo, C. The genus Cephaloleia Chevrolat, 1836 (Coleoptera, Chrysomelidae, Cassidinae). ZooKeys 2014, 436, 1. [Google Scholar] [CrossRef] [PubMed]
- Riedel, A.; Tänzler, R.; Balke, M.; Rahmadi, C.; Suhardjono, Y.R. Ninety-eight new species of Trigonopterus weevils from Sundaland and the Lesser Sunda Islands. ZooKeys 2014, 467, 1. [Google Scholar] [CrossRef] [PubMed]
- Hamilton, A.J.; Basset, Y.; Benke, K.K.; Grimbacher, P.S.; Miller, S.E.; Novotný, V.; Samuelson, G.A.; Stork, N.E.; Weiblen, G.D.; Yen, J.D. Quantifying uncertainty in estimation of tropical arthropod species richness. Am. Nat. 2010, 176, 90–95. [Google Scholar] [CrossRef] [PubMed]
- Scheiner, S.M. Genetics and evolution of phenotypic plasticity. Annu. Rev. Ecol. Syst. 1993, 24, 35–68. [Google Scholar] [CrossRef]
- Eastop, V.F.; Blackman, R.L. Some new synonyms in Aphididae (Hemiptera: Sternorrhyncha). Zootaxa 2005, 1089, 1–36. [Google Scholar] [CrossRef] [Green Version]
- May, R.M. Ecological science and tomorrow’s world. Philos. Trans. R. Soc. B Biol. Sci. 2010, 365, 41–47. [Google Scholar] [CrossRef] [PubMed]
- Bai, Y.; Dong, J.J.; Guan, D.L.; Xie, J.Y.; Xu, S.Q. Geographic variation in wing size and shape of the grasshopper Trilophidia annulata (Orthoptera: Oedipodidae): morphological trait variations follow an ecogeographical rule. Sci. Rep. UK 2016, 6, 32680. [Google Scholar] [CrossRef]
- Ben-Dov, Y.; Hodgson, C.J. Soft Scale Insects: Their Biology, Natural Enemies and Control. In World Crop Pests; Ben-Dov, Y., Hodgson, C.J., Sabelis, M.W., Eds.; Elsevier: Amsterdam, The Netherlands, 1997; Volume 7A, p. 452. [Google Scholar]
- Zhang, A.B.; He, L.J.; Crozier, R.H.; Muster, C.; Zhu, C.D. Estimating sample sizes for DNA barcoding. Mol. Phylogenet. Evol. 2010, 54, 1035–1039. [Google Scholar] [CrossRef]
- Bergsten, J.; Bilton, D.T.; Fujisawa, T.; Elliott, M.; Monaghan, M.T.; Balke, M.; Hendrich, L.; Geijer, J.; Herrmann, J.; Foster, G.N. The effect of geographical scale of sampling on DNA barcoding. Syst. Biol. 2012, 61, 851–869. [Google Scholar] [CrossRef] [PubMed]
- Hebert, P.D.N.; Cywinska, A.; Ball, S.L.; Dewaard, J.R. Biological identification through DNA barcodes. Proc. R. Soc. Lond. Ser. B Biol. Sci. 2003, 270, 313–321. [Google Scholar] [CrossRef] [PubMed]
- Schlicksteiner, B.C.; Steiner, F.M.; Seifert, B.; Stauffer, C.; Christian, E.; Crozier, R.H. Integrative taxonomy: A multisource approach to exploring biodiversity. Annu. Rev. Entomol. 2010, 55, 421–438. [Google Scholar] [CrossRef] [PubMed]
- Fontaine, B.; Perrard, A.; Bouchet, P. 21 years of shelf life between discovery and description of new species. Curr. Biol. 2012, 22, R943–R944. [Google Scholar] [CrossRef] [PubMed] [Green Version]
- Zhou, P.; Leydesdorff, L. The emergence of China as a leading nation in science. Res. Policy 2006, 35, 83–104. [Google Scholar] [CrossRef] [Green Version]
Figure 1.
The distribution of numbers of type specimens and localities used in the descriptions of new insect species during 2009 to 2017. (A) Type of specimens, usage, and number of species. (B) Locality coverage of the type of specimens and number of species. (C) Temporal trend of the number of type of specimens used. (D) Temporal trend of number of localities of the type of specimens.

Figure 2.
Numbers (dark gray) and relative proportions (percentages in parentheses) of (A) single-specimen species and (B) single-locality species described by authors from the top 10 countries that published the most new species. Values before parentheses indicate the total numbers of species described.

Figure 3.
Numbers (dark gray) and relative proportions (percentages in parentheses) of (A) single-specimen species and (B) single-locality species described by authors from the top 10 insect orders of the most published new species. Values before parentheses indicate total numbers of species described.

Figure 4.
The usage of DNA data in species description from 2009 to 2017. (A) Numbers of new species with DNA data (dark gray) as well as the total numbers of species (values before parentheses). (B) Numbers of papers with DNA data (dark gray) as well as the total numbers of papers (values before parentheses). The percentages are indicated in parentheses.

Figure 5.
Relative proportions of single-specimen species (dark gray) from papers with DNA data versus that without DNA data in species description. The total numbers of species described in these papers and the percentages of single-specimen species are indicated before and in parentheses.
Figure 5.
Relative proportions of single-specimen species (dark gray) from papers with DNA data versus that without DNA data in species description. The total numbers of species described in these papers and the percentages of single-specimen species are indicated before and in parentheses.

Figure 6.
The distribution map of 4811 insect new species from 2009 to 2017 based on collection localities of the holotypes. Different colors represent total number of species described from different countries in this period.
Figure 6.
The distribution map of 4811 insect new species from 2009 to 2017 based on collection localities of the holotypes. Different colors represent total number of species described from different countries in this period.

Figure 7.
The distribution maps of holotypes of new species published by authors from the top four countries. (A) USA. (B) China. (C) Canada. (D) Germany. The degree of the red color represents the different amounts of new species described.
Figure 7.
The distribution maps of holotypes of new species published by authors from the top four countries. (A) USA. (B) China. (C) Canada. (D) Germany. The degree of the red color represents the different amounts of new species described.

Figure 8.
The nonproportional Venn diagram showing subsets of numbers of new species described based on the countries of the first author (FAC), the corresponding author (CAC), and collecting country of holotype (CC). Dark gray represents the species for which the FAC, CAC, and CC are the same, and light gray indicates the species for which two of the three types (FAC, CAC, and CC) are the same.

© 2019 by the authors. Licensee MDPI, Basel, Switzerland. This article is an open access article distributed under the terms and conditions of the Creative Commons Attribution (CC BY) license (http://creativecommons.org/licenses/by/4.0/).
Share and Cite
MDPI and ACS Style
Deng, J.; Guo, Y.; Cheng, Z.; Lu, C.; Huang, X. The Prevalence of Single-Specimen/Locality Species in Insect Taxonomy: An Empirical Analysis. Diversity 2019, 11, 106. https://0-doi-org.brum.beds.ac.uk/10.3390/d11070106
AMA Style
Deng J, Guo Y, Cheng Z, Lu C, Huang X. The Prevalence of Single-Specimen/Locality Species in Insect Taxonomy: An Empirical Analysis. Diversity. 2019; 11(7):106. https://0-doi-org.brum.beds.ac.uk/10.3390/d11070106
Chicago/Turabian StyleDeng, Jun, Yanqing Guo, Zhentao Cheng, Congcong Lu, and Xiaolei Huang. 2019. "The Prevalence of Single-Specimen/Locality Species in Insect Taxonomy: An Empirical Analysis" Diversity 11, no. 7: 106. https://0-doi-org.brum.beds.ac.uk/10.3390/d11070106
Note that from the first issue of 2016, this journal uses article numbers instead of page numbers. See further details here.