Article

Spatial Distribution of Phytoplankton Community Composition and Their Correlations with Environmental Drivers in Taiwan Strait of Southeast China

1
College of Environmental Science and Engineering, and Fujian Key Laboratory of Pollution Control and Resource Recycling, Fujian Normal University, Fuzhou 350007, China
2
Fujian Provincial Research Center for River and Lake Health, Fujian Normal University, Fuzhou 350007, China
3
Centre for Coastal Biogeochemistry, School of Science, Environment and Engineering, Southern Cross University, Lismore, NSW 2480, Australia
*
Author to whom correspondence should be addressed.
Submission received: 28 September 2020 / Revised: 13 November 2020 / Accepted: 16 November 2020 / Published: 18 November 2020
(This article belongs to the Special Issue Linking Plankton Diversity with Ecosystem Functioning and Services)

Abstract

:
Large-scale dinoflagellate blooms have appeared in recent decades in the Taiwan Strait, Southeast China. To study spatial variability of phytoplankton community composition, physical and chemical environmental drivers in surface seawater of the Taiwan Strait, we conducted cruises in May and July 2019. Cell numbers of dinoflagellates were significantly higher than that of diatoms in most sampling stations during the cruise in May, whereas diatoms were the major contributor to autotrophic biomass in July. Phytoplankton community shifted from a dinoflagellate- and diatom-dominated system in May to diatom dominance in July. The dominant phytoplankton species (genera) were the harmful algal bloom dinoflagellates Prorocentrum donghaiense and Scrippsiella trochoidea and the diatoms Coscinodiscus in May, and Rhizosolenia, Pseudo-nitzschia, and Guinardia in July. Cell densities of dinoflagellates and P. donghaiense reduced exponentially with increasing seawater temperature and salinity and decreasing dissolved inorganic nitrogen (DIN) concentrations. Based on the results of our work and previous studies, it becomes obvious that harmful dinoflagellate blooms are likely to be a major component of the planktonic food web in the Taiwan Strait at a temperature of 17.0–23.0 °C, a salinity of 29.0–33.0 psu, and a DIN concentration higher than 2.0 μmol L–1.

1. Introduction

Large-scale harmful algal blooms (HABs) have become frequent worldwide and often cause the seawater to be reddish-brown, therefore also the name red tides [1]. In some cases, HABs can cause severe dissolved oxygen depletion, reduce light penetration, and increase phytotoxin concentrations, which have led to serious economic impacts on marine fisheries, the aquatic environment, and human health [2,3]. For example, from 18 May to 8 June 2012, a dinoflagellate bloom by the non-toxic Prorocentrum donghaiense was succeeded by a bloom of the toxic Karenia mikimotoi in coastal waters off north Fujian province (320 km2), leading to an estimated loss of over 2 billion RMB (US$280 million) based on mortality of marine animals [4,5,6]. This illustrates that it is paramount to understand how physical and chemical environmental drivers govern bloom development and succession, which is necessary for prediction and prevention of algal blooms.
Several studies have put forward hypotheses for the formation and dispersion of dinoflagellate blooms [7,8,9,10]. They divided large-scale dinoflagellate blooms into four stages: initiation, development, proliferation, and dispersion [11]. Long-term monitoring studies have confirmed that temperature and salinity have large impacts on cell proliferation of dinoflagellates and play crucial roles in the occurrence and demise of blooms [7,12]. However, a zero-dimensional numerical model suggests that in comparison to temperature and light intensity, phosphate limitation is the major factor leading to the formation of dinoflagellate blooms, and high nitrate concentration play an important role for its development and proliferation [8,13]. For the cosmopolitan bloom-forming dinoflagellate P. donghaiense, culture studies showed that they can grow as well on urea as on nitrate or ammonium [14]. Furthermore, the vertical distributions of P. donghaiense such as accumulating at the subsurface layer are considered to be important for their massive blooms [15,16]. Recently, metatranscriptome profiling reveals that P. donghaiense highly expresses genes related to nutrient uptake, energy metabolism, and carbohydrate metabolism during the bloom [17]. In summary, these studies indicate that both environmental drivers and the intracellular metabolism of the dominant P. donghaiense contribute to the competitive advantages of dinoflagellates [1,13].
The Taiwan Strait is located in Southeast China and the transition between the South China Sea (SCS) and the East China Sea (ECS). In spring, freshwater in the largest estuary in Fujian province (Minjiang estuary) flows northwestwards and brings nutrients to the Taiwan Strait [18]. In summer, the southwest monsoon brings warm water from SCS to the Taiwan Strait rising seawater temperature and drives deep water upwelling off the Fujian coast increasing nutrient concentrations and phytoplankton biomass in the Taiwan Strait [19]. In winter, the northeast monsoon and the Min-Zhe coastal current lead to decreasing water temperatures and salinities, which limits proliferation of phytoplankton [20]. Thus, these conditions cause large-scale phytoplankton blooms occurring during spring and summer almost every year since 1990, the starting point of continuous monitoring of phytoplankton and environmental drivers [12,21,22]. Before 2000, large-scale blooms were formed by diatoms such as Skeletonema costatum, whereas since 2002 the intensity of dinoflagellate blooms increased during April and June, outcompeting diatoms at times of the year [13,23]. It has been suggested that eutrophication is an important reason for succession of bloom-forming species from diatoms to dinoflagellates [24,25]. Besides eutrophication, the specific combinations of other environmental drivers for the proliferation of dinoflagellate blooms are still not fully understood and require further investigation.
To investigate the spatial distribution of phytoplankton community composition and study the relationships between environmental drivers and cell densities of dinoflagellates in the Taiwan Strait, we conducted cruises in May and July 2019. We hypothesized that dinoflagellate blooms are likely to occur in the suitable temperature, salinity, and nutrient concentrations in the Taiwan Strait during the spring.

2. Materials and Methods

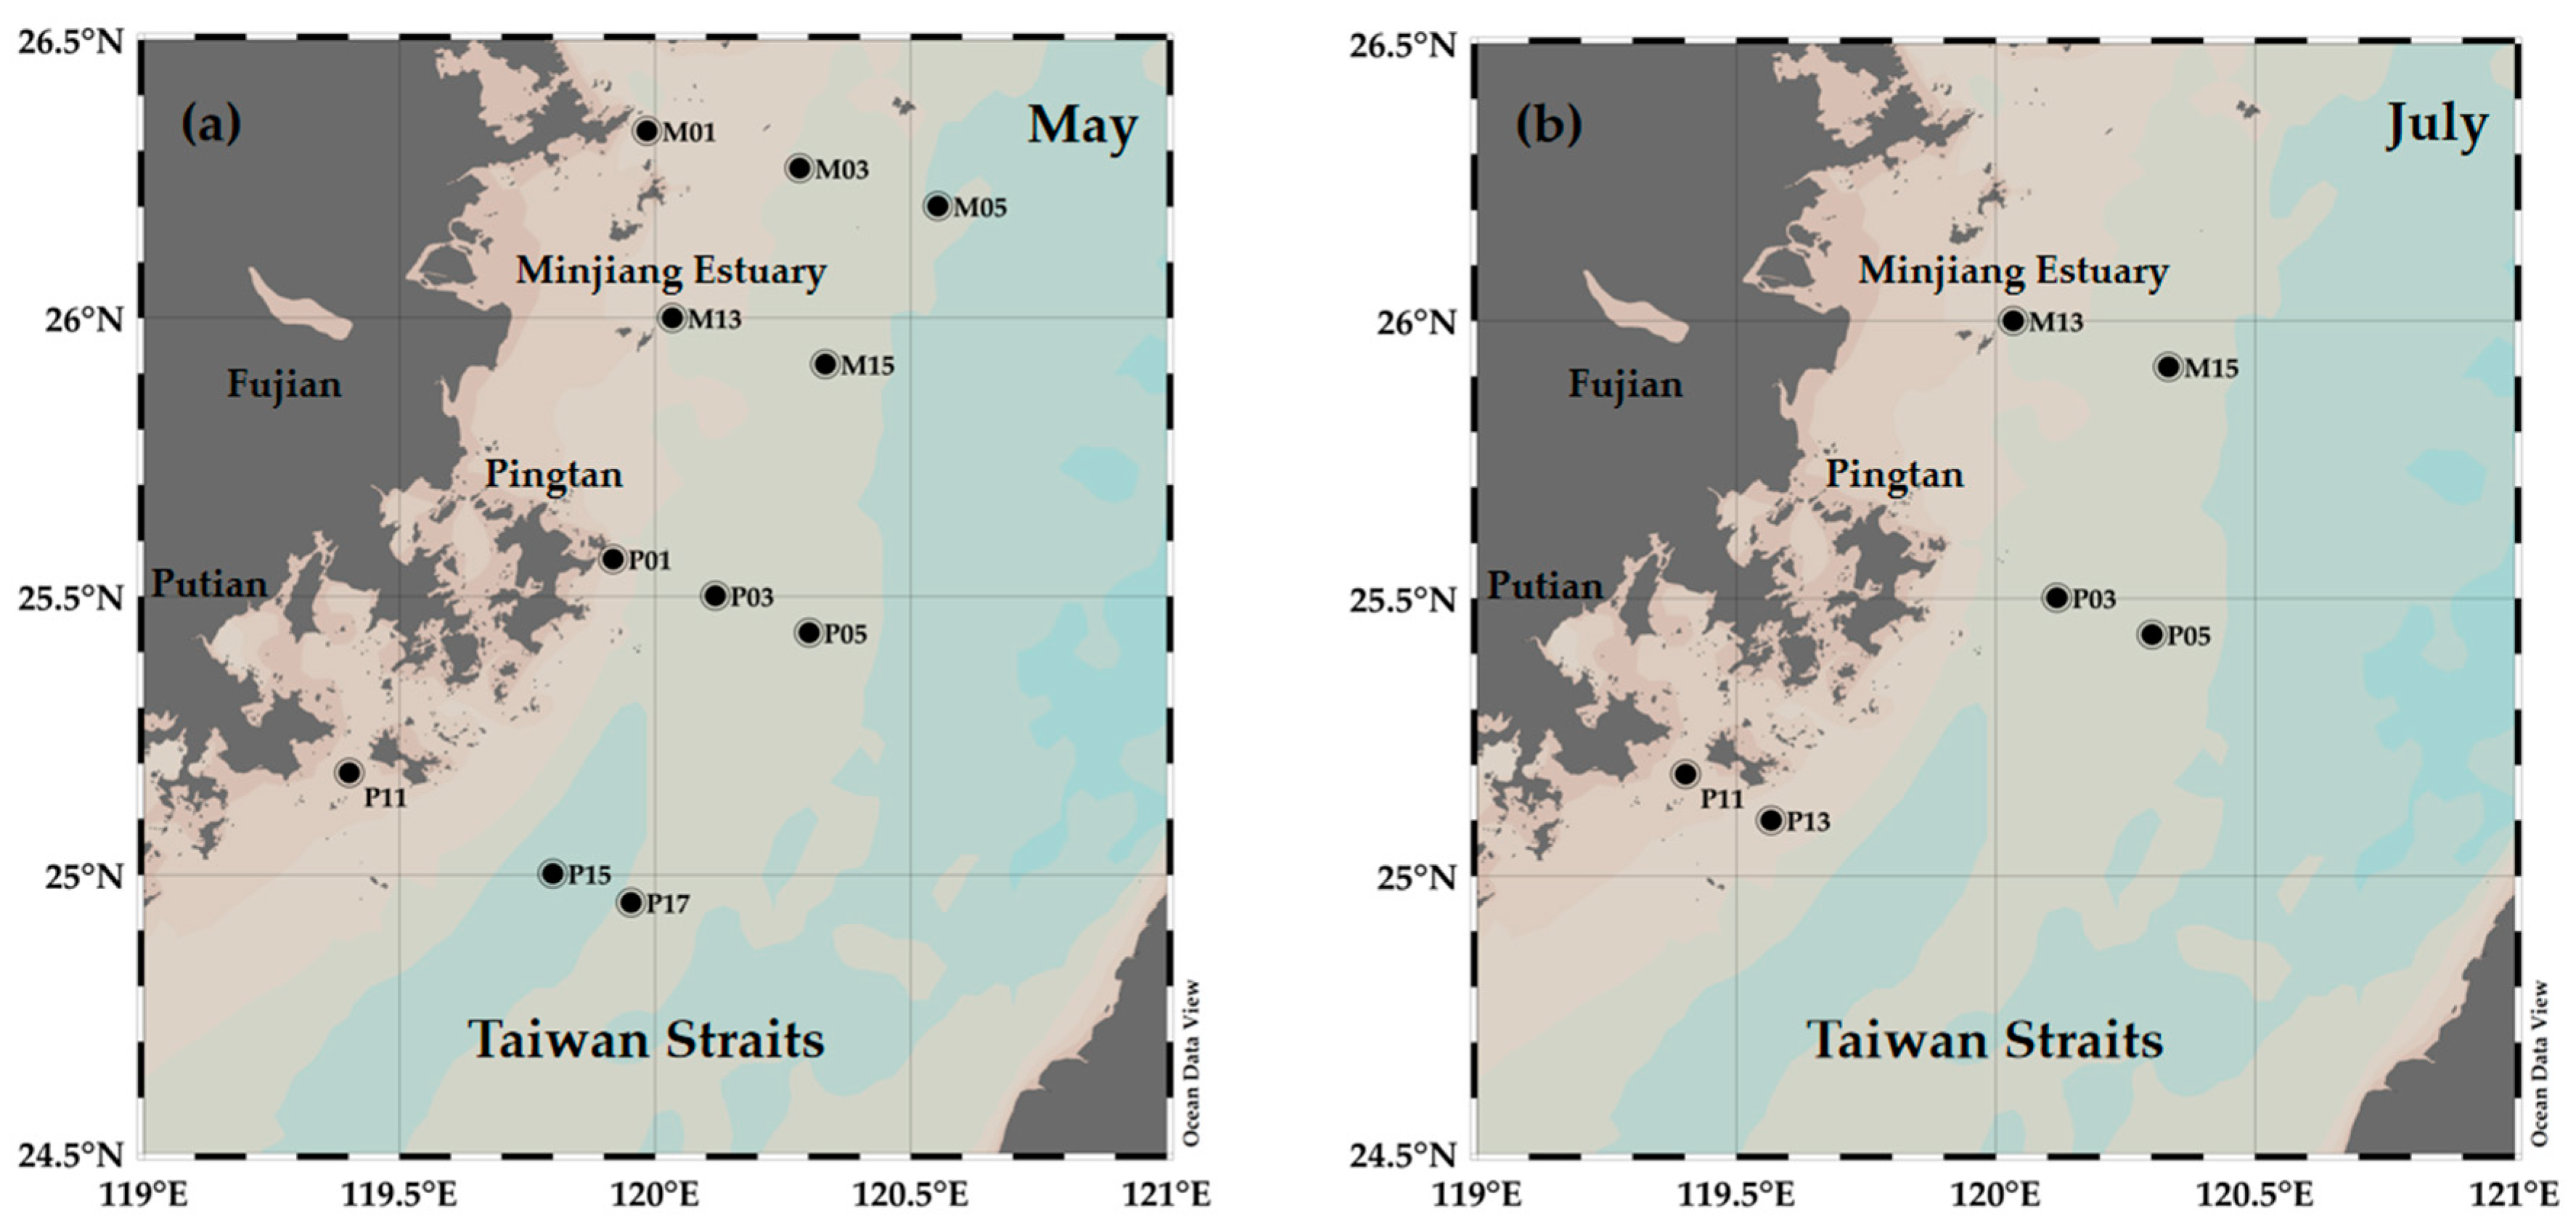
2.1. Study Area and Sampling Protocol

This study was carried out during two cruises on 29, 30, and 31 May and on 29, 30, and 31 July 2019 in Taiwan Strait (119°23′–120°34′ E, 24°57′–26°21′ N). Sampling information during the cruises was shown in Table S1. Our experiment was, respectively, conducted at 11 and 6 stations during the cruise in May and July (Figure 1), and it overlapped 5 stations between the two cruises. At each station, surface seawater samples (up to 1 m depth) were collected with a 10 L acid-cleaned plastic bucket. Dissolved oxygen (DO) concentration and surface seawater temperature (SST) were immediately measured with a portable dissolved oxygen meter (JPB-607, Shanghai Precision Scientific Instrument, Shanghai), which had been calibrated with air-saturated O2 water. A pH meter (pH B-8, Shanghai Hongyi Instrument) was first calibrated with buffers (Tris•HCl, Hanna) at pH 4.01, 7.00, and 10.00, and then used to measure seawater pHTotal (Total scale) thereafter. Salinity was measured with a portable Refractometer (LS10T, Guangzhou Mingrui).

2.2. Nutrients Determination

One-hundred milliliter samples for determination of dissolved inorganic nitrogen (DIN) and phosphorus (DIP) concentrations were taken and filtered using a syringe filter (0.22 μm pore size, Haining) and then stored in the dark at 4 °C until they were analyzed in the laboratory. DIN and DIP concentrations were measured using a spectrophotometer (UV-1200, Shanghai Mapada Instrument) according to Hansen and Koroleff [26]. The nitrate in seawater and standard solutions (GSB 05-1144-2000, NO 102113, Institute of Standard Samples, Ministry of Environmental Protection (IERM), Beijing, China) was measured as nitrite via the zinc cadmium reduction method. The phosphomolybdenum blue photometric method was used to determine total phosphorus in seawater and standard solution (GSB 07-1270-2000, NO 102816, IERM, Beijing, China).

2.3. Chlorophyll a Measurement, Phytoplankton Species Identification, and Diversity Analyses

At each station, 10 L of surface seawater was collected with an acid-cleaned plastic bucket, and then a spectrofluorometer (Biological Biophysical Engineering, BBE, Moldaenke) was used for in situ measurements of chlorophyll a (Chl a) concentration and phytoplankton community composition. The spectrofluorometer was equipped with 6 lasers emitting at 370 nm, 470 nm, 525 nm, 570 nm, 590 nm, and 610 nm, and a standard filter set-up. It measured the total Chl a concentration of the samples and distinguished the contributions by green algae, cyanobacteria, diatoms, and cryptophyta to the total phytoplankton community Chl a using a linear model based on variation in pigments of each phytoplankton group. However, the spectrofluorometer cannot discriminate dinoflagellates from diatoms; therefore, they were included in the latter group [27].
To separate dinoflagellates from diatoms, 1 L samples were fixed with Lugol’s solution according to Parsons et al. [28]. The fixed samples were left to settle for at least 24 h and the supernatant was siphoned out until a 50 mL sample was left. Identification and quantitative analyses were conducted under a microscope (BM-2000, Jiangnan) for a 0.15 mL subsample according to Utermöhl [29]. Relative percentage of cell density of diatoms was calculated as RCdiatom = (cell density of diatoms)/(total cell densities of diatoms and dinoflagellates), and relative percentage of cell density of dinoflagellates was calculated as RCdinoflagellate = (1 ‒ RCdiatom). The phytoplankton species diversity was estimated according to the indices of species richness (species per sample), Shannon and Wiener [30], and evenness [31].

2.4. Statistical Analysis

A one-way analysis of variance (ANOVA) was used to determine the significant differences in the cruises between May and July for physical and chemical parameters, Chl a percentages and relative percentages of cell density of each phytoplankton group, species evenness and Shannon’s diversity index. Normality of residuals was conducted with a Shapiro–Wilk’s test. The one-way ANOVA, normality test, and linear fitting were conducted using R. The relationship between the environmental drivers and cell density of dinoflagellate or diatom during two cruises was measured using multivariate correlation analysis (redundancy analysis, RDA), which was performed using the Canoco software package for Windows (v4.5) (Ithaca, New York, NY, USA) with Monte Carlo permutation tests [32,33]. Interspecies and environmental parameters used in the RDA were normalized through a logarithmic transformation (Log10 (n + 1)).

3. Results

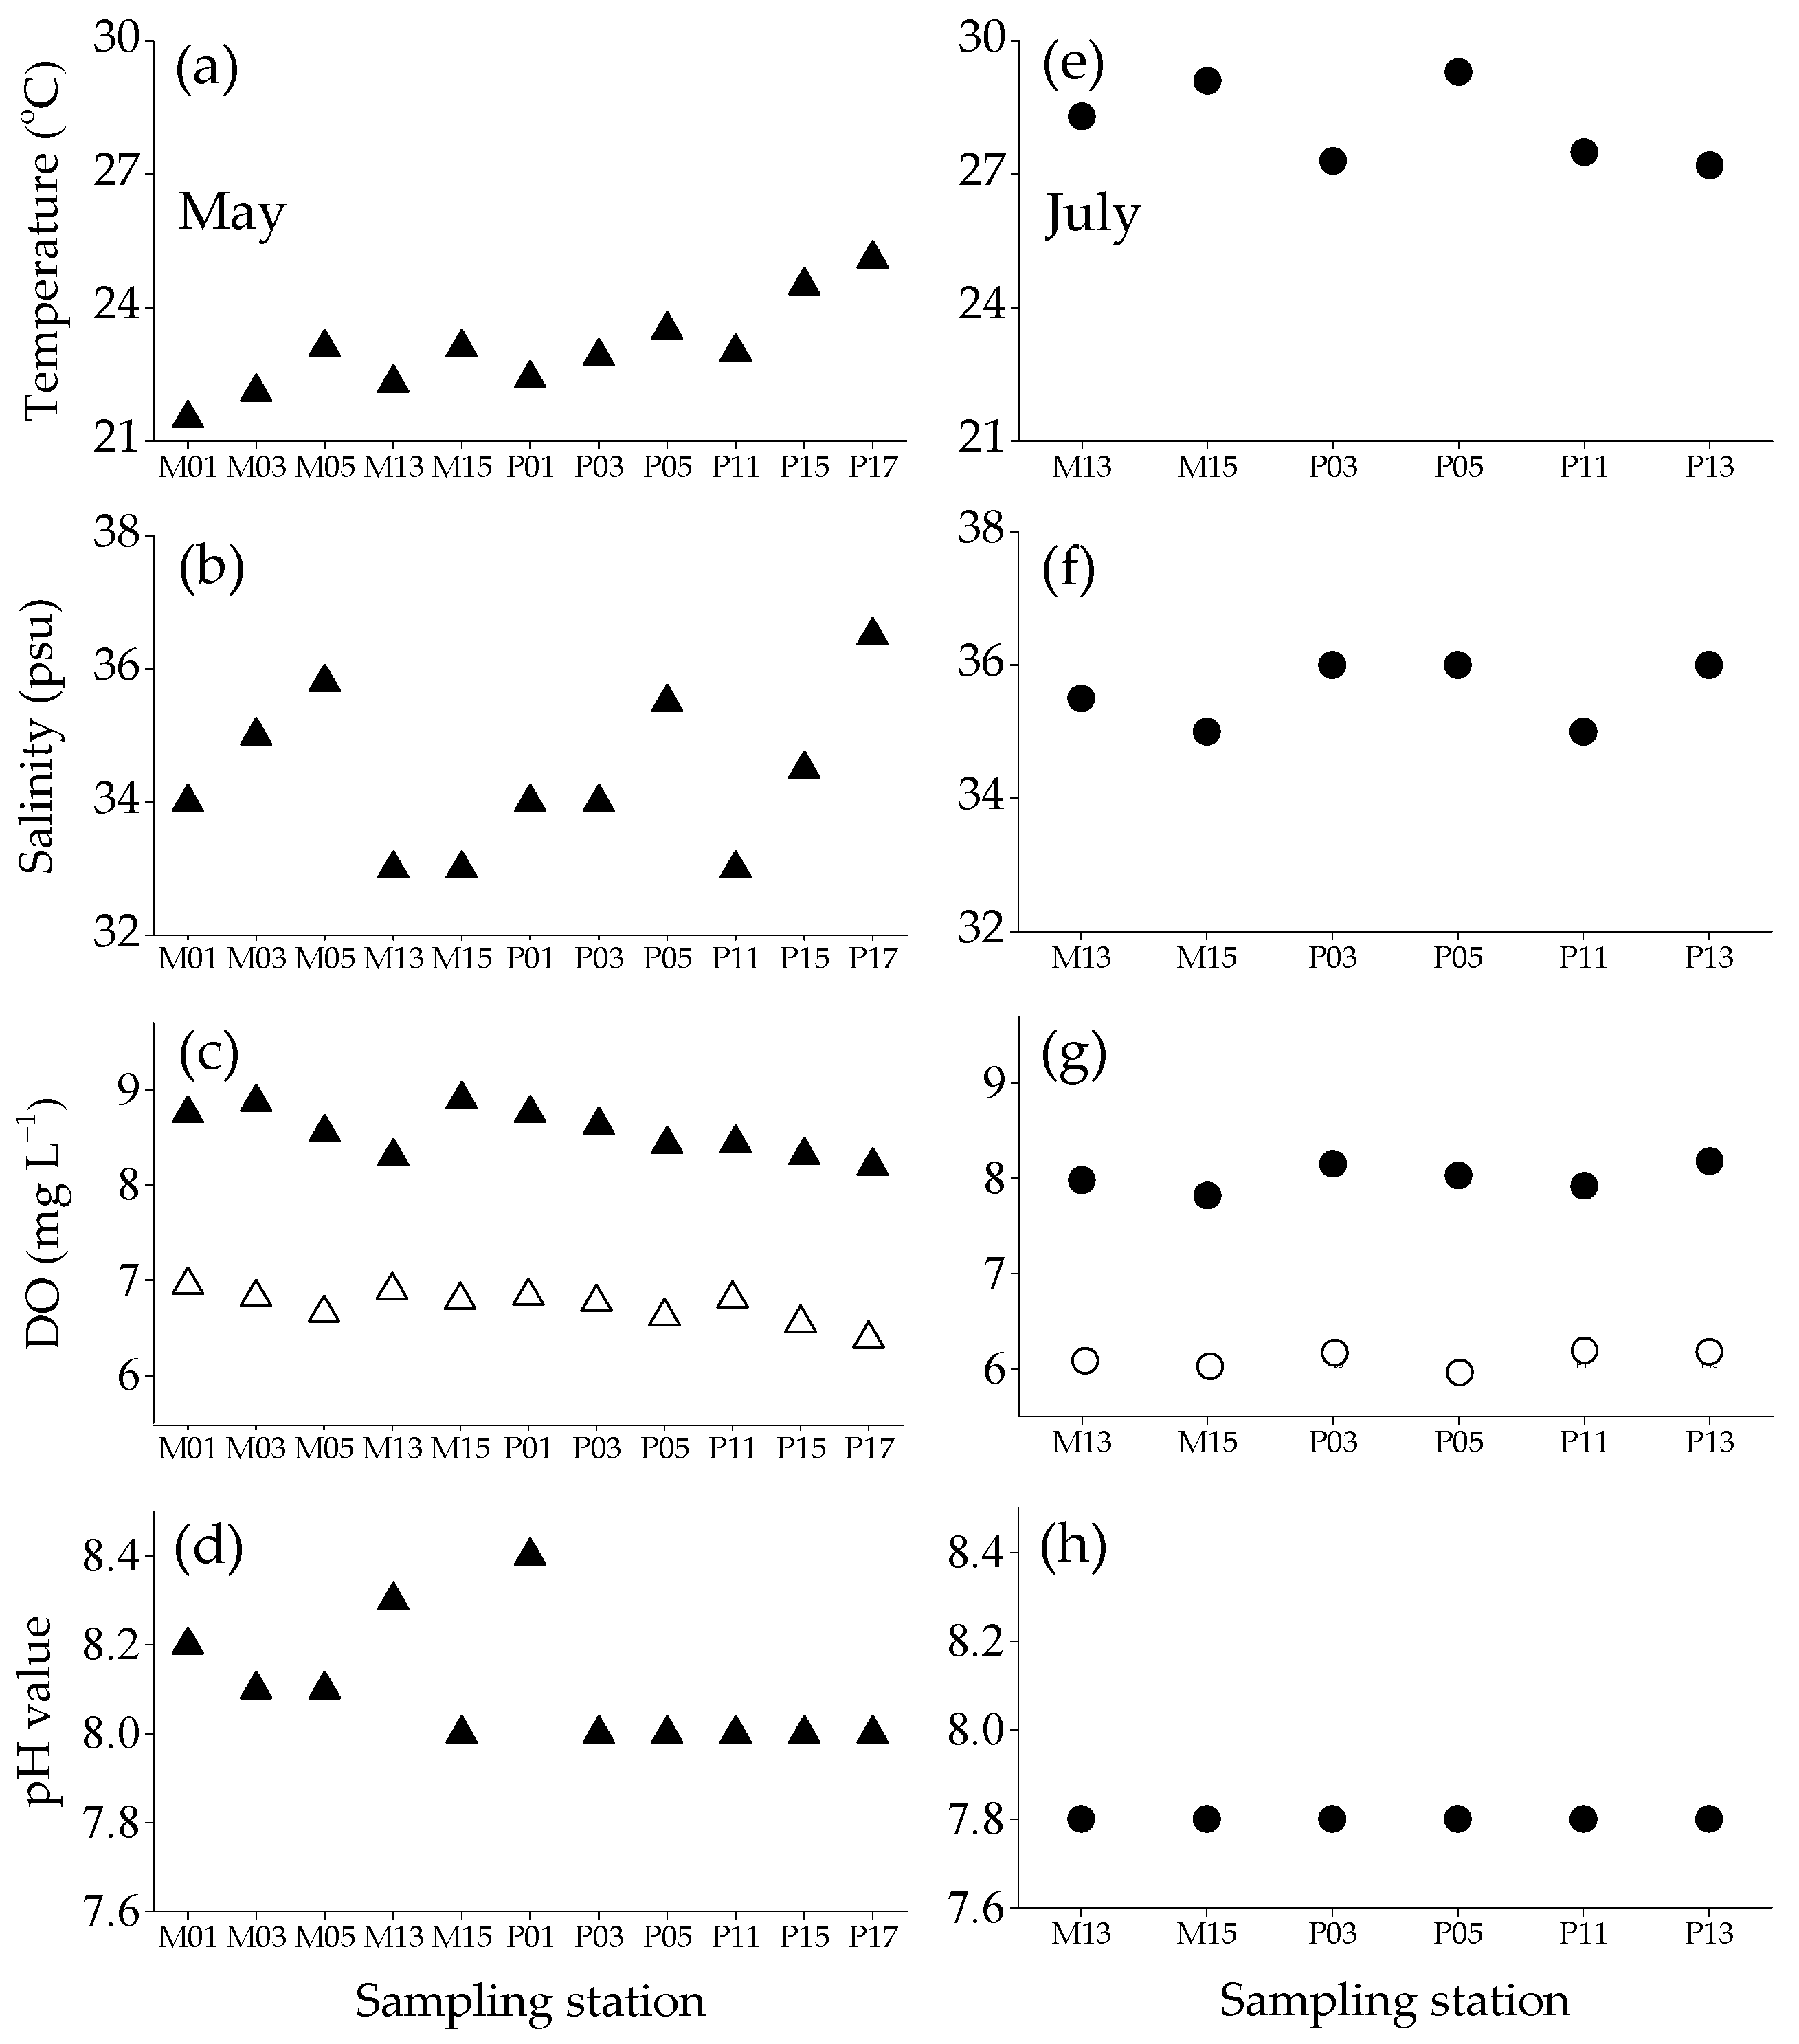
3.1. Temperature, Salinity, Dissolved Oxygen Concentration and pH Value

During the cruise in May, surface seawater temperature (SST) increased with decreasing latitude from 21.5 °C at station M01 to 25.1 °C at station P17, and also slightly increased with increasing distance from the shore line (Figure 2a). Surface seawater salinity (SSS) varied from 33.0 psu at station M15 to 36.5 psu at station P17, and also increased from nearshore to offshore (Figure 2b). Measured dissolved oxygen (DO) concentrations showed an opposite trend to SST, with the values decreasing from 8.90 mg L–1 at station M15 to 8.20 mg L–1 at station P17 (Figure 2c). pHTotal values varied from 8.0 to 8.4 (Figure 2d).
Compared with the cruise in May, SST were 4.0–6.0 oC higher (one-way ANOVA, F1,15 = 99.1, p < 0.01) (Figure 2a,e), measured DO concentrations were 2.3–12.1% lower (one-way ANOVA, F1,15 = 25.6, p < 0.01) (Figure 2c,g), and pHTotal values were 0.2–0.6 units lower during the cruise in July (one-way ANOVA, F1,15 = 26.2, p < 0.01) (Figure 2d,h). At 5 overlapping stations (M13, M15, P03, P05, and P11), SSS were 0.5–2.5 psu higher during the cruise in July than in May (one-way ANOVA, F1,15 = 11.2, p = 0.01) (Figure 2b,f).

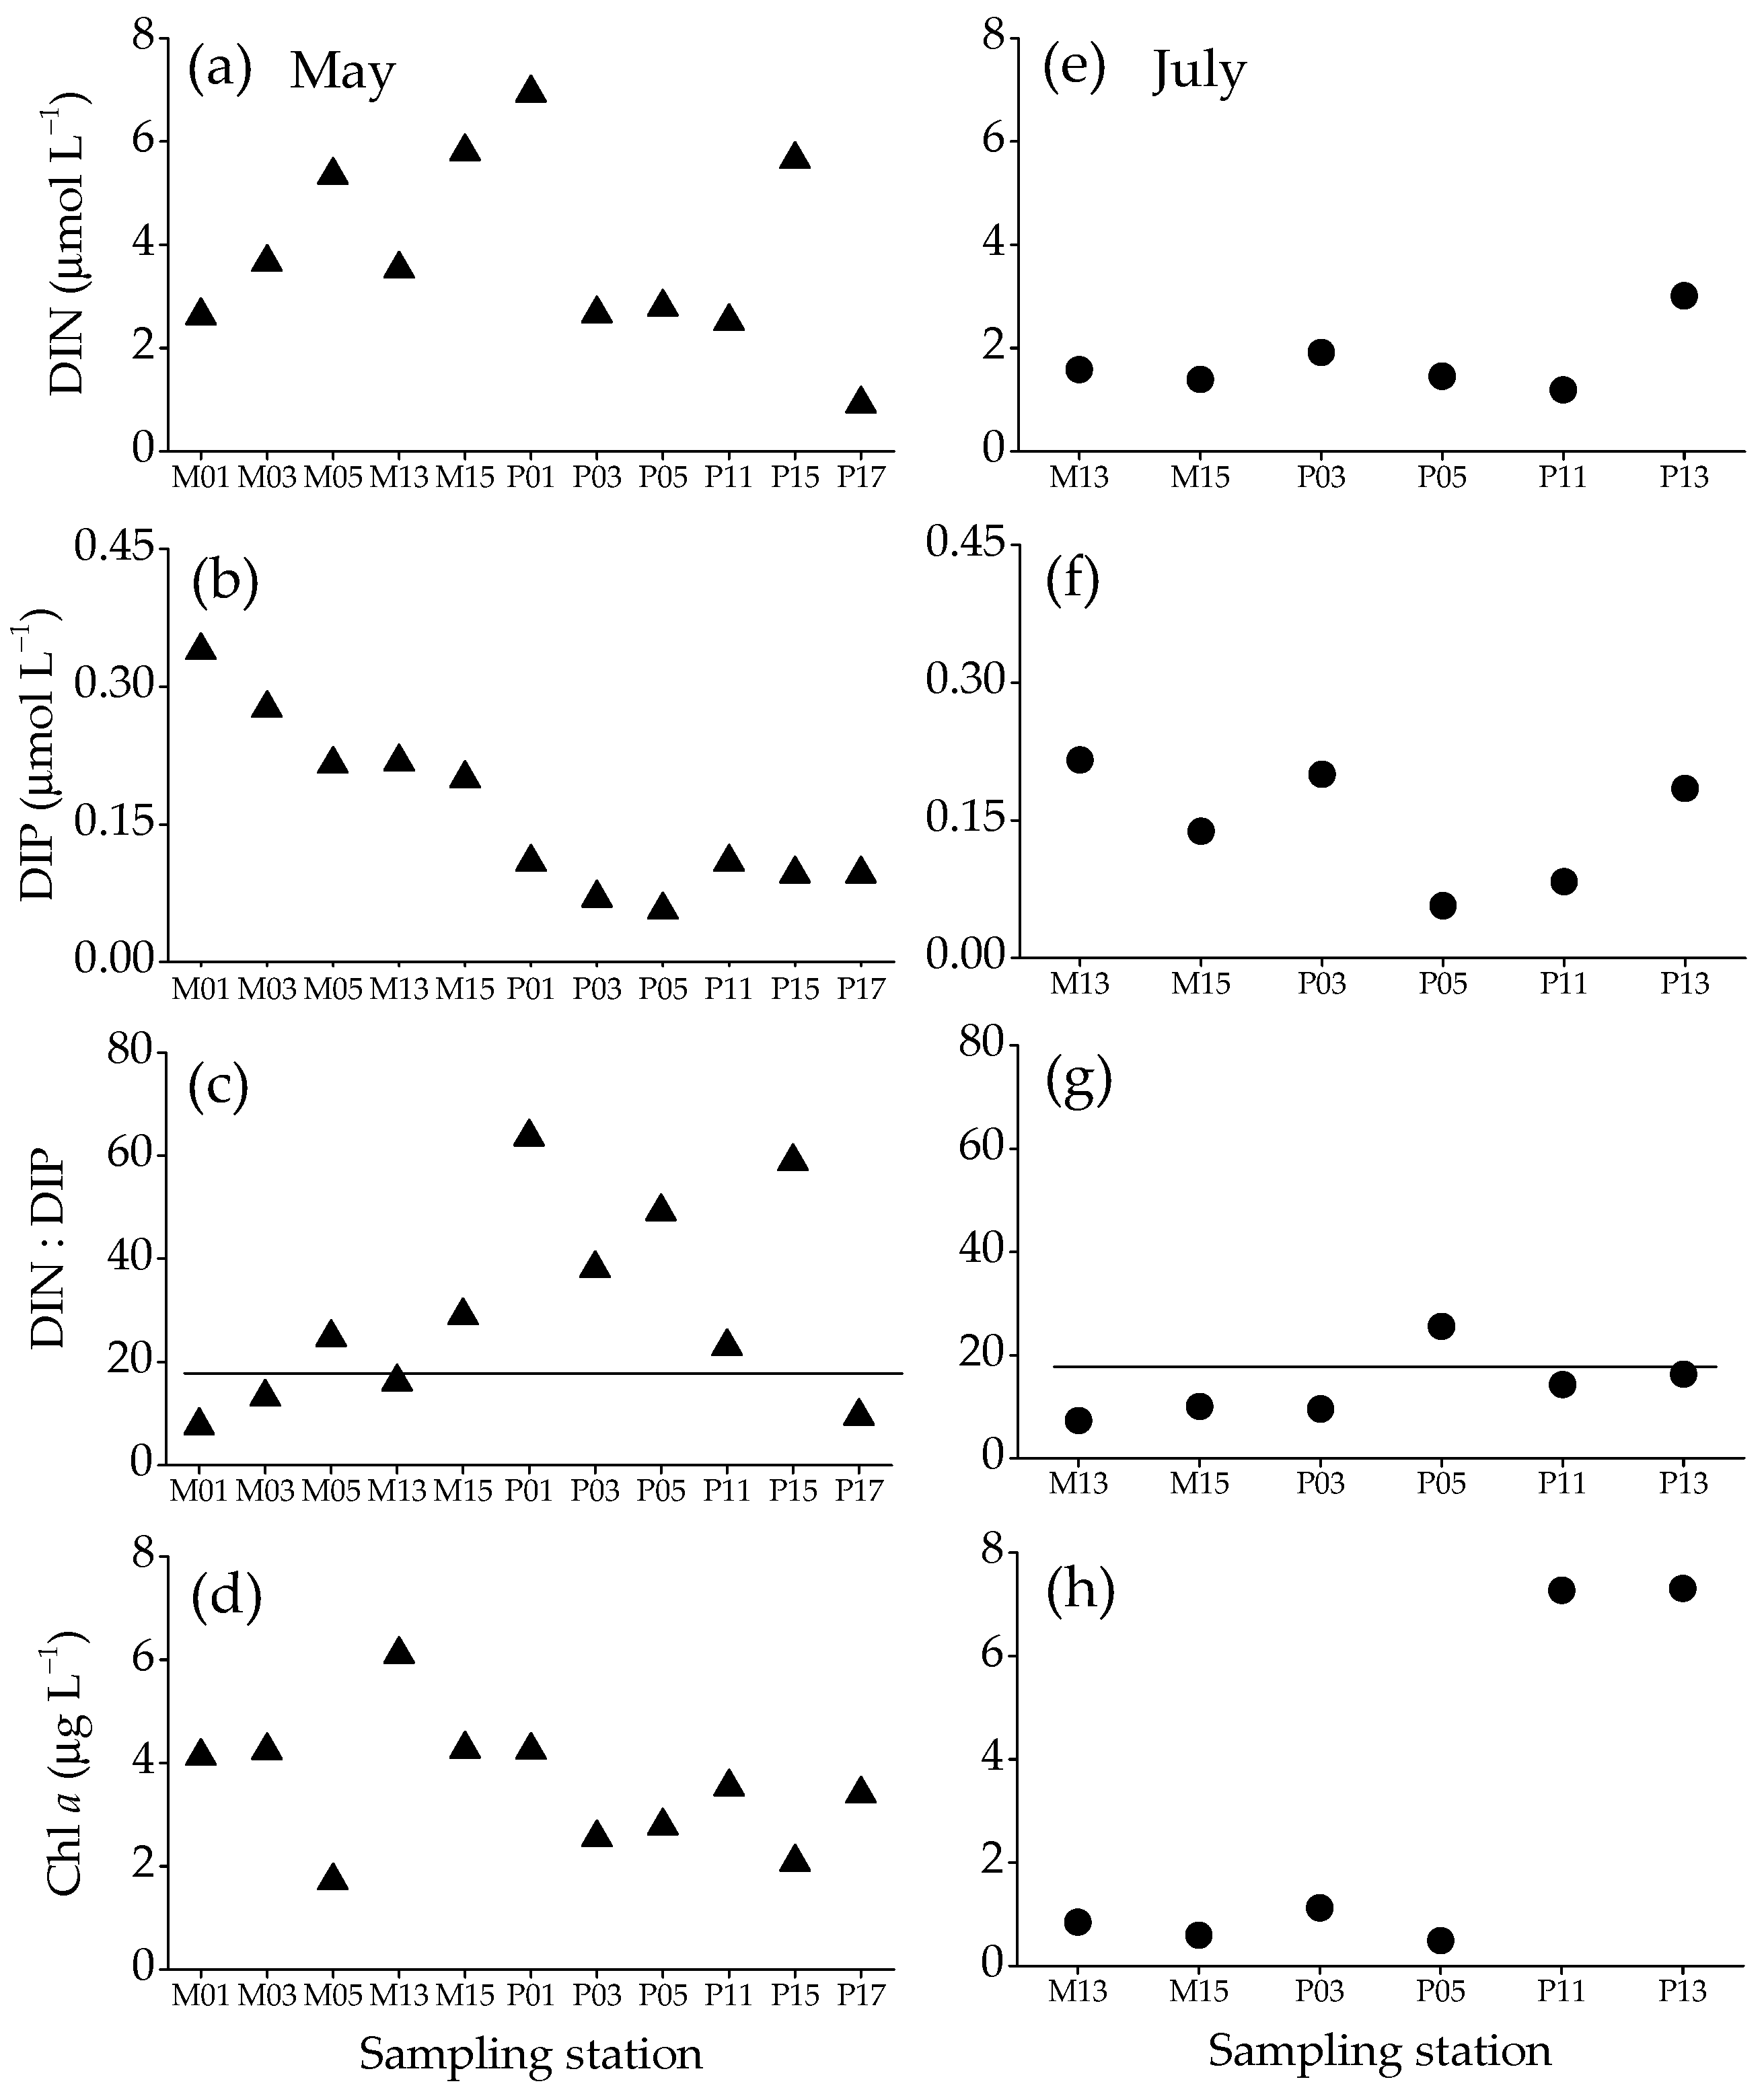
3.2. Dissolved Inorganic Nitrogen (DIN) and Phosphorus (DIP) Concentrations, DIN:DIP Ratio and Chl a Concentration

During the cruise in May, dissolved inorganic nitrogen (DIN) concentration displayed a high geographical variability, with the minimum and maximum being 0.9 μmol L–1 and 7.0 μmol L–1 at station P17 and P01, respectively (Figure 3a). Dissolved inorganic phosphorus (DIP) concentrations decreased latitudinally from 0.3 μmol L–1 at station M01 to 0.1 μmol L–1 at station P05 (Figure 3b). DIN: DIP ratios varied from 9.5 to 63.6 (Figure 3c), and Chl a concentrations varied from 1.7 μg L–1 at station M05 to 6.1 μg L–1 at station M13 (Figure 3d).
At 5 overlapping stations (M13, M15, P03, P05, and P11), DIN concentrations were 28.3–76.1% lower (one-way ANOVA, F1,8 = 9.9, p = 0.01) (Figure 3a,e), and DIN:DIP ratios were 38.0–74.9% lower (one-way ANOVA, F1,8 = 7.2, p = 0.03) (Figure 3c,g) during the cruises in July than in May. During the cruise in July, DIN concentration at station P13 was 36.5–60.6% larger than other stations (Figure 3e), and DIN:DIP ratio at station P13 was similar with other stations. DIP concentrations were not significantly different between the two cruises (one-way ANOVA, F1,8 = 0.03, p = 0.87) (Figure 3b,f). At stations M13, M15, P03, and P05, Chl a concentrations were 128.4–624.9% lower during the cruises in July than in May (one-way ANOVA, F1,6 = 14.5, p < 0.01), whereas at station P11 it was 105.3% larger (Figure 3d,h).

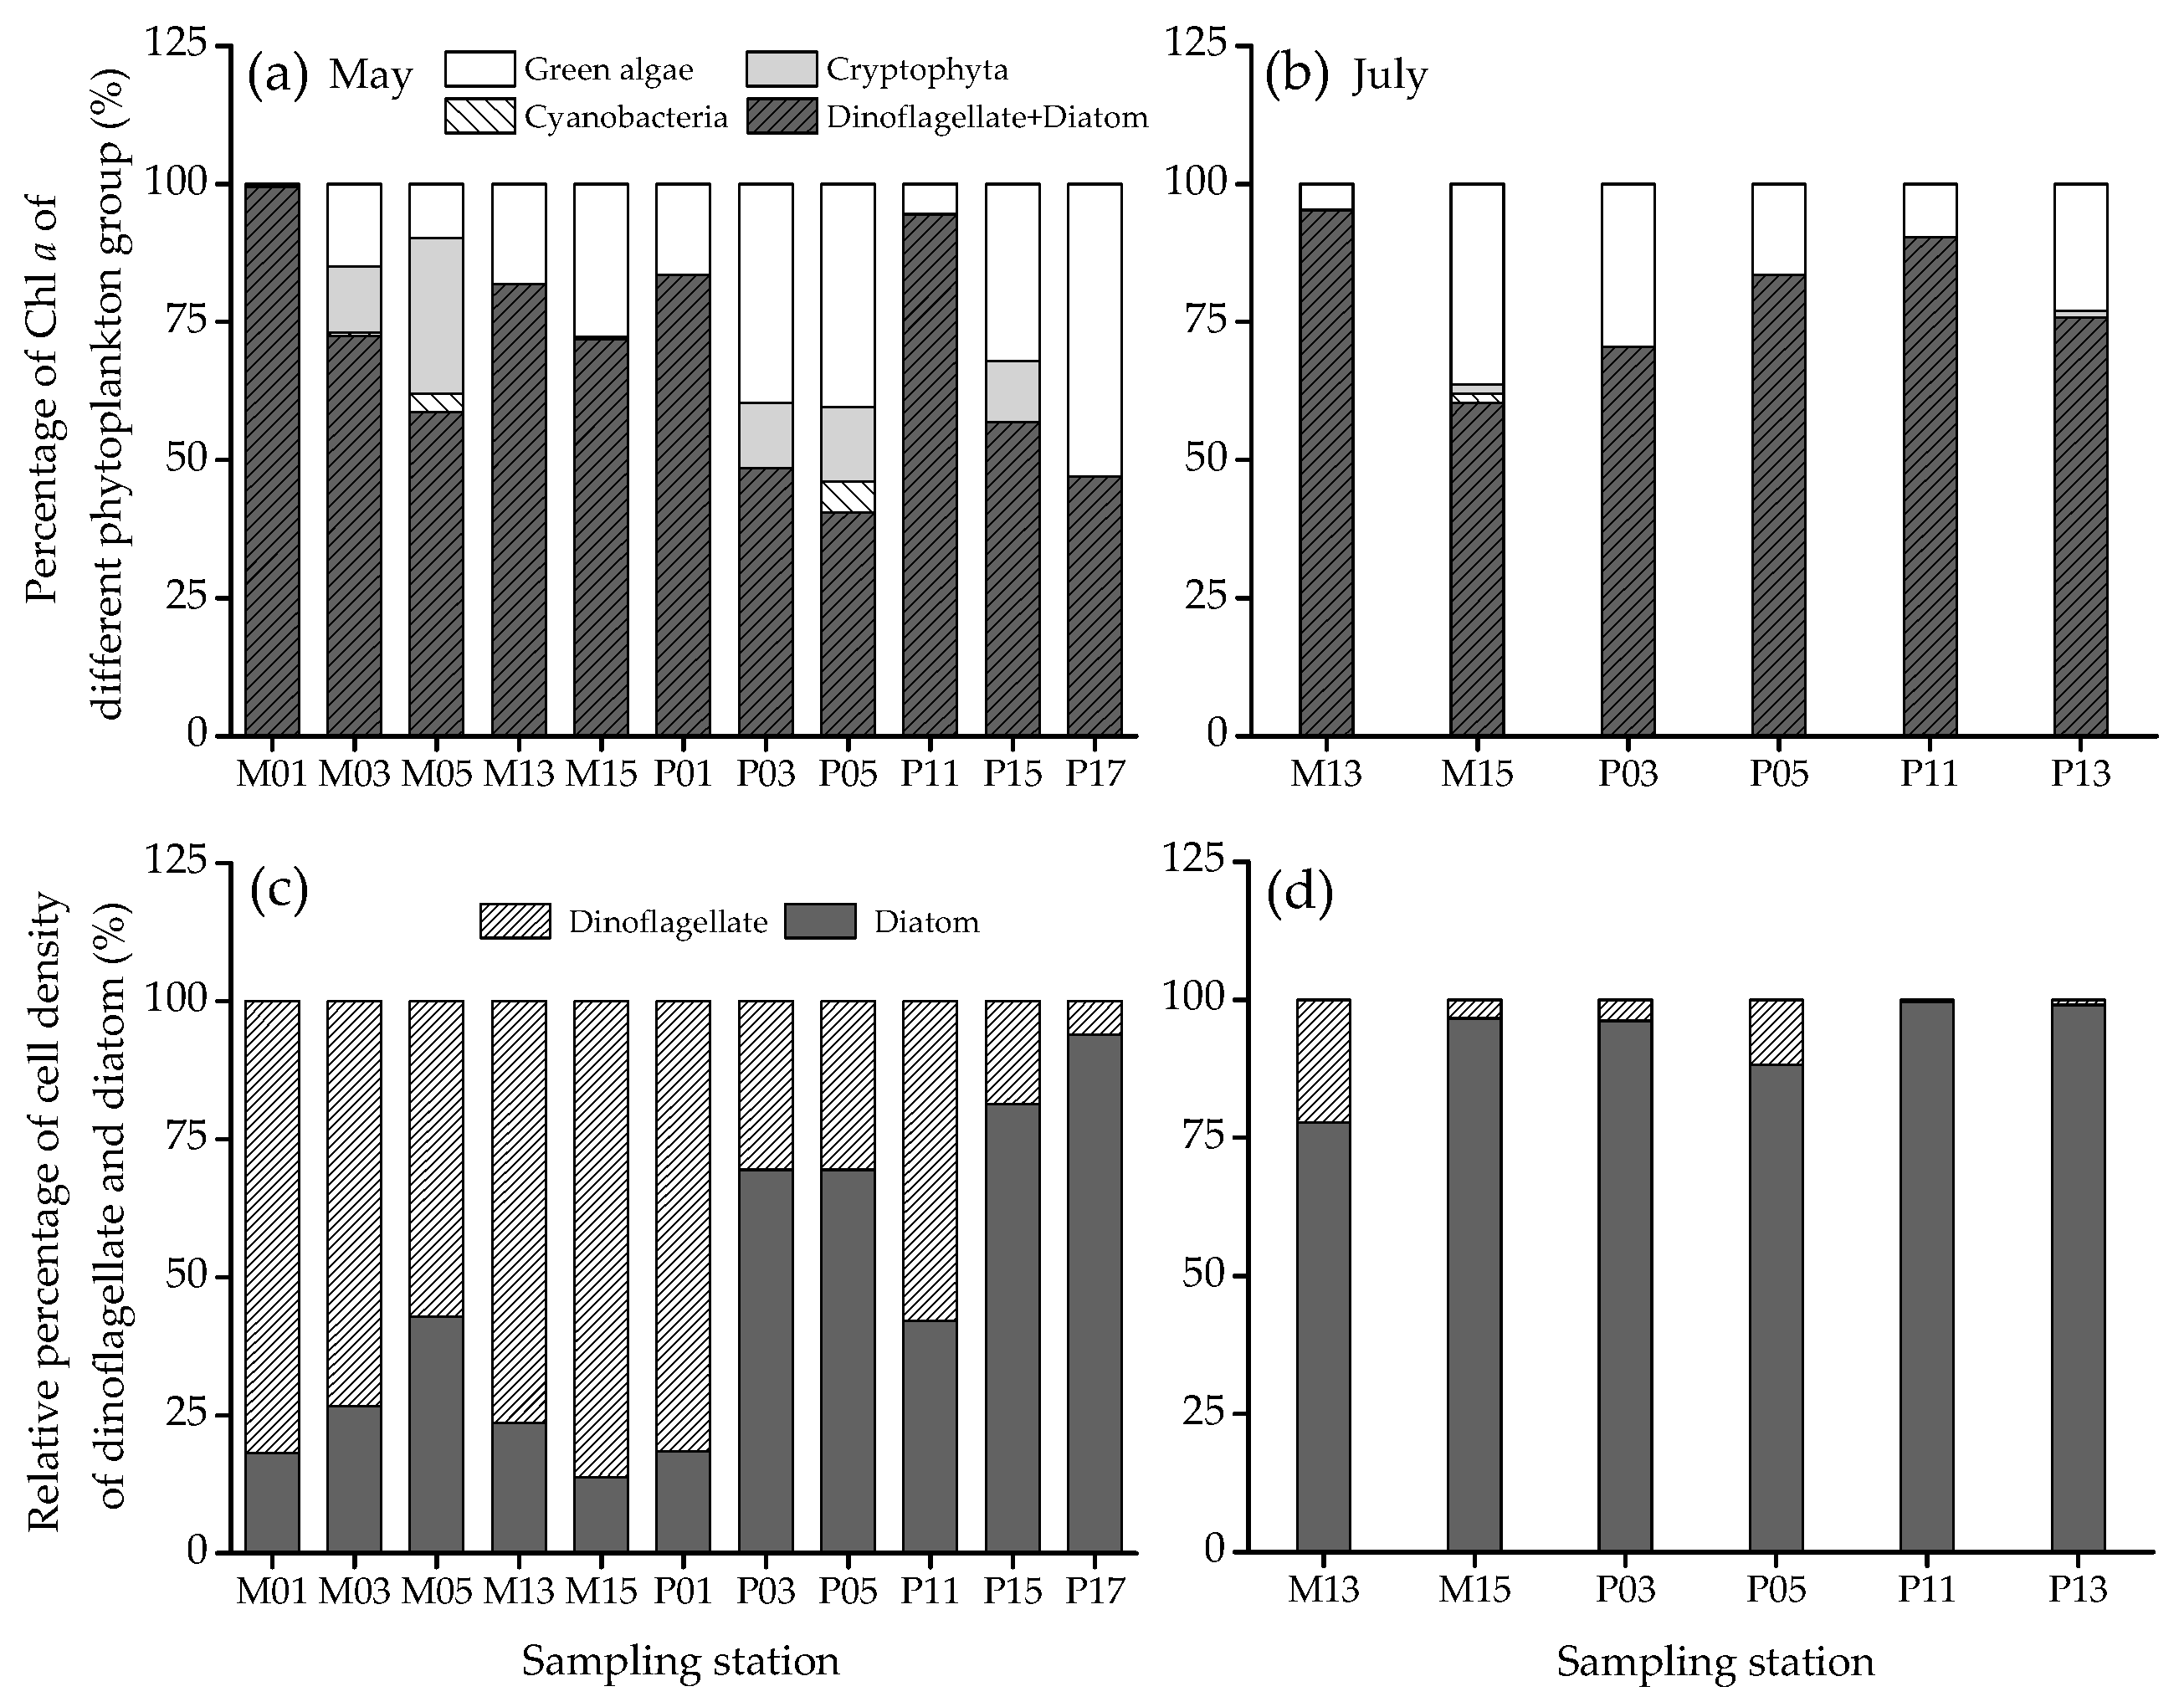
3.3. Percentage of Chl a and Cell Density of Each Phytoplankton Group and Phytoplankton Diversity

Dinoflagellate, diatom, and green algae were detected in all stations, and dinoflagellate and diatom was the dominant group in total phytoplankton during the cruise in May and July, respectively (Figure 4a,c). During the cruise in May, the percentages of total Chl a of dinoflagellate and diatom varied geographically, and generally reduced from the north to the south. It varied from 58.6% at station M05 to 99.4% at station M01 in Minjiang estuary (M01, M03, M05, M13, M15, 25°55′–26°21′ N), from 40.5% at station P05 to 83.5% at station P01 in Pingtan Island (25°27′–25°34′ N), and from 47.1% at station P17 to 94.5% at station P11 in coastal Putian (24°57′–25°11′ N) (Figure 4a). The percentages of Chl a of green algae varied from 0.6% at station M01 to 52.9% at station P17. In addition, the percentages of total Chl a of dinoflagellate and diatom decreased and the percentages of Chl a of green algae increased with increasing distance from the shore line (Figure 4a). The dominant species (genera) were the dinoflagellates Prorocentrum donghaiense, Scrippsiella trochoidea, P. minimum, and Alexandrium and the diatoms Coscinodiscus and Chaetoceros during the cruise in May (Table 1).
During the cruise in July, the percentages of total Chl a of dinoflagellate and diatom varied from 60.3% at station M15 to 95.3% at station M13 (Figure 4b). The percentages of Chl a of green algae varied from 4.7% at station M13 to 36.3% at station M15 during the cruise in July, and were not significantly different from those during the cruise in May (one-way ANOVA, F1,15 = 0.6, p = 0.46). The dominant diatom genera were Rhizosolenia, Pseudo-nitzschia, Guinardia and Coscinodiscus (Table 1).
Relative percentages of cell density of dinoflagellates varied from 57.1% to 86.2% in Minjiang estuary, from 30.5% to 81.5% in Pingtan Island, from 6.1% to 57.9% in coastal Putian during the cruise in May, and from 0.4% to 22.2% during the cruise in July (Figure 4c,d). Relative percentages of cell density of diatoms varied from 13.8% to 93.9% during the cruise in May, and from 77.8% to 99.6% during the cruise in July (Figure 4c,d). Cell number of diatoms varied from 3200 cells L1 at station M03 to 40,000 cells L1 at station M13 during the cruise in May, and from 3640 cells L1 at station M13 to 166,000 cells L1 at station P11 during the cruise in July. Diatoms mainly distributed in coastal Putian during the cruise in May, and dominated in the Taiwan Strait during the cruise in July (Figure 4c,d).
The phytoplankton species inventoried during the cruises in May and July was 27 species (Table 1). The values of phytoplankton evenness were 46.5–90.7% and 58.9–89.2% during the cruises in May and July, respectively. The Shannon’s index varied from 1.0 bits ind1 at station P03 to 2.6 bits ind1 at station P11 during the cruise in May and was 0.8–1.7 bits ind1 during the cruise in July. There was no statistically significant difference in phytoplankton diversity between the two cruises (one-way ANOVA, both F1,15 < 0.65, p > 0.1).

3.4. Correlations of Cell Density of Dinoflagellates and Prorocentrum donghaiense with Environmental Drivers

Redundancy analysis (RDA) showed that the constrained variance was 90.1% during two cruises, and the cell densities of dinoflagellates during two cruises were significantly correlated with temperature, salinity and DIN concentration (all p < 0.05) (Figure 5). Cell densities of dinoflagellates reduced exponentially with increases in temperature (r = −0.87, p < 0.01) and salinity (r = −0.80, p < 0.01), and increased with increasing DIN concentration (r = 0.64, p < 0.01) within the test range (Figure 5 and Figure S1). Cell densities of diatoms were negatively correlated with DO level (p < 0.05) (Figure 5). Interestingly, cell densities of P. donghaiense during the cruise in May also reduced exponentially with increases in temperature and salinity (r = −0.67 and −0.75, both p < 0.01) (Figure S1). Our results also indicate that when temperature and salinity was lower than 23.0 °C and 33.0 psu, respectively, dinoflagellates had a competitive advantage in Taiwan Strait (Figure S1).

4. Discussion

While cell densities of diatoms were low during the cruise in May, cell volume and carbon content of the dominant diatom Coscinodiscus were several times larger than that of the dominant dinoflagellates P. donghaiense and S. trochoidea [34,35]. In addition, particulate organic carbon of phytoplankton assemblages increased significantly with increasing cell abundances of diatoms from spring to summer [36]. These results support the hypothesis that diatoms are still the most important contributor to total autotrophic Chl a in the Taiwan Strait [10,37]. Based on the results of high cell densities of dinoflagellates, we suggest that diatoms are the dominant phytoplankton group in terms of the more important Chl a, yet in May there are significant contributions by dinoflagellates with high cell densities in the Taiwan Strait.
Some studies have been conducted to test for the influence of environmental drivers on development and occurrence of dinoflagellate blooms, including laboratory incubation, in situ monitoring or biophysical models [7,8,9,10,38]. Following up previous studies, we found that cell densities of dinoflagellates reduced exponentially with increases in surface seawater temperature and salinity within the test range, whereas they increased with increasing DIN concentration, leading to significant increases in seawater pH and oxygen levels (Figure 5 and Figure S1). In addition, in terms of cell densities, phytoplankton composition shifted from a dinoflagellate-dominated system in Minjiang estuary and a dinoflagellate-, diatom-, and green algae-dominated system in Pingtan Island and coastal Putian in May to a diatom-dominated system in July (Figure 4, Figure 5 and Figure 6).
In May, the residuals of the Min-Zhe coastal current drove low temperature seawater flow southwards into the Taiwan Strait, leading to temperature decreases gradually from south to north [39]. In addition, riverine input due to heavy rainfalls during spring lowered the seawater temperature and salinity but increased DIN concentrations (Figure 6) [18]. As a consequence, eurythermal and euryhaline species dominated in spring, such as P. donghaiense, S. trochoidea, Coscinodiscus, and so on. These results are consistent with other studies [40,41] which reported that dinoflagellates reached the maximum cell density in spring. In July, the southwest monsoon prevailed and the South China Sea (SCS) warm current developed a strong influence, which brought high temperature and high salinity water from SCS to Taiwan Strait [19]. Then, some warm water genera such as Rhizosolenia and Pseudo-nitzschia, Guinardia, and Chaetoceros were brought in [41]. On the other hand, high abundance of P. donghaiense remained at the subsurface (30 m depth layer) for about one month in early spring, which leads to the later development of massive bloom [15]. Prorocentrum donghaiense blooms occurred at the end of May 2019 when we took samples from surface layer, and the highest cell concentration of P. donghaiense reached 7.82 × 10⁶ cells L1 in the surface seawater (unpublished data). In addition, high abundance of P. donghaiense was also found at the subsurface layer during the blooms [8]. Thus, P. donghaiense should be the dominant species in the whole euphotic layer in spring. However, relative percentage of cell density of diatom varied from 62.0% to 85.4% in the whole euphotic layer in Taiwan Strait in summer [41]. These data indicate that relative percentage of cell density of dinoflagellate and diatom in the surface layer showed in the present study may be representative of the whole euphotic layer (Figure 4c,d).
Temperature plays an important role in modulating the occurrence of harmful algal blooms and the cell densities of dinoflagellates in the Taiwan Strait [7,22,40]. Decrease in cell densities of dinoflagellates or P. donghaiense, leading to decreasing biomass of dinoflagellates with increasing temperature, indicates that optimal temperature for cell proliferation of dinoflagellates or P. donghaiense was lower than 22.0–23.0 °C, where the largest cell density was found during the cruise in May. These results agree very well with the study of Li [12] who reported that the optimal temperature window for dinoflagellate blooms (P. donghaiense dominates) was 18.2–21.8 °C in Fujian coastal waters. Recently, the onset of dinoflagellate blooms was also reported at about 17.0 °C both in Xiamen Harbor, southwest of the Taiwan Strait and in St. Helena Bay in the southern Benguela region, South Africa [3,17]. Within a limited range of temperature, a positive correlation between growth rate and temperature can be applied, whereas below or above certain levels of temperature, the growth of phytoplankton will stop or will decline in response to the change of temperature [42,43]. Most of the studies found that dinoflagellate blooms always form at a temperature of 17.0–22.0 °C during April and May, and once temperature decreases to be lower than 16.0 °C before April or exceeds 25.0 °C after June, dinoflagellates lose competitive advantage and diatoms dominate in Fujian coastal waters (this study) (Table 2) [22,44,45]. Optimal response of growth rate to salinity was also reported in previous studies and optimal salinities were found to be 29.7–32.2 psu for the occurrence and maintenance of dinoflagellate blooms in Fujian Coastal water (Table 2) [12,22,38]. These findings correspond well to our data that the cell densities of dinoflagellates decreased with increasing salinity above 33.0 psu due to severe osmotic stresses (Figure 6) [38,46].
Due to photosynthetic oxygen evolution of phytoplankton, dissolved oxygen (DO) concentration in seawater should increase with increasing phytoplankton biomass during blooms [47]. Besides that, measured DO concentration also increased with decreasing seawater temperature (r = −0.88, F1,15 = 52.21, p < 0.01) (Figure S3). In order to remove the influence of temperature on DO concentration, we first calculated the saturated DO concentration based on seawater temperature and salinity (Figure 2c,g) [48]. Then, apparent DO concentration was calculated as the difference between measured DO concentration and saturated DO concentration, and expected to be more strongly associated with the phytoplankton biomass [3,47]. However, apparent DO concentration did not show positive correlations with Chl a concentration or cell density of dinoflagellates in this study (Figure S3). This indicates that measured DO concentration may be more sensitive to temperature. Increasing temperature reduced not only cell densities of dinoflagellates but also DO concentration in surface seawater, which might be responsible for the positive correlation between cell density of dinoflagellates and measured DO concentration (Figure S1c).
High DIN and DIP concentrations facilitated the proliferation of dinoflagellates, as reported by other studies (Figure 5 and Figure 6) [14,49,50]. It was summarized that DIN concentrations in the upwelling areas of the Taiwan Strait were higher than 1 μmol L–1 in spring [51], and DIN concentrations were reported to be 2.4–30.0 μmol L–1 in Minjiang Estuary in May [52]. Our data showed that above a DIN concentration of 2.0 μmol L–1, cell densities of dinoflagellates increased quickly (Figure S1). It should be mentioned that many dinoflagellate species including P. donghaiense and S. trochoidea are mixotrophic and could take up dissolved organic sources to compensate for photoautotrophy and growth [34,53]. In addition, photosynthetic dinoflagellates tend to stay close to the surface during the light period and migrate to the deep water at night to assimilate nutrients [54]. For example, cell abundance of P. donghaiense in surface waters peaked around 14:30 in the coastal waters of the East China Sea in May 2011 [55]. Daily vertical migration of P. donghaiense makes the species more competitive with other algal species on utilizing light and nutrients [55].
Based on our data and previous studies, we propose a conceptual model for the effects of environmental drivers on a shift from dinoflagellates in May to diatoms in July in Taiwan Strait (Figure 6). Riverine input decreases seawater salinity to be 29.0–33.0 psu and increases DIN concentration [18,39]. Once seawater temperature increases to 17.0–23.0 °C and DIN concentration is higher than 2.0 μmol L–1, dinoflagellate cells grow quickly, and then blooms occur in May and reach higher numbers when the more nitrate (but also phosphate) is available [12,22,53]; this increases seawater pH value and DO concentration and reduces nutrient concentrations. After spring, due to the effects of a strengthening southwest monsoon and the SCS warm current, seawater temperature increases beyond 24.0 °C as well as salinity (>33.0 psu) [12,19]. Such conditions disfavored cell proliferation of dinoflagellates such as P. donghaiense, leading to increasing diatom dominance (this study) [40].
It is clear that other physical, chemical, and biological environmental drivers such as EI Niño, rain fall, solar irradiance, organic nutrients, silicon concentration, pH value, potential top-down control by zooplankton modulate the occurrence of algae blooms and hence community composition [56,57]. However, several studies have also highlighted that cell proliferation is mainly affected by the dominant drivers in a multi-driver environment [58,59]. In the first decade of observations, diatoms were the major contributor, and now dinoflagellates become more important [13,23]. Previous studies and our data provide the information that temperature, salinity, and DIN are the dominant drivers for cell proliferation of dinoflagellates and for shifting from dinoflagellates to diatoms in Taiwan Strait [18,22]. These imply that dinoflagellate blooms may form early in the future with the global ocean warming. In addition, in order to support or confirm the conception diagram provided in Figure 6, we should investigate more environmental drivers and study their correlations with biomass or cell densities of phytoplankton during the spring algae blooms in the future research.

5. Conclusions

Cell densities of dinoflagellates were higher than diatoms in most of the sampling stations during the cruise in May and declined from the north to the south and from nearshore to offshore. Temperature, salinity, and DIN concentration within the test range were crucial factors in modulating formation of dinoflagellate blooms in the Taiwan Strait. A decrease in cell densities of dinoflagellates was attributed to rising seawater temperature and salinity, and decreasing DIN concentrations within the test range, which also contributed to shift from dinoflagellates in May to diatoms in July.

Supplementary Materials

The following are available online at https://0-www-mdpi-com.brum.beds.ac.uk/1424-2818/12/11/433/s1, Table S1: sampling information during the cruises in May and July 2019 in Taiwan Strait; Table S2: results of correlation coefficient between cell density of dinoflagellate or diatom and environmental drivers during two cruises; Table S3: results of correlation coefficient between cell density of Prorocentrum donghaiense and environmental drivers during the cruise in May 2019; Figure S1: correlations of cell density of dinoflagellates (left) or Prorocentrum donghaiense (right) with temperature (a,h), salinity (b,i), measured DO concentration (c,j), pH value (d,k), DIN concentration (e,l), DIP concentration (f,m), and DIN:DIP ratio (g,n) in the surface water of the Taiwan Strait during the cruise in May and July 2019; Figure S2: correlations of cell density of dinoflagellates with temperature (a), salinity (b), measured DO concentration (c), pH value (d), DIN concentration (e), DIP concentration (f), and DIN:DIP ratio (g) in the surface water of the Taiwan Strait during the cruise in May 2019; Figure S3: correlation of measured dissolved oxygen (DO) concentration with temperature (a), and correlation of apparent DO concentration with chlorophyll a (Chl a) (b) or cell density (c) of dinoflagellate in the surface water of the Taiwan Strait during the cruises in May and July 2019.

Author Contributions

Y.Z. and Y.-P.S. contributed to the design of the experiment. Y.Z. and H.L. conducted cruises. J.-Z.S. and Y.Z. identified dinoflagellates and diatoms. Y.Z. wrote the first manuscript draft, and all authors contributed to the data analyses and editing of the paper. All authors have read and agreed to the published version of the manuscript.

Funding

This research was funded by National Key Research & Development Plan “Strategic International Scientific and Technological Innovation Cooperation” (2016YFE0202100) and the National Natural Science Foundation of China (41573075, 41806129).

Acknowledgments

We thank the help of Jiazhen Sun, Wupeng Xiao, and Yuyuan Xie; the captain and crew of the research vessel China Marine Surveillance 203; and the chief Lirong Song for his organization during the cruises.

Conflicts of Interest

The authors declare no conflict of interest.

References

  1. Hennon, G.M.M.; Dyhrman, S.T. Progress and promise of omics for predicting the impacts of climate change on harmful algal blooms. Harmful Algae 2020, 91, 101587. [Google Scholar] [CrossRef] [PubMed]
  2. Landsberg, J.H. The effects of harmful algal blooms on aquatic organisms. Rev. Fish Sci. 2002, 10, 113–390. [Google Scholar] [CrossRef]
  3. Pitcher, G.C.; Probyn, T.A. Suffocating phytoplankton, suffocating water–red tides and anoxia. Front. Mar. Sci. 2016, 3, 186. [Google Scholar] [CrossRef]
  4. State Ocean Administration. Bulletin of Marine Environmental Quality of China; State Ocean Administration: Beijing, China, 2012. [Google Scholar]
  5. Yang, Y.; Huang, H.L.; Zeng, Y.D.; Guan, W.B.; Li, X.D.; Guo, M.Q. Comparison in temperature, salinity and circulation structures during spring of the years before and after Karenia mikinotoi bloom along Fujian coast in 2012. Oceanol. Limnol. Sin. 2019, 50, 553–562, (in Chinese with English abstract). [Google Scholar] [CrossRef]
  6. Shin, H.H.; Li, Z.; Mertens, K.N.; Seo, M.H.; Gu, H.; Lim, W.A.; Yoon, Y.H.; Soh, H.Y.; Matsuoka, K. Prorocentrum shikokuense Hada and P. donghaiense Lu are junior synonyms of P. obtusidens Schiller, but not of P. dentatum Stein (Prorocentrales, Dinophyceae). Harmful Algae 2019, 89, 101686. [Google Scholar] [CrossRef]
  7. Aissaoui, A.; Armi, Z.; Akrout, F.; Hassine, O.K.B. Environmental factors and seasonal dynamics of Prorocentrum lima population in coastal waters of the Gulf of Tunis, South Mediterranean. Water Environ. Res. 2014, 86, 2256–2270. [Google Scholar] [CrossRef]
  8. Sun, K.; Qiu, Z.; He, Y.; Fan, W.; Wei, Z. Vertical development of a Prorocentrum donghaiense bloom in the coastal waters of the East China Sea: Coupled biophysical numerical modeling. Acta Oceanol. Sin. 2017, 36, 23–33. [Google Scholar] [CrossRef]
  9. Wells, M.L.; Karlson, B.; Wulff, A.; Kudela, R.; Trick, C.; Asnaghi, V.; Berdalet, E.; Cochlan, W.; Davidson, K.; De Rijcke, M.; et al. Future HAB science: Directions and challenges in a changing climate. Harmful Algae 2020, 91, 101632. [Google Scholar] [CrossRef]
  10. Zhong, Y.; Liu, X.; Xiao, W.; Laws, E.A.; Chen, J.; Wang, L.; Liu, S.; Zhang, F.; Huang, B. Phytoplankton community patterns in the Taiwan Strait match the characteristics of their realized niches. Prog. Oceanogr. 2020, 186, 102–366. [Google Scholar] [CrossRef]
  11. Steidinger, K.A. Implications of dinoflagellate life cycles on initiation of Gymnodinium breve red tides. Environ. Lett. 1975, 9, 129–139. [Google Scholar] [CrossRef]
  12. Li, R.S. Study on the ecology of red tide Prorocentrum donghaiense in the north of Fujian coast. Mar. Environ. Sci. 2009, 28, 65–69, (in Chinese with English abstract). [Google Scholar] [CrossRef]
  13. Zhou, Z.X.; Yu, R.C.; Zhou, M.J. Seasonal succession of microalgal blooms from diatoms to dinoflagellates in the East China Sea: A numerical simulation study. Ecol. Model. 2017, 360, 150–162. [Google Scholar] [CrossRef]
  14. Hu, Z.; Mulholland, M.R.; Duan, S.; Xu, N. Effects of nitrogen supply and its composition on the growth of Prorocentrum donghaiense. Harmful Algae 2012, 13, 72–82. [Google Scholar] [CrossRef]
  15. Zhou, M.; Zhu, M. Progress of the project “ecology and oceanography of harmful algal blooms in china”. Adv. Earth Sci. 2006, 21, 673–679, (in Chinese with English abstract). [Google Scholar]
  16. Sullivan, J.M.; Donaghay, P.L.; Rines, J.E.B. Coastal thin layer dynamics: Consequences to biology and optics. Cont. Shelf Res. 2010, 30, 50–65. [Google Scholar] [CrossRef]
  17. Yu, L.; Zhang, Y.; Li, M.; Wang, C.; Lin, X.; Li, L.; Shi, X.; Guo, C.; Lin, S. Comparative metatranscriptomic profiling and microRNA sequencing to reveal active metabolic pathways associated with a dinoflagellate bloom. Sci. Total Environ. 2019, 699, 134–323. [Google Scholar] [CrossRef]
  18. Yang, L.Y.; Cheng, Q.; Zhuang, W.E.; Wang, H.; Chen, W. Seasonal changes in the chemical composition and reactivity of dissolved organic matter at the land-ocean interface of a subtrophic river. Environ. Sci. Pollut. Res. 2019, 26, 24595–24608. [Google Scholar] [CrossRef]
  19. Chung, S.W.; Jan, S.; Liu, K.K. Nutrient fluxes through the Taiwan Strait in spring and Summer 1999. J. Oceanogr. 2001, 57, 47–53. [Google Scholar] [CrossRef]
  20. Pan, A.J.; Wan, X.F.; Guo, X.G.; Jing, C.S. Responses of the Zhe-Min coastal current adjacent to Pingtan Island to the wintertime monsoon relaxation in 2006 and its mechanism. Sci. China Earth Sci. 2013, 56, 386–396. [Google Scholar] [CrossRef]
  21. Zhou, M.J.; Yan, T.; Zou, J.Z. Preliminary analysis of the characteristics of red tide areas in Changjiang River estuary and its adjacent sea. Chin. J. Appl. Ecol. 2003, 14, 1031–1038, (in Chinese with English abstract). [Google Scholar]
  22. Zhuo, X. Research on the basic characteristics of red tide in Fuzhou coastal waters during the past 10 years. Mar. Forecast 2018, 35, 34–40, (in Chinese with English abstract). [Google Scholar] [CrossRef]
  23. Zhou, M.J.; Yu, R.C. Mechanisms and impacts of harmful algal blooms and the count measures. Chin. J. Nat. 2007, 29, 72–77, (in Chinese with English abstract). [Google Scholar] [CrossRef]
  24. Zhang, C.S.; Wang, J.T.; Zhu, D.D.; Shi, X.Y.; Wang, X.L. The preliminary analysis of nutrients in harmful algal blooms in the East China Sea in the spring and summer of 2005. Acta Oceanol. Sin. 2008, 30, 153–159, (in Chinese with English abstract). [Google Scholar]
  25. Haraguchi, L.; Carstensen, J.; Abreu, P.C.; Odebrecht, C. Long-term changes of the phytoplankton community and biomass in the subtropical shallow Patos Lagoon Estuary, Brazil. Estuar. Coast. Shelf S 2015, 162, 76–87. [Google Scholar] [CrossRef]
  26. Hansen, H.P.; Koroleff, F. Determination of nutrients. In Methods of Seawater Analysis; Grasshoff, K., Kremling, K., Ehrhardt, M., Eds.; Wiley-VCH Publishers: Weinheim, Germany, 1999; pp. 159–228. [Google Scholar]
  27. Catherine, A.; Escoffier, N.; Belhocine, A.; Nasri, A.B.; Hamlaoui, S.; Yéprémian, C.; Bernard, C.; Troussellier, M. On the use of the FluoroProbe®, a phytoplankton quantification method based on fluorescence excitation spectra for large-scale surveys of lakes and reservoirs. Water Res. 2012, 46, 1771–1784. [Google Scholar] [CrossRef]
  28. Parsons, T.R.; Maita, Y.; Lalli, C.M. A Manual of Chemical and Biological Methods for Seawater Analysis; Pergamon Press: Toronto, ON, Canada, 1984; pp. 1–137. [Google Scholar]
  29. Utermöhl, H. Toward the improvement of the quantitative phytoplankton method. Mitt. Int. Ver. Limnol. 1958, 9, 138. [Google Scholar]
  30. Shannon, C.E.; Weaver, W. The Mathematical Theory of Communication; Illinois University Press: Urbana, IL, USA, 1963; pp. 20–31. [Google Scholar]
  31. Pielou, E.C. Ecological Diversity; John Wiley: New York, NY, USA, 1975; Volume 1, pp. 1–318. [Google Scholar]
  32. Terbraak, C.J.F.; Smilauer, P. Canoco Reference Manual and Canodraw for Windows User’s Guide: Software for Canonical Community Ordination (Version 4.5); Microcomputer Power: New York, NY, USA, 2002. [Google Scholar]
  33. Legendre, P.; Oksanen, J.; Braak, C.J.F.T. Testing the significance of canonical axes in redundancy analysis. Methods Ecol. Evol. 2011, 2, 269–277. [Google Scholar] [CrossRef]
  34. Moal, J.; Martin-Jezequel, V.; Harris, R.P.; Samain, J.F.; Poulet, S.A. Interspecific and intraspecific variability of the chemical composition of marine phytoplankton. Oceanol. Acta 1987, 10, 339–346. [Google Scholar]
  35. Wang, Y.; Li, R.X.; Dong, S.L.; Li, Y.; Sun, P.; Wang, X.D. Relationship between cell volume and cell carbon and cell nitrogen for ten common dinoflagellates. Acta Ecol. Sin. 2011, 31, 6540–6550, (in Chinese with English abstract). [Google Scholar] [CrossRef]
  36. Mercado, J.; Ramírez, T.; Cortés, D.; Sebastián, M.; Liger, E.; Bautista, B. Partitioning the effects of changes in nitrate availability and phytoplankton community structure on relative nitrate uptake. Mar. Ecol. Prog. Ser. 2008, 359, 51–68. [Google Scholar] [CrossRef] [Green Version]
  37. Hallegraeff, G.M. A review of harmful algal blooms and their apparent global increase. Phycologia 1993, 32, 79–99. [Google Scholar] [CrossRef] [Green Version]
  38. Xu, N.; Duan, S.; Li, A.; Zhang, C.; Cai, Z.; Hu, Z. Effects of temperature, salinity and irradiance on the growth of the harmful dinoflagellate Prorocentrum donghaiense Lu. Harmful Algae 2010, 9, 13–17. [Google Scholar] [CrossRef]
  39. Wang, D.; Xia, W.; Lu, S.; Wang, G.; Liu, Q.; Moore, W.S.; Chen, C.T.A. The nonconservative property of dissolved molybdenum in the western Taiwan Strait: Relevance of submarine groundwater discharges and biological utilization. Geochem. Geophys. Geosyst. 2016, 17, 28–43. [Google Scholar] [CrossRef]
  40. Lin, G.; Yang, Q.; Lin, W.; Wang, Y. Distribution characteristic and variation trend of planktonic dinoflagellate in the Taiwan Strait from 2006 to 2007. Mar. Sci. Bull. 2012, 14, 68–79, (in Chinese with English abstract). [Google Scholar]
  41. Wang, Y.; Kang, J.; Ye, Y.; Lin, G.; Yang, Q.; Lin, M. Phytoplankton community and environmental correlates in a coastal upwelling zone along western Taiwan Strait. J. Mar. Syst. 2016, 154, 252–263. [Google Scholar] [CrossRef]
  42. Thomas, M.K.; Kremer, C.T.; Klausmeier, C.A.; Litchman, E. A global pattern of thermal adaptation in marine phytoplankton. Science 2012, 338, 1085–1088. [Google Scholar] [CrossRef] [PubMed] [Green Version]
  43. Boyd, P.W.; Rynearson, T.A.; Armstrong, E.A.; Fu, F.; Hayashi, K.; Hu, Z.; Hutchins, D.A.; Kudela, R.M.; Litchman, E.; Mulholland, M.R.; et al. Marine phytoplankton temperature versus growth responses from polar to tropical waters—Outcome of a scientific community-wide study. PLoS ONE 2013, 8, e63091. [Google Scholar] [CrossRef] [Green Version]
  44. Wang, J.H.; Huang, X.Q. Ecolgical characteristics of Prorocentrum dentatum and the cause of harmful algal bloom formation in China. Chin. J. Appl. Ecol. 2003, 14, 1065–1069, (in Chinese with English abstract). [Google Scholar]
  45. Li, X.D. Analysis on characteristics of red tide in Fujian coastal waters during the last 10 years. Environ. Sci. 2012, 33, 2210–2216. [Google Scholar] [CrossRef]
  46. Ran, Z.; Sun, J.; Song, S. Phytoplankton in the Yangtze River Estuary and its adjacent waters in spring 2006. Mar. Sci. Bull. 2013, 32, 421–428. [Google Scholar] [CrossRef]
  47. Phillips, K.A.; Fawley, M.W. Winter phytoplankton blooms under ice associated with elevated oxygen levels. J. Phycol. 2002, 38, 1068–1073. [Google Scholar] [CrossRef]
  48. Chen, M. Marine Chemistry; Ocean Press: Beijing, China, 2009; pp. 90–130. [Google Scholar]
  49. Rodríguez, J.J.G.; Mirón, A.S.; García, M.C.C.; Belarbi, E.H.; Camacho, F.G.; Chisti, Y.; Grima, E.M. Macronutrients requirements of the dinoflagellate Protocetatum reticulatum. Harful Algae 2009, 8, 239–246. [Google Scholar] [CrossRef]
  50. Gobler, C.J. Climate change and harmful algal blooms: Insights and perspective. Harmful Algae 2020, 91, 101731. [Google Scholar] [CrossRef] [PubMed]
  51. Chen, C.T.A. Distributions of nutrients in the East China Sea and the South China Sea connection. J. Oceanogr. 2008, 64, 737–751. [Google Scholar] [CrossRef]
  52. Ye, X.; Chen, J.; Ji, W.; Li, D. Research the biogeochemical processes of nutrients in Minjiang Estuary. Environ. Sci. 2011, 32, 375–383, (in Chinese with English abstract). [Google Scholar]
  53. Ou, L.; Huang, X.; Huang, B.; Qi, Y.; Lu, S. Growth and competition for different forms of organic phosphorus by the dinoflagellate Prorocentrum donghaiense with the dinoflagellate Alexandrium catenella and the diatom Skeletonema costatum s. l. Hydrobiologia 2015, 754, 29–41. [Google Scholar] [CrossRef]
  54. Flynn, J.; Fasham, R. A modelling exploration of vertical migration by phytoplankton. J. Theor. Biol. 2002, 218, 471–484. [Google Scholar] [CrossRef]
  55. Lou, X.; Hu, C. Diurnal changes of a harmful algal bloom in the East China Sea: Obervations from GOCI. Remote Sens. Environ. 2014, 140, 562–572. [Google Scholar] [CrossRef]
  56. Anderson, D.A.; Gliber, P.M.; Burkholder, J.M. Harmful algal blooms and eutrophication: Nutrient sources, composition, and consequences. Estuaries 2002, 25, 562–584. [Google Scholar] [CrossRef]
  57. Huang, T.H.; Chen, C.T.A.; Lee, J.; Wu, C.R.; Wang, Y.L.; Bai, Y.; He, X.; Wang, S.L.; Kandasamy, S.; Luo, J.Y.; et al. East China Sea increasingly gains limiting nutrient P from South China Sea. Sci. Rep. 2019, 9, 5648. [Google Scholar] [CrossRef] [Green Version]
  58. Brennan, G.; Collins, S. Growth responses of a green alga to multiple environmental drivers. Nat. Clim. Chang. 2015, 5, 892–897. [Google Scholar] [CrossRef]
  59. Brennan, G.; Colegrave, N.; Collins, S. Evolutionary consequences of multidriver environmental change in an aquatic primary producer. Proc. Natl. Acad. Sci. USA 2017, 114, 9930–9935. [Google Scholar] [CrossRef] [PubMed] [Green Version]
Figure 1. Sampling stations during the cruises in May (a) and July (b) 2019 in Taiwan Strait.
Diversity 12 00433 g001
Figure 2. Temperature (a,e), salinity (b,f), dissolved oxygen (DO) concentration (c,g), and pH value (d,h) in the surface water of the Taiwan Strait during the cruises in May (left) and July (right) 2019. Salid and hollow points in panels (c,g) represent the measured and saturated DO concentrations, respectively.
Diversity 12 00433 g002
Figure 3. Dissolved inorganic nitrogen (DIN) concentration (a,e), dissolved inorganic phosphorus (DIP) concentration (b,f), DIN:DIP ratio (c,g), and chlorophyll a (Chl a) concentration (d,h) in the surface water of the Taiwan Strait during the cruises in May (left) and July (right) 2019. Horizontal lines in panels (c,g) show the Redfield ratio of 16:1.
Diversity 12 00433 g003
Figure 4. Percentage of Chl a of green algae, cryptophyta, cyanobacteria, dinoflagellates, and diatoms (a,b) in the phytoplankton community, and relative percentage of cell density of dinoflagellates and diatoms (c,d) in the surface water of the Taiwan Strait during the cruises in May (left) and July (right) 2019.
Diversity 12 00433 g004
Figure 5. Redundancy analysis (RDA) of cell densities of dinoflagellates and diatoms and environmental drivers in the surface water of the Taiwan Strait during the cruises in May and July 2019. Dino and Dia represent cell density of dinoflagellate and diatom, respectively. Temp: temperature, Sal: salinity, DO: measured dissolved oxygen concentration, DIN: dissolved inorganic nitrogen, DIP: dissolved inorganic phosphorus, N:P DIN:DIP ratio. Hollow points represent the scores for each sample.
Diversity 12 00433 g005
Figure 6. A conceptual model for the combined effects of environmental drivers on phytoplankton community composition during May to July in the Taiwan Strait. SCS: South China Sea, DO measured dissolved oxygen concentration, DIN: dissolved inorganic nitrogen concentration, DIP: dissolved inorganic phosphorus concentration.
Diversity 12 00433 g006
Table 1. Identified dominant dinoflagellate and diatom species, phytoplankton evenness (%), and Shannon’s diversity index (bits ind–1) in the surface water of the Taiwan Strait during the cruises in May and July 2019. ‘+’ indicates presence of the given phytoplankton species in the sampling stations.
May CruiseJuly Cruise
M
01
M
03
M
05
M
13
M
15
P
01
P
03
P
05
P
11
P
15
P
17
M
13
M
15
P
03
P
05
P
11
P
13
Alexandrium sp.++ ++
Gonyaulax sp.+++++ + +
Prorocentrum donghaiense++++++ +++
Prorocentrum minimum +++ +++
Scrippsiella trochoidea++++ ++++ + +
Chaetoceros sp. ++ +++ ++
Coscinodiscus sp. ++++++++ ++ +++
Dactyliosolen sp. + ++
Guinardia sp. ++ ++
Leptocylindrus sp. +++
Navicula sp.+ + ++ ++
Pinnularia sp. + ++
Pleurosigma sp.+ + +
Pseudo-nitzschia sp. + ++ ++
Rhizosolenia sp. +++++ ++ ++++
Thalassionema sp. +++ + ++ ++
Identified number of species per sample665986471152245499
Evenness53.780.379.446.560.973.359.468.790.785.680.877.379.884.189.258.967.7
Shannon1.11.61.31.11.31.31.01.42.61.51.10.81.11.61.21.51.7
Table 2. Summary of dinoflagellate blooms in Fujian coastal water during 2002 to 2019. “N” indicates that no data was found.
TimePeriod (Day)Dominant SpeciesTemperature
(°C)
Salinity
(psu)
Reference
2002. 04–0516Prorocentrum donghaiense, Noctiluca scintillans, Gymnodinium spp. 18.8–24.024.7–30.3[44]
2003. 04–0634P. donghaiense, G. mikimotoiNN[12]
2004. 04–0526P. donghaiense, Karenia mikimotoiNN[12]
2005. 04–058P. donghaienseNN[12]
2006. 03 or 069P. donghaiense,NN[12]
2007. 01 or 0620P. donghaiense,17.0–25.229.5–33.4[12]
2008. 04–0542P. donghaiense, K. mikimotoi18.2–24.529.8–31.5[12]
2009. 0222Akashiwo sanguineaNN[45]
2010. 04–0527P. donghaiense, K. mikimotoi18.8–19.922.7–26.1[22,45]
2011.0510P. donghaiense, A. sanguinea,20.0–24.030.0–34.0[5]
2012. 04–0640P. donghaiense, K. mikimotoi,20.5–24.532.0–34.0[5]
2013. 0527P. donghaiense, N. scintillans, Eucampia zodiacus21.0–24.530.0–33.0[5]
2014. 0527P. donghaiense, N. scintillans, K. mikimotoi19.0–20.226.4–30.3[22]
2015. 04–0512K. mikimotoi,NN[22]
2016. 04–0534P. donghaiense, N. scintillans, P. globosa,17.0–20.825.2–29.0[22]
2017. 05–0737P. donghaiense, N. scintillans,G. catenatum, K. mikimotoi,21.8–23.228.6–32.0[22]
2018. 04–0621P. donghaiense, G. catenatum, K. mikimotoiNN[22]
2019. 04–0532P. donghaiense, N. scintillans, K. mikimotoi, A. sanguinea,21.8–24.127.2–32.6[22]
Publisher’s Note: MDPI stays neutral with regard to jurisdictional claims in published maps and institutional affiliations.

