Lepidoptera are Relevant Bioindicators of Passive Regeneration in Tropical Dry Forests

 ,
,
Abstract
:
1. Introduction
2. Materials and Methods
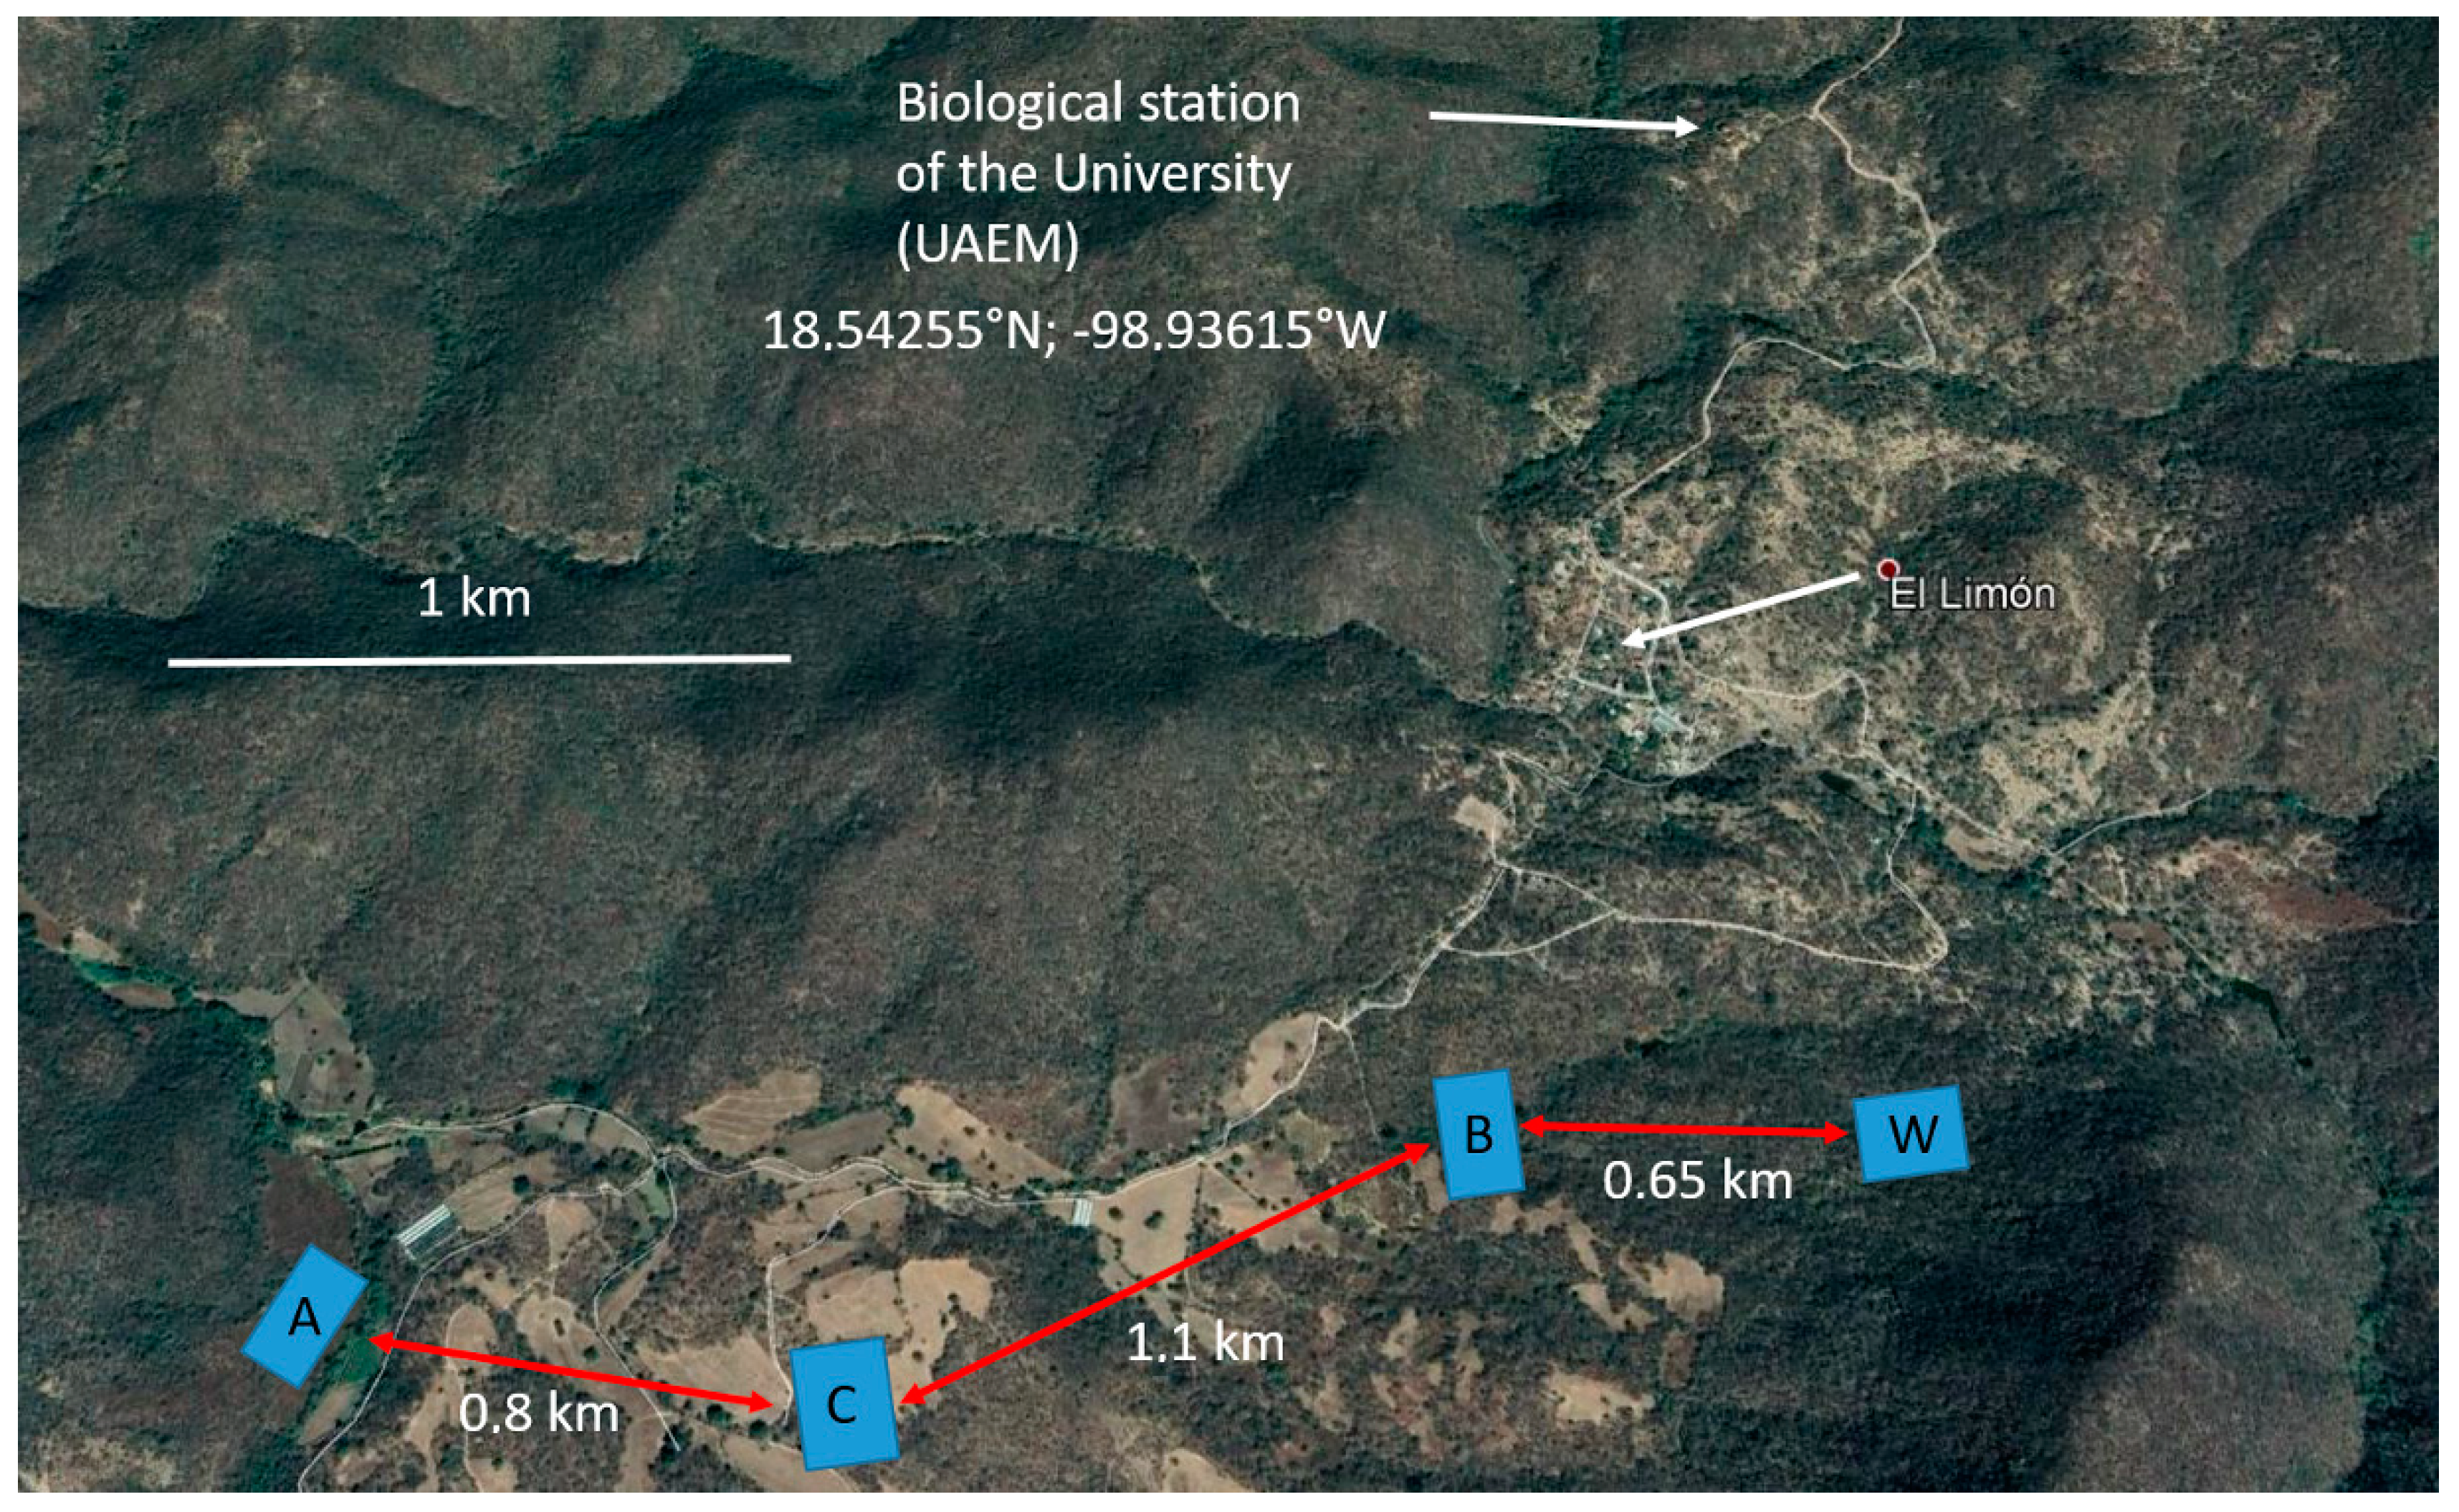
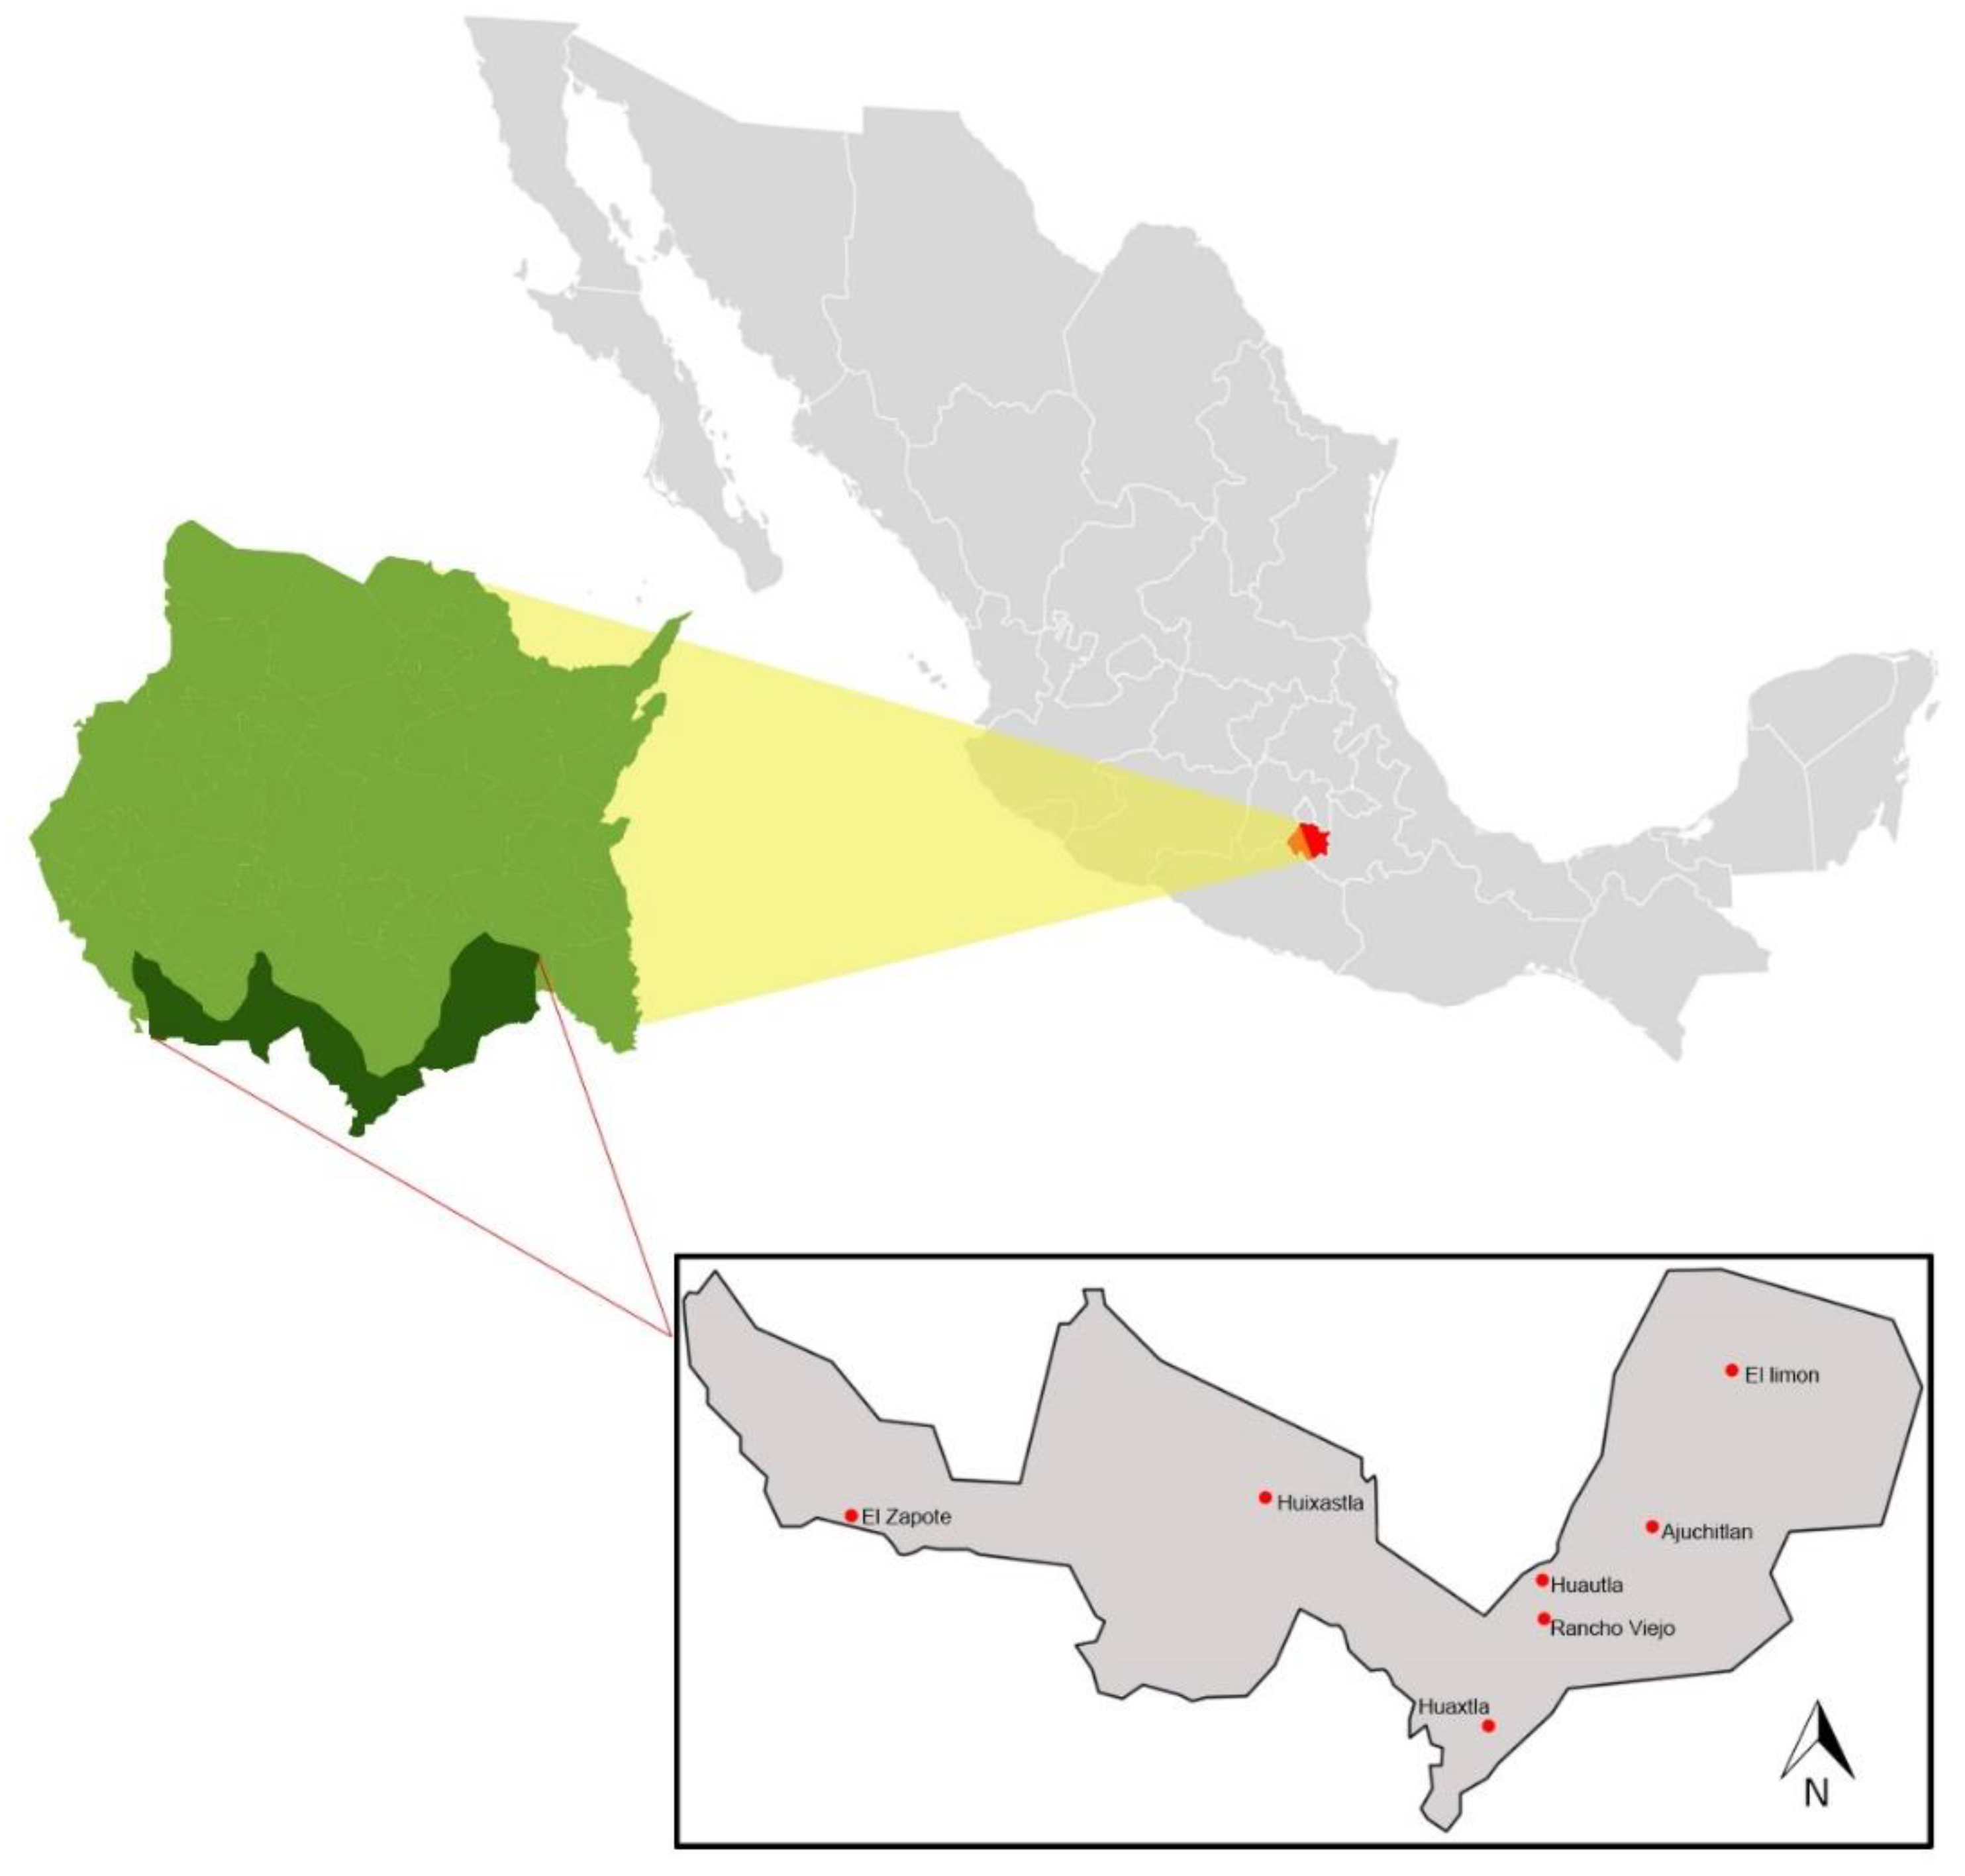
2.1. Study Sites
2.2. Butterfly Sampling
2.3. Data Analyses
2.3.1. Diversity Indices
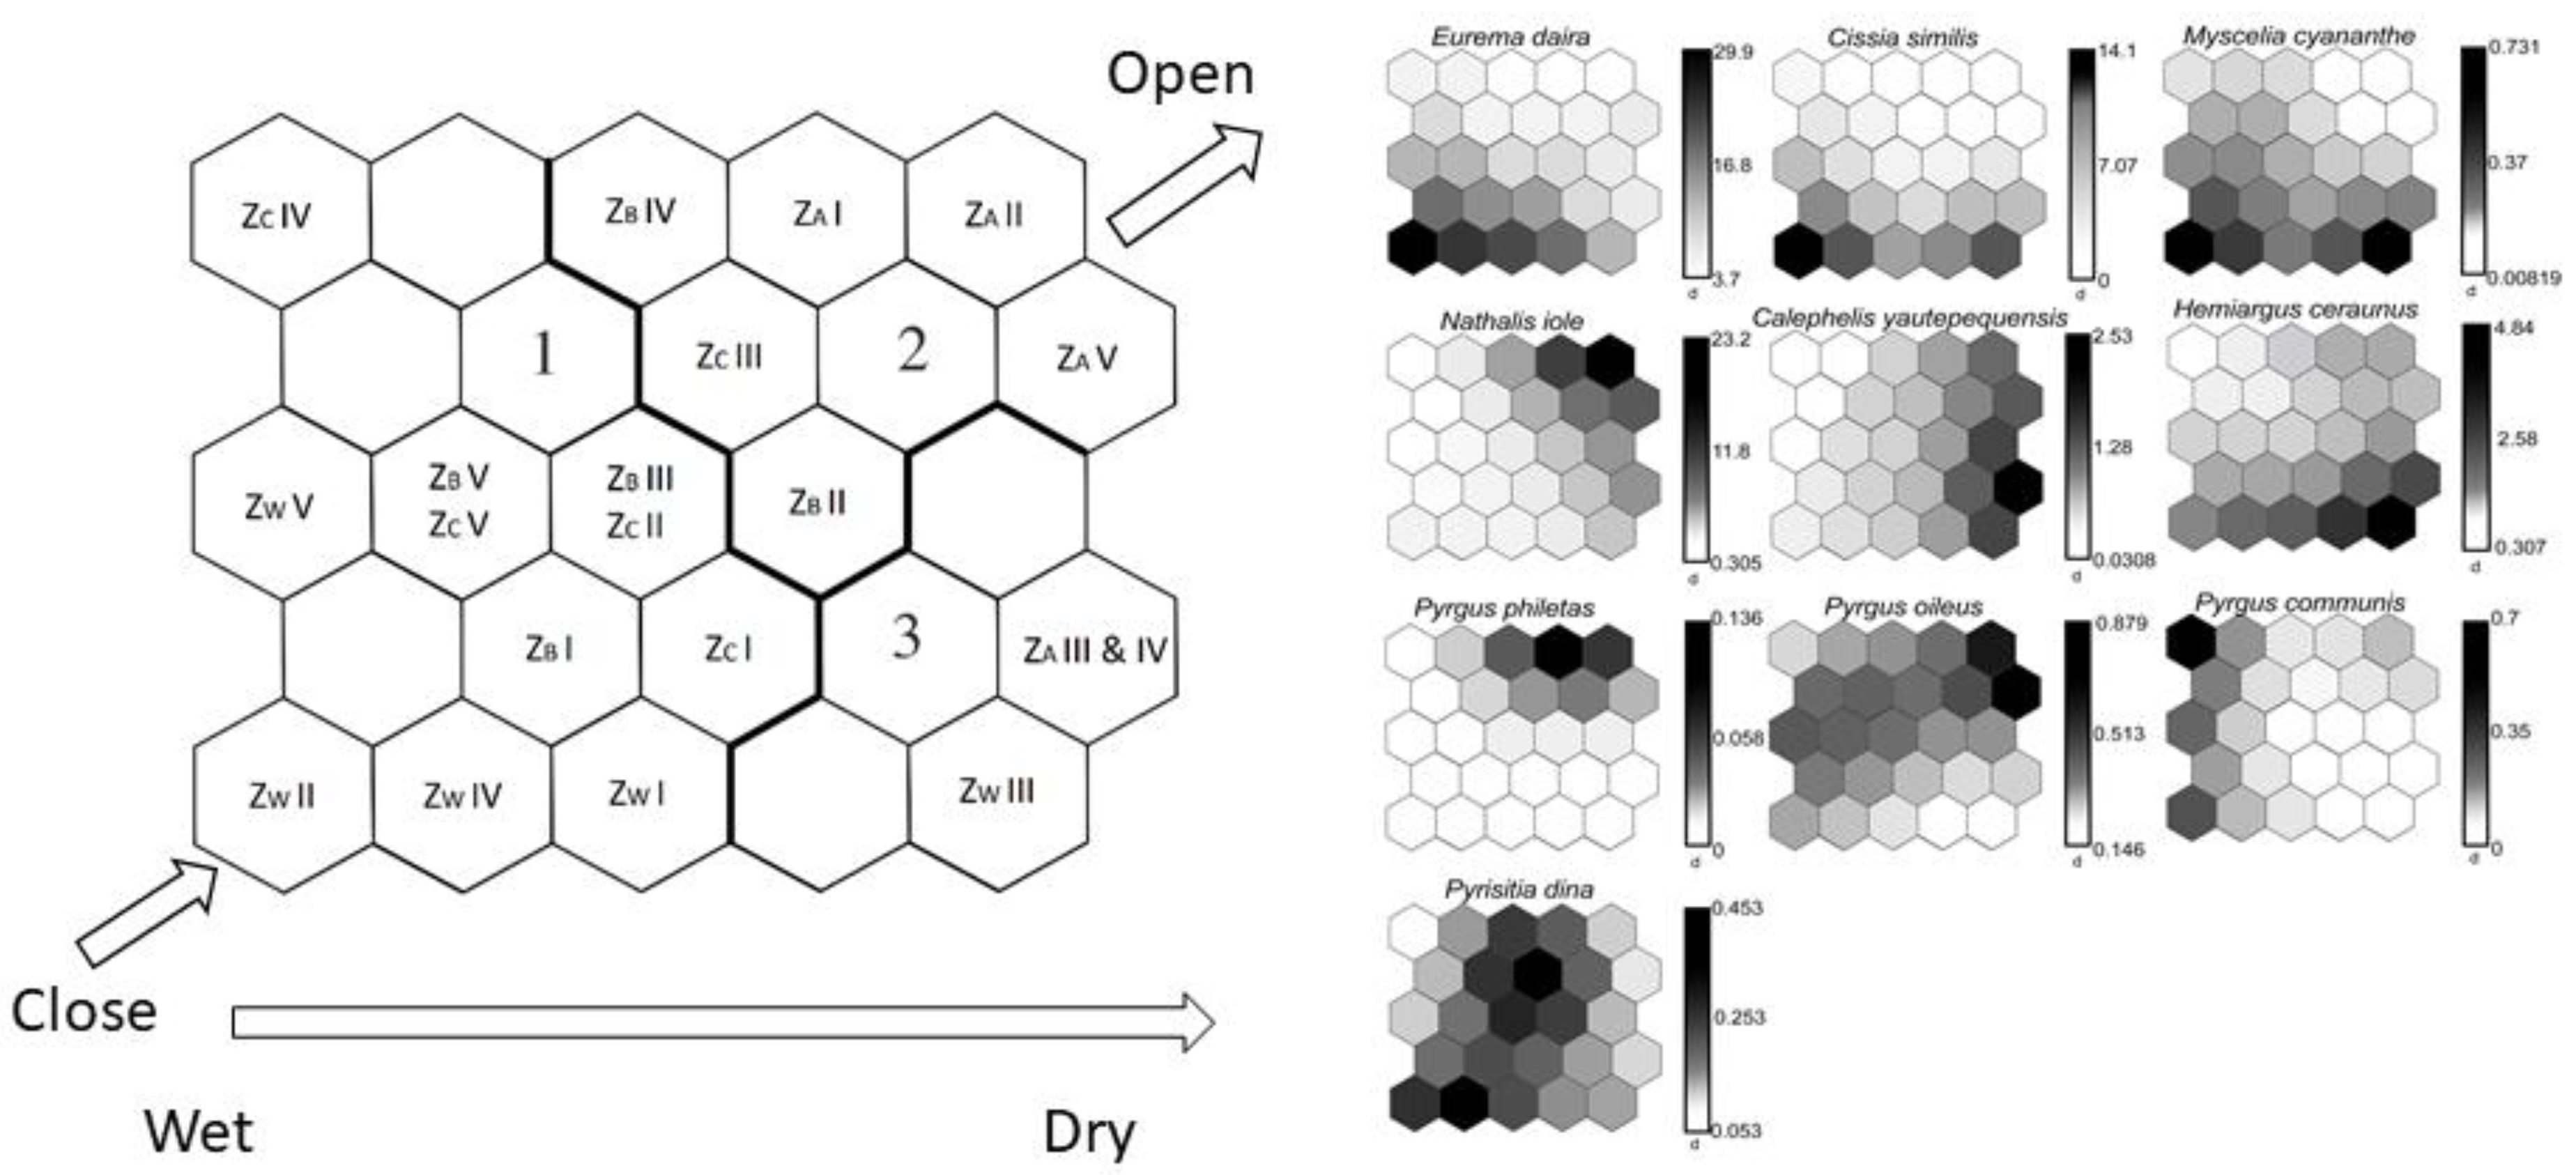
2.3.2. Species Distribution Patterns
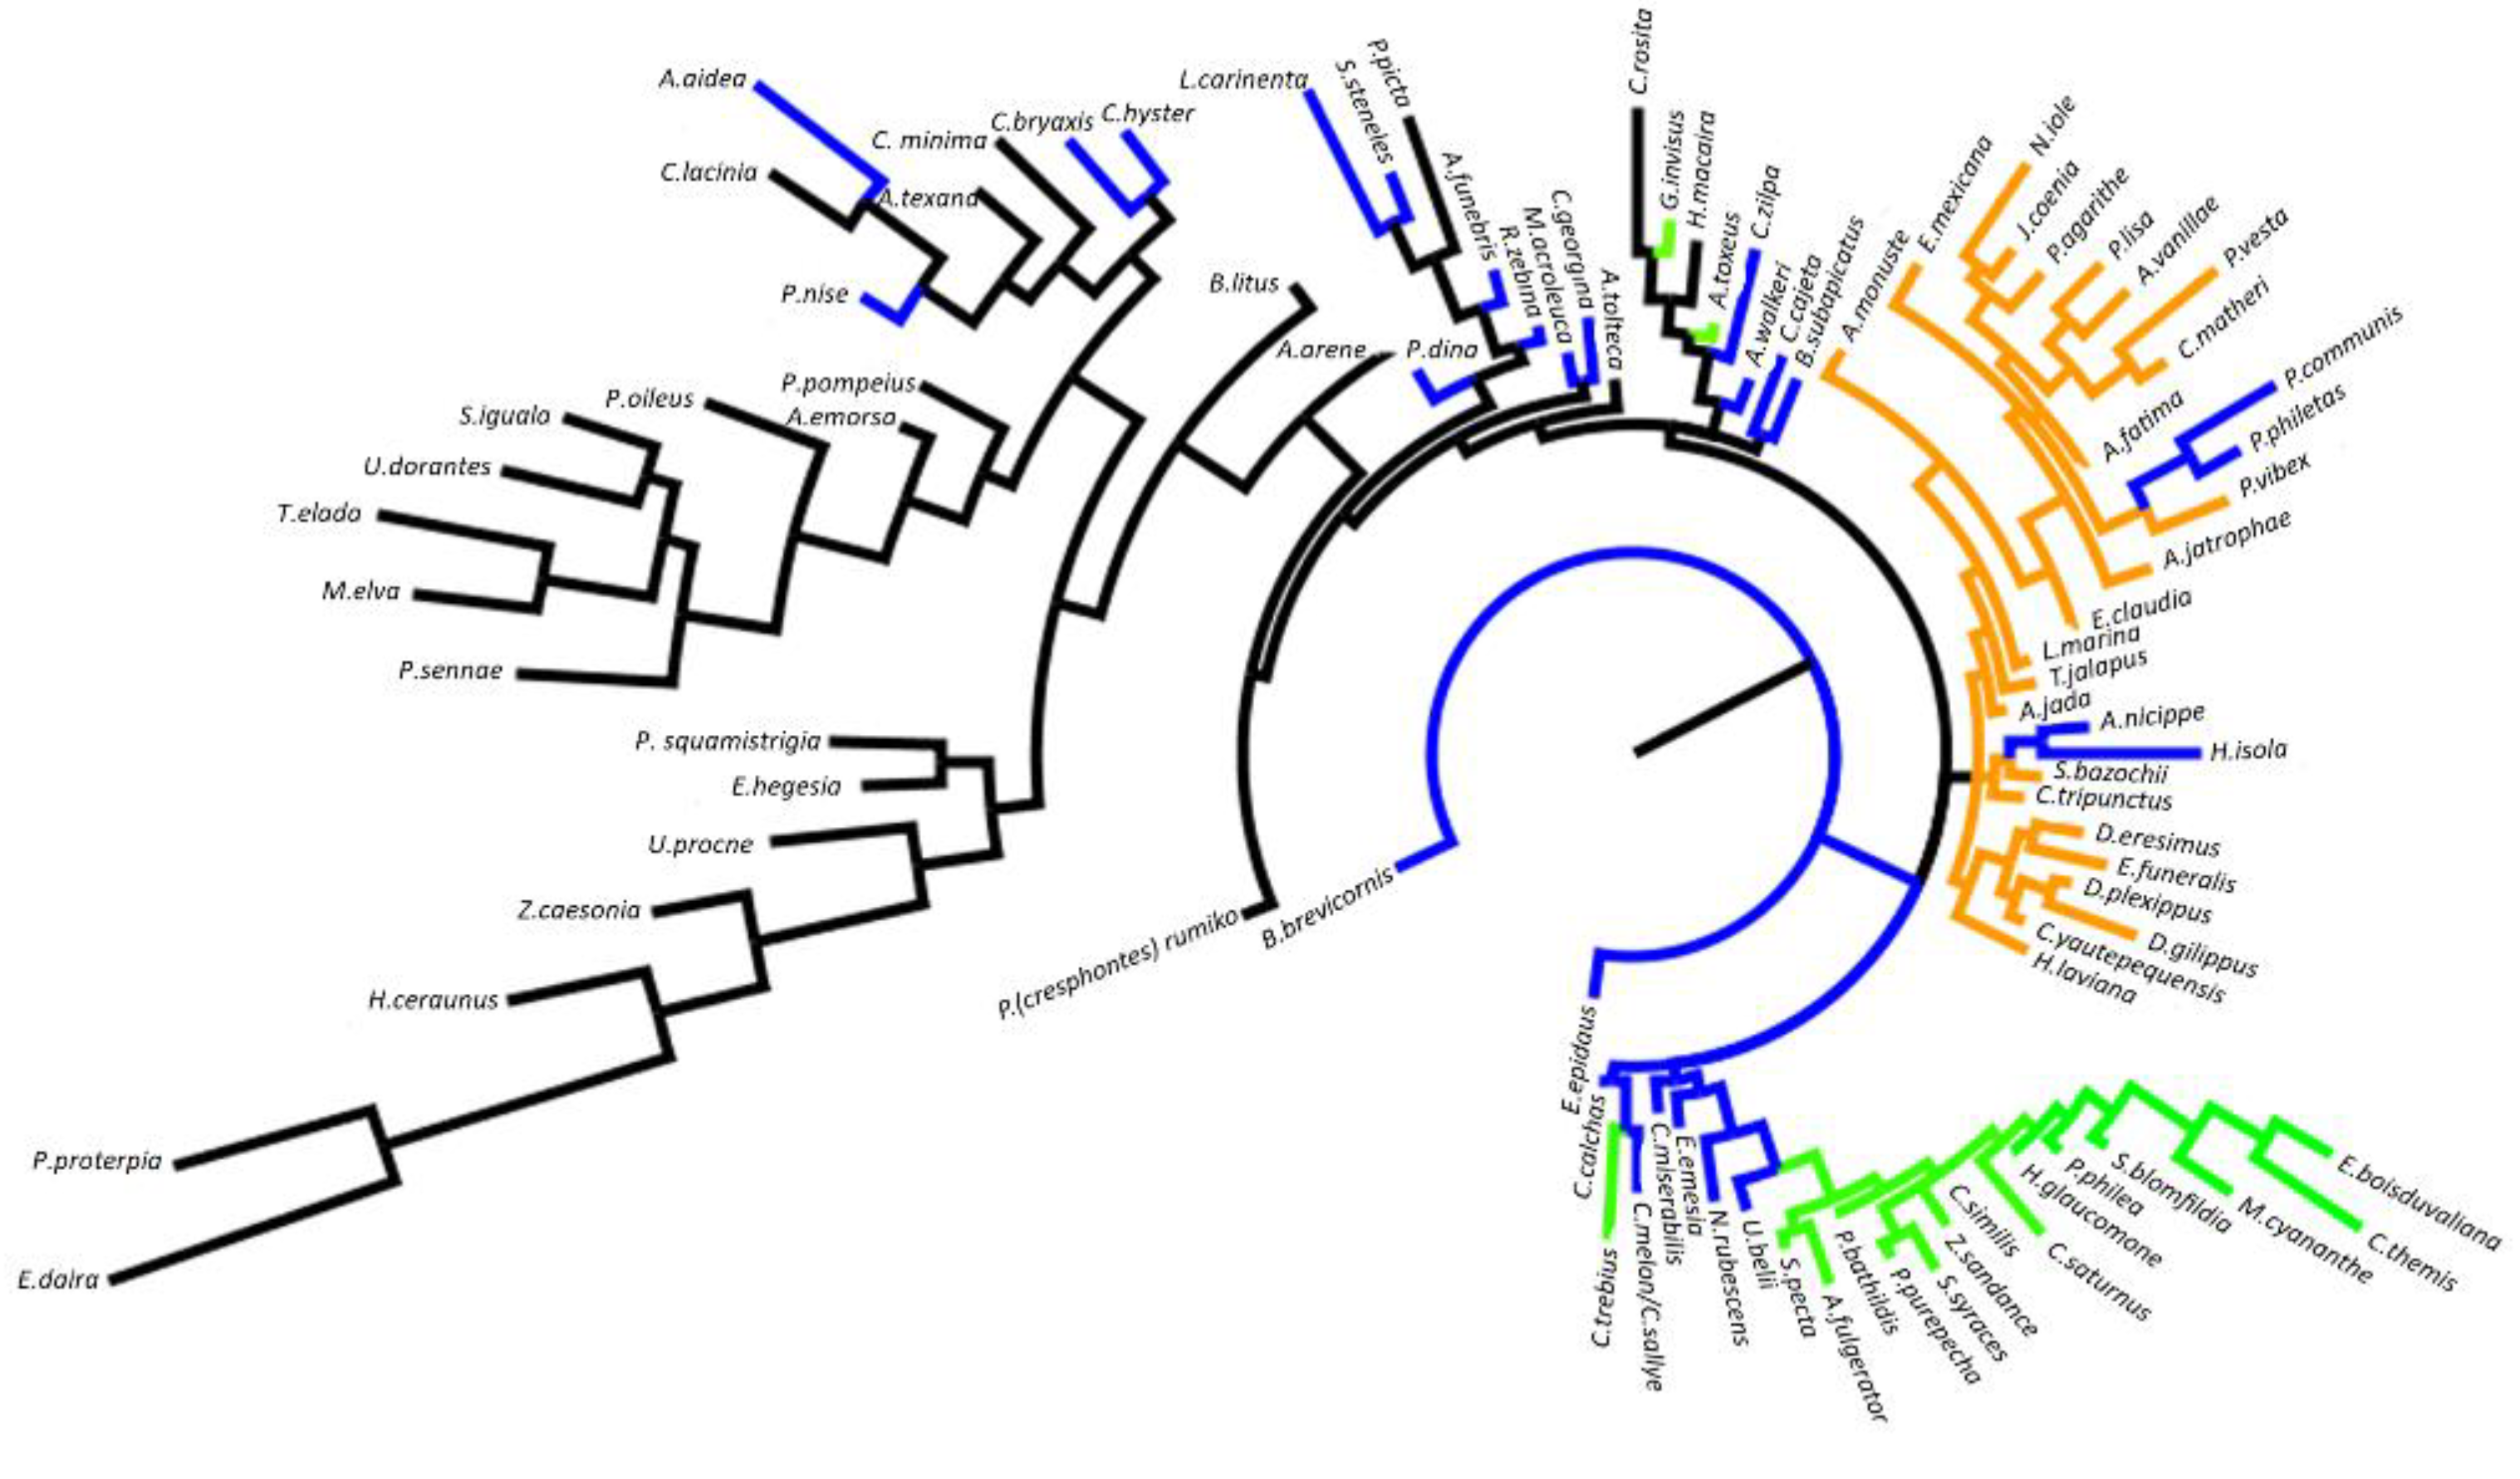
2.3.3. Cladistic Analysis
3. Results
3.1. Diversity Indices
3.2. Species Distribution Patterns
3.2.1. Rainy Season
3.2.2. Dry Season
3.3. Cladistic Analysis
3.4. Comparison of the Two Analyses
4. Discussion
4.1. Specificity of Lepidoptera Habitat
4.2. Lepidoptera as Bioindicators
4.3. Diversity of the Successional Stages
4.4. Passive Regeneration of the Dry Tropical Forest
Author Contributions
Funding
Acknowledgments
Conflicts of Interest
Appendix A


| Family | Subfamily | Genus | Species | Description | Distribution |
|---|---|---|---|---|---|
| Papilionidae | Baroniinae | Baronia | brevicornis | Salvin, 1893 | W Mexico |
| Papilioninae | |||||
| Troidini | Parides | montezuma | Westwood, 1844 | Mexico to Costa Rica | |
| Parides | photinus | Doubleday, 1844 | Mexico to Costa Rica | ||
| Leptocircini | Eurytides | epidaus | Salvin and Godman, 1868 | W. Mexico | |
| Papilionini | Papilio | rumiko | Shiraiwa and Grishin, 2014 | S USA to Panama | |
| Papilio | thoas | Rothshild and Jordan, 1906 | S USA to Panama | ||
| 6 species | |||||
| Pieridae | Coliadinae | Abaeis | nicippe | Cramer, 1779 | S USA to Costa Rica |
| Eurema | boisduvaliana | Felder and Felder, 1865 | S USA to Costa Rica | ||
| Eurema | daira | Felder, 1869 | S USA to W Mexico | ||
| Eurema | mexicana | Boisduval, 1836 | S USA to Panama | ||
| Nathalis | iole | Boisduval, 1836 | Canada to Honduras | ||
| Phoebis | agarithe | Boisduval, 1836 | S USA to Peru | ||
| Phoebis | philea | Linnaeus, 1763 | S USA to Brazil | ||
| Phoebis | sennae | Cramer, 1777 | S USA to S America | ||
| Pyrisitia | dina | Boisduval, 1836 | S USA to Panama | ||
| Pyrisitia | lisa | Herrich-Schäffer, 1865 | S USA to Panama | ||
| Pyrisitia | nise | Felder, 1869 | S USA to Panama | ||
| Pyrisitia | proterpia | Fabricius, 1775 | S USA to Peru | ||
| Zerene | cesonia | Stoll, 1790 | S USA to Colombia | ||
| Pierinae | Ascia | monuste | Linnaeus, 1764 | S USA to W Mexico | |
| Melete | lycimnia | Boisduval, 1836 | S USA to Costa Rica | ||
| 15 species | |||||
| Nymphalidae | Libytheinae | Libytheana | carinenta | Michener, 1943 | W Mexico to Panama |
| Danaidae | |||||
| Danaini | Danaus | eresimus | Talbot, 1943 | S USA to Columbia | |
| Danaus | gilippus | Bates, 1863 | USA to Columbia | ||
| Danaus | plexippus | Linnaeus, 1758 | Canada to Mexico | ||
| Heliconiinae | |||||
| Heliconiini | Agraulis | vanillae | Riley, 1926 | S USA to Panama | |
| Dione | juno | Reakirt, 1866 | Mexico to Panama | ||
| Dione | moneta | Butler, 1873 | S USA to Panama | ||
| Argynnini | Euptoieta | claudia | Cramer, 1775 | USA to Panama | |
| Euptoieta | hegesia | Stichel, 1938 | S USA to Argentina | ||
| Biblidinae | Hamadryas | amphinome | Jenkins, 1983 | W Mexico | |
| Hamadryas | glauconome | Bates, 1864 | C Mexico to Costa Rica | ||
| Hamadryas | guatemalena | Fruhstorfer, 1916 | S USA to Mexico | ||
| Mestra | amymone | Menestries, 1857 | S USA to Costa Rica | ||
| Myscelia | cyananthe | Felder and Felder, 1867 | C Mexico | ||
| Nymphalinae | |||||
| Nymphalini | Smyrna | blomflidia | Fruhstorfer, 1908 | S USA to Panama | |
| Victorinini | Anartia | jatrophae | Fruhstorfer, 1907 | S USA to Panama | |
| Anartia | fatima | Lamas, 1995 | W Mexico | ||
| Siproeta | stelenes | Frustorfer, 1907 | S USA to Brazil | ||
| Junoniini | Junonia | coenia | Hübner, 1822 | S USA to Guatemala | |
| Junonia | evarete | Barnes and McDunnough, 1916 | S USA to Mexico | ||
| Melitaeini | Anthanassa | ardys | Hewitson, 1864 | C Mexico | |
| Anthanassa | texana | Edwards, 1863 | S USA to Guatemala | ||
| Chlosyne | lacinia | Geyer, 1837 | C Mexico to Panama | ||
| Chlosyne | rosita | Bauer, 1961 | W Mexico | ||
| Microtia | elva | Bates, 1864 | S USA to Costa Rica | ||
| Phyciodes | graphica | Felder, 1869 | S USA to C Mexico | ||
| Phyciodes | pallescens | Felder, 1869 | S USA to C Mexico | ||
| Texola | elada | Hewitson, 1868 | C Mexico | ||
| Charaxinae | |||||
| Anaeini | Anaea | aidea | Guerin-Meneville, 1844 | S USA to Costa Rica | |
| Satyrinae | Cissia | similis | Butler, 1867 | W Mexico to Columbia | |
| Cissia | themis | Butler, 1867 | W Mexico to Nicaragua | ||
| Hermeuptychia | hermes | Fabricius, 1775 | S USA to Argentina | ||
| Pindis | squamistriga | Felder, 1869 | C Mexico to Guatemala | ||
| 33 species | |||||
| Lycaenidae | Theclinae | Arawacus | jada | Hewitson, 1867 | S USA to Coasta Rica |
| Calycopis | isobeon | Butler and Druce, 1872 | C Mexico to Brazil | ||
| Cyanophrys | miserabilis | Clench, 1946 | C Mexico to Honduras | ||
| Lamprospilus | sethon | Godman and Salvin, 1887 | C Mexico to Costa Rica | ||
| Panthiades | bathildis | Felder and Felder, 1865 | C Mexico to Brazil | ||
| Parrhasius | moctezuma | Clench, 1971 | C Mexico | ||
| Rekoa | zebina | Hewitson, 1869 | C Mexico to Costa Rica | ||
| Strymon | bazochii | Godart, 1824 | S USA to Argentina | ||
| Strymon | bebrycia | Hewitson, 1868 | S USA to Costa Rica | ||
| Polyommatinae | Echinargus | isola | Reakirt, 1867 | S USA to Guatemala | |
| Hemiargus | ceraunus | Lucas, 1857 | S USA to Panama | ||
| Leptotes | cassius | Boisduval, 1870 | S USA to Panama | ||
| Leptotes | marina | Reakirt, 1868 | S USA to Nicaragua | ||
| Riodininae | Apodemia | walkeri | Godman and Salvin, 1886 | C Mexico to Costa Rica | |
| Calephelis | matheri | McAlpine, 1971 | W Mexico | ||
| Calephelis | yautepecensis | Maza and Turrent, 1977 | W Mexico | ||
| Caria | ino | Godman and Salvin, 1878 | W Mexico | ||
| Caria | stillaticia | Dyar, 1912 | W Mexico | ||
| Emesis | emesia | Hewitson, 1867 | C and S Mexico | ||
| Melanis | acroleuca | Felder, 1869 | W Mexico | ||
| 20 species | |||||
| Hesperiidae | Eudaminae | Achalarus | toxeus | Plötz, 1881 | S USA to Panama |
| Astraptes | "fulgerator" | Reakirt, 1867 | S USA to S America | ||
| Chiodes | albofasciatus | Hewitson, 1867 | S USA to Costa Rica | ||
| Chiodes | zilpa | Butler, 1872 | S USA to Venezuela | ||
| Codatractus | bryaxis | Hewitson, 1867 | N Mexico to Honduras | ||
| Codatractus | hyster | Dyar, 1916 | Mexico | ||
| These 2 sp | Codatractus | melon | Godman and Salvin, 1893 | N Mexico to Costa Rica | |
| were pooled | Codatractus | sallyae | Warren, 1995 | W Mexico to Guatemala | |
| Cogia | cajeta | Godman and Salvin, 1894 | W Mexico to Costa Rica | ||
| Cogia | calchas | Herrich-Schäffer, 1869 | S USA to Argentina | ||
| Thessia | jalapus | Plötz, 1881 | S USA to Colombia | ||
| Urbanus | belli | Hayward, 1935 | S USA to W Mexico | ||
| Urbanus | dorantes | Stoll, 1790 | S USA to Argentina | ||
| Urbanus | procne | Plötz, 1881 | S USA to Argentina | ||
| Urbanus | teleus | Hübner, 1821 | S USA to Argentina | ||
| Urbanus | viterboana | Ehrmann, 1907 | C Mexico to Ecuador | ||
| Pyrginae | |||||
| Carcharodini | Bolla | litus | Dyar, 1912 | W Mexico | |
| Bolla | subapicatus | Schaus, 1902 | W Mexico to Guatemala | ||
| Nisoniades | rubescens | Möschler, 1877 | S USA to Bolivia | ||
| Staphylus | iguala | Williams and Bell, 1940 | SW Mexico | ||
| Staphylus | tierra | Evans, 1953 | W Mexico | ||
| Erynnini | Chiomara | georgina | Reakirt, 1868 | S USA to Costa Rica | |
| Erynnis | funeralis | Scudder and Burgess, 1870 | S USA to Argentina | ||
| Erynnis | tristis | Edwards, 1883 | S USA to Colombia | ||
| Gesta | invisus | Butler and Druce, 1872 | S USA to Costa Rica | ||
| Gorgythion | begga | Möschler, 1877 | S USA to Bolivia | ||
| Pyrgini | Antigonus | emorsa | Felder, 1869 | S USA to W Mexico | |
| Antigonus | funebris | Felder, 1869 | SW Mexico | ||
| Heliopetes | laviana | Hewitson, 1868 | S USA to Venezuela | ||
| Heliopetes | macaira | Reakirt, 1867 | S USA to Panama | ||
| Pyrgus | albescens | Plötz, 1884 | S USA to Oaxaca | ||
| Pyrgus | oileus | Linnaeus, 1767 | S USA to Costa Rica | ||
| Pyrgus | philetas | Edwards, 1881 | S USA to Chiapas | ||
| Zopyrion | sandace | Godman and Salvin, 1896 | C Mexico to Costa Rica | ||
| Heteropterinae | Piruna | penaea | Dyar, 1918 | W Mexico | |
| Piruna | purepecha | Warren and Gonzalez, 1999 | SW Mexico | ||
| Hesperiinae | |||||
| Thymelicini | Ancyloxypha | arene | Edwards, 1871 | S USA to Costa Rica | |
| Copaedes | minima | Edwards, 1870 | S USA to Costa Rica | ||
| Anthoptini | Synapte | pecta | Evans, 1955 | S USA to Costa Rica | |
| Synapte | syraces | Godman, 1901 | W Mexico | ||
| Moncini | Amblyscirtes | tolteca | Scudder, 1872 | S USA to Nicaragua | |
| Callimormus | saturnus | Herrich-Schäffer, 1869 | C Mexico to Paraguay | ||
| Cymaenes | trebius | Mabille, 1891 | S USA to Colombia | ||
| Hesperiini | Polites | vibex | Scudder, 1872 | Canada to Argentina | |
| Pompeius | pompeius | Latreille, 1824 | C Mexico to Argentina | ||
| 45 species | |||||
| Total | 119 species | 26 discarded | 93 species, 92 taxa analyzed |
| Theoretical | SOM Result Observed | |||||
|---|---|---|---|---|---|---|
| Species | Degree of Openness | Humidity Gradient | G or S | Degree of Openness | Humidity Gradient | Congruence |
| B.brevicornis | Shrubs | * | S | Shrubs | * | Y |
| Papilio rumiko | Open-Shrubs | ** | G | Shrubs | ** | Tendency |
| Eurytides epidaus | Shrubs | * | G | Shrubs | * | Y |
| Ascia monuste | Open | ** | G | Open | ** | Y |
| Abaeis nicippe | Shrubs | * | G | Open | ** | 0 |
| Eurema arbella | Trees | *** | S | Trees | ** | Tendency |
| Eurema daira | Open | * | S | Open | ** | Tendency |
| Eurema mexicana | Open-Shrubs | ** | G | Open | ** | Y |
| Nathalis iole | Open-Shrubs | ** | G | Open | * | 0 |
| Phoebis agarithe | Open | ** | G | Open | * | Tendency |
| Phoebis philea | Trees | *** | G | Trees | *** | Y |
| Phoebis sennae | Shrubs-Trees | ** | G | Trees | ** | Y |
| Pyrisitia dina | Shrubs | ** | G | Shrubs | ** | Y |
| Pyrisitia lisa | Open-Shrubs | ** | G | Open | *** | Tendency |
| Pyrisitia nise | Shrubs | ** | G | Shrubs | ** | Y |
| Pyrisitia proterpia | Shrubs | ** | G | Shrubs | *** | Tendency |
| Zerene cesonia | Open-Shrubs | ** | G | Open-Shrubs | ** | Y |
| L.carinenta | Shrubs-Trees | * | G | Shrubs | ** | Tendency |
| D.eresimus | Open | * | S | Open | * | Y |
| D.plexippus | Open | ** | S | Open | * | Y |
| Danaus gillipus | Open | * | S | Open | * | Y |
| Agraulis vanillae | Open-shrub | ** | G | Open | ** | Y |
| E. claudia | Open | ** | S | Open | ** | Y |
| Euptoieta hegesia | Open | ** | S | Open-Shrubs | ** | Y |
| H. glaucomone | Trees | *** | S | Trees | *** | Y |
| M.cyananthe | Trees | *** | G | Trees | *** | Y |
| S. steneles | Shrubs | *** | S | Shrubs | *** | Y |
| Smyrna blonfildia | Trees | *** | G | Trees | *** | Y |
| Anartia fatima | Open | ** | S | Open | ** | Y |
| Anartia jatrophae | Open | ** | S | Open | ** | Y |
| A.texana | Shrubs | ** | G | Shrubs | ** | Y |
| Chlosyne lacinia | Open-Shrubs | ** | G | Shrubs | *** | Tendency |
| Chlosyne rosita | Generalist | *** | G | Generalist | ** | Tendency |
| Junonia coenia | Open | ** | G | Open | * | Tendency |
| Microtia elva | Trees | *** | G | Trees | *** | Y |
| P.graphica | Trees | ** | G | Open-Shrubs | ** | Tendency |
| P.pallescens | Open | ** | G | Open-Shrubs | ** | Y |
| Texola elada | Shrubs-Trees | ** | G | Trees | ** | Y |
| Anaea aidea | Shrubs | ** | G | Shrubs | *** | Tendency |
| Cissia similis | Trees | ** | G | Trees | ** | Y |
| Cissia themis | Shrubs-Trees | *** | G | Trees | ** | Tendency |
| P.squamistriga | Open-Shrubs | ** | G | Open-Shrubs | ** | Y |
| Apodemia walkeri | Open-Shrubs | ** | G | Shrubs | *** | Tendency |
| C.matheri | Open | * | G | Open | ** | Tendency |
| C.yautepequensis | Open | * | G | Open | * | Y |
| Emesis emesia | Shrubs | ** | S | Shrubs | ** | Y |
| Melanis acroleuca | Shrubs | *** | G | Shrubs | *** | Y |
| H.ceraunus | Open-Shrubs | ** | G | Open | * | 0 |
| Hemiargus isola | Open | *** | G | Shrubs | ** | N |
| Leptotes marina | Open-Shrubs | ** | G | Open | ** | Y |
| Arawacus jada | Shrubs | ** | S | Open | ** | Tendency |
| C.miserabilis | Shrubs | ** | S | Shrubs | ** | Y |
| P.bathildis | Trees | *** | G | Trees | *** | Y |
| Rekoa zebina | Shrubs | *** | G | Shrubs | *** | Y |
| Strymon bazochii | Shrubs | ** | G | Open | ** | Tendency |
| Achalarus toxeus | Open-Shrubs | ** | G | Trees | ** | Tendency |
| A.fulgerator | Trees | *** | S | Trees | *** | Y |
| Chioides zilpa | Open-Shrubs | ** | G | Trees | ** | Tendency |
| C.bryaxis | Trees | *** | G | Shrubs | *** | Tendency |
| C.hyster | Shrubs | ** | G | Shrubs-Trees | *** | Tendency |
| C.melon/sallyae | Shrubs | *** | G | Shrubs | *** | Y |
| Cogia cajeta | Open-Shrubs | * | G | Shrubs | ** | 0 |
| Cogia calchas | Shrubs | ** | G | Shrubs | ** | Y |
| Thessia jalapus | Shrubs | ** | G | Open | * | 0 |
| Urbanus belli | Trees | ** | G | Shrubs | ** | Tendency |
| Urbanus dorantes | Shrubs | ** | G | Shrubs | *** | Tendency |
| Urbanus procne | Open-Shrubs | ** | G | Open-Shrubs | ** | Y |
| Antigonus emorsa | Open-Shrubs | * | G | Shrubs-Trees | *** | N |
| A.funebris | Shrubs | ** | G | Shrubs | *** | Tendency |
| Bolla litus | Open-Shrubs | ** | G | Open-Shrubs | ** | Y |
| Bolla subapicatus | Shrubs | ** | G | Shrubs | ** | Y |
| C.georgina | Open-Shrubs | ** | G | Shrubs | *** | Y |
| Erynnis funeralis | Open | ** | G | Open-Trees | ** | Y |
| Gesta invisus | Open-Shrubs | ** | G | Trees | * | 0 |
| H.laviana | Trees | *** | S | Trees | *** | Y |
| H.macaira | Open | * | G | Open | * | Y |
| N.rubescens | Shrubs-Trees | ** | G | Shrubs-Trees | ** | Y |
| Pyrgus communis | Open | * | G | Open-Shrubs | * | Y |
| Pyrgus oileus | Open | ** | G | Trees | ** | 0 |
| Pyrgus philetas | Open | ** | G | Open-Shrubs | ** | Y |
| Staphylus iguala | Shrubs-Trees | ** | G | Shrubs-Trees | *** | Y |
| Zopyrion sandace | Trees | ** | G | Trees | *** | Tendency |
| C.minima | Open | ** | G | Shrubs | *** | N |
| A.tolteca | Open-Shrubs | * | G | Shrubs | ** | Tendency |
| A.arene | Open-Shrubs | ** | G | Open-Shrubs | ** | Y |
| C.saturnus | Trees | *** | G | Trees | *** | Y |
| Cymaenes trebius | Shrubs | *** | G | Trees | *** | Tendency |
| C.tripunctus | Shrubs | ** | G | Open | ** | Tendency |
| Polites vibex | Open | * | G | Open | ** | Tendency |
| P.pompeius | Generalist | ** | G | Generalist | *** | Tendency |
| Synapte syraces | Trees | *** | S | Trees | *** | Y |
| Synapte pecta | Trees | *** | S | Trees | *** | Y |
| P.purepecha | Shrubs-Trees | *** | S | Trees | *** | Y |
| Theoretical | SOM Result Observed | |||||
|---|---|---|---|---|---|---|
| Species | Degree of Openness | Humidity Gradient | G or S | Degree of Openness | Humidity Gradient | Congruence |
| Abaeis nicippe | Shrubs | ** | G | Open | * | N |
| Eurema daira | Trees | *** | S | Trees | *** | Y |
| E.mexicana | Open-Shrubs | *** | G | Open | *** | Y |
| Nathalis iole | Open-Shrubs | * | S | Open | * | Y |
| Phoebis agarithe | Open | ** | G | Open | * | Tendency |
| Phoebis philea | Trees | *** | G | Trees | *** | Y |
| Phoebis sennae | Open-Shrubs | *** | G | Open | *** | Y |
| Pyrisitia dina | Shrubs | ** | G | Shrubs-Trees | ** | Y |
| Pyrisitia nise | Shrubs | ** | G | Shrubs | *** | Tendency |
| Pyrisitia proterpia | Shrubs | ** | G | Trees | *** | 0 |
| Zerene cesonia | Open-Shrubs | ** | G | Shrubs | *** | Tendency |
| L.carinenta | Shrubs-Trees | ** | G | Trees | *** | 0 |
| D.plexippus | Open | ** | S | Open | * | Tendency |
| Danaus gilipus | Open | ** | S | Shrubs | *** | N |
| M.cyananthe | Trees | *** | G | Trees | ** | Tendency |
| S.blonfildia | Trees | *** | G | Trees | * | 0 |
| A.texana | Shrubs | ** | G | Trees | *** | 0 |
| Junonia coenia | Open | ** | G | Open | *** | Tendency |
| Anaea aidea | Shrubs | *** | G | Shrubs | *** | Y |
| Cissia similis | Trees | *** | S | Trees | ** | Tendency |
| Cissia themis | Shrubs | *** | G | Trees | * | N |
| A.walkeri | Open-Shrubs | ** | G | Open-Shrubs | *** | Tendency |
| C.yautepequensis | Open | * | G | Open | * | Y |
| H.ceraunus | Shrubs-Trees | ** | G | Trees | * | 0 |
| Hemiargus isola | Open | *** | G | Open | ** | Tendency |
| Leptotes marina | Open-Shrubs | ** | G | Open | ** | Y |
| Urbanus procne | Open-Shrubs | ** | G | Trees | *** | N |
| A.emorsa | Open-Shrubs | * | G | Shrubs-Trees | * | Tendency |
| Erynnis funeralis | Open | ** | G | Open | ** | Y |
| H.laviana | Trees | *** | S | Shrubs-Trees | * | N |
| Heliopetes macaira | Open | ** | G | Shrubs | *** | N |
| N.rubescens | Shrubs-Trees | *** | G | Open-Shrubs | ** | 0 |
| P.communis | Open-Shrubs | * | G | Shrubs | *** | N |
| Pyrgus oileus | Open-Shrubs | ** | G | Open | ** | Y |
| Pyrgus philetas | Open | * | G | Open | ** | Tendency |
| Staphylus iguala | Open-Shrubs | ** | G | Open | * | Tendency |
| Zopyrion sandace | Trees | * | G | Trees | ** | Tendency |
| C.minima | Open | * | G | Open | * | Y |
| C.trebius | Shrubs | ** | S | Trees | ** | Tendency |
| C.tripunctus | Shrubs | ** | G | Open | ** | Tendency |
| Polites vibex | Open | * | G | Open-Trees | * | Y |
| P.pompeius | Open-Shrubs | ** | G | Open | ** | Y |
References
- Miles, L.; Newton, A.C.; DeFries, R.S.; Ravilious, C.; May, I.; Bluth, S.; Kapos, V.; Gordon, E. A global overview of the conservation status of tropical dry forests. J. Biogeogr. 2006, 33, 491–505. [Google Scholar] [CrossRef]
- Miranda, F.; Hernández-X, E. Los tipos de vegetación de México y su clasificación. Bot. Sci. 1963, 28, 29–179. [Google Scholar] [CrossRef]
- Rzedowski, J. Vegetación de México; Limusa, N., Ed.; CONABIO (Comisión Nacional para el Conocimiento y Uso de la Biodiversidad): Mexico city, Mexico, 1978; pp. 1–505. [Google Scholar]
- Gillespie, T.; Lipkin, B.; Sullivan, L.; Benowitz, D.; Pau, S.; Keppel, G. The rarest and least protected forests in biodiversity hotspots. Biodivers. Conserv. 2012, 21, 3597–3611. [Google Scholar] [CrossRef]
- Dryflor. Plant diversity patterns in neotropical dry forests and their conservation implications. Science 2016, 353, 1383–1387. [Google Scholar] [CrossRef] [PubMed] [Green Version]
- Devineau, J.L. Structure and dynamics of some tropophilous forests in West Africa (Ivory Coast). Thèse d’Etat, Ecologie, Environnement, Université Pierre et Marie Curie, Paris, France, 1984. [Google Scholar]
- Janzen, D.H. Management of habitat fragments in a tropical dry forest: Growth. Ann. Mo. Bot. Gard. 1988, 75, 105–116. [Google Scholar] [CrossRef]
- Janzen, D.H. Tropical dry forests: The most endangered major tropical ecosystem. In Biodiversity; Wilson, E.O., Ed.; National Academy Press: Washington, DC, USA, 1988; pp. 130–137. [Google Scholar]
- Puig, H. Diversité spécifique et déforestation: L’exemple des forêts tropicales humides du Mexique. Bois For. Trop. 2001, 268, 41–55. [Google Scholar]
- Trejo, I.; Dirzo, R. Deforestation of seasonally dry tropical forest: A national and local analysis in Mexico. Biodivers. Conserv. 2000, 94, 133–142. [Google Scholar]
- Becerra, J.X.; Venable, D.L. Sources and Sinks of Diversification and Conservation Priorities for the Mexican Tropical Dry Forest. PLoS ONE 2008, 3, e3436. [Google Scholar] [CrossRef] [PubMed] [Green Version]
- Portillo-Quintero, C.; Sanchez-Azofeifa, G.A. Extent and conservation of tropical dry forests in the Americas. Biodivers. Conserv. 2010, 143, 144–155. [Google Scholar] [CrossRef]
- Holdridge, L.R. Life Zone Ecology; Tropical Science Center: San Jose, Costa Rica, 1967; pp. 1–206. [Google Scholar]
- Legal, L.; Dorado, Ó.; Machkour-M’Rabet, S.; Leberger, R.; Albre, J.; Mariano, N.; Gers, C. Ecological constraints and distribution of the primitive and enigmatic endemic Mexican butterfly Baronia brevicornis (Lepidoptera: Papilionidae). Can. Entomol. 2015, 147, 71–88. [Google Scholar] [CrossRef]
- Gentry, A.H. Patterns of diversity and floristic composition in Neotropical montane forest. In Biodiversity and Conservation of Neotropical Montane Forests; Churchill, S.P., Balslev, H., Forero, E., Luteyn, J.L., Eds.; The New York Botanical Garden: New York, NY, USA, 1995; pp. 103–126. [Google Scholar]
- Murphy, P.G.; Lugo, A.E. Dry forests of Central America and the Caribbean. In Seasonally Dry Tropical Forests; Bullock, S.H., Mooney, H., Medina, E., Eds.; Cambridge University Press: Cambridge, UK, 1995; pp. 9–34. [Google Scholar]
- Challenger, A.; Soberón, J. Los Ecosistemas Terrestres, en Capital Natural de México, Vol. I: Conocimiento Actual de la Biodiversidad; Conabio: Tlalpan, Mexico, 2008; pp. 1–30. [Google Scholar]
- Center for International Forestry Research (CIFOR). Tropical Dry Forests under Threat & Under-Researched. 2014. Available online: https://www.cifor.org/publications/pdf_files/factsheet/4875-factsheet.pdf (accessed on 27 November 2019).
- Sabogal, C. Regeneration of tropical dry forests in Central America, with examples from Nicaragua. J. Veg. Sci. 1992, 3, 407–416. [Google Scholar] [CrossRef]
- Martínez, H.A. El problema de la Leña en las zonas secas de América Central: Necesidades de investigación. In Técnicas de Producción en Fincas Pequeñas Y Recuperación De Sitios Degradados Por Medio de la Silvicultura; Acta de Simposio, 24–25.6.1988, Salazar, R., Eds.; CATIE: Turrialba, Costa Rica, 1985; pp. 33–45. [Google Scholar]
- FAO State of the World’s Forests. Pp 157 Rome. 2007. Available online: http://www.fao.org/3/a-a0773e.pdf (accessed on 27 November 2019).
- Giam, X. Global biodiversity loss from tropical deforestation. PNAS 2017, 114, 5775–5777. [Google Scholar] [CrossRef] [PubMed] [Green Version]
- Brown, S.; Lugo, A.E. The Storage and Production of Organic Matter in Tropical Forests and Their Role in the Global Carbon Cycle. Biotropica 1982, 14, 161–187. [Google Scholar] [CrossRef]
- Murphy, P.G.; Lugo, A.E. Ecology of tropical dry forest. Annu. Rev. Ecol. Evol. Syst. 1986, 17, 67–88. [Google Scholar] [CrossRef]
- Mooney, H.A.; Bullock, S.H.; Medina, E. Introduction. In Seasonally Dry Tropical Forests; Bullock, S.H., Mooney, H.A., Medina, E., Eds.; Cambridge University Press: Cambridge, UK, 1995; pp. 9–11. [Google Scholar]
- Trejo, I. Distribución y diversidad de selvas bajas de México: Relaciones con el clima y el suelo. Ph.D. Thesis, Universidad Nacional Autonoma De Mexico, Mexico City, Mexico, 1998. [Google Scholar]
- Becknell, J.M.; Kissing Kucek, L.; Powers, J.S. Above ground biomass in mature and secondary seasonally dry tropical forests: A literature review and global synthesis. For. Ecol. Manag. 2012, 276, 88–95. [Google Scholar] [CrossRef]
- Walker, L.R.; Walker, J.; Hobbs, R.J. Linking Restoration and Ecological Succession; Springer: New York, NY, USA, 2007; pp. 1–188. [Google Scholar]
- Chazdon, R.L. Beyond deforestation: Restoring forests and ecosystem services on degraded lands. Science 2008, 320, 1458–1460. [Google Scholar] [CrossRef] [PubMed] [Green Version]
- Prach, K.; Marrs, R.; Pysek, P.; van Diggelen, R. Manipulation of succession. In Linking Restoration and Ecological Succession; Walker, L.R., Walker, J., Hobbs, R.J., Eds.; Springer: New York, NY, USA, 2007; pp. 121–149. [Google Scholar]
- Zimmerman, J.K.; Aide, T.M.; Lugo, A.E. Old Fields: Dynamics and Restoration of Abandoned Farmland; Cramer, V.A., Hobbs, R.J., Eds.; Island Press: Washington, DC, USA, 2007; pp. 51–74. [Google Scholar]
- Martinez-Garza, C.; Osorio-Beristain, M.; Valenzuela-Galvan, D.; Nicolas-Medina, A. Intra and inter-annual variation in seed rain in a secondary dry tropical forest excluded from chronic disturbance. For. Ecol. Manag. 2011, 262, 2207–2218. [Google Scholar] [CrossRef]
- Juan-Baeza, I.; Martinez-Garza, M.; del-Val, E. Recovering more than tree cover: Herbivores and herbivory in a tropical dry forest. PLoS ONE 2015, 10, e0128583. [Google Scholar] [CrossRef] [PubMed]
- Solis-Gabriel, L.; Mendoza-Arroyo, W.; Boege, K.; del-Val, E. Restoring lepidopteran diversity in a tropical dry forest: Relative importance of restoration treatment, tree identity and predator pressure. PeerJ 2017, 5, e3344. [Google Scholar] [CrossRef] [PubMed]
- Luque, C.; Gers, C.; Lauga, J.; Mariano, N.A.; Wink, M.; Legal, L. Analysis of forestry impacts and Biodiversity in two Pyrenean Forests through a Comparison of moth communities (Lepidoptera, Heterocera). Insect Sci. 2007, 14, 323–338. [Google Scholar] [CrossRef]
- Bowman, D.M.J.S.; Woinarski, J.C.Z.; Sands, D.P.A.; Wells, A.; McShane, V. Slash-and-burn agriculture in the wet coastal lowlands of Papua New Guinea: Response of birds, butterflies and reptiles. J. Biogeogr. 1990, 7, 227–239. [Google Scholar] [CrossRef]
- Kimberling, D.N.; Karr, J.R.; Fore, L.S. Measuring human disturbance using terrestrial invertebrates in the shrub-steppe of eastern Washington (USA). Ecol. Indic. 2001, 1, 63–137. [Google Scholar] [CrossRef]
- Gerlach, J.; Samways, M.; Pryke, J. Terrestrial invertebrates as bioindicators: An overview of available taxonomic groups. J. Insect Conserv. 2013, 17, 831–850. [Google Scholar] [CrossRef]
- Paoletti, M.G. Practical use of invertebrates to assess sustainable land use. Agric. Ecosyst. Environ. 1999, 74, 9–11. [Google Scholar]
- Oostermeijer, J.G.B.; van Swaay, C.A.M. The relationship between butterflies and environmental indicator values: A tool for conservation in a changing landscape. Biol. Conserv. 1998, 86, 271–280. [Google Scholar] [CrossRef]
- Ricouart, F.; Céréghino, R.; Gers, C.; Winterton, P.; Legal, L. Influence of fire prevention management strategies on the diversity of butterfly fauna in the eastern Pyrenees. J. Insect Conserv. 2013, 17, 95–111. [Google Scholar] [CrossRef] [Green Version]
- Raguso, R.A.; Llorente-Bousquets, J. The butterflies (Lepidoptera) of the Tuxtlas Mts., Veracruz, Mexico, revisited: Species-richness and habitat disturbance. J. Res. Lepid. 1990, 29, 105–133. [Google Scholar]
- Legal, L.; Dorado, Ó.; Albre, J.; Bermudez-Torres, K.; Lopez, K. Mariposas diurnas, Reserva de la Biosfera Sierra de Huautla, Estado de Morelos, México; Trópico Seco Ediciónes: Cuernavaca, Morelos, Mexico, 2017; p. 330. [Google Scholar]
- Inoue, T. Chronosequential change in a butterfly community after clear-cutting of deciduous forests in a cool temperate region of central Japan. Entomol. Sci. 2003, 6, 151–163. [Google Scholar] [CrossRef]
- Viljur, M.L.; Teder, T. Butterflies take advantage of contemporary forestry: Clear-cuts as temporary grasslands. For. Ecol. Manag. 2016, 376, 118–125. [Google Scholar] [CrossRef]
- Riva, F.; Acorn, J.H.; Nielsen, S.E. Localized disturbances from oil sands developments increase butterfly diversity and abundance in Alberta’s boreal forests. Biol. Conserv. 2018, 217, 173–180. [Google Scholar] [CrossRef]
- Rosin, Z.M.; Myczko, L.; Skorka, P.; Lenda, M.; Moron, D.; Sparks, T.H.; Tryjanowski, P. Butterfly responses to environmental factors in fragmented calcareous grasslands. J. Insect Conserv. 2011, 16, 321–329. [Google Scholar] [CrossRef] [Green Version]
- Davidar, P.; Devy, S.; Yoganand, T.; Ganesh, T. Reserve size implications for the conservation of biodiversity in the Andaman Islands. In Measuring and Monitoring Biodiversity in Tropical and Temperate Forests; Boyle, T.J.B., Boontawee, B., Eds.; Centre for International Forestry Research: Bogor, Indonesia, 1995; pp. 287–301. [Google Scholar]
- Hill, C.S. The temporal distribution of butterfly species richness in a subtropical region of Australia. Proc. Ecol. Soc. Aus. 1988, 15, 115–126. [Google Scholar]
- Lawton, J.H.; Bignell, D.E.; Bolton, B.; Bloemers, G.F.; Eggleton, P.; Hammond, P.M.; Watt, A.D. Biodiversity inventories, indicator taxa and effects of habitat modification in tropical forest. Nature 1998, 391, 72–76. [Google Scholar] [CrossRef]
- Rueda, R. Atlas Municipal del Estado de Morelos; Universidad Autónoma del Estado de Morelos: Cuernavaca, Mexico, 2006; pp. 1–396. [Google Scholar]
- Torres, C.; Osorio-Beristain, M.; Mariano, N.; Legal, L. Sex-dependant seasonal activity patterns among two subfamilies of Nymphalidae (Lepidoptera) in the Mexican tropical dry forest. Ann. Soc. Entomol. Fr. 2009, 45, 265–274. [Google Scholar] [CrossRef] [Green Version]
- Chao, A. Non-parametric estimation of the number of classes in a population. Scand. J. Stat. 1984, 11, 265–270. [Google Scholar]
- Luque, C.; Legal, L.; Winterton, P.; Mariano, N.A.; Gers, C. Illustration of the Structure of Arthropod Assemblages (Collembola and Lepidoptera) in Different Forest Types: An Example in the French Pyrenees. Diversity 2011, 3, 693–711. [Google Scholar] [CrossRef] [Green Version]
- Carvalho, J.C.; Cardoso, P.; Gomes, P. Determining the relative roles of species replacement and species richness differences in generating beta-diversity patterns. Glob. Ecol. Biogeogr. 2012, 21, 760–771. [Google Scholar] [CrossRef]
- Kohonen, T. Self-Organizing Maps, 3th ed.; Springer: Berlin, Germany, 2001; pp. 1–371. [Google Scholar]
- Céréghino, R.; Leroy, C.; Dejean, A.; Corbara, B. Ants mediate the structure of phytotelm communities in an ant-garden bromeliad. Ecology 2010, 91, 1549–1556. [Google Scholar] [CrossRef] [PubMed] [Green Version]
- Swofford, D.L. PAUP: Phylogenetic Analysis Using Parsimony (*and other Methods), Version 4.0; Sinauer Associates: Sunderland, MA, USA, 2002. [Google Scholar]
- McNally, R.; Fleishman, E. Using indicator species to model species richness: Model development and predictions. Ecol. Appl. 2002, 12, 79–92. [Google Scholar] [CrossRef]
- Nally, R.M.; Fleishman, E. A successful predictive model of species richness based on indicator species. Conserv. Biol. 2004, 18, 646–654. [Google Scholar] [CrossRef]
- Geiger, W. Insekten und Naturschutz. Überlegungen aus der Schweiz. Mitt. Dtsch. Ges. Allg. Angew. Entomol. 1992, 8, 19–22. [Google Scholar]
- Young, A.M. Population Biology of Tropical Insects; Plenum: New York, NY, USA; London, UK, 1982; pp. 1–460. [Google Scholar]
- Jones, R.E.; Rienks, J. Reproductive seasonality in the tropical genus Eurema (Lepidoptera: Pieridae). Biotropica 1987, 19, 7–16. [Google Scholar] [CrossRef]
- Kunte, K.J. Project life scape. Resonance 2000, 5, 86–97. [Google Scholar] [CrossRef]
- Amala, S.; Rajkumar, M.; Anuradha, V. Species richness of Butterflies in the selected areas of Siumalai Hills. IJPAS 2011, 5, 9–15. [Google Scholar]
- Chakravarthy, A.K.; Rajagopal, D.; Jaganmathan, R. Insects as bio-indicators of conservation in the tropics. Zoo’s Print 1997, 12, 21–25. [Google Scholar]
- Warren, A.D.; Davis, K.J.; Grishin, N.V.; Pelham, J.P.; Stangeland, E.M. Interactive Listing of American Butterflies. [30-XII-2012]. Available online: http://www.butterfliesofamerica.com/ (accessed on 27 November 2019).
- Kalacskaa, M.; Sanchez-Azofeifaa, G.A.; Calvo-Alvaradob, J.C.; Quesadac, M.; Rivarda, B.; Janzen, D.H. Species composition, similarity and diversity in three successional stages of a seasonally dry tropical forest. For. Ecol. Manag. 2004, 200, 227–247. [Google Scholar] [CrossRef]
- Van Halder, I.; Barbaro, L.; Jactel, H. Conserving butterflies in fragmented plantation forests: Are edge and interior habitats equally important? J. Insect Conserv. 2011, 15, 591–601. [Google Scholar] [CrossRef]
- Machkour-M’Rabet, S.; Hénaut, Y.; Calmé, S.; Legal, L. When landscape modification is advantageous for protected species. The case of a synanthropic tarantula, Brachypelma vagans. J. Insect Conserv. 2012, 16, 479–488. [Google Scholar] [CrossRef]
- Cavanzón-Medrano, L.; Machkour-M’Rabet, S.; Chablé-Iuit, L.; Pozo, C.; Hénaut, Y.; Legal, L. Effect of climatic conditions and land cover on genetic structure and diversity of Eunica tatila (Lepidoptera) in the Yucatan peninsula, Mexico. Diversity 2018, 10, 79. [Google Scholar] [CrossRef] [Green Version]
- Lobo, J.A.; Quesada, M.; Stoner, K.E.; Fuchs, E.J.; Herrerías-Diego, Y.; Rojas, J.; Saborío, G. Factors affecting phenological patterns of bombacaceous trees in seasonal forests in Costa Rica and Mexico. Am. J. Bot. 2003, 90, 1054–1063. [Google Scholar] [CrossRef] [PubMed]
- Usher, M.B.; Keiller, S.W. The macrolepidoptera of farm woodlands: Determinants of diversity and community structure. Biol. Conserv. 1998, 7, 725–748. [Google Scholar] [CrossRef]
- Holling, C.S. Resilience and stability of ecological systems. Annu. Rev. Ecol. Evol. Syst. 1973, 4, 1–23. [Google Scholar] [CrossRef] [Green Version]
- Elmqvist, T.; Pyykönen, M.; Tengö, M.; Rakotondrasoa, F.; Rabakonandrianina, E.; Radimilahy, C. Patterns of Loss and Regeneration of Tropical Dry Forest in Madagascar: The Social Institutional Context. PLoS ONE 2007, 2, e402. [Google Scholar] [CrossRef] [PubMed] [Green Version]
- Green, G.M.; Sussman, R.W. Deforestation history of eastern rain forests of Madagascar from satellite images. Science 1990, 248, 212–215. [Google Scholar] [CrossRef] [PubMed]
- Sussman, R.W.; Green, G.M.; Sussman, L.K. Satellite Imagery, Human—Ecology, Anthropology, and Deforestation in Madagascar. Hum. Ecol. 1994, 22, 333–354. [Google Scholar] [CrossRef]
- Sussman, R.W.; Green, G.M.; Porton, I.; Andrianasolondraibe, O.L.; Ratsirarson, J. A Survey of the Habitat of Lemur catta in Southwestern and Southern Madagascar. Primate Conserv. 2003, 19, 32–57. [Google Scholar]
- Stan, K.; Sanchez-Azofeifa, A. Tropical dry forest diversity, climatic response, and resilience in a changing climate. Forests 2019, 10, 443. [Google Scholar] [CrossRef] [Green Version]
- Vallauri, D.; Géraux, H. Recréer des Forêts Tropicales Sèches en Nouvelle Calédonie; WWF: France, Paris, 2004; pp. 1–28. [Google Scholar]
- Soberón, J.; Peterson, A.T. Interpretation of models of fundamental ecological niches and species’ distributional areas. Bioinformatics 2005, 2, 1–10. [Google Scholar] [CrossRef] [Green Version]
- Tucker, C.M.; Munroe, D.K.; Nagendra, H.; Southworth, J. Comparative spatial analyses of forest conservation and change in Honduras and Guatemala. Conserv. Soc. 2005, 3, 174–200. [Google Scholar]


| Shannon (H) | Simpson (1-D) | H Mean | (1-D) Mean | Chao1 | Div Alpha | |
|---|---|---|---|---|---|---|
| Dry Season | ||||||
| Zone A (open) | 1.44 | 0.58 | 12.27 | 11.8 | ||
| January | 1.26 | 0.50 | ||||
| February | 0.86 | 0.35 | ||||
| March | 1.51 | 0.64 | ||||
| April | 2.17 | 0.78 | ||||
| May | 1.39 | 0.61 | ||||
| Zone B (shrubs) | 1.55 | 0.73 | 8 | 6.8 | ||
| January | 1.84 | 0.79 | ||||
| February | 1.52 | 0.74 | ||||
| March | 1.43 | 0.72 | ||||
| April | 1.58 | 0.74 | ||||
| May | 1.40 | 0.68 | ||||
| Zone C (shrubs) | 1.55 | 0.69 | 8.17 | 7.4 | ||
| January | 1.11 | 0.47 | ||||
| February | 1.63 | 0.75 | ||||
| March | 1.81 | 0.82 | ||||
| April | 1.70 | 0.78 | ||||
| May | 1.48 | 0.65 | ||||
| Zone W (forest) | 1.51 | 0.65 | 13 | 11.6 | ||
| January | 0.88 | 0.40 | ||||
| February | 1.13 | 0.55 | ||||
| March | 1.60 | 0.72 | ||||
| April | 1.70 | 0.73 | ||||
| May | 2.24 | 0.86 | ||||
| Rainy Season | ||||||
| Zone A (open) | 2.88 | 0.89 | 44.53 | 34.57 | ||
| June | 2.87 | 0.93 | ||||
| July | 3.13 | 0.91 | ||||
| August | 3.36 | 0.94 | ||||
| September | 3.03 | 0.89 | ||||
| October | 2.98 | 0.90 | ||||
| November | 2.62 | 0.85 | ||||
| December | 2.19 | 0.83 | ||||
| Zone B (shrubs) | 2.64 | 0.88 | 28.89 | 25.86 | ||
| June | 2.47 | 0.87 | ||||
| July | 3.08 | 0.94 | ||||
| August | 3.19 | 0.94 | ||||
| September | 2.78 | 0.92 | ||||
| October | 2.78 | 0.89 | ||||
| November | 2.27 | 0.84 | ||||
| December | 1.70 | 0.74 | ||||
| Zone C (shrubs) | 2.49 | 0.83 | 30.20 | 25.43 | ||
| June | 1.70 | 0.70 | ||||
| July | 2.85 | 0.91 | ||||
| August | 3.13 | 0.93 | ||||
| September | 2.99 | 0.93 | ||||
| October | 2.80 | 0.91 | ||||
| November | 2.82 | 0.90 | ||||
| December | 1.15 | 0.52 | ||||
| Zone W (forest) | 2.83 | 0.91 | 31.90 | 28.14 | ||
| June | 2.52 | 0.90 | ||||
| July | 2.90 | 0.91 | ||||
| August | 3.21 | 0.94 | ||||
| September | 3.16 | 0.95 | ||||
| October | 3.04 | 0.92 | ||||
| November | 2.96 | 0.93 | ||||
| December | 2.01 | 0.80 |
| ZAsec | ZArain | ZBdry | ZBrain | ZCdry | ZCrain | ZWdry | ZWrain | |
|---|---|---|---|---|---|---|---|---|
| ZAdry | 0.59 (0.56 + 0.03) | 0.67 (0.24 + 0.43) | 0.66 (0.41 + 0.25) | 0.64 (0.13 + 0.51) | ||||
| ZArain | 28;1;40 | 0.43 (0.05 + 0.38) | 0.43 (0.14 + 0.29) | 0.59 (0.10 + 0.49) | ||||
| ZBdry | 11;15;7 | 0.79 (0.67 + 0.12) | 0.5 (0.14 + 0.36) | 0.59 (0.17 + 0.42) | ||||
| ZBrain | 47;20;16 | 14;4;49 | 0.36 (0.09 + 0.27) | 0.43 (0.08 + 0.35) | ||||
| ZCdry | 11;17;4 | 11;7;4 | 0.78 (0.72 + 0.06) | 0.69 (0.29 + 0.40) | ||||
| ZCrain | 44;22;11 | 47;17;10 | 13;2;45 | 0.48 (0.03 + 0.45) | ||||
| ZWdry | 14;15;10 | 12;6;11 | 10;5;13 | 0.67 (0.57 + 0.10) | ||||
| ZWrain | 36;30;21 | 43;19;13 | 39;19;17 | 20;3;37 |
© 2020 by the authors. Licensee MDPI, Basel, Switzerland. This article is an open access article distributed under the terms and conditions of the Creative Commons Attribution (CC BY) license (http://creativecommons.org/licenses/by/4.0/).
Share and Cite
Legal, L.; Valet, M.; Dorado, O.; Jesus-Almonte, J.M.d.; López, K.; Céréghino, R. Lepidoptera are Relevant Bioindicators of Passive Regeneration in Tropical Dry Forests. Diversity 2020, 12, 231. https://0-doi-org.brum.beds.ac.uk/10.3390/d12060231
Legal L, Valet M, Dorado O, Jesus-Almonte JMd, López K, Céréghino R. Lepidoptera are Relevant Bioindicators of Passive Regeneration in Tropical Dry Forests. Diversity. 2020; 12(6):231. https://0-doi-org.brum.beds.ac.uk/10.3390/d12060231
Chicago/Turabian StyleLegal, Luc, Marine Valet, Oscar Dorado, Jose Maria de Jesus-Almonte, Karime López, and Régis Céréghino. 2020. "Lepidoptera are Relevant Bioindicators of Passive Regeneration in Tropical Dry Forests" Diversity 12, no. 6: 231. https://0-doi-org.brum.beds.ac.uk/10.3390/d12060231