Article

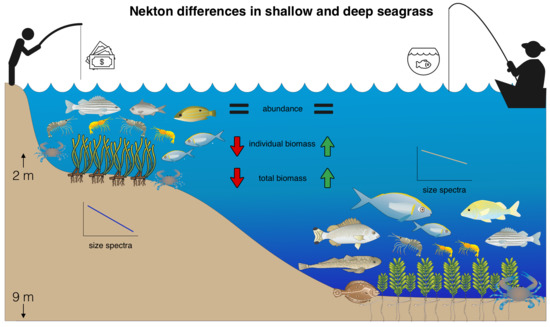
The Differential Importance of Deep and Shallow Seagrass to Nekton Assemblages of the Great Barrier Reef

1
Australian Rivers Institute-Coast & Estuaries, School of Environment & Science, Griffith University, Gold Coast, Queensland 4222, Australia
2
Centre for Tropical Water and Aquatic Ecosystem Research, James Cook University, Cairns, Queensland 4870, Australia
3
Marine Data Technology Hub, College of Science and Engineering, James Cook University, Townsville, Queensland 4814, Australia
*
Author to whom correspondence should be addressed.
Submission received: 26 June 2020 / Revised: 20 July 2020 / Accepted: 20 July 2020 / Published: 27 July 2020
(This article belongs to the Special Issue Biodiversity in Seagrass Ecosystems)

Abstract

:
Seagrass meadows are an important habitat for a variety of animals, including ecologically and socioeconomically important species. Seagrass meadows are recognised as providing species with nursery grounds, and as a migratory pathway to adjacent habitats. Despite their recognised importance, little is known about the species assemblages that occupy seagrass meadows of different depths in the coastal zone. Understanding differences in the distribution of species in seagrass at different depths, and differences in species diversity, abundance, biomass, and size spectra, is important to fully appreciate both the ecological significance and economic importance of these seagrass meadows. Here, we assess differences in the assemblage characteristics of fish, crustacea, and cephalopods (collectively, nekton) between deep (>9 m; Halophila spinulosa dominant) and shallow water (<2 m; Halodule uninervis and/or Zostera muelleri dominant) seagrass meadows of the central Great Barrier Reef coast of Queensland, Australia. Nekton assemblage structure differed between deep and shallow seagrass. Deeper meadows were typified by juvenile emperors (e.g., Lethrinus genivittatus), hairfinned leatherjacket (Paramonacanthus japonicus) and rabbitfish (e.g., Siganus fuscescens) in both biomass per unit effort (BPUE) and catch per unit effort (CPUE), whereas shallow meadows were typified by the green tiger prawn (Penaeus semisulcatus) and pugnose ponyfish (Secutor insidiator) in both BPUE and CPUE. Both meadow depths were distinct in their nekton assemblage, particularly for socioeconomically important species, with 11 species unique to both shallow and deep meadows. However, both meadow depths also included juveniles of socioeconomically important species found in adjacent habitats as adults. The total nekton CPUE was not different between deep and shallow seagrass, but the BPUE and body mass of individual animals were greater in deep than shallow seagrass. Size spectra analysis indicated that in both deep and shallow meadows, smaller animals predominated, even more so than theoretically expected for size spectra. Our findings highlight the unique attributes of both shallow and deeper water seagrass meadows, and identify the distinct and critically important role of deep seagrass meadows within the Great Barrier Reef World Heritage Area (GBRWHA) as a habitat for small and juvenile species, including those of local fisheries value.

Graphical Abstract

1. Introduction

The Great Barrier Reef World Heritage Area (GBRWHA) stretches 2000 km along the coast of Queensland, Australia, covering an area of 347,800 km2. While the extent and importance of the GBRWHA inshore shallow seagrass meadows are well known [1,2,3], the revelation that there are over 31,000 km2 of deep seagrass within the GBRWHA [4,5] has led to increased interest in the services provided by the deeper meadows, e.g., [6]. Like shallow seagrass meadows, deep-water seagrass is vulnerable to anthropogenic impacts such as dredging, eutrophication, increased sedimentation [7,8,9,10], and global change impacts such as increasing sea levels and water temperature [11,12,13,14]. However, unlike shallow seagrass meadows, less is known about the ecological importance of deep-water seagrass in the GBRWHA, placing a limitation on our understanding of seagrass habitat function [15].
Shallow inshore seagrass meadows within the GBRWHA provide important habitats for a diverse range of nekton species [16,17,18]. Shallow meadows act as nursery areas, and offer both permanent and temporary habitat for a range of species, including many that are important to commercial fisheries, such as penaeid prawns [2,3,17]. The GBRWHA supports an important penaeid prawn fishery that largely operates in the GBRWHA inter-reef waters, including areas of deep seagrass meadows [4]. However, despite this, there is a paucity of studies investigating deep water seagrass habitats and we have limited knowledge of the nekton fauna of deeper GBRWHA seagrasses.
Elsewhere in the world, studies comparing nekton species of shallow and deep seagrass meadows have found contrasting results [19,20,21,22,23,24]. In some cases, biomass and abundance were found to be higher in shallow seagrass meadows, and species assemblages differed, compared to deeper seagrass meadows [19,21,23,24]. However, there are also several examples of the opposite pattern [20,25,26]. Comparisons of nekton size structure between shallow and deep seagrass meadows have also demonstrated variability. For example, Francour [19] found that fish of smaller size classes were dominant in shallow seagrass, while larger size classes were rare. Conversely, Hutchinson et al. [21] and Smith et al. [23] observed the opposite pattern, with larger individuals found in shallow meadows. This suggests that differences in species composition, biomass, and abundance between shallow and deep seagrass may be influenced by region. In a recent study of food web structure in shallow seagrass meadows of the GBRWHA, Jinks et al. [18] found that shallow meadows had a higher abundance of smaller animals and few larger animals, supporting the earlier work of Francour [19]. Further, Jinks et al. [18] were the first to investigate seagrass communities using size spectra analysis, which is shown to better represent energy transfer through the food web than categorizing species into trophic groups [27]. However, despite the broad geographic spread of sampling, the study by Jinks et al. [18] was focussed on habitat complexity, and no light was shed on the difference of nekton size spectra between shallow and deep meadows.
Seagrass meadows play an important role in connecting marine habitats [28,29]. This includes facilitating the transfer of carbon and nutrients, and the movement of species between seagrass meadows at different depths and nearby habitats in the coastal ecosystem mosaic [23,30,31]. Shallow seagrass can also act as a refuge from predation by larger fish that cannot access shallower depths [32]. Thus, one would expect to find a higher abundance of smaller fish in shallow rather than deeper seagrass meadows. We, therefore, aimed to, (i) compare nekton assemblages in deep and shallow meadows in the GBRWHA, (ii) compare the size structure of nekton using size spectra analysis between shallow and deep seagrass meadows, and (iii) report on the range of socioeconomically important fisheries species present in deep seagrass in the GBRWHA.

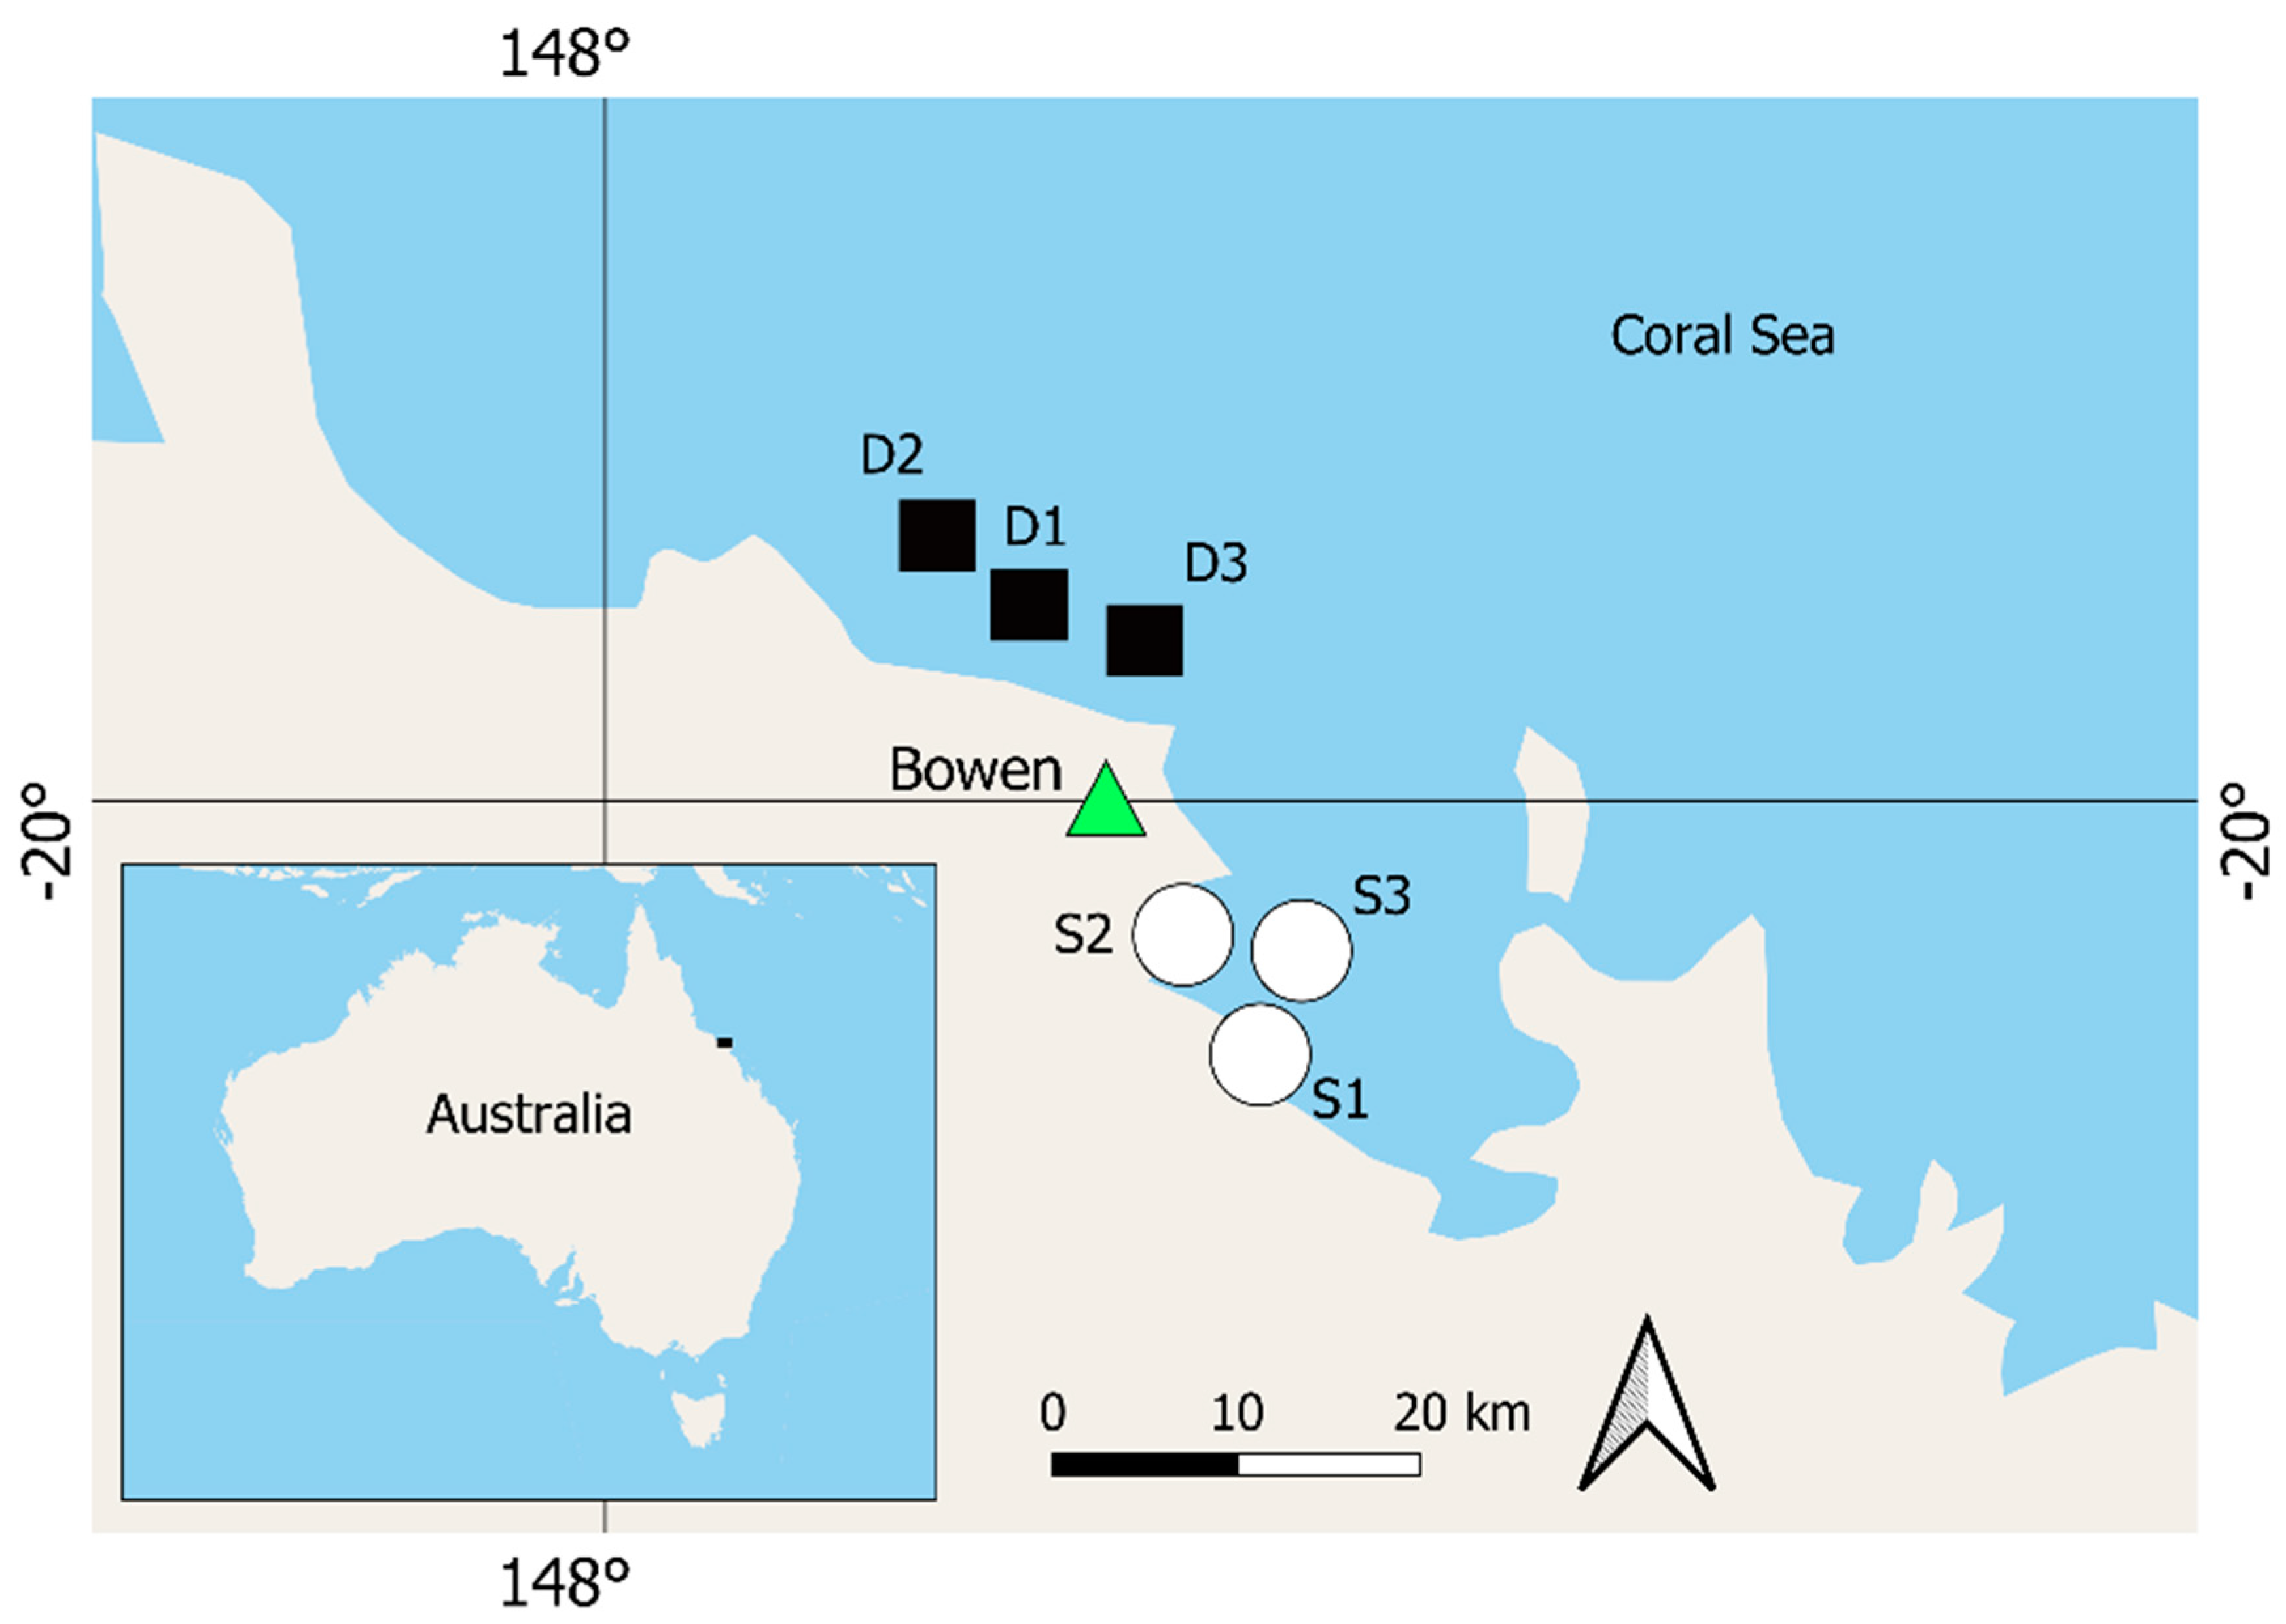
2. Materials and Methods

Our research was conducted over six seagrass meadows of comparable structural complexity within the GBRWHA in the Bowen and Abbot Point coastal region of Queensland, Australia, as seen in Figure 1. Three meadows were shallow (less than 2 m deep at Lowest Astronomical Tide) with Halodule uninervis and Zostera muelleri as the dominant species, and three were deep (greater than 9 m) with Halophila spinulosa as the dominant species. At each seagrass meadow, we collected four seagrass samples using a stainless-steel grab to identify dominant species and to calculate habitat complexity, and performed three trawls to collect fish, cephalopods, and crustaceans (collectively described as “nekton”) to compare aspects of assemblages.

2.1. Seagrass Metrics

Seagrass was sampled in each meadow using a mechanised van Veen grab sampler (surface area = 306 cm2, n = 3; see Table S1 for details of each meadow). Common complexity metrics of aboveground biomass (g DW−1 m−2), canopy height (mm), and leaf area index (m−2; Table S1) were calculated from each sample. Leaf area index (LAI) was calculated as:
L A I = n L   x   µ H   x   µ L W a
where nL is the number of leaves, µH is the mean leaf height, and µLW the mean leaf width within each grab sample.
To account for differences in dominant species, and to reduce the confounding effects of habitat complexity in our study design, we compared seagrass complexity indices [18,33,34] between shallow and deep seagrass meadows, as seen in Table S2. This demonstrated that all meadows, both deep and shallow, had low structural complexity, characterised by low aboveground biomass, short stature, and low leaf area indices. Our comparison, therefore, focused on the remaining differences in habitat, such as variation in species-specific morphology, as well as physical factors such as light and temperature.

2.2. Nekton Sampling

Nekton was sampled by beam trawl (n = 3 in each meadow), with a 2 mm mesh net attached to a 1.5 m width beam, hauled over a distance of approximately 100 m. To maximise trawl catches, we trawled at slow speed (~2 knots), at night, and within two hours of high tide [35]. We chose to use beam trawl for this study, following the same methodology as Jinks et al. [18], as beam trawl has been shown to be an effective method for trawling across seagrass habitats and can be also used consistently across different meadow depths, unlike other common netting techniques, such as seine netting, which would be impractical at deeper depths. All animals were photographed, identified, and counted. Fish were measured for total length, and biomass (reported here as biomass per unit effort; BPUE) was calculated with species-specific length-weight relationship information from fishbase.org [36], while biomass for crustaceans and cephalopods was calculated by weighing each individual animal. Fish were sampled under GBRMPA permit G17/38934.1., Qld DAF permit 202320, and in accordance with Animal Ethics permit (ENV/08/17/AEC).

2.3. Statistical Analysis

We compared differences in nekton diversity (Shannon’s diversity and Shannon’s evenness), total BPUE (g m−2), individual biomass (g ind−1), and catch per unit effort (CPUE; ind m−2) between shallow and deep seagrass meadows using a linear mixed effect model. Depth was a fixed effect (2 levels) and trawl was nested within site as a random effect (three meadows per depth). We used the R statistical base package 3.3.2 (R Foundation for Statistical Computing), using the nlme package for the mixed effects models. The same model was used for a multivariate analysis of nekton assemblages, using permutational multivariate analysis of variance (PERMANOVA) separately on CPUE and BPUE data. Up to 9999 permutations were run in PERMANOVA, after square-root transformation to reduce the contribution of dominant species. Monte Carlo simulations were used to generate p-values when unique permutations were <100 [37]. Percentage similarity (SIMPER) analyses were performed to identify the average similarity within, and the dissimilarity among, seagrass nekton assemblages at deep and shallow depths, in both nekton BPUE and CPUE. Species that consistently contributed to within-group similarity and among-group dissimilarity (high contribution %, and sim- or diss/SD ratio ≥ 2) were identified. PERMANOVA and SIMPER were based on Bray–Curtis dissimilarity matrices and were performed in PRIMER v6 + Permanova [38].

2.4. Size Spectra Analysis

Size spectra analysis describes the relationship between individual body size (as mass) with total species abundance (CPUE) or biomass. Size spectra are expressed as a slope exponent (b) for body mass (M), where b scales with species abundance or biomass in a predictable way [27]. For the size spectra analysis, we analysed abundance and body mass of individuals using a maximum likelihood estimation (MLE) for the slope exponent, b, of the size spectra (Mb) and its associated standard error (SE), following Jinks et al. [18] and Edwards et al. [39]. The MLE technique used in our analysis requires an upper and lower bound size range. Thus, some individuals within our data set identified as being far smaller or larger mass than expected for this sampling method were excluded as outliers from the analysis. The size range for size spectra analysis was, therefore, limited to 0.004–20 g dry weight, which is appropriate for MLE analysis [18,40]. Thus, two individual crabs, Portunus armatus (28.4 and 22.2 g, respectively), were removed from the data prior to analysis. Slope exponents were calculated by pooling within-site trawl data for each meadow.
In a stable, healthy community, the slope exponent in a size-structured community is expected to be more negative than the predicted threshold of b = −0.75, which indicates a higher abundance of smaller sized individuals being preyed upon by a lower abundance of larger sized predators [27]. Slopes less negative than −0.75 indicate a top-heavy community with a higher abundance of larger sized individuals than expected, often signifying the presence of energetic subsidies through inbound movement of organic matter [27,41,42]. In this study, we investigated the difference in size spectra between deep and shallow meadows. We compared slope exponents of shallow and deep meadows using a one-way ANOVA model, with the slope exponent as the response variable and the depth as the independent factor within the model. We used the R statistical base package 3.3.2 (R Foundation for Statistical Computing).

2.5. Determination of Socioeconomic Species

To fulfil our third aim, we compared the distribution of socioeconomically important species across depths. We identified four potential criteria for determining species of socioeconomic importance, commercial fisheries value, aquarium industry value, indigenous cultural fishery, and recreational fishery value (as food stock and sport/catch and release). However, whilst we recognise the importance of cultural fisheries to the indigenous community, insufficient data are available to determine the specific species important to these fisheries. Thus, for the purpose of this study, we focussed only on commercial, aquarium, and recreationally important fisheries.
To identify commercially valuable species, we conducted a search using the Queensland Department of Agriculture and Fisheries database, QFish (accessed October 2019). For this search, we included all listed commercial fishing practices (search terms—bait collection, beam trawl, collection, combination, Danish seine, diving, fish trawling, line, net, other, otter trawl, pot, trap) and included all searchable years from 1990 to 2018. We identified species with aquarium trade value by performing searches of the Australian state and federal fisheries reports [43,44], and by thorough searches of the fishbase.org and fishesofaustralia.net.au websites (accessed October 2019) to identify species for sale within the aquarium trade. Species with a recreational value were identified through the published Queensland legislative size and possession limits. Author discretion was used in a small number of cases where species do not have legislative size or possession limits due to a low demand for these species as table fish. In these cases, we approached recreational fishers for guidance and performed web searches to identify if these species were of recreational value.

3. Results

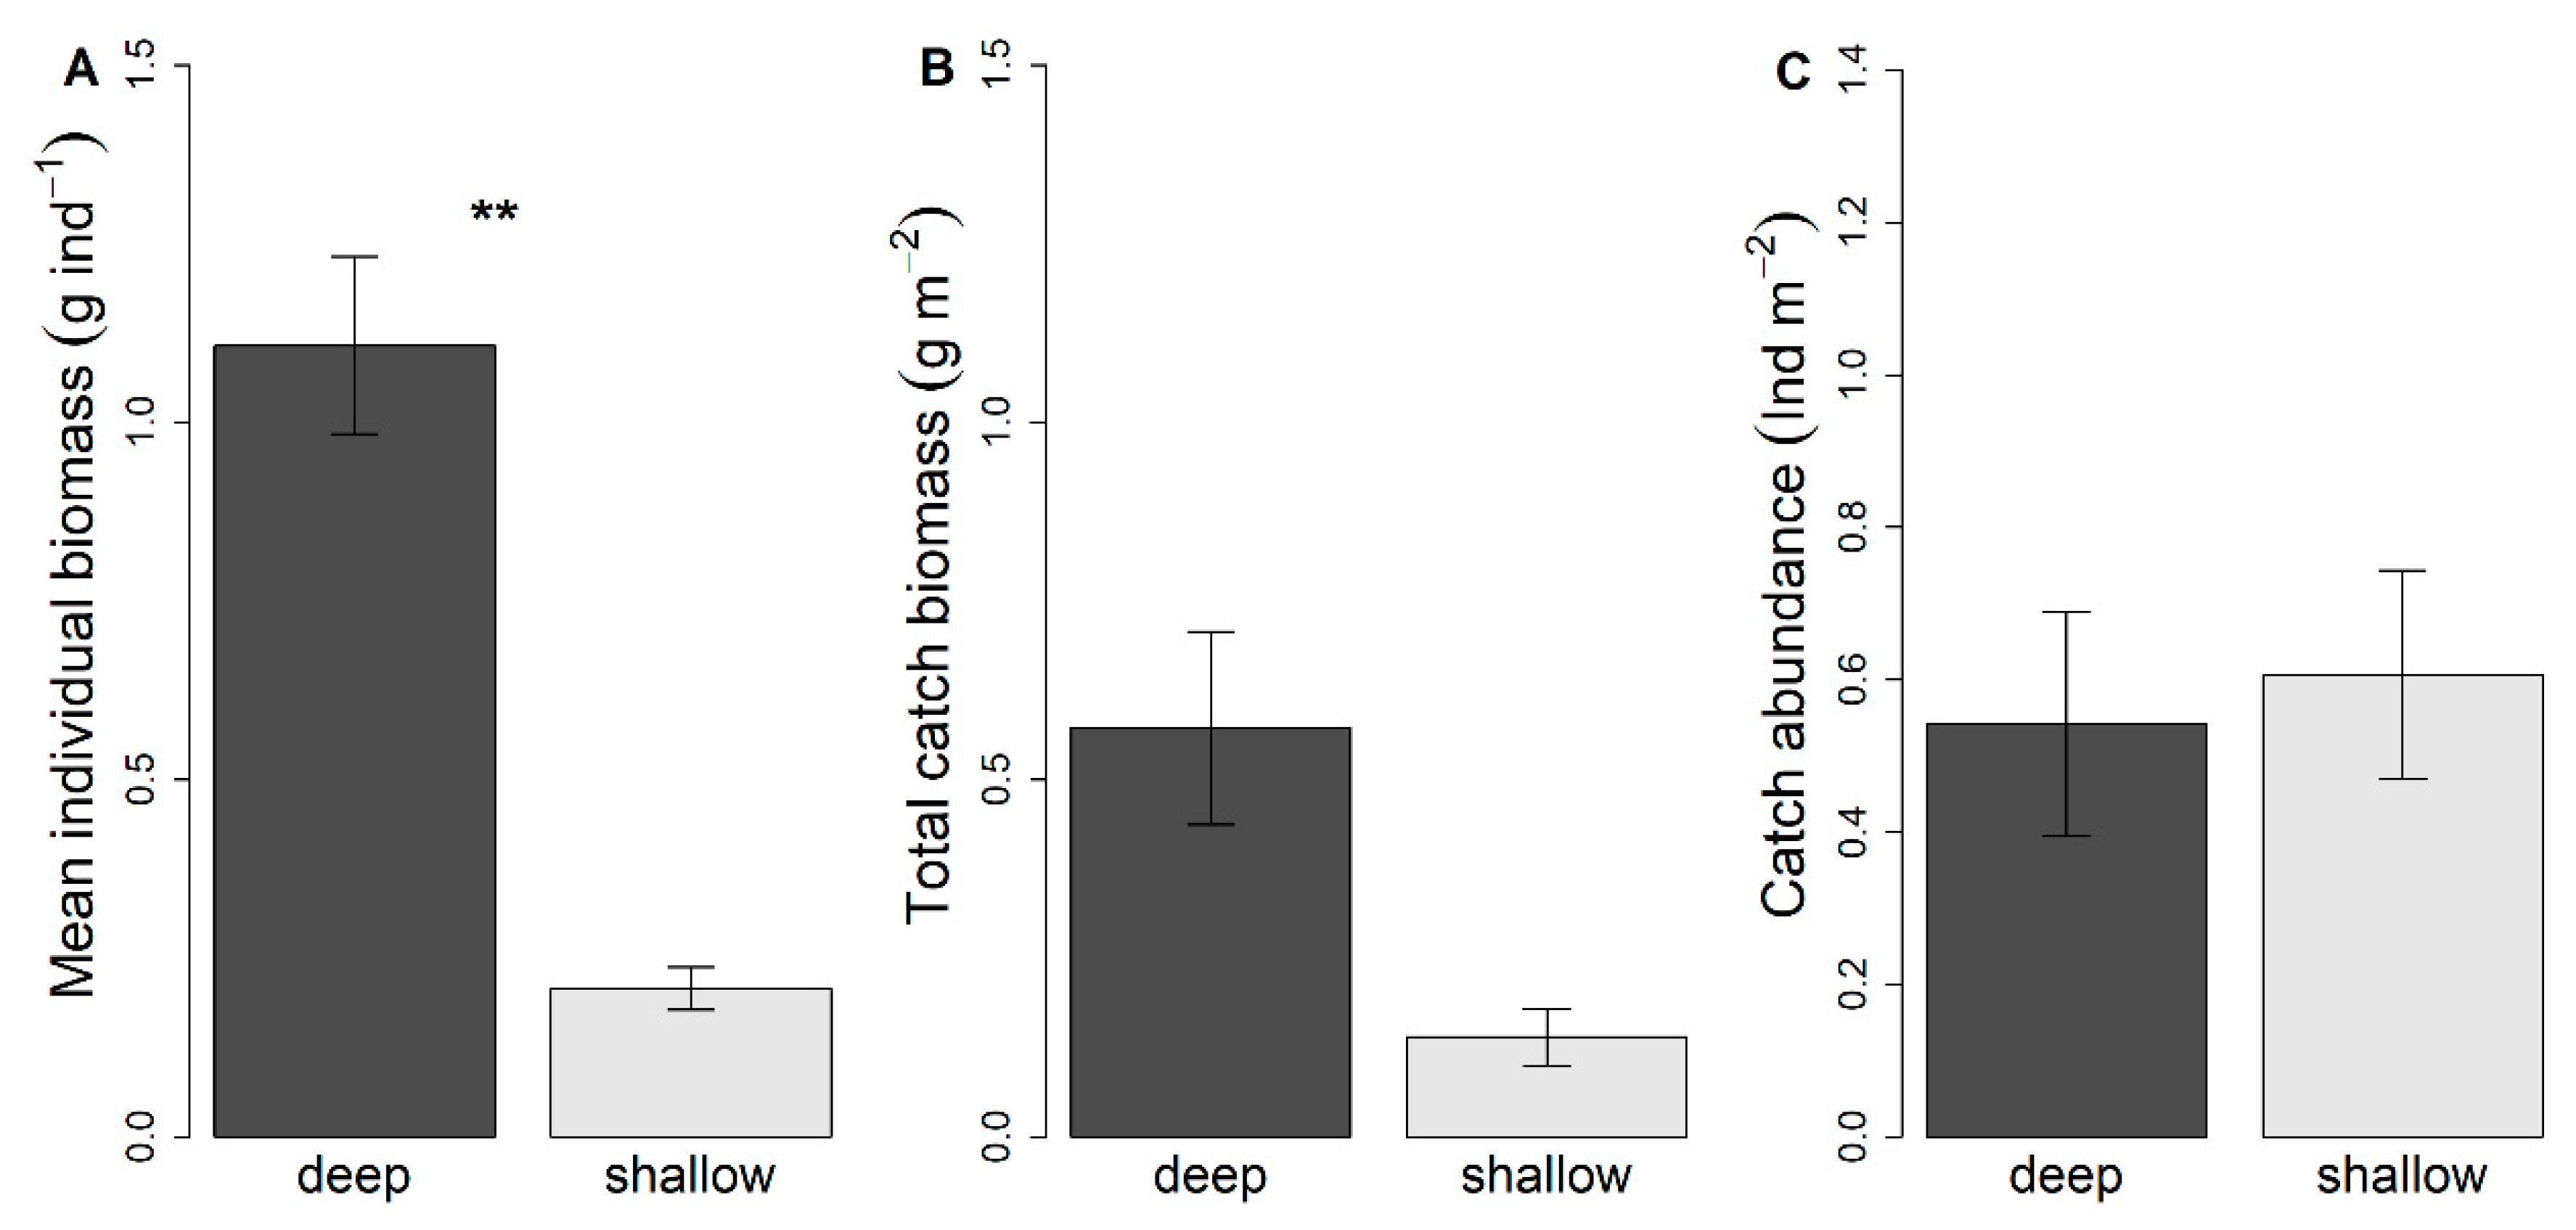
3.1. Effects of Seagrass Meadow Depth on Nekton Species Biomass, CPUE and Diversity

Mean biomass per individual differed between deep and shallow seagrass meadows (F1,4 = 18.62, p = 0.01), with a larger mean individual biomass in deep (1.11 g, 0.12 SE) than shallow (0.21 g, 0.03 SE) meadows, shown in Figure 2. There was also a weak effect on individual biomass (p = 0.06) among meadows, indicating variability in individual biomass among meadows nested within depths (Table S3). Biomass per unit effort (g m−2) was four-fold higher in deep (0.57, 0.13 SE) than shallow (0.13, 0.04 SE) meadows (F1,4 = 4.90, p = 0.09). However, there was no effect of the nested factor ‘meadow’, on BPUE (p = 0.13). Catch per unit effort (individuals m−2) did not vary between depths (F1,4 = 0.14, p = 0.73), with a CPUE of 0.54 (0.15 SE) and 0.61 (0.14 SE) for deep and shallow meadows, respectively, but there was a significant effect of meadow (p = 0.03), indicating that CPUE varied more among meadows within a depth than between the two depths, shown in Table S3. There was no difference in species richness between deep and shallow seagrass meadows (F1,4 = 0.06, p = 0.82), or among meadows within each depth (p = 0.15). Species diversity (Shannon’s diversity) and evenness (Shannon’s evenness) did not vary between deep and shallow meadows (F1,4 = 0.35, p = 0.59 and F1,4 = 0.23, p = 0.65, respectively). However, there was a significant effect of meadow on Shannon’s diversity and Shannon’s evenness (p = 0.05 and p = 0.002, respectively) indicating some variation in diversity and evenness among meadows within each depth, demonstrated in Table S3.

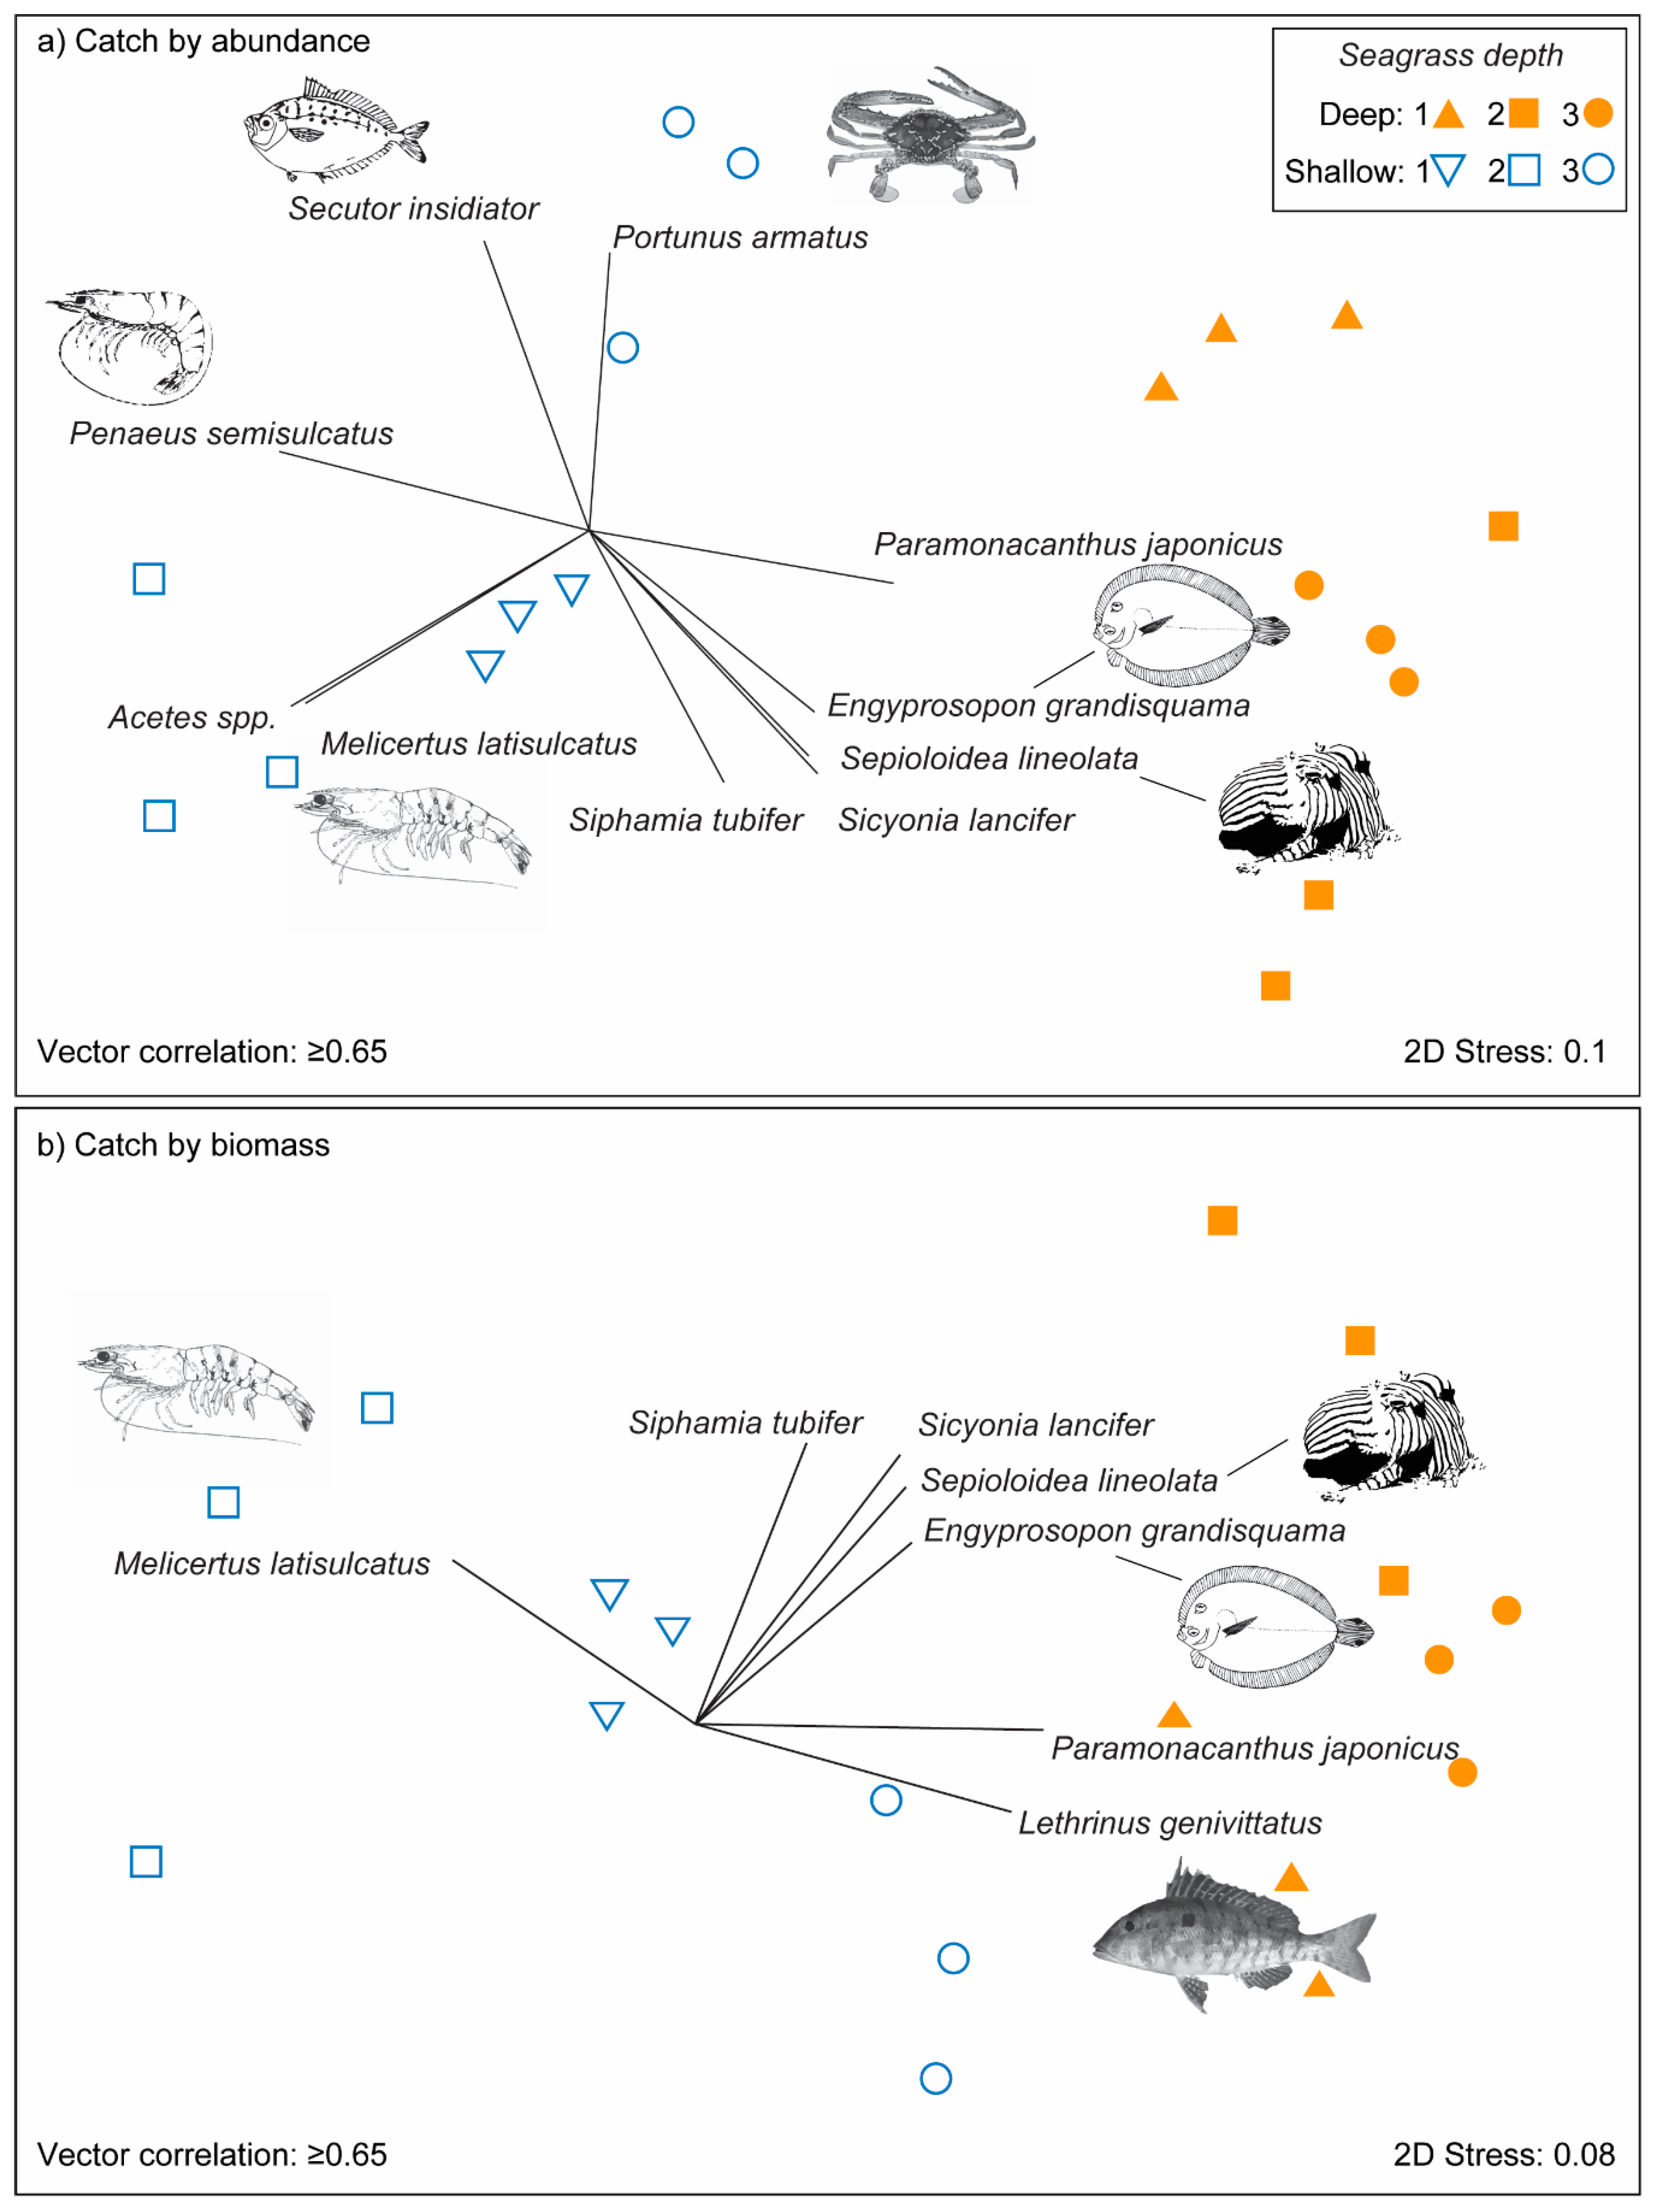
3.2. Effects of Seagrass Meadow Depth on Nekton Assemblages

Nekton assemblage structure differed significantly between deep and shallow seagrass, by CPUE (Pseudo-F = 4.3, p = 0.013; Figure 3a) and BPUE (Pseudo-F = 3.3, p = 0.025; Figure 3b). Nekton assemblage structure also differed significantly among meadows within depths, by CPUE (Pseudo-F = 5.8, p < 0.001; Figure 3a) and BPUE (Pseudo-F = 5.1, p < 0.001; Figure 3b). Species that were typical of deep seagrass meadows by CPUE and BPUE included the hairfinned leatherjacket, Paramonacanthus japonicus; black rabbitfish, Siganus fuscescens; and the threadfin emperor, Lethrinus genivittatus. Species that were typical of shallow seagrass meadows were the pugnose ponyfish, Secutor insidiator, and paste shrimp, Acetes spp. by CPUE, and the green tiger prawn, Penaeus semisulcatus, by CPUE and BPUE, shown in Table 1. P. japonicus consistently contributed to the difference between deep and shallow seagrass, with greater CPUE and BPUE in deep seagrass compared to shallow seagrass (Table 1).

3.3. Size Spectra Analysis

Size spectra slopes (b) were more strongly negative in shallow (−1.67, 0.21 SE) than deep (−1.10, 0.10 SE) meadows (F1,4 = 6.13, p = 0.07; Figure S1). Size spectra slopes for both shallow and deep meadows were more negative than the expected theoretical threshold of M −0.75.

3.4. Socioeconomically Important Fisheries Species

Across all trawls, we identified 54 species from 26 families. We found 39 of these species were of socioeconomic importance (for commercial, aquarium, or recreational use), with 27 species in shallow meadows and 27 species in deep meadows. Fifteen of these species were found at both shallow and deep meadows (e.g., Lethrinus genivittatus and Helotes sexlineatus), and 12 species were found only in either shallow meadows (e.g., Pelates quadrilineatus and Melicertus latisulcatus), or only in deep meadows (e.g., Engyprosopon grandisquama and Monacanthus chinensis; Table S4). However, we found the CPUE of socioeconomically important species was low (<10 individuals) for most species across meadow depths, seen in Table 2. Shallow meadows had more commercial and recreationally important species with a higher CPUE (>10 individuals) than deep meadows, while the opposite pattern was found for aquarium species Table 2.

4. Discussion

The aim of this study was to compare nekton assemblages, including changes in community size structure, in shallow and deep seagrass meadows within the GBRWHA. While previous work has reported on nekton assemblages and size structure within seagrasses of the GBRWHA, e.g., [18], to date, there have been no published studies investigating nekton assemblages of GBRWHA deep seagrass habitats. Thus, the nekton assemblages within deep seagrass habitats, including those of socioeconomic importance to fisheries, remain largely unknown. Here, we found there was a significant difference in the assemblage structure of nekton between deep and shallow seagrass meadows. Furthermore, we found individual nekton were larger in deeper meadows, and that deeper meadows supported a higher biomass, as BPUE, than shallow meadows. We also found a greater abundance of smaller fish, relative to larger fish, in shallow than deep seagrass meadows, in line with previous studies that show that shallow seagrass meadows provide important refuge functions by supporting a larger CPUE of smaller fish, and restricting access to larger predatory species [18,19,32].
Species assemblages were clearly distinct between shallow and deep meadows. We found that shallow seagrass meadows were of particularly high importance to Penaeus semisulcatus (green tiger prawn), an important species in the commercial prawn industry [1,16,17]. Conversely, at deeper seagrass meadows, we found the most abundant species were Paramonacanthus japonicus (hairfinned leatherjacket), which has been identified as being of commercial importance to the aquarium trade [44], and juvenile emperors (e.g., Lethrinus genivittatus), which are of importance to commercial fisheries. However, while there were clear differences in the most abundant species across depths, there were also strong similarities in the distributions of less common, but equally important, species. For example, across both shallow and deep meadows, we identified ten prawn species of importance to the commercial prawn industry, with five of these species identified at both depths (Table S4). Together, our observations reinforce that both deep and shallow seagrass meadows support different nekton assemblages, e.g., [21,23], yet both maintain a diverse assemblage of important ecological and socioeconomic species.
Differences in nekton biomass between shallow and deep seagrass meadows was further demonstrated by the slope of the size spectra, where we observed more negative slopes at shallow seagrass meadows than deep seagrass meadows. More negative slopes, especially those more negative than the expected theoretical threshold of M −0.75, suggest a higher abundance (as CPUE) of smaller sized than larger sized individuals in shallow than deep seagrass meadows, and have been linked to more stable habitats [18,41,42,45]. All meadows in our study were more negative than the theoretical threshold of −0.75, indicating stable communities with a high abundance of smaller individuals across all meadows. The presence of more smaller individuals at shallower seagrass meadows with steeper size spectra slopes than deeper meadows, and the greater abundance of larger-bodied animals in deeper meadows (Figure S1), indicates the importance of shallower habitats for juvenile and small bodied nekton, and supports the concept of shallow seagrass habitats acting as refuge for juvenile and smaller bodied species [32].
Consistent with patterns reported in studies at similar depths, e.g., [19,23], we found individuals were consistently larger (as biomass) in deep than shallow seagrass meadows, resulting in a larger total catch biomass (as BPUE) in deep seagrass meadows. The difference in biomass across depths was driven primarily by the presence of relatively larger fish species at deep seagrass meadows, such as P. japonicus, Siganus fuscescens, and L. genivittatus, in comparison with a higher CPUE of smaller fish and prawn species such as Secutor insidiator, Acetes spp., and P. semisulcatus in shallow seagrass meadows. The occurrence of smaller individuals at shallow depths has been widely attributed to a number of factors, including smaller individuals moving into shallow depths for protection from predators [46], foraging [47], or as a nursery habitat for juveniles [21,48,49].
Shallow seagrass habitats provide additional protection and refuge for smaller individuals while also providing a foraging opportunity for opportunistic predatory species, especially those adapted to access shallow habitats [23,46]. In our study, we found some of the largest species caught in our shallow seagrass meadows were carnivorous species such as the southern reef squid, Sepioteuthis australis, and the fourlined grunter, Pelates quadrillineatus, indicating that predators are accessing shallow seagrass meadows. In deeper seagrass meadows, however, we found the largest carnivorous species in our catch were from species such as the large-spined flathead, Suggrundus macracanthus; the striped pyjama squid, Sepioloidea lineolata; the largescale flounder, Engyprosopon grandisquama; and the threadfin emperor, L. genivittatus. All of these species, except for L. genivittatus, were absent from shallow seagrass habitats. Thus, while predatory fish are found in both shallow and deep meadows, the species found in shallow areas may reflect the adapted ability of a particular species to access shallow waters, or reflect a prey preference for species within the shallower seagrass meadows. Further research is required to investigate the difference in predator-prey interactions across shallow and deep seagrass meadows. Additionally, the scope of our study was limited both spatially and temporally. We recommend further research, with an expanded sampling effort to encompass a broader area of the GBRWHA, and to evaluate potential exploratory factors, such as seasonality and diel patterns in deep-shallow meadow use, and the effect of meadow size and orientation between depths [50].
There was a consistent density of individuals between shallow and deep seagrass meadows in our study meadows. Similarly, species diversity and evenness were also not influenced by seagrass meadow depth. These observations contrast with many other studies investigating the assemblage structure of seagrass associated nekton at different depths. For example, both Heithaus [20] and Bell et al. [25] found that deep seagrass meadows support fish communities with more species and individuals than shallow seagrass meadows, while the opposite pattern has also been reported, where the abundance and species diversity were found to be higher in shallow seagrass meadows compared to deeper seagrass meadows [19,21,23,24]. The difference in results across studies may be due to variation in sampling methods, which differed across all studies, or may also reflect temporal or regional specific effects on nekton communities [20,21,23]. Our study controlled the seagrass complexity between deep and shallow meadows in contrast to other studies where there was likely to be substantial differences in the characteristics of seagrasses between the two depths. To address this, we recommend further studies between shallow and deep seagrass meadows using standardised methodology to ascertain how nekton assemblages vary over seagrass depths at different temporal and geographic locations and with different seagrass assemblages.
Structural complexity is an important attribute of seagrass meadows that can influence their food web structure [18,33]. For example, Jinks et al. [18] found moderately complex meadows had a higher abundance of smaller animals, and fewer larger animals, than either low or higher complexity meadows. In our study, we were primarily interested in understanding how seagrass nekton assemblages differ by depth. We, therefore, chose seagrass meadows of similar structural complexity (i.e., height, biomass, LAI) to avoid any confounding effects. However, although the sampled meadows were structurally similar, their species composition differed, meaning that depth may still be confounded with seagrass species composition. Seagrass growth form influences animal distribution and is dependent on whether the seagrass is being used as a refuge or as a food resource [21,51,52,53]. In our study, deep meadows were dominated by H. spinulosa, which has a growth form (fern-like leaves) that is physically distinct in comparison to the strap-like bladed species that dominated the shallow meadows (Z. muelleri and H. uninervis). Thus, while we account for meadow height, biomass, and LAI within our analysis of habitat structural complexity, we also acknowledge that seagrass species composition may play a confounding role in influencing nekton assemblages between meadow depths. This has broader implications considering that our study is not representative of all seagrass habitats within the GBRWHA. For example, substantial areas of the 31,000 km2 of deep seagrass consist of the sparser and smaller-leaved Halophila decipiens, a species with lower biomass and seasonal occurrence [4,10]. The ephemeral nature of some of these deep meadows also suggests that they are only providing habitat for nekton when they are present and not year-round.
Similarly, the shallow meadows in our study represent only one of the seagrass community types found in the shallows of the GBR. There are a range of different species and growth forms that occur in the shallows of the GBR, some with substantially higher levels of structural complexity to our study [5] that we could reasonably expect to support different densities and species of nekton fauna [16,17]. We recommend future work should investigate nekton assemblages in deep seagrass meadows with different complexity and species composition to establish their role across the GBR more comprehensively.

5. Conclusions

Seagrass meadows are vitally important habitats for a diverse range of fauna, including species that are ecologically and socioeconomically important. Understanding differences in species diversity, abundance, biomass, and size across meadow depths is important to understand the ecological and economic significance of coastal seagrass meadows. Our results indicate that both shallow and deep seagrass meadows support a larger abundance (CPUE) of small bodied individuals, identifying the important roles of both shallow and deep seagrass meadows as a habitat for small species and juvenile of larger species. However, deep seagrass meadows support their own unique assemblages, comprised of distinct ecologically and socioeconomically species. Seagrass habitats are threatened by a range of anthropogenic and climate change impacts. Seagrass loss may lead to a dramatic impact on species assemblages across seagrass meadows, negatively affecting local fisheries. Further research is required on species connectivity across meadow depths to better understand the resilience of species assemblages to loss of habitat.

Supplementary Materials

The following are available online at https://0-www-mdpi-com.brum.beds.ac.uk/1424-2818/12/8/292/s1, Table S1. Seagrass metrics (species, mean canopy height (mm), mean aboveground biomass (g m−2), LAI, and shoot density (m−2)) for each meadow sampled in this study. Table S2. Comparison on seagrass metrics. Table S3. Showing size spectra slope exponent (b), catch per unit effort (CPUE), Shannon’s H and E, total biomass per unit effort (BPUE), and individual biomass across all nekton caught in the study, and by socioeconomically important species only. Table S4. Species and count of individuals caught at each of the three sample locations. Figure S1. Slope of the nekton size spectra (b) for six seagrass meadows calculated using maximum likelihood estimation

Author Contributions

M.A.H., R.M.C., K.I.J. and M.A.R. conceived and designed the experiments. M.A.H., E.C.M., and P.H.Y. performed the experiments. M.A.H. and E.C.M. analysed the data. M.A.R., M.S., and R.M.C. resourced the study. M.A.H. led the writing with contributions from all authors. All authors have read and agreed to the published version of the manuscript.

Funding

Our work was supported by an Australian Research Council Linkage grant LP160100492. RMC was supported by the Global Wetlands Project. KIJ was supported by the Holsworth Wildlife Research Endowment and the Ecological Society of Australia.

Acknowledgments

We kindly thank P. Leeson for field assistance and A. Shand for lab assistance. We also thank J. McClure and H. McClure for providing access to essential equipment and supplies.

Conflicts of Interest

The authors declare no conflict of interest. The funders had no role in the design of the study; in the collection, analyses, or interpretation of data; in the writing of the manuscript, or in the decision to publish the results.

References

  1. Coles, R.G.; Lee Long, W.J.; Helmke, S.A.; Bennett, R.E.; Miller, K.J.; Derbyshire, K.J. Seagrass beds and juvenile prawn and fish nursery grounds: Cairns to Bowen. In Queensland Department of Primary Industries Information Series QI92012; Department of Primary Industries: Cairns, Australia, 1992; p. 64. [Google Scholar]
  2. Coles, R.G.; Lee Long, W.J.; Squire, L.C. Seagrass beds and prawn nursery grounds between Cape York and Cairns. In Queensland Department of Primary Industries Information Series QI85017; Department of Primary Industries: Cairns, Australia, 1985; p. 31. [Google Scholar]
  3. Coles, R.G.; Mellors, J.; Bibby, J.; Squires, B. Seagrass beds and juvenile nursery grounds between Bowen and Water Park Point. In Queensland Department of Primary Industries Information Series QI87021; Department of Primary Industries: Cairns, Australia, 1987; p. 54. [Google Scholar]
  4. Coles, R.; McKenzie, L.; De’Ath, G.; Roelofs, A.; Long, W.L. Spatial distribution of deepwater seagrass in the inter-reef lagoon of the Great Barrier Reef World Heritage Area. Mar. Ecol. Prog. Ser. 2009, 392, 57–68. [Google Scholar] [CrossRef]
  5. Coles, R.G.; Rasheed, M.A.; McKenzie, L.J.; Grech, A.; York, P.H.; Sheaves, M.; McKenna, S.; Bryant, C.; McKenzie, L.J. The Great Barrier Reef World Heritage Area seagrasses: Managing this iconic Australian ecosystem resource for the future. Estuar. Coast. Shelf Sci. 2015, 153, A1–A12. [Google Scholar] [CrossRef]
  6. York, P.H.; Macreadie, P.I.; Rasheed, M.A. Blue Carbon stocks of Great Barrier Reef deep-water seagrasses. Biol. Lett. 2018, 14, 20180529. [Google Scholar] [CrossRef] [Green Version]
  7. Long, W.J.L.; Coles, R.G.; McKenzie, L. Issues for seagrass conservation management in Queensland. Pac. Conserv. Biol. 1999, 5, 321–328. [Google Scholar] [CrossRef]
  8. Rasheed, M.A.; Unsworth, R.K.F. Long-term climate-associated dynamics of a tropical seagrass meadow: Implications for the future. Mar. Ecol. Prog. Ser. 2011, 422, 93–103. [Google Scholar] [CrossRef] [Green Version]
  9. Grech, A.; Chartrand, K.; Erftemeijer, P.; Fonseca, M.; McKenzie, L.; Rasheed, M.A.; Taylor, H.; Coles, R.; McKenzie, L. A comparison of threats, vulnerabilities and management approaches in global seagrass bioregions. Environ. Res. Lett. 2012, 7, 024006. [Google Scholar] [CrossRef]
  10. York, P.H.; Carter, A.B.; Chartrand, K.; Sankey, T.; Wells, L.; Rasheed, M.A. Dynamics of a deep-water seagrass population on the Great Barrier Reef: Annual occurrence and response to a major dredging program. Sci. Rep. 2015, 5, 13167. [Google Scholar] [CrossRef]
  11. Short, F.T.; Neckles, H.A. The effects of global climate change on seagrasses. Aquat. Bot. 1999, 63, 169–196. [Google Scholar] [CrossRef]
  12. Waycott, M.; Collier, C.; McMahon, K.; Ralph, P.J.; McKenzie, L.J.; Udy, J.W.; Grech, A. Vulnerability of seagrasses in the Great Barrier Reef to climate change. In Climate Change and the Great Barrier Reef: A Vulnerability Assessment; Johnson, J.E., Marshall, P.A., Eds.; Great Barrier Reef Marine Park Authority: Townsville, Australia, 2007; pp. 193–236. [Google Scholar]
  13. Saunders, M.I.; Leon, J.X.; Callaghan, D.; Roelfsema, C.M.; Hamylton, S.; Brown, C.J.; Baldock, T.E.; Golshani, A.; Phinn, S.R.; Lovelock, C.E.; et al. Interdependency of tropical marine ecosystems in response to climate change. Nat. Clim. Chang. 2014, 4, 724–729. [Google Scholar] [CrossRef]
  14. Shields, E.C.; Moore, K.A.; Parrish, D.B. Adaptations by zostera marina dominated seagrass meadows in response to water quality and climate forcing. Diversity 2018, 10, 125. [Google Scholar] [CrossRef] [Green Version]
  15. York, P.H.; Smith, T.; Coles, R.; McKenna, S.A.; Connolly, R.M.; Irving, A.; Jackson, E.L.; McMahon, K.; Runcie, J.W.; Sherman, C.D.H.; et al. Identifying knowledge gaps in seagrass research and management: An Australian perspective. Mar. Environ. Res. 2017, 127, 163–172. [Google Scholar] [CrossRef] [PubMed] [Green Version]
  16. Watson, R.A.; Coles, R.; Long, W.L. Simulation estimates of annual yield and landed value for commercial penaeid prawns from a tropical seagrass habitat, Northern Queensland, Australia. Mar. Freshwater Res. 1993, 44, 211–219. [Google Scholar] [CrossRef] [Green Version]
  17. Coles, R.; Long, W.L.; Watson, R.A.; Derbyshire, K. Distribution of seagrasses, and their fish and penaeid prawn communities, in Cairns harbour, a tropical estuary, Northern Queensland, Australia. Mar. Freshwater Res. 1993, 44, 193–210. [Google Scholar] [CrossRef]
  18. Jinks, K.I.; Brown, C.J.; Rasheed, M.A.; Scott, A.L.; Sheaves, M.; York, P.H.; Connolly, R.M. Habitat complexity influences the structure of food webs in Great Barrier Reef seagrass meadows. Ecosphere 2019, 10. [Google Scholar] [CrossRef] [Green Version]
  19. Francour, P. Fish assemblages of posidonia oceanica beds at Port-Cros (France, NW Mediterranean): Assessment of composition and long-term fluctuations by visual census. Mar. Ecol. 1997, 18, 157–173. [Google Scholar] [CrossRef]
  20. Heithaus, M.R. Fish communities of subtropical seagrass meadows and associated habitats in Shark Bay, western Australia. Bull. Mar. Sci. 2004, 75, 79–99. [Google Scholar]
  21. Hutchinson, N.; Jenkins, G.P.; Brown, A.; Smith, T.M. Variation with depth in temperate seagrass-associated fish assemblages in southern Victoria, Australia. Estuaries Coasts 2013, 37, 801–814. [Google Scholar] [CrossRef]
  22. Pogoreutz, C.; Kneer, D.; Litaay, M.; Asmus, H.; Ahnelt, H. The influence of canopy structure and tidal level on fish assemblages in tropical Southeast Asian seagrass meadows. Estuar. Coast. Shelf Sci. 2012, 107, 58–68. [Google Scholar] [CrossRef]
  23. Smith, T.; Jenkins, G.P.; Hutchinson, N. Seagrass edge effects on fish assemblages in deep and shallow habitats. Estuar. Coast. Shelf Sci. 2012, 115, 291–299. [Google Scholar] [CrossRef]
  24. Travers, M.J.; Potter, I.C. Factors influencing the characteristics of fish assemblages in a large subtropical marine embayment. J. Fish. Biol. 2002, 61, 764–784. [Google Scholar] [CrossRef]
  25. Bell, J.D.; Ferrell, D.J.; McNeill, S.E.; Worthington, D.G. Variation in assemblages of fish associated with deep and shallow margins of the seagrass Posidonia australis. Mar. Biol. 1992, 114, 667–676. [Google Scholar] [CrossRef]
  26. Jackson, E.; Attrill, M.; Rowden, A.; Jones, M. Seagrass complexity hierarchies: Influence on fish groups around the coast of Jersey (English Channel). J. Exp. Mar. Biol. Ecol. 2006, 330, 38–54. [Google Scholar] [CrossRef]
  27. Trebilco, R.; Baum, J.K.; Salomon, A.K.; Dulvy, N.K. Ecosystem ecology: Size-based constraints on the pyramids of life. Trends Ecol. Evol. 2013, 28, 423–431. [Google Scholar] [CrossRef]
  28. Perry, D.; Staveley, T.A.; Gullstrom, M. Habitat connectivity of fish in temperate shallow-water seascapes. Front. Mar. Sci. 2018, 4, 440. [Google Scholar] [CrossRef] [Green Version]
  29. Sheaves, M. Nature and consequences of biological connectivity in mangrove systems. Mar. Ecol. Prog. Ser. 2005, 302, 293–305. [Google Scholar] [CrossRef] [Green Version]
  30. Cappo, M.; Kelley, R. Connectivity in the Great Barrier Reef World Heritage Area—An overview of pathways and processes. In Oceanographic Processes of Coral Reefs: Physical and Biological Links in the Great Barrier Reef; Wolanski, E., Ed.; CRC Press: New York, NY, USA, 2000; pp. 161–187. [Google Scholar]
  31. Nagelkerken, I.; Sheaves, M.; Baker, R.; Connolly, R.M. The seascape nursery: A novel spatial approach to identify and manage nurseries for coastal marine fauna. Fish. Fish. 2013, 16, 362–371. [Google Scholar] [CrossRef] [Green Version]
  32. Sheaves, M. Are there really few piscivorous fishes in shallow estuarine habitats? Mar. Ecol. Prog. Ser. 2001, 222, 279–290. [Google Scholar] [CrossRef]
  33. Unsworth, R.K.F.; De Grave, S.; Jompa, J.; Smith, D.J.; Bell, J.J. Faunal relationships with seagrass habitat structure: A case study using shrimp from the Indo-Pacific. Mar. Freshwater Res. 2007, 58, 1008–1018. [Google Scholar] [CrossRef]
  34. Unsworth, R.K.; Taylor, J.D.; Powell, A.; Bell, J.J.; Smith, D.J. The contribution of scarid herbivory to seagrass ecosystem dynamics in the Indo-Pacific. Estuar. Coast. Shelf Sci. 2007, 74, 53–62. [Google Scholar] [CrossRef]
  35. Guest, M.A.; Connolly, R.M.; Loneragan, N.R. Seine nets and beam trawls compared by day and night for sampling fish and crustaceans in shallow seagrass habitat. Fish. Res. 2003, 64, 185–196. [Google Scholar] [CrossRef]
  36. Froese, R.; Pauly, D. Fishbase 2000: Concepts, Design and Data Sources; ICLARM: Laguna, Philippines, 2000; p. 344. [Google Scholar]
  37. Clarke, K.; Gorley, R.; Somerfield, P.; Warwick, R. Change in Marine Communities: An Approach to Statistical Analysis and Interpretation, 3rd ed.; Primer-E Ltd. Plymouth Marine Laboratory: Plymouth, UK, 2014. [Google Scholar]
  38. Anderson, M.; Gorley, R.N.; Clarke, R.K. PERMANOVA+ For PRIMER. Guide to Software and Statistical Methods; Primer-E: Plymouth, UK, 2008. [Google Scholar]
  39. Edwards, A.M.; Robinson, J.P.W.; Plank, M.J.; Baum, J.K.; Blanchard, J.L. Testing and recommending methods for fitting size spectra to data. Methods Ecol. Evol. 2016, 8, 57–67. [Google Scholar] [CrossRef]
  40. White, E.P.; Enquist, B.J.; Green, J.L. On estimating the exponent of power-law frequency distributions. Ecology 2008, 89, 905–912. [Google Scholar] [CrossRef] [PubMed] [Green Version]
  41. Jennings, S.; Mackinson, S. Abundance-body mass relationships in size-structured food webs. Ecol. Lett. 2003, 6, 971–974. [Google Scholar] [CrossRef]
  42. Jennings, S.; Warr, K.J. Smaller predator-prey body size ratios in longer food chains. R. Soc. B Biol. Sci. 2003, 270, 1413–1417. [Google Scholar] [CrossRef] [Green Version]
  43. Roelofs, A. Annual Status Report 2008—Marine Aquarium Fish Fishery; Queensland Department of Primary Industries and Fisheries: Cairns, Australia, 2008. [Google Scholar]
  44. Brayford, H. Northern Territory Aquarium Species. A Guide to Vertebrate Species Harvested by the Northern Territory Aquarium Fishery; The Northern Territory Government, Department of Primary Industry, Fisheries and Mines: Darwin, Australia, 2008. [Google Scholar]
  45. Álvarez-Filip, L.; Gill, J.A.; Dulvy, N.K. Complex reef architecture supports more small-bodied fishes and longer food chains on Caribbean reefs. Ecosphere 2011, 2, 1–17. [Google Scholar] [CrossRef]
  46. Smith, T.; Hindell, J.S.; Jenkins, G.P.; Connolly, R.M.; Keough, M.J. Edge effects in patchy seagrass landscapes: The role of predation in determining fish distribution. J. Exp. Mar. Biol. Ecol. 2011, 399, 8–16. [Google Scholar] [CrossRef]
  47. Jenkins, G.P.; Hamer, P. Spatial variation in the use of seagrass and unvegetated habitats by post-settlement King George whiting (Percoidei: Sillaginidae) in relation to meiofaunal distribution and macrophyte structure. Mar. Ecol. Prog. Ser. 2001, 224, 219–229. [Google Scholar] [CrossRef] [Green Version]
  48. Ford, J.; Williams, R.; Fowler, A.M.; Cox, D.R.; Suthers, I.M. Identifying critical estuarine seagrass habitat for settlement of coastally spawned fish. Mar. Ecol. Prog. Ser. 2010, 408, 181–193. [Google Scholar] [CrossRef]
  49. Jackson, E.; Rowden, A.; Attrill, M.; Bossey, S.J.; Malcolm, B. The importance of seagrass beds as a habitat for fishery species. Oceanogr. Mar. Biol. 2001, 39, 269–304. [Google Scholar]
  50. Connolly, R.M.; Hindell, J.S. Review of nekton patterns and ecological processes in seagrass landscapes. Estuar. Coast. Shelf Sci. 2006, 68, 433–444. [Google Scholar] [CrossRef]
  51. Gullström, M.; Berkström, C.; Öhman, M.C.; Bodin, M.; Dahlberg, M. Scale-dependent patterns of variability of a grazing parrotfish (Leptoscarus vaigiensis) in a tropical seagrass-dominated seascape. Mar. Biol. 2011, 158, 1483–1495. [Google Scholar] [CrossRef]
  52. Gullström, M.; Bodin, M.; Nilsson, P.; Öhman, M. Seagrass structural complexity and landscape configuration as determinants of tropical fish assemblage composition. Mar. Ecol. Prog. Ser. 2008, 363, 241–255. [Google Scholar] [CrossRef] [Green Version]
  53. Kendrick, A.; Hyndes, G.A. Patterns in the abundance and size-distribution of syngnathid fishes among habitats in a seagrass-dominated marine environment. Estuar. Coast. Shelf Sci. 2003, 57, 631–640. [Google Scholar] [CrossRef]
Figure 1. Map showing locations for each trawl site at deep (D; black squares) and shallow (S; white circles) seagrass meadows within The Great Barrier Reef World Heritage Area, Queensland, Australia.
Diversity 12 00292 g001
Figure 2. Nekton individual biomass, total biomass per unit effort (BPUE) and catch per unit effort (CPUE) comparisons between deep and shallow meadows. Changes in: (A) individual biomass (g ind−1), (B) total catch BPUE (g m−2), and (C) CPUE (ind m−2). Individual biomass differed significantly between depths (p = 0.01), indicated by ** on Panel A.
Diversity 12 00292 g002
Figure 3. Non-metric multidimensional scaling showing differences in nekton assemblage structure of deep and shallow seagrass meadows in (a) catch per unit effort (CPUE) and (b) biomass per unit effort (BPUE), based on trawl haul data (points). Vectors represent partial regression coefficients of the original variables within 2 dimensions. Vector length is proportional to strength of correlation.
Diversity 12 00292 g003
Table 1. Details of percentage similarity (SIMPER) analyses for Group depth (Deep vs. Shallow) identified as being significantly different. Fish species by catch per unit effort (CPUE) and biomass per unit effort (BPUE), which contribute to the similarity within and dissimilarity among each group, are given. Similarity (SIM/SD) or dissimilarity (DISS/SD) ≥ 2 indicates consistency of a species contribution amongst samples (trawls); Contrib. % is the percent contribution of a species to the Groups average similarity (Av. Sim.)/dissimilarity (Av. Diss.); Cum.% is the cumulative percent contribution of multiple species to Group Av. Sim.
SimilarityGroupGroup Av. Sim.SpeciesSim/SDContrib.%Cum.%
CPUEDeep52.0Paramonacanthus japonicus4.626.526.5
Siganus fuscescens1.722.448.9
Lethrinus genivittatus3.818.867.8
CPUEShallow47.9Secutor insidiator1.722.522.5
Acetes spp.1.819.041.5
Penaeus semisulcatus2.415.056.5
BPUEDeep46.9Paramonacanthus japonicus4.825.825.8
Siganus fuscescens1.719.445.3
Lethrinus genivittatus5.014.059.2
BPUEShallow37.6Penaeus semisulcatus2.318.618.6
Secutor insidiator1.515.233.8
DissimilarityGroupGroup Av. Diss.SpeciesDiss/SDContrib.%Cum.%
CPUEDeep-Shallow75.5Secutor insidiator1.414.414.4
Paramonacanthus japonicus2.99.924.2
BPUEDeep-Shallow79.9Paramonacanthus japonicus3.111.511.5
Table 2. Socioeconomically important fisheries species in deep and shallow seagrass in the Great Barrier Reef World Heritage Area. Values are numbers of species, shown as common (>10 individuals at that depth) and rare (<10 individuals at that depth) and percent of species for each depth. Species can be in the >1 fishery sector.
DeepShallow
CommercialRecreationalAquariumCommercialRecreationalAquarium
Number of speciesCommon414732
Rare1411915138
Percentage of speciesCommon14.8%3.7%14.8%24.1%10.3%6.9%
Rare51.9%40.7%33.3%51.7%44.8%27.6%

