Article

Do Anthropogenic Activities Affect Floristic Diversity and Vegetation Structure More Than Natural Soil Properties in Hyper-Arid Desert Environments?

by
Ethar A. Hussein
1,
Monier M. Abd El-Ghani
2,*,
Rim S. Hamdy
2 and
Lamiaa F. Shalabi
1
1
Department of Biological and Geological Sciences, Faculty of Education, Ain Shams University, Cairo 11757, Egypt
2
Department of Botany and Microbiology, Faculty of Science, Cairo University, Giza 12613, Egypt
*
Author to whom correspondence should be addressed.
Submission received: 10 February 2021 / Revised: 26 March 2021 / Accepted: 29 March 2021 / Published: 6 April 2021
(This article belongs to the Section Plant Diversity)

Abstract

:
Egypt is characterized by its hyper-arid desert environment with high temperature, scanty rainfall, high evapotranspiration rate, and patchy scattered precipitation-dependent vegetation. Located in this peculiar ecosystem, the northeastern part of the eastern desert occupies vast areas where this study was conducted. Despite some protection in this area, destruction of plant cover, soil erosion, and degradation of natural habitat are still occurring. Among the complex array of anthropogenic disturbances that directly affect species diversity, over-grazing, road construction, over-collection of plants, salinization, over-cutting, military activities, urbanization, and industrialization were encountered. The aim of this study was to assess the effect on long-lasting anthropopressure on the current floristic and ecological status of the unprotected area in comparison to the protected one. Two areas were chosen for detailed studies: protected (Wadi Degla; WD) and unprotected (Cairo-Suez road, SR). Fourteen soil variables were used to assess the soil–vegetation relationships in the two areas. An assessment of seven human activities (over-grazing, over-collection, introduced species, land degradation, urbanization, solid wastes, and military activities) was carried out at four levels of disturbance intensities. A floristic presence/absence data set of 25 plots × 56 species, including 14 plots for SR and 11 plots for WD, was employed in the analyses. The application of multivariate analysis techniques such as cluster analysis (for classification), indicator species analysis (ISA) and the multi-response permutation procedure (MRPP), canonical correspondence analysis (CCA), and redundancy analysis (RDA) for ordination were performed in the data analysis. Generally, a total of 85 plant species belonging to 68 genera and 30 families was recorded. Asteraceae, Chenopodiaceae, Fabaceae, Zygophyllaceae, Poaceae, Brassicaceae, and Geraniaceae were the largest families, constituting more than 50% of the total flora. Chamaephytes, therophytes, hemicryptophytes, and phanerophytes prevail in the life form spectrum. Chorological analysis showed that the Saharo-Arabian element, whether pure or combined with other chorotypes, dominated the current flora, whereas the Mediterranean chorotype was very poorly represented. Application of cluster analysis yielded eight vegetation groups: I–IV for the Cairo-Suez road, and V–VIII for Wadi Degla. This study indicated the disappearance of several plant communities that were previously of common occurrence such as Retama raetam, Anabasis articulata, Ephedra alata, Artemisia monosperma, Zygophyllum decumbens, Lasiurus hirsutus, and Panicum turgidum. Partial CCA (pCCA) for the unprotected area revealed that most of the variance (45.7%) was attributed to the anthropogenic variables more than soil factors (14.5%). Like what was revealed in other unprotected areas, a clear relationship between anthropogenic pressure and habitat fragmentation was observed. Long-term, intensive human activities caused vegetation degradation, species loss, and a decline in plant richness. Hence, the highest species richness value was recorded in the protected area. Over-grazing, land degradation, and military activities were not correlated with the diversity indices, whereas over-collection of plant species, urbanization, and solid wastes were significantly negatively correlated with both α-diversity and the Shannon–Wiener index. Suitable protection measures should be taken to reduce the anthropogenic pressures in this ecosystem as well as some conservation programs and management plans should be implemented to save biodiversity.

1. Introduction

More than 25% of the world’s population will be directly affected by land degradation through external stresses such as climate change and human disturbances [1]. In arid and semi-arid environments, anthropogenic activities such as urbanization, industrialization, over-grazing, salinization, solid wastes, military activities, over-cutting of woody plants, road construction, and establishing new settlements are the main drivers of change, transformation, and loss of natural habitats; decline in floristic composition; and dramatic changes in vegetation structure [2,3,4,5].Enright et al. [6] inferred the spatial distribution patterns of plant communities and species diversity in desert environments to three main factors: physical environmental variables affecting water availability, soil chemistry, and anthropogenic disturbance. Besides the harsh environmental conditions that prevail in the desert, such as high temperatures, erratic precipitation, high evaporation rate, low fertility of soil, and high winds [7], its slow recovery and rehabilitation after disturbances are anticipated. Hence, once the human impacts on the natural environment decline, the process of recovery becomes more possible [8,9]. Anthropogenic disturbances critically affect the biodiversity and the structural characteristics of the community [10,11]. Studies on the impacts of anthropogenic activities on the floristic composition and vegetation were undertaken in Chile [8], Poland [9], Kuwait [10], and Tunisia [11]. Preservation and maintenance of such valuable natural or semi-natural ecosystems were undertaken, for example, in the arid pseudo-savanna of Acacia tortilis subsp. raddiana in Tunisia where after 13 years of its protection against human activities, an increase in the total cover of 58.3%, 21.7% in plant density, 7% in species richness, and 9.5% in species diversity were observed [12]. In addition, after 30 years of protection in Thumamah National Park of Saudi Arabia [13], recreational and grazing activities were minimized, and the plant species diversity was increased. For this reason, protected areas (PAs) were established to conserve biological diversity in the natural habitats and maintain the ecological integrity of ecosystems. Due to global climate change, several parts of this ecosystem were recently subjected to continuous desertification and land degradation, which directly affect the total plant cover and species diversity [14]. In Egypt, protected areas have been expanded over the past three decades in both number and area [15]. By 2013, 30 protected areas were established, covering about 146,000 km2 or about 15% of the total surface area, which is about one million km2 [15].
The combined variations in topography, physiography, and geography, together with different aspects of other anthropogenic activities, were significantly affecting the floristic composition of the natural vegetation along roadsides [16]. Its role in the destruction of the existing habitats and creating new ones with special characteristics is well documented [17,18,19].
The desert ecosystem occupies approximately 95% of Egypt’s total area [4]. This ecosystem has unique and characteristic xerophytic vegetation that sustains the human population with essential goods and services [10]. Despite these benefits, threats to its species and habitats have been recorded in recent history [19]. All threats are caused by human mismanagement for biological resources in addition to the aridity of the climate [14]. Desert degradation and fragmentation caused by human misuse and severe environmental changes are one of the major causes of decline in global biodiversity and have become a critical environmental problem [14]. Therefore, in many areas, reconstruction of disturbed ecosystems is being taken up on a priority basis for biodiversity conservation and maintaining landscape productivity [20].
The Egyptian desert represents the most eastern part of the Sahara, the world’s largest desert. Kassas and Batanouny [21] delineated three zones of arid environments: hyper-arid, arid, and semiarid; the former constitutes 4.2% of the total world’s land area. Apart from a few scattered shrubs, the hyper-arid zone includes dryland areas without vegetation. Precipitation is low (<100 mm−1), infrequent, irregular, and unpredictable in both space and time, and sometimes rainless for several years [19]. According to Abd El-Ghani et al. [22], the Eastern Desert of Egypt is defined as hyper-arid, with a mean annual rainfall of less than 30 mm and long dry periods. Rainfall is not the only factor influencing the vegetation, but topography, soil variables, temperature, and human disturbances are also important [22]. Topographically, three major types of habitats can be recognized: open desert habitat, mountain habitat, and wadi habitat, in addition to small patchy and scattered habitats in the oases and salt marshes [23]. Different arrays of floristic and ecological investigations (phytogeographical affinities, correlations between diverse edaphic factors, vegetation analysis, and species diversity) in various microhabitats using multivariate analysis techniques were achieved in the arid desert of Egypt [22,24], Saudi Arabia [25], Negev Desert of Israel [26], China [27], Pakistan [28], Sonoran Desert of the USA [29], and Iran [30]. The application of advanced multivariate statistical techniques in vegetation–environment studies is important to obtain a real picture of the available plant resources in any area. Such studies play a paramount role in the development of future conservation and management plans.
A “wadi” designates a dried riverbed in a desert area that may be transformed into a temporary water course after heavy rain. It represents one of the main ecosystems in deserts with physical and biological features including a characteristic plant cover. It has the great merit of being a drainage system, collecting water from an extensive catchment area. The water supply of a wadi is many times the recorded rainfall [31]. The richness of wadi vegetation is attributed to the amount of water percolating the soil, forming ground water [32]. This advantage is counterbalanced by two destructive agencies: torrents and grazing. Few studies on human impacts to the biotic and physical components of the Egyptian desert have been conducted [33,34]. Understanding disturbance effects on species diversity is fundamental to conservation planning [35]. Assessments of plant diversity and vegetation composition of fragmented habitats are necessary for understanding the impacts of human disturbance and the vulnerability of desert habitats to habitat fragmentation.
We hypothesize that vegetation structure and floristic diversity in the unprotected desert wadis are drivers of prolonged uncontrolled human activities, and that protected areas harbor more species. A correlation between anthropogenic activities and species richness is expected. Therefore, this work was aimed at studying the current status of floristic and vegetation composition along the Cairo-Suez road (SR), as a part of the Eastern Egyptian Desert as an unprotected area, and compared the resulting data with those of the protected area of Wadi Degla (WD). The main objectives were (1) to recognize the actual vegetation diversity in this desert ecosystem, (2) to determine the relationships between vegetation diversity and soil and anthropogenic factors, (3) to assess the floristic similarities between protected and unprotected areas, (4) to record the reasons for the vegetation changes, and (5) to suggest some recommendations to improve/save the present vegetation status.

2. Materials and Methods

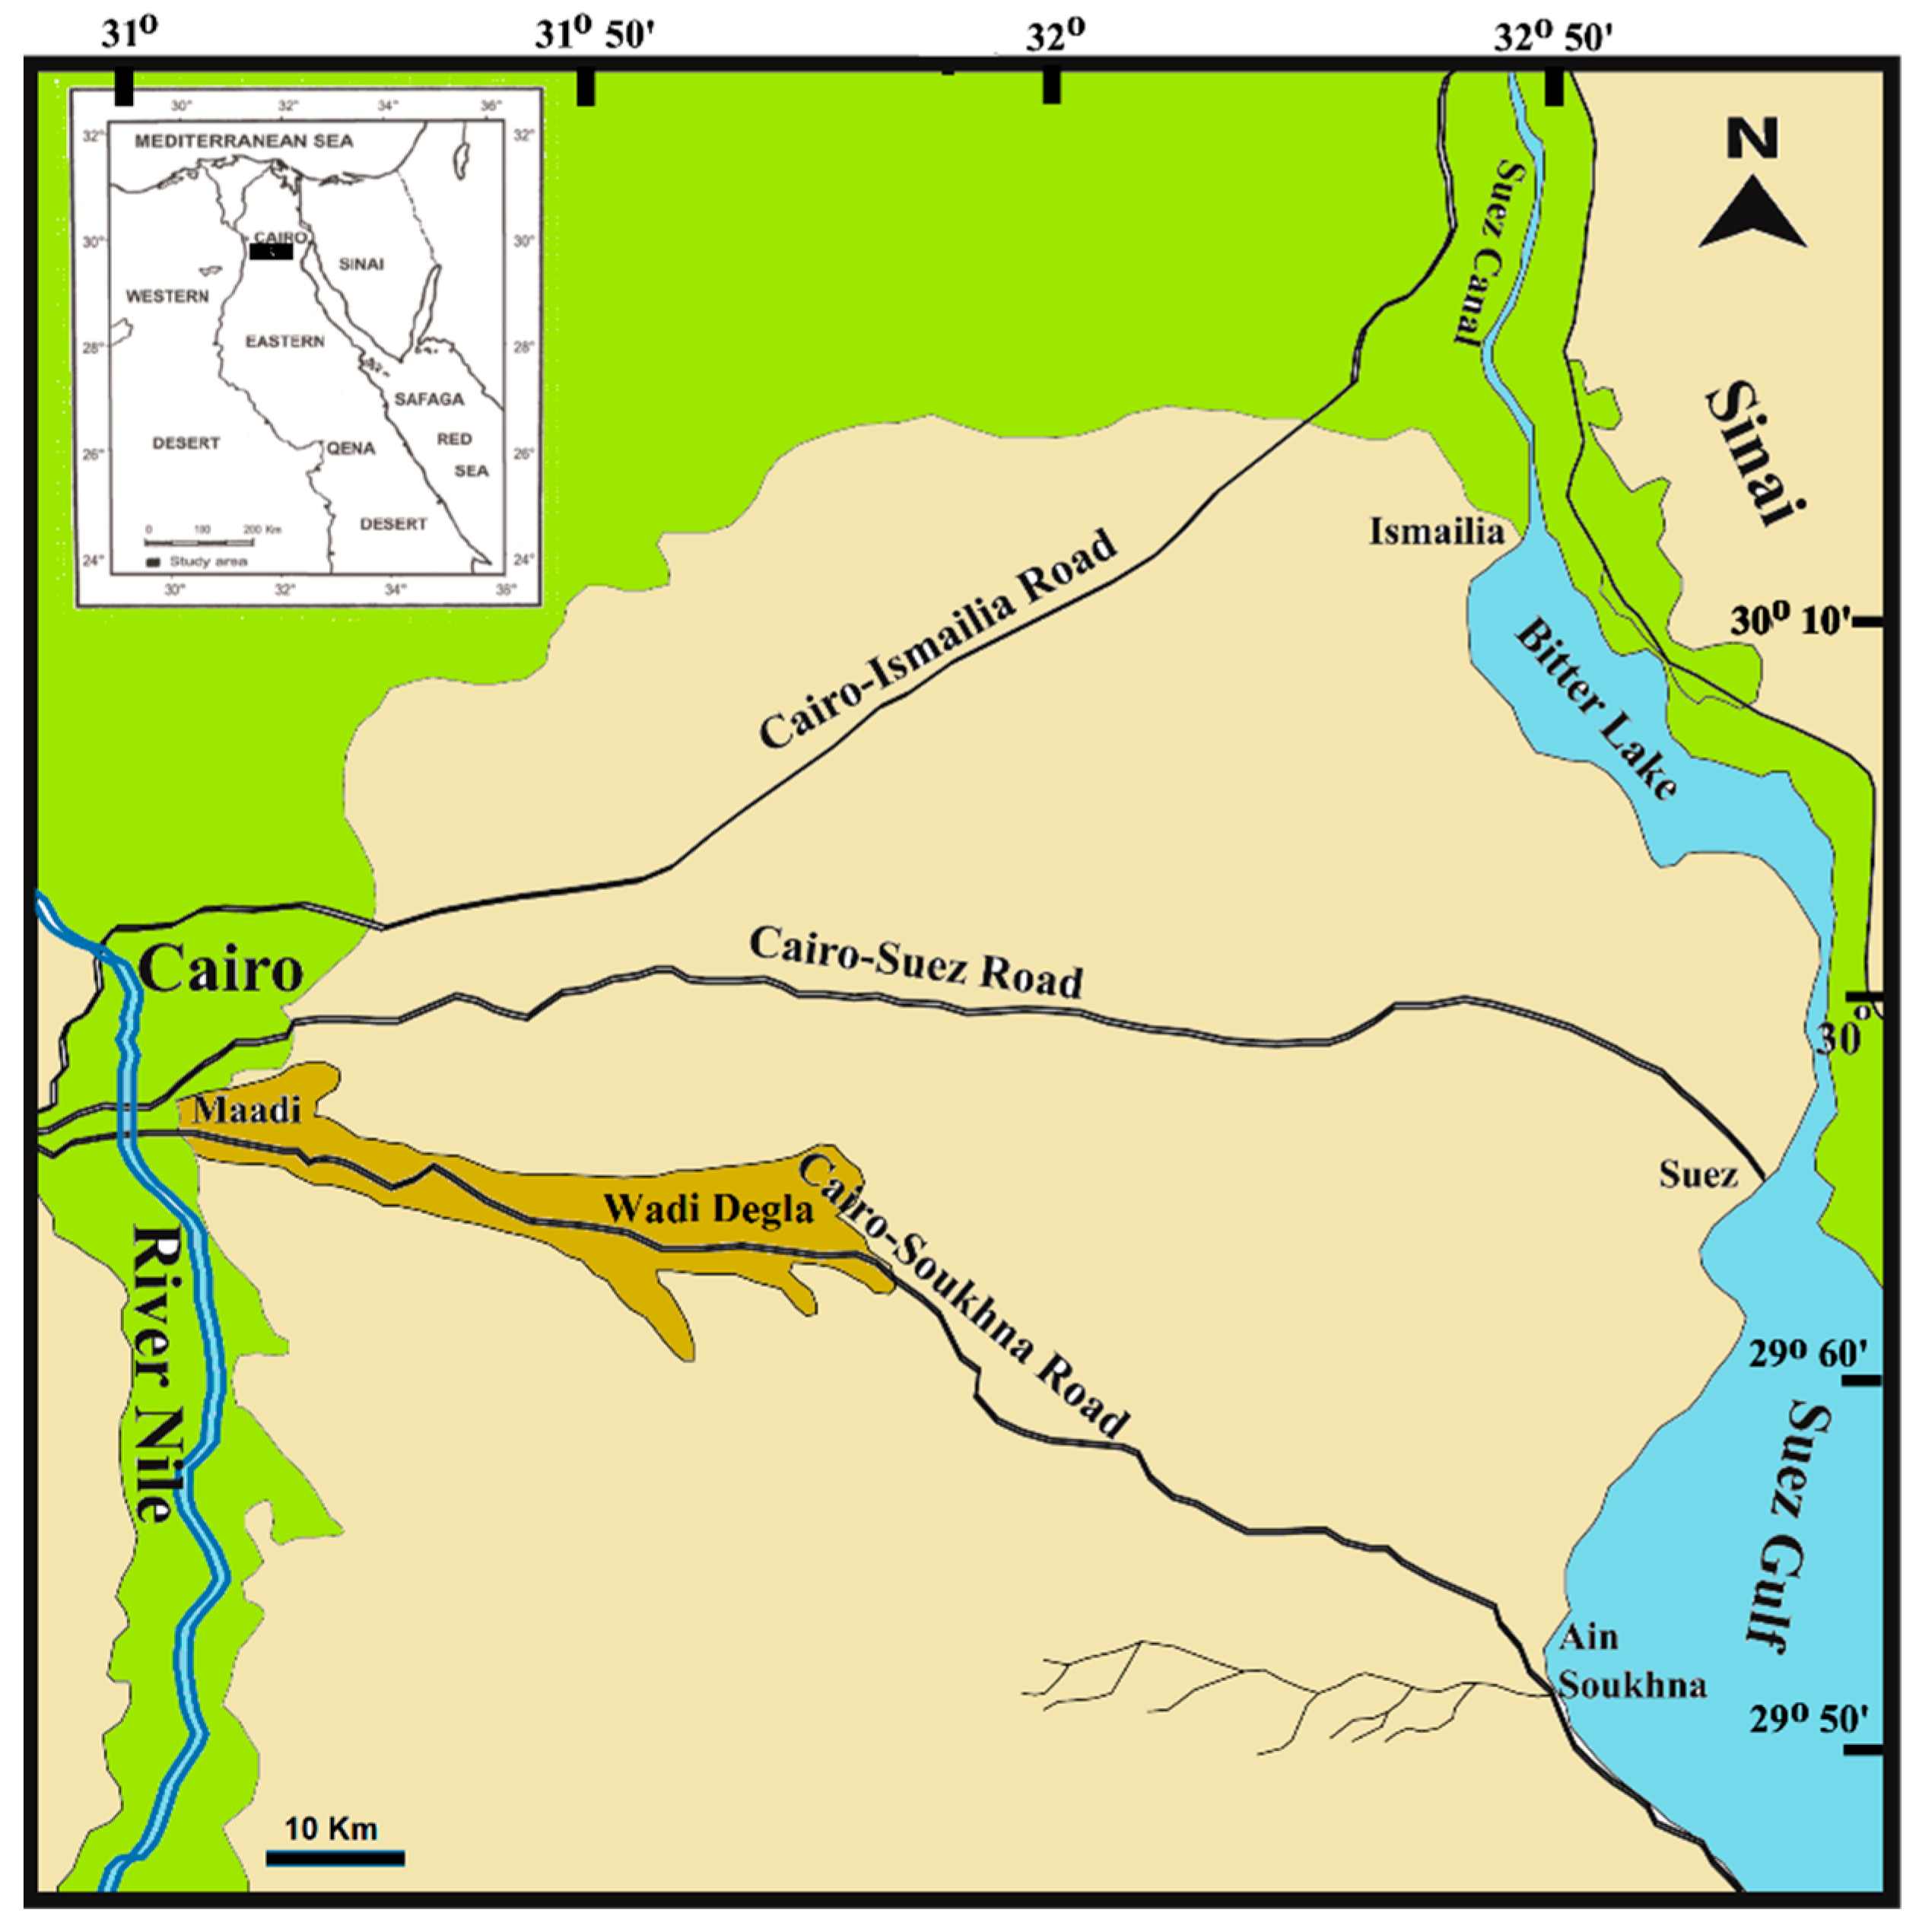
2.1. The Study Areas

Two areas were chosen for the present study: (1) the Cairo-Suez desert road represented the unprotected area (SR), and (2) Wadi Degla represented the protected area (WD). The former (SR) is located between Cairo and Suez cities, extending for about 125 km and bounded by longitudes 31°13′–32°50′ E and latitudes 29°06′–30°02′ N. It lies within the northern section of the Eastern Desert of Egypt, east of the Nile Delta (Figure 1). To the south, it is bounded by the fringe of the limestone plateau of the Eastern Desert (lat. 30° N) and to the north by fringes of the cultivated land of the Ismailia irrigation canal. Detailed studies on the geology, geomorphology, topography, and lithology have been described and documented [36,37,38].
Located in the Cairo metropolitan area and in the northern part of the Eastern Desert of Egypt, Wadi Degla (WD; 31°19′ to 31°37′ E and 29°53′ to 29°57′ N) is one among six geological protected areas of Egypt. In 1999, 15 km of the 30 km-long wadi and 60 km2 of its adjoining areas were declared protected areas [39]. This wadi passes through the limestone rocks that remained in the marine environment during the Pleistocene and formed the so-called Canyon Degla, which resembles the Grand Canyon in the USA [40,41].
The climate of this desert is classified as the Saharan-Mediterranean type by Emberger [42] and lies within the hyper-arid desert climate with very low rainfall, high temperature, and high evaporation rate. In the northern coastal parts of this desert, rainfall may reach 30 mm, whereas its southern part is usually known as the rainless part of the globe [22,38]. According to the climatic averages (2007–2016) at Katameya Meteorological Station (the nearest station to the Cairo-Suez road), the mean annual air temperature was 21.2 °C; the average minimum monthly temperature was 18.4 °C in January and 35.2 °C in August. Rainfall occurred in the winter months with an annual average rainfall of 2.1 mm. According to the available climatic records of Wadi Degla for 2016 and 2017 (Helwan Meteorological Station), the mean maximum temperature varied between 18.8 °C in January and 35.3 °C in July, and the mean minimum temperature ranged from 8.6 °C in January and 21.8 °C in August. The average of rainfall was low and amounted to 6.7 mm.

2.2. Data Collection and Floristic Analysis

The field work was conducted between February 2016 and March 2017 along the Cairo-Suez desert road (SR) and Wadi Degla protected area (WD). A total of 25 sampled plots were established (14 along the Cairo-Suez road and 11 in the Wadi Degla protected area) to detect a wide spectrum of vegetation as well as the effect of anthropogenic activity. This was applied to perform comparisons of protected and open unprotected desert areas. In each plot (20m × 20m), the presence or absence of each species was recorded and their frequencies (f%) were calculated.
Human disturbance data were visually estimated for each of the sample plots. Each species was designated to one, usually the most notable, of the seven observed anthropogenic attributes included: over-grazing (OG), over-collection (OC), introduced species (IS; i.e., alien weeds escaped from cultivation), land degradation (LD), urbanization (UR), solid wastes (SW), and military activities (MA). The assessment of human activities was carried out at four levels [43]. Therefore, in each sample plot, 4 visually estimated levels of disturbance intensities were used: 0 = absent, 1 = low, 2 = moderate, and 3 = high. Voucher specimens for each species were collected and identified at the herbarium of Cairo University (CAI). Taxonomic nomenclature was according to Boulos [44,45,46,47,48,49]. The plant life-form categories were identified according to Raunkiaer’s system of classification [50], where it displays an obvious relationship to key environmental factors and provides the basic structural components of vegetation.

2.3. Soil Sampling and Analysis

For each sampled plot, three soil samples were collected in the dry season from profiles of 0–60 cm depth, pooled together to form one composite sample, air-dried, thoroughly mixed and passed through a 2 mm sieve to remove gravel and debris, then packed in paper bags in order to conduct further analyses. Soil texture was determined with the pipette method [51], providing quantitative data on the percent of sand, silt, and clay. Soil–water extract (1:5) w/v was prepared for the determination of electrical conductivity (EC; mS cm−1) using a conductivity meter (Model Corning, Thermo Fisher Scientific, Waltham, MA, USA) and pH using a pH meter (Model Lutron pH 206, Lutron, Harrisburg, PA, USA), whereas the estimation of chlorides was carried out by titration methods using 0.05 N AgNO3 [52]. Carbonates and bicarbonates were determined by titration against 0.1 N HCl [53]. Contents of sulfates were determined by a turbidimetric technique with barium chloride and acidic sodium chloride solution using a spectrophotometer (Model 1200), and organic matter content (OM) was determined in the soil by the dichromate oxidation method [51]. Calcium and magnesium contents were determined volumetrically by the titration method using 0.01 N EDTA [54]. Sodium and potassium contents were determined by a flame photometer (Model Carl-Zeiss DR LANGE M7D, Carl-Zeiss AG, Jena, Germany).

2.4. Vegetation Data Analysis

After the removal of species occurred in one sample plot (singletons), a floristic presence/absence data set of 25 plots × 56 species, including 14 plots for the Cairo-Suez road (SR) and 11 plots for the Wadi Degla protected area (WD), was subjected to classification by cluster analysis with the software PC-Ord version 5 for Windows [55] using a squared Euclidean distance dissimilarity matrix with minimum variance (also called Ward’s method) as the agglomeration criterion [56]. The significant differences among cluster groups were applied using the multi-response permutation procedure (MRPP) with the Sørensen (Bray–Curtis) distance measure on a matrix of 14 soil variables (sand, silt, clay, OM, pH, EC, Na, K, Ca, Mg, Cl, HCO3, CO3, and SO4,), and two statistical tests were calculated. The significance of the null hypothesis of no differences among groups was assessed by a Monte Carlo permutation procedure with 4999 permutations. An indicator species analysis (ISA) [57] was used to identify species that distinguished vegetation groups, and a Monte Carlo test was used to evaluate the statistical significance of the maximum indicator value recorded for a given species. Both the MRPP and ISA tests were performed using PC-Ord version 5 for Windows [55].
The computer program CANOCO version 4.5 [58] was used for all ordination analyses, whereas the computer program SPSS version 10.0 [59] was used for all the statistical treatments. Detrended correspondence analysis (DCA) was used to identify the main gradients that influenced species distribution [60]. In the present study, DCA estimated the compositional gradient in the vegetation data of the Wadi Degla protected area as 2.12 SD units for the first axis, whereas for the Cairo-Suez road it was 3.21 SD units for the first axis. Thus, redundancy analysis (RDA) was the appropriate ordination method to perform direct gradient analysis for the former, and canonical correspondence analysis (CCA) for the latter [58,61,62,63].
Before analysis, soil variables shown in percentages (sand, silt, clay, and OM) were transformed to their arcsines, and appropriate transformations for other soil variables were applied [64]. To provide the best set of 14 soil variables and to avoid multicollinearity problems among them, their number was reduced with the forward selection option in CANOCO [65] using unrestricted Monte Carlo permutation under the reduced model for test each variable for significance (with 499 random permutations). Therefore, 10 soil attributes (sand, silt, clay, OM, pH, K, Cl, Mg, CO3, and SO4) and 7 anthropogenic variables (over-grazing, over-collection, introduced species, land degradation, urbanization, solid wastes, and military activities) were used in this analysis. All the default settings were used for CCA and RDA, and a Monte Carlo permutation test (499 permutations; [66]) was used to test for significance of the eigenvalues of the first canonical axis. Inter-set correlations were used to assess the importance of the soil and anthropogenic variables.
It was possible to measure the fraction of the variation in the dependent variables explained by each set of environmental variables alone as well as the fraction of the variation shared by the sets of variables by using partial CCA (pCCA). The pCCA is an extension of CCA, which allows for testing for effects of one set of explanatory variables, while at the same time partialling out effects of a second set of explanatory variables [67]. Estimation of variance partitioning was performed to evaluate the relative influence of soil and anthropogenic factors and their combined effects.

2.5. Species Diversity

Three indices were calculated: (1) species richness, i.e., both total number of species and average number of species per plot was calculated for each vegetation group (α-diversity) as well as for the entire study site (γ-diversity). (2) The Shannon–Wiener diversity index [68,69] was also calculated using the following equation: H’= −∑ pi ln pi, where pi = the frequency (f%) of (ith) species. These diversity indices are commonly used in ecological investigations [70,71]. (3) The plant species turnover (βw-diversity) for each study area was calculated as the ratio between the total number of species and mean species richness [72] according to the following equation: βw = (S/α) − 1, where S = total number of species recorded in the entire transect, and α = mean species richness.

3. Results

3.1. Characteristics of the Flora

In total, 85 species representing 68 genera from 30 families were recorded in this study: 47 species from the unprotected area (SR) and 58 species from the protected area (WD). Members of seven families constituted 57.6% of the total flora: Asteraceae (14 species) followed by Chenopodiaceae, Fabaceae, and Zygophyllaceae (seven species for each); Poaceae (six species); and Brassicaceae and Geraniaceae (four species for each). Fifteen families were represented by a single species (e.g., Asclepiadaceae, Cleomaceae, Nitrariaceae, Orobanchaceae, and Plumbaginaceae). Monogeneric families (15) represented by one species constituted the remaining flora (Table S1). The genera with the highest number of species (three for each) were Capparis, Erodium, Fagonia, Launaea, and Zygophyllum, whereas two species from each of Anabasis, Astragalus, Atriplex, Deverra, Diplotaxis, and Heliotropium were recorded. Generally, perennial species were dominant (53 species) in the protected area (WD), whereas annuals were dominant (13 species) in the unprotected area (SR). The overall life-form spectrum showed that chamaephytes (40 species), therophytes (16 species), hemicryptophytes (13 species), and phanerophytes (10) were the dominant life forms. The distribution of different life forms in the study areas (Figure 2) showed that phanerophytes and therophytes were more represented in the unprotected area (SR), whereas chamaephytes and hemicryptophytes were dominant in the protected area (WD), and other life forms were less represented.
Haloxylon salicornicum had its highest frequency value (f = 79%) in the unprotected area (SR), and Zilla spinosa and Zygophyllum coccineum were the dominant species with the highest frequency values in both areas (Table S1). Eight dominant species (f = 91–100%) were consistent in the WD. Twenty-nine species (34% of the recorded flora) were considered singletons as they were recorded in one sample plot. Chorologically, the Saharo-Arabian chorotype, whether pure or combined with others (Mediterranean, Sudano-Zanbezian and Irano-Turanian), dominated the current flora of both the Cairo-Suez road (44.6%) and the Wadi Degla protected area (60%). The Mediterranean chorotype was very poorly represented in both study areas: 3.5% in (SR) and 2.3% in (WD).

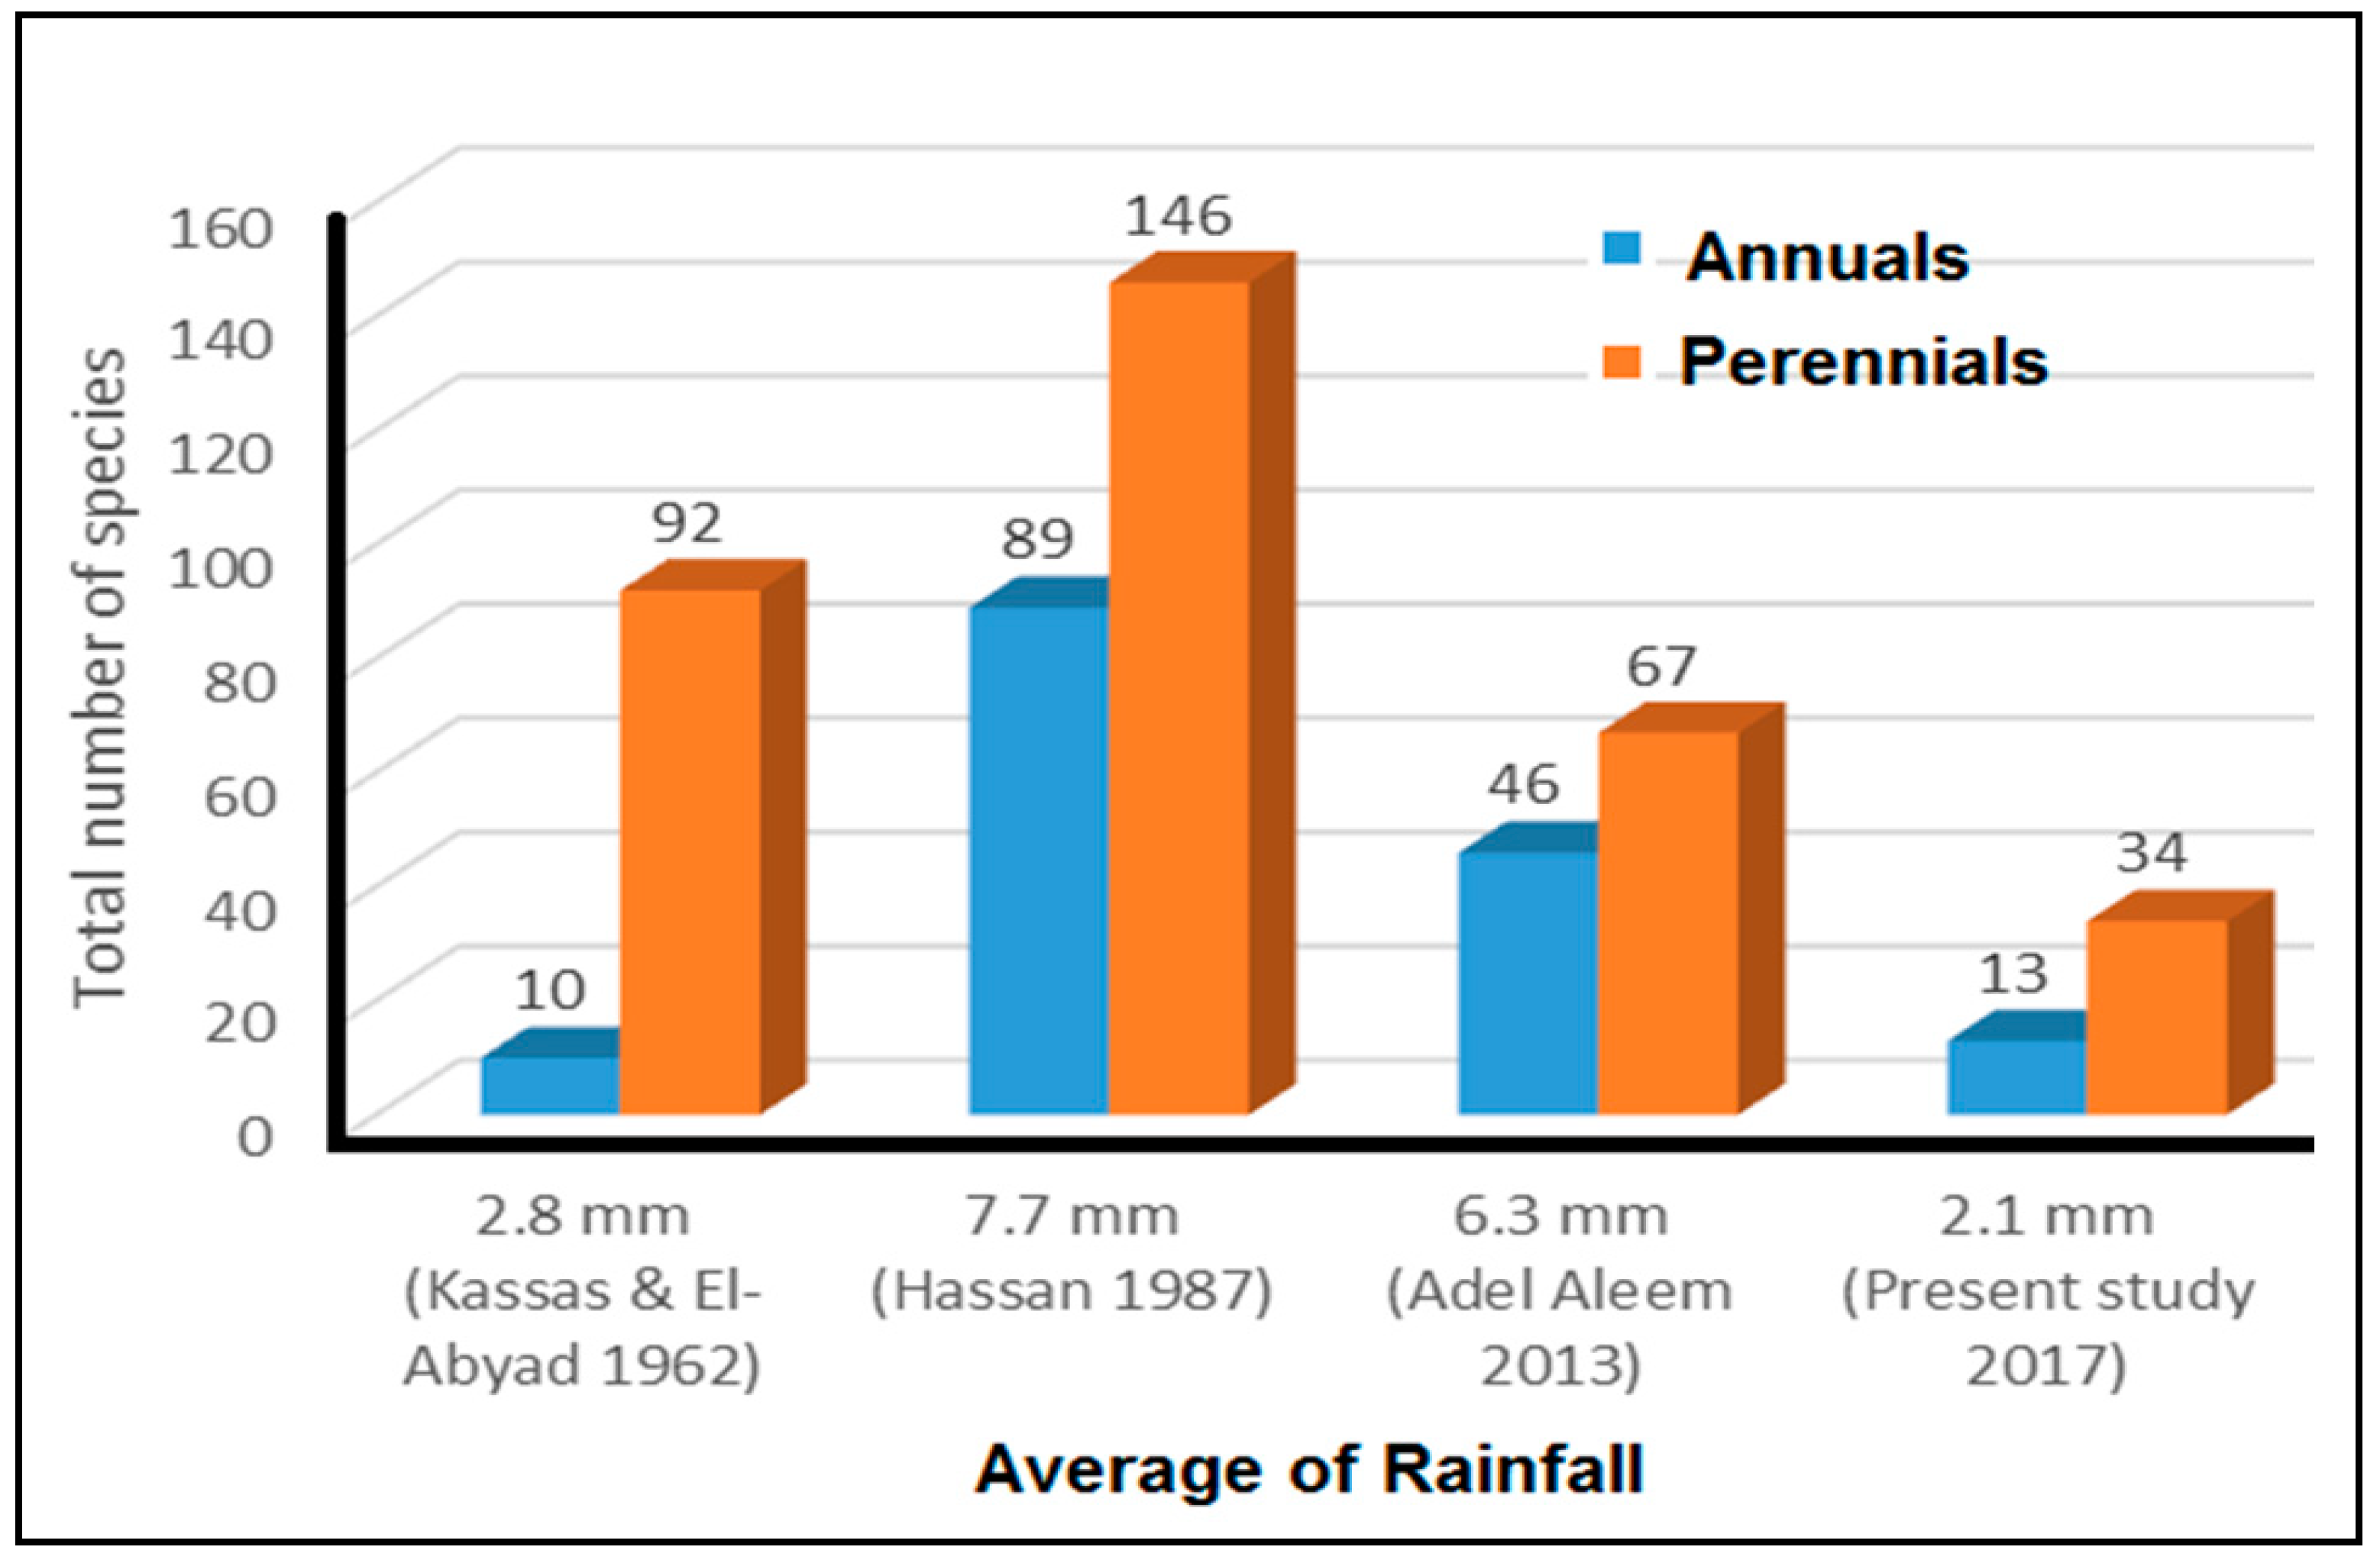
3.2. Floristic Changes over the Past Five Decades

3.2.1. Cairo-Suez Road (Unprotected Area)

Over the past 55 years (1962–2017; Table 1A), the floristic comparison between the recorded species along the Cairo-Suez road revealed a considerable decline in the numbers of recorded species: The highest peak (235 species) was reached in 1987 and the lowest (47 species) was found in this study. Twenty-five species (9%) out of a total of 277 were common in the past and are still common for half a century later. Therefore, they are rarely absent from vegetation plots, and include Acacia tortilis subsp. raddiana, Aerva javanica, Anabasis articulata, Haloxylon salicornicum, Calotropis procera, Ochradenus baccatus, Panicum turgidum, and Retama raetam. On the contrary, 11 species have not been observed since 1962, indicating their disappearance (e.g., Andrachne aspera, Hyparrhenia hirta, Scrophularia hypericifolia, and Taverniera aegyptiaca). Whereas Abd El-Ghani et al. [73] added 13 species, mostly weeds of arable lands, to the flora of the Cairo-Suez road (e.g., Amaranthus viridis, Chenopodium album, Conyza bonariensis, and Cichorium pumilum), the present study added another seven new species (e.g., Anagallis arvensis var. arvensis, Polypogon monspeliensis, and Astragalus alexandrinus). The Sørensen index of similarity between the recorded species in the previous studies indicated low similarities between the recorded species in this study and Kassas and El-Abyad [37], Hassan [74], and Abd El-Ghani et al. [73]: 39%, 27%, and 42%, respectively. More than 50% similarity was estimated between the other three studies.

3.2.2. Wadi Degla Protected Area

The earlier botanical exploration of Wadi Degla dated back to Tadros [75]. Ever since, more ecological and floristic studies have been carried out. A comparison of the floristic composition of Wadi Degla over the past 81 years (1936–2017; Table 1B) revealed an increase in the total number of species from 17 [75] to 88 [76], then decreased to 58 species in this study. Altogether, 115 species were recorded from Wadi Degla, of which 10 species were frequently recorded (e.g., Agathophora alopecuroides, Deverra tortuosa, Echinops spinosus, Gymnocarpos decandrus, Reaumeria hirtella, Zilla spinosa, and Zygophyllum coccineum). Tadros [75] recorded Citrullus colocynthis, Limonium tubiflorum, and Pulicaria undulata, which were not recorded until the current study. Over the past 17 years (2000–2017), 18 species constantly occurred (e.g., Anabasis articulate, Cistanche phelypaea, Cocculus pendulus, Deverra triradiata, Fagonia bruguieri, Retama raetam, Scrophularia deserti, Ochradenus baccatus, and Limonium pruinosum). This study added another four new species: Atriplex dimorphostegia, Capparis deciduas, Forsskaolea tenacissima, and Suaeda monoica. El-Adawy [76] enumerated 21 species that were not recorded in any other study, and included, amongst others, Anchusa hispida, Calotropis procera, Ephedra aphylla, Juncus rigidus, Pteranthus dichotomus, Capparis deciduas, and Forsskaolea tenacissima. Higher values of Sørensen’s index of similarity occurred between the recorded species in the present study and those of El-Adawy [76] and Hassan [39].
Sørensen’s index of similarity (Table 1A,B) between the floristic composition of the unprotected area (SR) and the protected area (WD) was low (34.6%).

3.3. Classification, Indicator Species Analysis, and Description of Vegetation Groups

Eight vegetation groups were recognized after the application of cluster analysis (I–VIII; Figure 3). Obviously, the four groups (I–IV) of the unprotected area of the Cairo-Suez road (SR) were separated from the other four groups (V–VIII) of the Wadi Degla protected area (WD).
The multi-response permutation procedure (MRPP) revealed that there were significant differences between these groups in the environmental matrix (chance-corrected within-group agreement A = 0.538; p<0.0001), suggesting that these communities are distinct species assemblages. The average within-group distance ranged between 0.16 and 0.45, indicating relatively high dispersion. The T statistic was −8.836, indicating relatively high dissimilarity in plant communities (vegetation groups) among the studied areas. Pairwise comparisons revealed significant differences between the groups (Table S2). The application of indicator species analysis (ISA) showed that each vegetation group was characterized by a different indicator species (Table 2). Sixteen species (18.8% of the total flora) exhibited correlations with the vegetation groups based on their IVs. Significant differences in the examined environmental attributes within the separated vegetation groups were noticed (Table 2).

3.4. Description of Vegetation Groups

3.4.1. Cairo-Suez Road Unprotected Area

Figure 3A showed the cluster analysis resulting from the classification of the vegetation along the Cairo-Suez road using a presence/absence data set of 14 plots × 47 species. Four vegetation groups (I–IV) were identified. Whereas contents of silt, pH, and chlorides showed significant variations of soil features among the vegetation groups, over-collection was the only anthropogenic disturbance factor with significant variation (p = 0.03). Group I was indicated by Calotropis procera, Phragmites australis, and Pulicaria undulata. This group inhabited soil with the highest content of silt and the lowest concentrations of organic matter and potassium (Table 3). Regarding factors of anthropogenic disturbances, this group was affected by moderate levels of introduced species (IS) and urbanization (UR), and lower levels of the others (OC, OG, LD, SW, and MA). Group II was the least diversified (1.7 ± 1.2 species plot−1) and indicated by Haloxylon salicornicum occupying sandy fertile soil with the highest contents of most soil attributes. It was affected by higher levels of solid wastes and moderate levels of land degradation, but the others had lower levels. Group III was indicated by Ochradenus baccatus and Zygophyllum coccineum that was found in soils comparable to those of group II with moderate contents of all attributes. Despite all other human-mediated factors having lower levels, military activities were the highest. Group IV was the most diversified (11.7 ± 1.3 species plot−1), which was indicated by Acacia tortilis subsp. raddiana, Panicum turgidum and Launaea spinosa. It occupied muddy soil with the lowest contents of most of the examined soil attributed. This group was highly affected by over-collection and over-grazing, moderately affected by the introduced species, and least affected by the other anthropogenic activities.

3.4.2. Wadi Degla Protected Area

After the application of cluster analysis on the floristic presence/absence data set (11 plots × 40 species), four vegetation groups (V–VIII) were identified and are illustrated in Figure 3B. Soil contents of calcium and chloride ions showed significant differences among groups (Table 4). Group V was the least diversified (26.3 ± 1.5 species plot−1) and was characterized by Artemisia judaica and Reaumeria hirtella occupying muddy soil with moderate contents of organic matter and calcium and chloride ions. Group VI was the most diversified (31.0 ± 1.4 species plot−1), which indicated by Heliotropium bacciferum found in muddy fertile soils with a high pH rich in contents of organic matter and magnesium ions, and lower contents of silt, calcium ions, and bicarbonates. Group VII was indicated by Lasiurus scindicus and Nitraria retusa occupying soil with high contents of fine deposits and low contents of nutrients (Na, K, Cl, Mg, and SO4) and salinity. Group VIII was indicated by Orobanche cernua and Fagonia bruguieri inhabiting soils rich in nutrient contents and poor in organic matter and clay (Table 4). Xero-halophytic species such as Limonium pruinosum, Zygophyllum album, Tamarix nilotica, Suaeda monoica, and Atriplex halimus were found. Other Psammo-xerophytic species such as Anabasis articulata, Echinops spinosus, Deverra tortiosa, Ochradenus baccatus, and Retama raetam were recorded. None of the measured diversity indices had significant differences among groups.

3.5. Correlations between Soil Factors and Anthropogenic Variables

The seven degrees of disturbances varied in the four identified vegetation groups of the Cairo-Suez road (SR). Over-collecting, over-grazing, introduced species, and urbanization showed significant differences among vegetation groups (Table 3). With the examined soil parameters, over-collection, over-grazing, and introduced species showed significant correlations (Table S3). Negative significant correlations occurred between pH, EC, Na, Ca, Cl, and HCO3 and over-collection of plants, whereas increasing soil fertility (OM) corresponded to a decrease in species introduction (IS). On the other hand, a negative significant correlation was found between over-collection of plants and an accumulation of solid wastes (SW), and urbanization (UR) was highly positively correlated with species introduction.

3.6. Vegetation–Soil–Anthropogenic Correlations

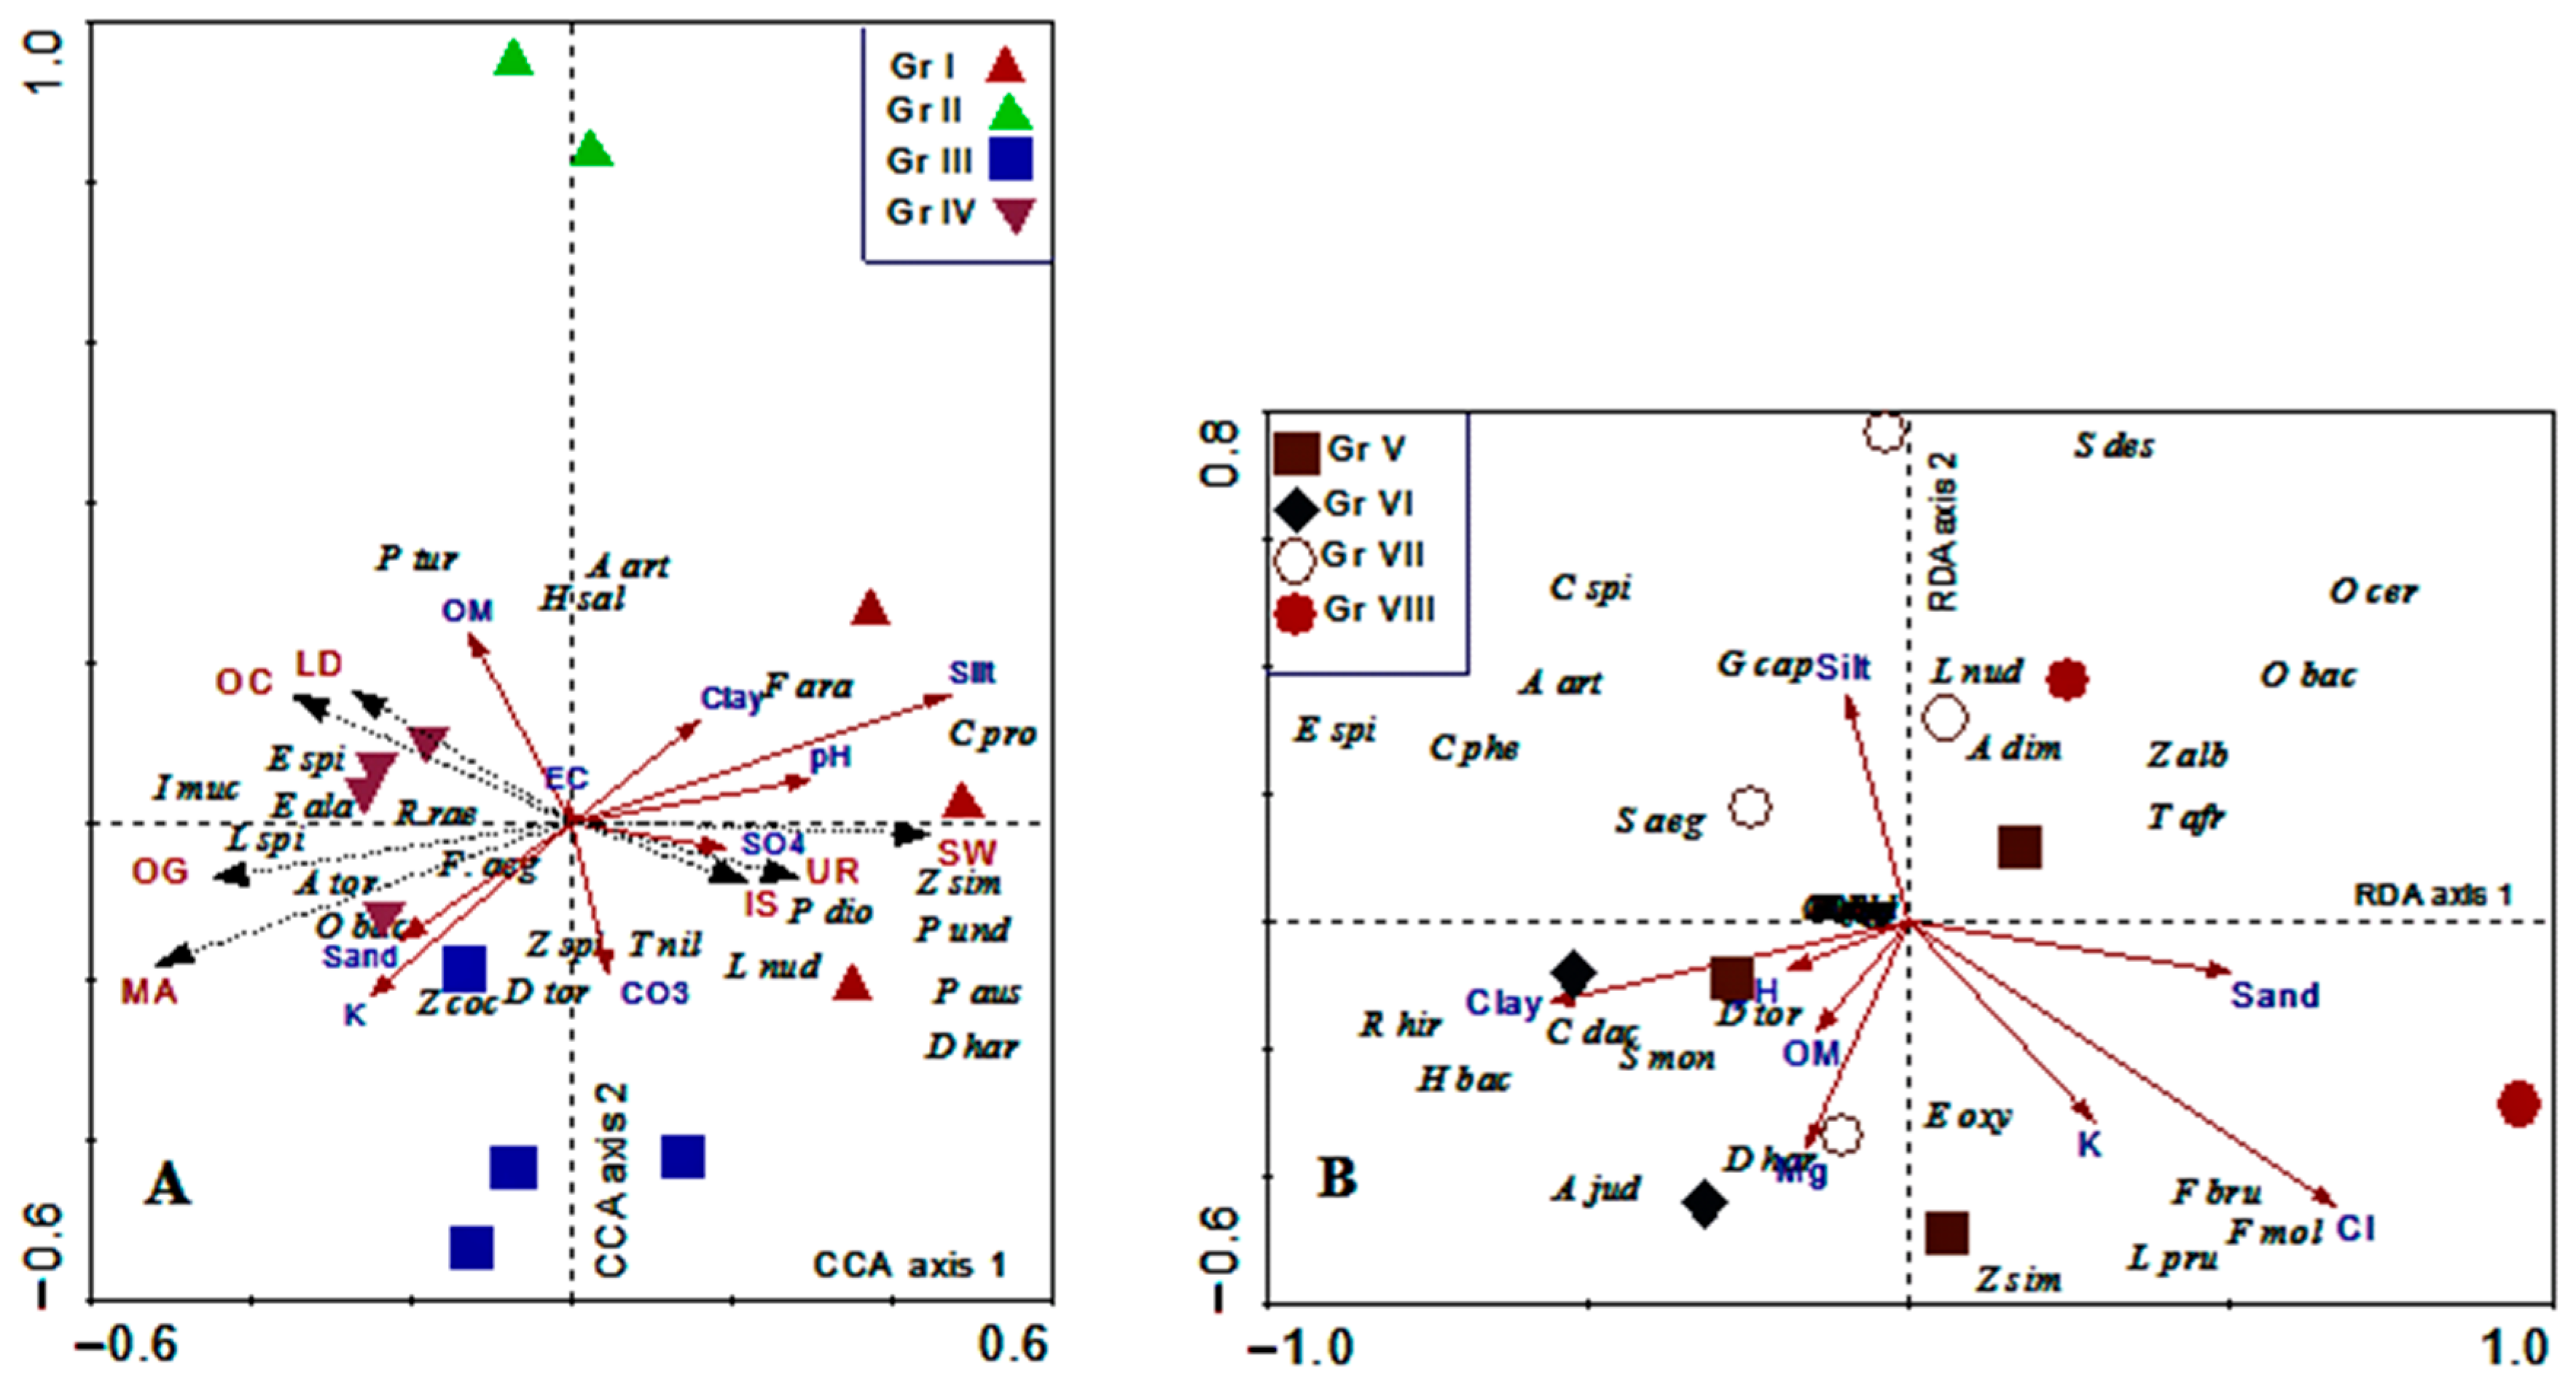
3.6.1. Cairo-Suez Road (Unprotected Area)

The association between vegetation, the measured soil factors, and the anthropogenic variables among the 14 plots within their vegetation groups is depicted in the CCA diagram (Table S4, Figure 4A). The soil variables and the anthropogenic variables are represented by solid arrows (for the former) and dotted arrows (for the latter) pointing in the direction of maximum variation, with their length proportional to the rate of change [77]. The species–environmental correlations were higher for the first two canonical axes, explaining 55.0% of the total cumulative variance. These results indicated that the examined soil factors were suitable for identifying the influential environmental factors presented in the CCA diagram. A Monte Carlo permutation test indicated that all the canonical axes were significant (p<0.03). The results of the inter-set correlations of environmental factors with the first two CCA ordination axes (Table S4) showed that the first CCA ordination can be defined as gradients of silt-SW (positive end), and K-MA (negative end), whereas the second CCA axis can be defined as OM-LD (positive end), and K-MA (negative end).
The identified vegetation groups were also separated along the first CCA axes (Figure 4A). Certain groups were either not linked to any of the studied types of variables (group II), or weakly correlated to certain variables (group III). Sample plots of group (I) were affected by silt, clay, SO4, pH, SW, UR, and IS. The species composition of this group was characterized by Fagonia arabica, Calotropis procera, Pluchea dioscoridis, Zygophyllum simplex, Pulicaria undulata, and Launaea nudicaulis. Samples of group (IV) were linked to OM, OC, and OG. The floristic composition was characterized by Launaea spinosa, Panicum turgidum, Echinops spinosus, Ochradenus baccatus, and Retama raetam. A test for significance with an unrestricted Monte Carlo permutation test found the F-ratio for the eigenvalue of CCA axis 1 and the trace statistics to be significant (p = 0.01).

3.6.2. Wadi Degla Protected Area

From the inter-set correlations of the environmental variables and the first two axes of RDA (Table S4), it can be inferred that RDA axis 1 was positively correlated with Cl, and negatively with clay. This axis can be defined as clay-Cl gradient. RDA axis 2 was positively correlated with silt, and negatively correlated with Cl. Therefore, RDA axis 2 can be defined as a silt−Cl gradient. This fact becomes evident in the ordination biplot (Figure 4B). A test for significance with an unrestricted Monte Carlo permutation test found the F-ratio for the eigenvalue of RDA axis 1 and the trace statistics to be significant (p = 0.003), indicating that the observed patterns did not arise by chance. The species composition of group V was dominated by Artemisia judaica, Reaumeria hirtella, Deverra tortuosa, and Zygophyllum simplex inhabiting fertile soil rich in contents of OM, Ca++, silt, and clay. The sample plots of group VI occurred on clayey soil rich in Mg contents and were characterized by Heliotropium bacciferum, Diplotaxis acris, and Cynodon dactylon. The floristic composition of group VII included certain species that can tolerate high soil contents of Na+ and EC, such as Nitraria retusa, Suaeda monoica, Zygophyllum album, and Atriplex dimorphestegia. The sandy soil of group VIII favored the growth of parasitic plants (Orobanche cernua, Cuscuta pedicellata, and Cistanche phelypaea) and annuals (Centaurea aegyptiaca, Erodium laciniatum, Trigonella stellata, and Reichardia tingitana).

3.6.3. Impact of Anthropogenic Variables (pCCA)

The results of the partial CCA (pCCA) for the unprotected area of the Cairo-Suez road (SR) revealed that most of the variance (45.7%) was attributed to the anthropogenic variables (F = 1.8, p = 0.03), whereas site soil factors were explained by 14.5% (F = 2.7, p = 0.01) of the variance, which suggests that the species composition was highly affected by the anthropogenic variables. The amount of variance shared between the soil and the anthropogenic factors was 31.2%. The combined effect of both groups of variables was represented by 91.4% of the total variability.

3.7. Correlations between Species Diversity, Soil Factors, and Anthropogenic Variables

Despite the diversity indices showing high significant variations among the vegetation groups of SR, they showed insignificant variations among groups of WD. The results in Table S3 indicate that soil contents of organic matter (OM), potassium (K), and sulfates (SO4) were not significantly correlated to the measured α-diversity or H’ indices. The remaining soil factors showed significant negative correlations. A correlation between the anthropogenic activities and the species richness existed. Among the anthropogenic activities, over-grazing, land degradation, and military activities were not correlated with these indices. However, over-collection of plant species, urbanization, and solid wastes were significantly negatively correlated with both α-diversity and the Shannon–Wiener index (Table S3).

4. Discussion

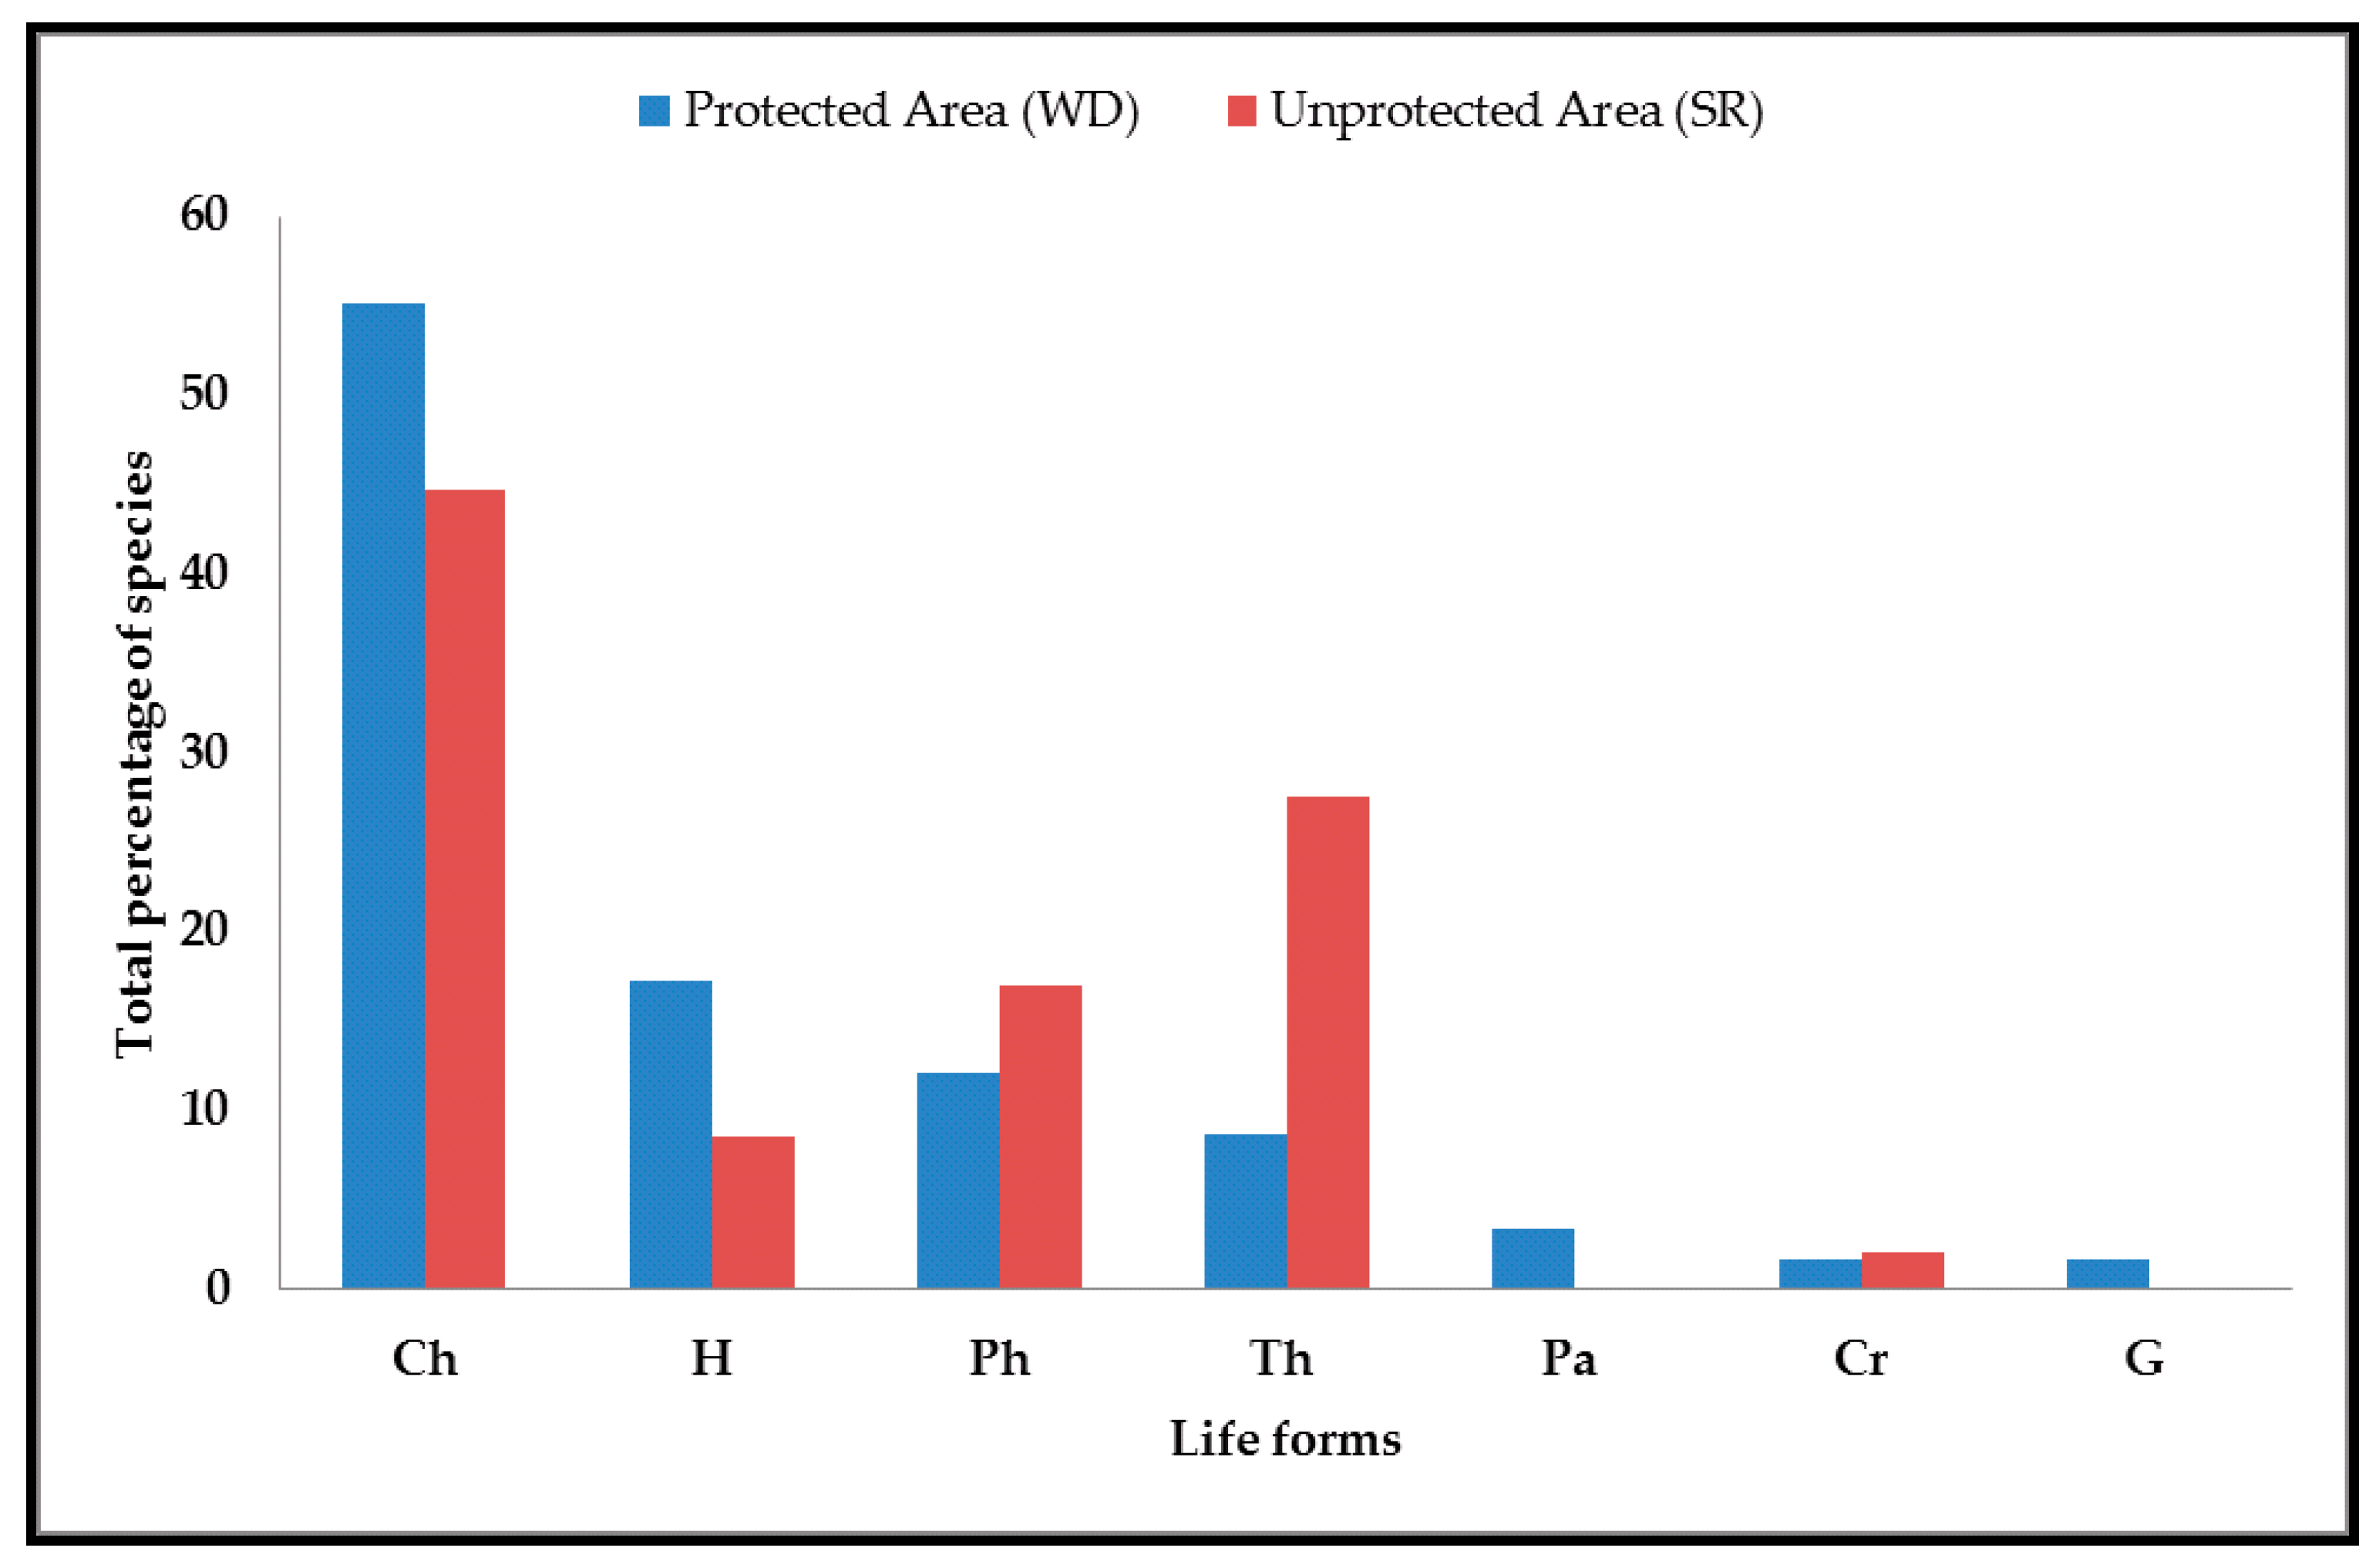
4.1. Floristic Composition, Biological Spectrum, and Chorological Affinities

The overall floristic analysis of the study areas showed that the majority (48.2%) of the recorded flora belonged to five plant families: Asteraceae, Chenopodiaceae, Fabaceae, Zygophyllaceae, and Poaceae. This result was also consistent with those in adjacent areas in the arid region, e.g., El-Ghanem et al. [78], Alatar et al. [25], Shaheen et al. [79], Zhang et al. [71], Salama et al. [80], and Croce et al. [81] in Kuwait, Saudi Arabia, Pakistan, China, Egypt, and southern Italy, respectively. According to Pielou [68] and Magurran [69], the taxonomic range is higher in an area in which species are distributed among several genera than in which the most species belong to the same genus. In this study, among the 30 families, 15 (50%) were represented by one species per family. A common characteristic of desert flora, which is considered a signal of plant adaptation to a xeric condition, is that only a few species of the largest plant families can adapt and survive compared to other species that do not survive and become extinct [22]. The shrub species (including shrubs and sub-shrubs) and herbaceous species (including annual and perennial herbaceous plants) in the study area were mainly xerophytes or super-xerophytes. The latter affects the structure of the plant communities as well as the functions of the ecosystems in the study areas.
Divergent distribution patterns of annuals and perennials in the two areas under investigation were encountered. The protected area of Wadi Degla (WD) had more perennial species, whereas the unprotected area of the Cairo-Suez road (SR) had the highest number of annuals. McIntyre et al. [82] and Sternberg and Shoshany [83] inferred that a high proportion of annual plants in a system indicate a higher level of disturbance. The permanent characteristic of the vegetation in a desert ecosystem is determined by the dominance of perennial species. This may be attributed to the rather low rainfall, which is not adequate for the growth of many annuals. On the other hand, the rainy season provides a better opportunity for the appearance of a significant number of annuals, which then offers a characteristic physiognomy to the vegetation [84,85,86]. The short life cycles, high allocation of resources to the reproductive organs, and productivity of flowers early in their lifespan to ensure seed output in a short time may explain the higher contribution and better performance of annuals [87].
In hyper-arid deserts, the plant life is principally triggered by rain and thus is as scarce and unpredictable as the precipitation itself, whereas vegetation is restricted to habitats receiving runoff water including wadis, channels, and depressions with deeps in contracted desert [88]. Over the past 55 years, the floristic comparison between the recorded species along the Cairo-Suez road (SR) revealed a considerable decline in their numbers: from 235 in 1987 to 47 in this study. In this context, over the past 81 years, the floristic comparisons of the Wadi Degla protected area (WD) revealed an increase from 17 [75] to 88 [76], then decreased to 58 species in this study. We detected that changes in the total numbers of recorded species corresponded to sudden torrential rains that occurred during these periods along the Cairo-Suez road (SR) (Figure 5). The decreased numbers of annuals in the study areas can be related to climatic aridity, which plays a principal role in reducing vegetation density [85,89]. Rainstorms do not follow precise annual patterns and there are frequently decades between storm events [22,38]. Obviously, in 1987 the amount of rainfall was the highest (7.7 mm), then decreased to the minimum reached in 2017 (2.1 mm). Similar trend can be found in the temporal dynamics of the flora of Wadi Degla (WD) for the decreased numbers of species, especially in 2017. Comparing the species composition in the two studied areas with those recorded in earlier works, low similarities were detected, indicating remarkable changes in floristic structure. Similar results were reported in other wadis of the Eastern Desert of Egypt [33].
Analysis of the biological spectrum of the floristic composition in the study areas indicated the dominance of chamaephytes (40 species) and therophytes (16 species) over the other life forms, which reflects the hot, dry climate, and human and animal interferences. Therophytes are highly adaptable to mild, moist winters and hot, dry summers, and can also appear particularly in the rainy season. These findings are in line with the spectra of vegetation of arid desert habitats in Egypt [73,90], Kuwait [10], Saudi Arabia [25,91], China [92], Mexico and the USA [93], Libya [94], and Algeria [95]. Additionally, the preponderance of phanerophytes and therophytes in the unprotected area (SR) is an indicator of anthropogenic activities, a hot, dry climate, and topographical variation [96,97].
From the phytogeographical point of view, the areas under study are situated within the Saharo-Arabian phytogeographical zone [98,99]. The largest floristic group in the current study areas was the Saharo-Arabian elements and belongs to the Saharo-Sindian phytogeographical region. The Saharo-Arabian element, whether pure or combined with others (Mediterranea, Sudano-Zambezia, and Irano-Turanian), dominated the current flora (approximately 81% of the total species). The location of the Egyptian desert within the Saharo-Arabian region of the Holarctic Kingdom on the one hand, and the fact that their plants are tolerant to harsh desert environmental conditions on the other, may explain their dominance. In contrast, the slight representation of the Mediterranean element (5.8%) in both study areas referred to change in desert habitats due to anthropogenic and climatic factors, which provide the chance for some alien species to migrate to nearby regions [85,100].

4.2. Classification of the Vegetation

In the earlier study by Kassas and El-Abyad [37] along the Cairo-Suez road (SR), 14 plant communities were recognized. The seven most common species were associated in all of them: Deverra tortuosa, Zygophyllum decumbens, Zilla spinosa, Farsetia aegyptia, Echinops spinosus, Linaria aegyptiaca, and Centaurea aegyptiaca. In terms of classification of the vegetation, the present study recognized four distinct vegetation groups (plant communities), which were indicated by Calotropis procera, Phragmites australis, and Pulicaria undulata (group I); Haloxylon salicornicum (group II); Ochradenus baccatus and Zygophyllum coccineum (group III); and Acacia tortilis subsp. raddiana, Panicum turgidum, and Launaea spinosa (group IV). Differences in plant communities between the two investigations were noticeable, and may be attributed to the used sampling design and the application of multivariate analyses techniques such as cluster analysis, indicator species analysis (ISA) and the multi-response permutation procedure (MRPP). According to Legendre and Legendre [101], the results of hierarchical clustering must be validated, as the latter method will always reveal groups even when the dataset is essentially unstructured [102,103]. The results of MRPP revealed significant differences between these groups in the environmental matrix. This study also indicated the disappearance of several plant communities that were previously of common occurrence, such as Retama raetam, Anabasis articulata, Ephedra alata, Artemisia monosperma, Zygophyllum decumbens, Lasiurus hirsutus, and Panicum turgidum. Most of the identified vegetation groups have analogues with others recorded in some wadis of the Eastern Desert [73,104], Western Desert [88,105], along the western Mediterranean region [106], in the South Sinai region [107,108], and in northwestern Negev, Israel [109]. This result can be directly related to the severe uncontrolled human disturbances (especially urbanization) along both sides of this road (Figure 6), where the vegetation is removed from nearly half of its length.
The earlier ecological work of Kassas and Imam [31] was carried out to study the formations of the wadi bed ecosystem, including Wadi Degla (WD), among others in the Eastern Desert. Apart from the investigation of El-Adawy [76], which primarily focused on the plant phenological patterns of 20 species dominating Wadi Degla, the prevailing plant communities were not described. Hassan [39] identified five main habitats in Wadi Degla: (1) rocky habitats, (2) cliffs, (3) terraces, (4) Degla canyon, and (5) wadi bed channels. Seven characteristic species were recorded: Atriplex halimus, Zilla spinosa, Zygophyllum coccineum, Iphiona mucronata, Gymnocarpos decandrum, Deverra tortuosa, and Farsetia aegyptia. However, phytosociological studies were not performed. In the present study, the application of classification to the floristic data of the Wadi Degla protected area (WD) yielded four vegetation groups (plant communities): Group V was characterized by Artemisia judaica and Reaumeria hirtella, group VI was indicated by Heliotropium bacciferum, group VII was indicated by Lasiurus scindicus and Nitraria retusa, and group VIII was indicated by Orobanche cernua and Fagonia bruguieri. Based on this classification, however, many other species were recorded as associates in the previous works. This study is the first to quantify the vegetation structure and identify the plant communities in the Wadi Degla protected area (WD). It also presents baseline information for future biodiversity and conservation studies.

4.3. Soil–Vegetation Relationships

The hyper-arid conditions prevailing in the Egyptian Eastern Desert correspond very well to Noy-Meir’s [110] definition of the desert ecosystem as a “water-controlled ecosystem with infrequent, discrete, and largely unpredictable water input.” Vegetation is confined to wadis and controlled by water availability (moisture in soil) in the study system (a classic végétation contractée community). The ecological response of a species along an environmental gradient can be affected by an array of factors (biotic and/or abiotic ones). Epstein et al. [111] reported the importance these gradients, which might be related to either climatic or physico-chemical soil resources. On the other hand, at regional scales, distribution of vegetation are significantly controlled by soil, topographic, and human factors that climate did [112,113]. In arid desert ecosystems, as in this study, the role of physico-chemical soil properties in species distribution and community structure is pronounced and documented [22,25,114,115,116].
Along the Cairo-Suez road (SR), the results of inter-set correlations of environmental factors with the first two CCA ordination axes (Table S4) showed that the first CCA axis ordination can be defined as gradients of silt-K, whereas the second CCA axis was connected with fertility which can be defined as an OM-K gradient. In the Wadi Degla protected area (WD), the first RDA axis was defined as a clay-Cl gradient, whereas axis 2 was inferred as a gradient of silt-Cl. The growth of plant species in drier habitats is restricted by coarse-textured soil with lower soil moisture, and species can thus coexist in close proximity without directly competing for resources [117]. The importance of percentages of surface sediments of different size classes in determining the spatial distribution of soil moisture was indicated in other relevant studies on arid ecosystems [107,118,119]. Beside soil texture, soil fertility was also found to have a significant correlations with distributions of plant species. He et al. [120] and Zuo et al. [121] reported the significant contribution of soil fertility, especially organic matter, which affected the vegetation distribution in the Alxa Plateau (China). Soil organic matter can be a factor of equal importance controlling species composition in some sampling plots, as it can improve soil aggregate stability, increase soil fertility, enhance plant water availability, and facilitate the soil mineralization process. On the other hand, Huerta-Martínez et al. [122] showed that high levels of K+ in soils could be related to strong microbiological activity, which increases the availability of phosphorus and potassium for plants.

4.4. Anthropogenic Factors and Their Contribution

Disturbance is an important factor that has an impact on all plant communities in the current study. Among the resulting vegetation groups, four anthropogenic factors were significantly different; each had a specific degree of disturbance within the plant clusters and contributed to their floristic composition. Based on their averages among clusters, these disturbances could be ranked as follows: urbanization, over-grazing, over-collection, and introduced species. This result was partly in agreement with others from a wide range of regions: Abdelaal [33] in Wadi Hagul, an affluent of the Cairo-Suez road (Egypt); Abd El-Wahab [10] in the Western Arabian Gulf of Kuwait; and Neji et al. [11] in the Southern Mediterranean (Tunisia).
The results of CCA (Figure 4A, Table S4) defined gradients of anthropogenic disturbances along the first and second axes: SW-MA for the former and LD-MA for the latter. In addition, partial CCA (pCCA) revealed that most of the variance (45.7%) was attributed to anthropogenic variables more than soil factors (14.5%). This proved the importance of human activities in shaping the floristic composition of the unprotected disturbed Cairo-Suez road (SR). The human-induced threats, i.e., over-collection, over-grazing, mining, rock crusher machines, industrialization, solid wastes, air pollution, military activities, and urbanization (e.g., new settlements, infrastructure, water and petroleum pipelines, power station, digging new wells, and highways) give rise to alterations in habitat conditions with consequent alteration in vegetation structure and the destruction of macro- and micro-vegetation elements [4,5]. As a result of long-term disturbance, perennial species of the original vegetation will disappear, causing a decrease in biodiversity. Therefore, disturbing arid, open habitats can not only reduce biodiversity, but also act as a threat to vegetation. In terms of anthropogenic activities related to human and animal interferences, destruction of desert scrublands (e.g., Acacia raddiana (sensu lato) and Tamarix nilotica) due to cutting and lumbering for the fuel and charcoal industry were also considered and indicated by Kassas and El-Abyad [37]. On the other hand, Panicum turgidum, a perennial herb, was not abundantly recorded as in earlier works [37,123]. Intensive and uncontrolled grazing were the pronounced agencies in soil erosion and modification of the whole ecosystem. This is an important aspect that should be considered in the conservation management of arid desert ecosystems.
Some of the recorded species were known among the common weeds of arable lands in the agroecosystem of Egypt, such as Cynodon dactylon, Orobanche cernua, Anagallis arvensis L. var. arvensis, Emex spinosa, Polypogon monspeliensis, and Senecio glaucus, and in the habitats of new urbanized desert cities [124,125]. The presence of such species may be attributed to the capabilities of their seeds for dispersal from their habitats with wind, transported soil, or water. Forman and Alexander [126] indicated an increase in weed species due to an increase of roads in an area. Davis et al. [127] added that human disturbances improve resource availability and create disturbed habitats more susceptible to invasion. Artemisia judaica, Achillea fragrantissima, Agathophora alopecuroides var. alopecuroides, Atriplex dimorphostegia, Cynodon dactylon, Erodium oxyrrhynchum, Heliotropium bacciferum, and Atriplex halimus were recorded with the highest frequency in WD, but were absent from SR; hence, these species continuously have suffered from over-grazing and over-collection for research, fuel, local trade, and medicinal and other uses by herbalists and inhabitants continuously [38].

4.5. Plant Diversity and Its Significance

Huerta-Martínez et al. [128] and Zuo et al. [129] explained the spatial variations of plant species diversity on the bases of several climatic, edaphic, and topographic factors. In our study, climatic factors in such small size areas were disregarded. Similar results were also obtained in other studies [91,130,131]. The high value of β-diversity may reflect rapid ecologically significant changes in highly disturbed habitats [132]. Higher beta-diversity can also be related to warmer and sunny climates and more nutrient-rich soil conditions [133]. Our results revealed that the Cairo-Suez road (SR), which has been subjected to various types of human disturbances, attained higher values of β-diversity than Wadi Degla (WD). As expected, our results indicated negative correlations between anthropogenic activities and species diversity. Over-grazing, land degradation, and military activities were not correlated with the measured diversity indices. However, over-collection of plant species, urbanization, and solid wastes were significantly negatively correlated with both α-diversity and the Shannon–Wiener index.

5. Conclusions

This study was carried out in the northeastern desert of Egypt to investigate floristic composition and vegetation structure in the Wadi Degla protected area compared to that along the Cairo-Suez road, which has been under human pressure for many years as an unprotected area, where negative impacts persist. Harsh environmental conditions, scanty unpredicted rainfall in space and time, and the location of the studied areas in the hyper-arid desert ecosystem may affect their floristic and vegetation diversity. The notable biodiversity, especially in the protected area, highlights the importance of the two studied regions. Desert ecosystems are negatively affected by uncontrolled human activities that seriously threat the indigenous populations in those habitats. Hence, the anthropogenic pressure should be reduced and some conservation programs and management plans should be implemented to save biodiversity strategies. Plant-cover recovery may take from 50 to 300 years, whereas recovery of the complete ecosystem may require more than 3000 years. Because of the sensitivity of desert habitats to disturbance and their slow rate of natural recovery, the management option is to limit the intensity of threatening impacts as much as possible. In the context of heavily altered habitats, the institution of preserved areas is crucial to protect the last fragments of threatened ecosystems. In this scenario, our findings could be useful to detect flora changes, establish habitat protection priorities, and improve efforts for conserving natural landscapes.

Supplementary Materials

The following are available online at https://0-www-mdpi-com.brum.beds.ac.uk/article/10.3390/d13040157/s1, Table S1: Species distribution in the Wadi Degla protected area (WD) and Cairo-Suez road unprotected area (SR), with their frequency values (f%) and life forms, Table S2: Multiple pairwise comparisons of the MRPP statistics for the vegetation groups (I-VIII) based on Bray-Curtis distance, Table S3: Pesrson’s correlation coefficients between soil variables and anthropogenic variables in Cairo-Suez road unprotected area, Table S4: Comparison of the ordination of the first four axes of CCA and RDA with soil variables in both areas, together with anthropogenic factors.

Author Contributions

All authors made equal contributions to the field studies, writing, data processing, and revision of the manuscript. All authors have read and agreed to the published version of the manuscript.

Funding

This research received no external funding.

Institutional Review Board Statement

Not applicable.

Informed Consent Statement

Not applicable.

Data Availability Statement

Not applicable.

Acknowledgments

We are indebted to late professors Vivi Täckholm and Mohamed Kassas, both of Cairo University, who initiated earlier inventories of the flora and vegetation of the Egyptian deserts. We thank three anonymous reviewers for their valuable suggestions and comments on earlier versions that helped to improve our manuscript.

Conflicts of Interest

The authors declare no conflict of interest.

References

  1. Millennium Ecosystem Assessment. Ecosystems and Human Well-Being: Desertification Synthesis; World Resources Institute: Washington DC, USA, 2005. [Google Scholar]
  2. Dregne, H.E. Land Degradation in the Drylands. Arid Land Res. Manag. 2002, 16, 99–132. [Google Scholar] [CrossRef]
  3. Dansereau, P. The origin and growth of plant communities. In Growth in Living System: Proceedings of International Symposium on Growth, Purdue University, Indiana; Zarrow, M.X., Ed.; Basic Books: New York, NY, USA, 1960; pp. 563–603. [Google Scholar]
  4. Moustafa, A.A.; Abd El-Wahab, R.H.; Zaghloul, M.S. Conservation and Sustainable Use of Medicinal Plants in Arid and Semi-Arid Ecosystems of Egypt; Final report; Egyptian Environmental Affairs Agency (EEAA), United Nations Development Programme (UNDP) and Global Environmental Facilities (GEF): Giza, Egypt, 1999. [Google Scholar]
  5. Nakahama, N.; Hirasawa, Y.; Minato, T.; Hasegawa, M.; Isagi, Y.; Shiga, T. Recovery of genetic diversity in threatened plants through use of germinated seeds from herbarium specimens. Plant Ecol. 2015, 216, 1635–1647. [Google Scholar] [CrossRef] [Green Version]
  6. Enright, N.J.; Miller, B.P.; Akhter, R. Desert vegetation and vegetation-environment relationships in Kirthar National Park, Sindh, Pakistan. J. Arid Environ. 2005, 61, 397–418. [Google Scholar] [CrossRef]
  7. Ward, D. The Biology of Deserts; Oxford University Press: Oxford, UK, 2009. [Google Scholar]
  8. San Martín, C.; Alvarez, M. Floristic composition of anthropogenic seasonal wetlands in the coastal mountain range of Cautin, Chile. Agrofor. Surv. 2009, 37, 9–25. [Google Scholar] [CrossRef]
  9. Kotańska, M.; Buziak-Chmielowiec, E.; Dąbrowska, A.; Gladysz, M.; Jakielaszek, A.; Wójcik, T. Human impact on the plant cover of four villages in SE Poland. Steciana 2015, 19, 115–121. [Google Scholar] [CrossRef]
  10. Abd El-Wahab, R.H. Plant assemblage and diversity variation with human disturbances in coastal habitats of the western Arabian Gulf. J. Arid Land 2016, 8, 787–798. [Google Scholar] [CrossRef] [Green Version]
  11. Neji, M.; Serbaji, M.M.; Hardy, O.; Chaieb, M. Floristic diversity and vegetation patterns along disturbance gradient in arid coasts in southern mediterranean: Case of the Gulf of Gabès, southern Tunisia. Arid Land Res. Manag. 2018, 32, 291–315. [Google Scholar] [CrossRef]
  12. Dhaou, S.O.; Abdallah, F.; Belgacem, A.O.; Chaieb, M. The protection effects on floristic diversity in North African pseudo-savanna. Pak. J. Bot. 2010, 42, 1501–1510. [Google Scholar]
  13. El-Sheikh, M.A.; Thomas, J.; Alatar, A.A.; Hegazy, A.K.; Abbady, G.A.; Alfarhan, A.H.; Okla, M.I. Vegetation of Thumamah Nature Park: A managed arid land site in Saudi Arabia. Rend. Fis. Acc. Lincei 2013, 24, 349–367. [Google Scholar] [CrossRef]
  14. Ayyad, M. Case studies in the conservation of biodiversity: Degradation and threats. J. Arid Environ. 2003, 54, 165–185. [Google Scholar] [CrossRef] [Green Version]
  15. EEAA Egyptian Environmental Affairs Agency: Egypt State of the Environment Report 2006. Available online: http://www.eeaa.gov.eg/en-us/mediacenter/reports/soereports/soe2006.aspx (accessed on 1 December 2007).
  16. Abd El-Ghani, M.M.; El-Sawaf, N. The coastal roadside vegetation and environmental gradients in the arid lands of Egypt. Community Ecol. 2005, 6, 143–154. [Google Scholar] [CrossRef] [Green Version]
  17. Gelbard, J.l.; Belnap, J. Roads as conduits for exotic plant invasions in a semiarid landscape. Conserv. Biol. 2003, 17, 420–432. [Google Scholar] [CrossRef]
  18. Sullivan, J.J.; Williams, P.A.; Timmins, S.M.; Mark, C.; Smale, M.C. Distribution and spread of environmental weeds along New Zealand roadsides. New Zeal. J. Ecol. 2009, 33, 190–204. [Google Scholar]
  19. Abd El-Ghani, M.M.; Salama, F.M.; El-Tayeh, N.A. Desert roadside vegetation in eastern Egypt and environmental determinants for its distribution. Phytol. Balcan. 2013, 19, 233–242. [Google Scholar]
  20. Solbrig, O.T. The origin and function of biodiversity. Environ. Sci. Policy Sustain. Dev. 1991, 33, 16–38. [Google Scholar] [CrossRef]
  21. Kassas, M.; Batanouny, K.H. Plant ecology in Sahara Desert. In Sahara Desert; Cloudsley-Thompson, J., Ed.; Pergamon Press: Oxford, UK, 1984; pp. 77–90. [Google Scholar]
  22. Abd El-Ghani, M.M.; Huerta-Martínez, F.M.; Hongyan, L.; Qureshi, R. Plant Responses to Hyperarid Desert Environments; Springer International Pubisher: Berlin/Heidelberg, Germany, 2017; ISSN 978-3-319-59134-6. [Google Scholar]
  23. Zahran, M.A.; Willis, A.J. The Vegetation of Egypt; Chapman and Hall: London, UK, 1992. [Google Scholar]
  24. Galal, T.M.; Fahmy, A.G. Plant diversity and community structure of Wadi Gimal protected area, Red Sea Coast of Egypt. Afr. J. Ecol. 2012, 50, 266–276. [Google Scholar] [CrossRef]
  25. Alatar, A.; El-Sheikh, M.A.; Thomas, J. Vegetation analysis of Wadi Al-Jufair, a hyper-arid region in Najd, Saudi Arabia. Saudi J. Biol. Sci. 2012, 19, 357–368. [Google Scholar] [CrossRef] [Green Version]
  26. Kadmon, R.; Danin, A. Distribution of plant species in Israel in relation to spatial variation in rainfall. J. Veg. Sci. 1999, 10, 421–432. [Google Scholar] [CrossRef]
  27. Li, B.; Wang, L.; Kaseke, K.F.; Vogt, R.; Li, L.; Seely, M.K. The impact of fog on soil moisture dynamics in the Namib Desert. Adv. Water Resour. 2018, 113, 23–29. [Google Scholar] [CrossRef] [Green Version]
  28. Arshad, M.; Ul-Hussan, A.; Ashraf, M.Y.; Noureen, S.; Moazzam, M. Edaphic factors and distribution of vegetation in the cholistan desert, pakistan. Pak. J. Bot. 2008, 40, 1923–1931. [Google Scholar]
  29. Shupe, S.M. Multivariate characterization of Sonoran Desert vegetation in southwest Arizona using US Army field data. Plant Ecol. 2005, 176, 215–235. [Google Scholar] [CrossRef]
  30. Abdi, M.; Afsharzadeh, S. An analysis of vegetation and species diversity patterns in sand dune and gravel desert ecosystem. Bot. Sci. 2016, 94, 499–511. [Google Scholar] [CrossRef] [Green Version]
  31. Kassas, M.; Imam, M. Habitat and plant communities in the Egyptian desert, III. The Wadi Bed Ecosystem, J. Ecol. 1954, 42, 424–441. [Google Scholar]
  32. Hassib, M. Distribution of plant communities in Egypt. Bull. Fac. Sci. Univ. Fouad 1 Cairo Egypt 1951, 29, 59–261. [Google Scholar]
  33. Abdelaal, M. Current status of the floristic composition in Wadi Hagul, Northwest Suez Gulf, Egypt. Rend. Fis. Acc. Lincei 2017, 28, 81–92. [Google Scholar] [CrossRef]
  34. Hassan, M.O.; Hassan, Y.M. Effect of human activities onfloristic composition and diversity of desert and urban vegetation in a new urbanized desert ecosystem. Heliyon 2019, 5, e02283. [Google Scholar] [CrossRef] [PubMed] [Green Version]
  35. Biswas, S.R.; Mallik, A.U. Disturbance effects on species diversity and functional diversity in riparian and upland plant communities. Ecology 2010, 91, 28–35. [Google Scholar] [CrossRef] [PubMed]
  36. Kassas, M.; Imam, M. Habitat and plant communities in the Egyptian Desert. J. Ecol. 1959, 47, 289–310. [Google Scholar] [CrossRef]
  37. Kassas, M.; El-Abyad, M.S. On the phytosociology of the desert vegetation of Egypt. Ann. Arid Zone 1962, 1, 54–83. [Google Scholar]
  38. Zahran, M.A.; Willis, A.J. The Vegetation of Egypt, 2nd ed.; Springer Science+Business Media: London, UK, 2009. [Google Scholar]
  39. Hassan, L.M. Plant life in the Digla conserved area, hyperarid desert, Egypt. Online J. Biol. Sci. 2002, 2, 533–537. [Google Scholar]
  40. Said, R. The Geology of Egypt; Pergamon Press: Oxford, UK; New York, NY, USA; Seoul, Korea; Tokyo, Japan, 1990; p. 593. [Google Scholar]
  41. Eid, R.A.H. Approaching Industrial and Environmental Reform for Shaq Al-Thu’ban Marble and Granite Industrial Cluster; The American University in Cairo: Cairo, Egypt, 2011; 158p. [Google Scholar]
  42. Emberger, L. Rapport sur les régions arides et semi- arides de l’Afrique du Nord; Union Int. Soc. Biologiques, Série B, Colloques: Paris, France, 1951; Volume 9, pp. 50–61. [Google Scholar]
  43. El-Sheikh, M.A. Weed vegetation ecology of arable land in Salalah, Southern Oman. Saudi J. Biol. Sci. 2013, 20, 291–304. [Google Scholar] [CrossRef] [PubMed] [Green Version]
  44. Boulos, L. Flora of Egypt; Checklist; Al Hadara Publishing: Cairo, Egypt, 1995. [Google Scholar]
  45. Boulos, L. Flora of Egypt; Vol. 1 (Azollaceae—Oxalidaceae); Al-Hadara Publishing: Cairo, Egypt, 1999. [Google Scholar]
  46. Boulos, L. Flora of Egypt; Vol. 2 (Geraniaceae—Boraginaceae); Al-Hadara Publishing: Cairo, Egypt, 2000. [Google Scholar]
  47. Boulos, L. Flora of Egypt; Vol. 3 (Verbinaceae—Compositae); Al-Hadara Publishing: Cairo, Egypt, 2002. [Google Scholar]
  48. Boulos, L. Flora of Egypt; Vol. 4 (Monocotyledons: Alismataceae—Orchidaceae); AL Hadara Publishing: Cairo, Egypt, 2005. [Google Scholar]
  49. Boulos, L. Flora of Egypt; Checklist Revised. Annotated Edition; Al Hadara Publishing: Cairo, Egypt, 2009; pp. 29–30. [Google Scholar]
  50. Raunkiaer, C. The Plant Life Forms and Statistical Plant Geography; Clarendon Press: Oxford, UK, 1934. [Google Scholar]
  51. Pansu, M.; Gautheyrou, J. Handbook of Soil Analysis: Mineralogical, Organic and Inorganic Methods; Springer: Berlin/Heidelberg, Germany, 2007; ISBN1 10 3540312102. ISBN2 13 9783540312109. [Google Scholar]
  52. Davey, B.G.; Bembrick, M.J. The potentiometric estimation of chloride in water extracts of soils. Soil Sci. Soc. Amer. Proc. 1969, 33, 385–387. [Google Scholar] [CrossRef]
  53. Allen, S.E.; Grimshaw, H.M.; Parkinson, J.A.; Quarmby, C. Chemical Analysis of Ecological Materials; Blackwell Scientific Publication: Oxoford, UK, 1974; 565p. [Google Scholar]
  54. Upadhyay, R.M.; Sharma, N.L. Manual of Soil, Plant, Water and Fertilizer Analysis; Kalyani Publishers: New Delhi, India, 2005. [Google Scholar]
  55. McCune, B.; Mefford, M.J. PC-ORD for Windows. Multivariate Analysis of Ecological Data; Version 4.14. User’s Guide; MjM Software: Oregon, USA, 1999. [Google Scholar]
  56. Orlóci, L. Multivariate Analysis in Vegetation Research, 2nd ed.; W. Junk, B.V. Publishers: The Hague, The Netherlands; Boston, MA, USA, 1978. [Google Scholar]
  57. Dufrêne, M.; Legendre, P. Species assemblages and indicator species: The need for a flexible asymmetrical approach. Ecol. Monogr. 1997, 67, 345–366. [Google Scholar] [CrossRef]
  58. Ter Braak, C.J.F. CANOCO, version 4.52; Wageningen University and Research Centre: Wageningen, The Netherlands, 2003. [Google Scholar]
  59. SPSS. SPSS Interactive Graphics 10.0, A Comprehensive System for Analyzing Data; SPSS Incorporation: Chicago, IL, USA, 1999. [Google Scholar]
  60. Hill, M.O.; Gauch, H.G. Detrended Correspondence Analysis: An improved ordination technique. Vegetatio 1980, 42, 47–58. [Google Scholar] [CrossRef]
  61. Ter Braak, C.F.J.; Verdonschot, P.F.M. Canonical correspondence analysis and the related multivariate methods in aquatic ecology. Aquat. Sci. 1995, 57, 254–289. [Google Scholar] [CrossRef]
  62. Rao, C.R. The use and interpretation of principal component analysis in applied research. Sankhya A 1964, 26, 329–350. [Google Scholar]
  63. Jongman, R.H.G.; ter Braak, C.J.F.; van Tregen, O.F.R. Data Analysis in Community and Landscape Ecology; Cambridge University Press: Cambridge, UK, 1997. [Google Scholar]
  64. Zar, J.H. Biostatistical Analysis, 4th ed.; Prentice Hall: Upper Saddle River, NJ, USA, 1999. [Google Scholar]
  65. Ter Braak, C.J.F.; Šmilauer, P. CANOCO Reference Manual and Cano Draw for Windows User’s Guide: Software for Canonical Community Ordination, version 4.5; Microcomputer power: Ithaca, NY, USA, 2002; 500p. [Google Scholar]
  66. Ter Braak, C.J.F. Canonical community ordination. Part 1. Basic theory and linear methods. Ecoscience 1994, 1, 127–140. [Google Scholar] [CrossRef]
  67. Borcard, D.; Legendre, P.; Drapeau, P. Partialling out the spatial component of ecological variation. Ecology 1992, 73, 1045–1055. [Google Scholar] [CrossRef] [Green Version]
  68. Pielou, E.C. Ecological Diversity; Wiley: New York, NY, USA, 1975; p. 165. [Google Scholar]
  69. Magurran, A.E. Ecological Diversity and Its Measurement; Chapman and Hall: London, UK, 1988; 179p. [Google Scholar]
  70. Mahdavi, P.; Akhani, H.; Van der Maarel, E. Species diversity and life-form patterns in steppe vegetation along a 3000 m altitudinal gradient in the Alborz Mountains, Iran. Folia Geobot. 2013, 48, 7–22. [Google Scholar] [CrossRef]
  71. Zhang, Y.; Chen, H.Y.H.; Taylor, A.R.; Ostertag, R. Positive species diversity and above-ground biomass relationships are ubiquitous across forest strata despite interference from overstorey trees. Funct. Ecol. 2017, 31, 419–426. [Google Scholar] [CrossRef]
  72. Whittaker, R.H. Evolution of species diversity in land communities. Evol. Biol. 1977, 10, 1–67. [Google Scholar]
  73. Abd El-Ghani, M.M.; Salama, F.M.; Salem, B.; El-Hadidy, A.; Abdel-Aleem, M. Biogeographical relations of a hyperarid desert flora in eastern Egypt. Afr. J. Ecol. 2014, 52, 173–191. [Google Scholar] [CrossRef]
  74. Hassan, L.M. Studies on the Flora of Eastern Desert, Egypt. PhD Thesis, Faculty of Science, Cairo University, Giza, Egypt, 1987. [Google Scholar]
  75. Tadros, T.M. Osmotic pressure of Egyptian desert plants in relation to their water supply. Bull. Fac. Sci. Cairo Univ. 1936, 7, 1–35. [Google Scholar]
  76. El-Adawy, H.A. Variation of Population Dynamics and Phenology of Desert Plant Communities. PhD Thesis, Cairo University, Giza, Egypt, 2011. [Google Scholar]
  77. Ter Braak, C.J.F. Canonical correspondence analysis: A new eigenvector technique for multivariate direct gradient analysis. Ecology 1986, 67, 1167–1179. [Google Scholar] [CrossRef] [Green Version]
  78. El-Ghanem, W.A.; Hassan, L.M.; Galal, T.M.; Badr, A. Floristic composition and vegetation analysis in Hail region north of central Saudi Arabia. Saudi J. Biol. Sci. 2010, 17, 119–128. [Google Scholar] [CrossRef] [Green Version]
  79. Shaheen, H.; Qureshi, R.; Akram, A.; Gulfraz, M.; Potter, D. A preliminary floristic checklist of Thal desert Punjab, Pakistan. Pak. J. Bot. 2014, 46, 13–18. [Google Scholar]
  80. Salama, F.M.; Abd El-Ghani, M.M.; Amro, A.A.E.R.; Gaafar, A.E.S.; Abd El Galil, A.A.E.M. Vegetation dynamics and species diversity in a Saharan Oasis. Egypt. Not. Scient. Biol. 2018, 10, 363–372. [Google Scholar] [CrossRef] [Green Version]
  81. Croce, A.; Stinca, A.; Santangelo, A.; Esposito, A. Exploring vascular flora diversity of two protected sandy coastal areas in southern Italy. Rend. Fis. Acc. Lincei 2019, 30, 323–336. [Google Scholar] [CrossRef]
  82. McIntyre, S.; Lavorel, S.; Trémont, R.M. Plant life-history attributes: Their relationship to disturbance response in herbaceous vegetation. J. Ecol. 1995, 83, 31–44. [Google Scholar] [CrossRef]
  83. Sternberg, M.; Shoshany, M. Aboveground biomass allocation and water content relationships in Mediterranean trees and shrubs at two climatological regions in Israel. Plant Ecol. 2001, 157, 171–179. [Google Scholar] [CrossRef]
  84. Hosni, H.A.; Hegazy, A.K. Contribution to the flora of Asir, Saudi Arabia. Candollea 1996, 51, 169–202. [Google Scholar]
  85. Shaltout, K.H.; Sheded, M.G.; Salem, A.M. Vegetation spatial heterogeneity in a hyper arid biosphere reserve area in North Africa. Acta Bot. Croat. 2010, 69, 31–46. [Google Scholar]
  86. Abd El-Ghani, M.M.; Bornkamm, R.; El-Sawaf, N.; Turky, H. Heterogeneity of Soil and Vegetation in the Urban Habitats of New Industrial Cities in the Desert Landscape of Egypt. Not. Scient. Biol. 2015, 7, 26–36. [Google Scholar] [CrossRef]
  87. Sans, F.X.; Masalles, R.M. Phenological patterns in an arable land weed community related to disturbance. Weed Res. 1995, 35, 321–332. [Google Scholar] [CrossRef]
  88. Abd El-Ghani, M.M. Floristics and environmental relations in two extreme desert zones of western Egypt. Global Ecol. Biogeogr. 2000, 9, 499–516. [Google Scholar] [CrossRef]
  89. Abd El-Ghani, M.M. Environmental correlates of species distribution in arid desert ecosystems of eastern Egypt. J. Arid Environ. 1998, 38, 297–313. [Google Scholar] [CrossRef]
  90. Salama, F.M.; Abd El-Ghani, M.M.; Gadallah, M.; El-Naggar, S.M. Amro, Diversity and responses of plant functional groups to soil variables in the arid desert landscape of southern Egypt. J. Biodivers. Ecol. Sci. 2016, 5, 24–38. [Google Scholar]
  91. Abdel Khalik, K.; Al-Gohary, I.; Al-Sodany, Y. Floristic composition and vegetation: Environmental relationships of Wadi Fatimah, Mecca, Saudi Arabia. Arid Land Res. Manag. 2017, 31, 316–334. [Google Scholar] [CrossRef]
  92. Zhang, Y.; Chen, J.; Wang, X.; Pann, H.; Gu, Z.; Ban, B. The distribution pattern of biological soil crust in the Gurbantunggut Desert. Acta Geogr. Sin. 2005, 60, 53–60. [Google Scholar]
  93. Medeiros, A.S.; Drezner, T.D. Vegetation, climate, and soil relationships across Sonoran Desert. Ecoscience 2012, 19, 148–160. [Google Scholar] [CrossRef]
  94. Feng, Y.; Jia-Qiang, L.; Xing-Wen, X.; Bo-Rong, P. Composition and characteristics of Libyan flora. Arch. Biol. Sci. 2013, 65, 651–657. [Google Scholar]
  95. Baameur, M.; Abdelguerfi, A.; Bouhoun, D.M.; Saadi, H.; El Hadj, O.M. Distribution study of some species of spontaneous Flora in two Saharan Regions of the North-East of Algeria (Ouargla and Ghardaïa). Int. J. Biodivers. Conserv. 2015, 7, 41–49. [Google Scholar] [CrossRef] [Green Version]
  96. Salama, F.M.; Abd El-Ghani, M.M.; El-Naggar, S.M.; Baayo, K.A. Floristic composition and chorological analysis of the Sallum area, west Mediterranean, Egypt. J. Union Arab Biol. Cairo 2003, 13, 27–47. [Google Scholar]
  97. Abd El-Ghani, M.M.; Abdel-Khalik, K.N. Floristic diversity and phytogeography of Gebel Elba National Park, south-east Egypt. Turk. J. Bot. 2006, 30, 121–136. [Google Scholar]
  98. Zohary, M. Geobotanical Foundation of the Middle East; Gus. Fischer-Verlag: Stuttgart, Germany, 1983. [Google Scholar]
  99. White, F.; Leonard, J. Phytogeographical links between Africa and southwest Asia. Flora Veg. Mundi 1991, 9, 229–246. [Google Scholar]
  100. Kürschner, H.; Neef, R. A first synthesis of the flora and vegetation of the Tayma oasis and surroundings (Saudi Arabia). Plant Divers. Evol. 2011, 129, 27–58. [Google Scholar] [CrossRef]
  101. Legendre, P.; Legendre, L. Numerical Ecology, 2nd ed.; Elsevier B.V.: Amsterdam, The Netherlands, 1998. [Google Scholar]
  102. Pillar, V.D. How sharp are classifications? Ecology 1999, 80, 2508–2516. [Google Scholar] [CrossRef]
  103. McCune, B.; Grace, J.B.; Urban, D.L. Analysis of Ecological Communities; MjM Software Design: Gleneden Beach, OR, USA, 2002; 300p. [Google Scholar]
  104. Fossati, J.; Pautou, G.; Peltier, J.P. Wadi vegetation of the North-Eastern desert of Egypt. Feddes Repert. 1998, 109, 313–327. [Google Scholar] [CrossRef]
  105. Salama, F.; Abd El-Ghani, M.M.; El-Tayeh, N.; Amro, A.; Gaafar, A.; Abd El Galil, A. Assessing the role of environmental gradients on the phytodiversity in Kharga Oasis of Western Desert, Egypt. Jordan J. Biol. Sci. 2019, 12, 421–434. [Google Scholar]
  106. Salama, F.M.; Abd El-Ghani, M.M.; El Naggar, S.M.; Baayo, K.A. Vegetation structure and environmental gradients in the Sallum area, Egypt. Ecol. Medit. 2005, 31, 15–32. [Google Scholar] [CrossRef]
  107. Abd El-Ghani, M.M.; Amer, W.M. Soil-vegetation relationships in a coastal desert plain of southern Sinai, Egypt. J. Arid Environ. 2003, 55, 607–628. [Google Scholar] [CrossRef]
  108. Salama, F.M.; Abd El-Ghani, M.M.; El-Tayeh, N. Vegetation and soil relationships in the inland wadi ecosystem of central Eastern Desert Egypt. Turk. J. Bot. 2013, 37, 489–498. [Google Scholar]
  109. Tielbörger, K. The vegetation of linear desert dunes in the north-western Negev, Israel. Flora 1997, 192, 261–278. [Google Scholar] [CrossRef]
  110. Noy-Meir, I. Desert ecosystems: Environment and producers. Annu. Rev. Ecol. Syst. 1973, 4, 25–51. [Google Scholar] [CrossRef]
  111. Epstein, H.E.; Lauenroth, W.K.; Burke, I.C.; Coffin, D.P. Ecological responses of dominant grasses along two climatic gradients in the great plains of the United States. J. Veg. Sci. 1996, 7, 777–788. [Google Scholar] [CrossRef]
  112. Duckworth, J.C.; Bunce, R.G.H.; Malloch, A.J.C. Vegetation environment relationships in Atlantic European calcareous grasslands. J. Veg. Sci. 2000, 11, 15–22. [Google Scholar] [CrossRef]
  113. Amezaga, I.; Mendarte, S.; Albizu, I.; Besga, G.; Garbisu, C.; Onaindia, M. Grazing intensity, aspect, and slope effects on lime-stone grassland structure. Rangeland Ecol. Manag. 2004, 57, 606. [Google Scholar] [CrossRef]
  114. Zheng, Y.; Xie, Z.; Jiang, L.; Shimizu, H.; Rimmington, G.; Zhou, G. Vegetation responses along environmental gradients on the Ordos plateau, China. Ecol. Res. 2006, 21, 396–404. [Google Scholar] [CrossRef]
  115. Arekhi, S.; Heydari, M.; Pourbabaei, H. Vegetation-environmental relationships and ecological species groups of the Ilam Oak forest landscape, Iran. Caspian J. Env. Sci. 2010, 8, 115–125. [Google Scholar]
  116. Kargar-Chigani, H.; Javadi, S.A.; Zahedi-Amiri, G.; Khajeddin, J.; Jafari, M. Vegetation composition differentiation and species-environment relationships in the northern part of Isfahan Province, Iran. J. Arid Land 2017, 9, 161–175. [Google Scholar] [CrossRef] [Green Version]
  117. Abrams, P.A. Monotonic or unimodal diversity-productivity gradients: What does competition theory predict? Ecology 1995, 76, 2019–2027. [Google Scholar] [CrossRef]
  118. Yair, A.; Sharon, D.; Lavee, H. Trends in runoff and erosion processes over an arid limestone hillside, North Negev, Israel. Hydrolog. Sci. Bull. 1980, 25, 243–255. [Google Scholar] [CrossRef] [Green Version]
  119. Mashaly, I.A. Vegetation-soil relationships in lake borollus protected area, Egypt. Am. Eurasian J. Agric. Environ. Sci. 2006, 1, 229–238. [Google Scholar]
  120. He, M.Z.; Zheng, J.G.; Li, X.R.; Qian, Y.L. Environmental factors affecting vegetation composition in the Alxa Plateau, China. J. Arid Environ. 2007, 69, 473–489. [Google Scholar] [CrossRef]
  121. Zuo, X.A.; Wang, S.K.; Zhao, X.Y.; Lian, J. Scale dependence of plant species richness and vegetation-environment relationship along a gradient of dune stabilization in Horqin Sandy Land, Northern China. J. Arid Land 2014, 6, 334–342. [Google Scholar] [CrossRef] [Green Version]
  122. Huerta-Martínez, F.M.; García-Moya, E.; Flores-Flores, J.L.; Pi-mienta-Barrios, E. Ordenación de las poblaciones silves-tres de pitayo y cardón en la Cuenca de Sayula, Jalisco. Boletínde la Soc. Botánica de México 1999, 64, 11–24. [Google Scholar]
  123. El-Khatib, A.A.; Abd El-Ghani, M.M.; El-Sayed, K.N. Soil-vegetation relationship and distribution of Convolvulus in Egypt. Feddes Repert. 1998, 109, 175–185. [Google Scholar] [CrossRef]
  124. Abd El-Ghani, M.M.; Bornkamm, R.; El-Sawaf, N.; Turky, H. Plant species distribution and spatial habitat heterogeneity in the landscape of urbanizing desert ecosystem of Egypt. Urban Ecosyst. 2011, 14, 585–616. [Google Scholar] [CrossRef]
  125. Hassan, M.O. Leaf litter of Bombax ceiba L. threatens plant cover and floristic diversity in a new urban ecosystem. Flora 2018, 242, 22–30. [Google Scholar] [CrossRef]
  126. Forman, R.T.; Alexander, L.E. Roads and their major ecological effects. Annu. Rev. Ecol. Syst. 1998, 29, 207–231. [Google Scholar] [CrossRef] [Green Version]
  127. Davis, M.A.; Grime, J.P.; Thompson, K. Fluctuating resources in plant communities: A general theory of invasibility. Ecology 2000, 88, 528–534. [Google Scholar] [CrossRef] [Green Version]
  128. Huerta-Martínez, F.M.; Vázquez-García, J.A.; García-Moya, E.; López-Mata, L.; Vaquera-Huerta, H. Vegetation ordination at the southern Chihuahuan Desert (San Luis Potosi, Mexico). Plant Ecol. 2004, 174, 79–87. [Google Scholar] [CrossRef]
  129. Zuo, X.A.; Zhao, X.Y.; Zhao, H.L.; Zhang, T.; Li, Y.; Wang, S.; Li, W.; Powers, R. Scale dependent effects of environmental factors on vegetation pattern and composition in Horqin Sandy Land, Northern China. Geoderma 2012, 173–174, 1–9. [Google Scholar] [CrossRef]
  130. Wang, J.H.; Zhou, S.W.; Ren, P.Z. Studies on the species diversity of plant communities and their ecotopes in the northeastern Ulan Buh Desert. J. Desert Res. 1996, 16, 258–265. [Google Scholar]
  131. Ali, E.A.; Kafkafi, U.; Yamaguchi, I.; Sugimoto, Y.; Inanga, S. Growth, transpiration, cytokinins and gibberellins, nutrient compositional changes in sesame exposed to low root-zone temperature under different ratios of nitrate: Ammonium supply. J. Plant Nutr. 2000, 23, 123–140. [Google Scholar] [CrossRef]
  132. Wilson, M.V.; Shmida, A. Measuring beta diversity with presence–absence data. J. Ecol. 1984, 72, 1055–1064. [Google Scholar] [CrossRef]
  133. Vázquez García, J.A.; Givnish, T.J. Altitudinal gradients in tropical forest composition, structure, and diversity in the Sierra de Manantlán. J. Ecol. 1998, 86, 999–1020. [Google Scholar]
Figure 1. Location map showing the Cairo-Suez road and Wadi Degla protected area (shaded in brown).
Diversity 13 00157 g001
Figure 2. Spectrum of life forms in the studied areas. Ch = chamaephytes, H = hemicryptophytes, Ph = phanerophytes, Th = therophytes, Pa = parasites, Cr = cryptophytes, G = geophytes.
Diversity 13 00157 g002
Figure 3. Cluster analysis of the vegetation of the Cairo-Suez road (A) and Wadi Degla protected area (B), with their vegetation groups (I–VIII).
Diversity 13 00157 g003
Figure 4. Ordination diagrams of CCA for the Cairo-Suez road (A) and RDA for the Wadi Degla protected area (B), together with the soil factors (solid arrows), anthropogenic variables (dotted arrows), species (Latin name abbreviations), and vegetation groups (I–VIII). Species abbreviations (A and B): D har = Diplotaxis harra, P aus = Phragmites australis, P und = Pulicaria undulata, Z sim = Zygophyllum simplex, C pro = Calotropis procera, L nud = Launaea nudicaulis, P dio = Pluchea dioscoridis, T nil = Tamarix nilotica, F ara = Fagonia arabica, A art = Anabasis articulata, H sal = Haloxylon salicornicum, Z coc = Zygophyllum coccineum, D tor = Deverra tortuosa, Z spi = Zilla spinosa, F aeg = Farsetia aegyptia, O bac = Ochradenus baccatus, A tor = Acacia tortilis, R rae = Retama raetam, L spi = Launaea spinosa, E ala = Ephedra alata, I muc = Iphiona mucronata, L pru = Limonium pruinosum, F mol = Fagonia mollis, F. bru = Fagonia brugieri, A jud = Artemisia judaica, E oxy = Erodium oxyrrhynchum, H bac = Heliotropium bacciferum, R hir = Reaumuria hirtella, C dac = Cynodon dactylon, S mon = Suaeda monoica, S aeg = Stachys aegyptiaca, E spi = Echinops spinosus, C phe = Cistanche phelypaea, G cap = Gypsophila capillaris, C spi = Capparis spinosa, A dim = Atriplex dimorphostegia, L hir = Lasiurus hisutus (= L. scindicus), T afr = Trichodesma africanum, Z alb = Zygophyllum album, S des = Scrophularia deserti, O cer = Orobanche cernua. Anthropogenic variables abbreviations: OC = over-collection, LD = land degradation, OG = over-grazing, MA = military activities, IS = introduced species, UR = urbanization, SW = solid wastes.
Diversity 13 00157 g004
Figure 5. The changes in the numbers of annual and perennial species over the past 55 years (1962–2017) affected by the amount of rainfall (mm).
Diversity 13 00157 g005
Figure 6. Satellite images of the Cairo-Suez desert road comparing occupations along its sides in 1990 (A) and in 2017 (B) due to various human activities, especially urban sprawl.
Diversity 13 00157 g006
Table 1. Comparison between the numbers of species recorded and Sørensen’s similarity indices between the current and earlier studies in the two areas under investigation.
(A) Cairo-Suez road (SR)
Authors of Earlier StudiesKassas and El-Abyad (1962)Hassan (1987)Abd El-Ghani et al. (2014)Number of Species
Kassas and El-Abyad (1962) 102
Hassan (1987)53 235
Abd El-Ghani et al. (2014)5253 113
Current study (2017)39274247
(B) Wadi Degla protected area (WD)
Authors of Earlier StudiesTadros (1936)Imam and Kassas (1954)Hassan (2002)El-Adawy (2011)Number of Species
Tadros (1936) 17
Imam and Kassas (1954)37 37
Hassan (2002)305 75
El-Adawy (2011)274477 88
Current study (2017)3853736358
Table 2. Summary of indicator species analysis (ISA) showing the most significant indicator species per vegetation group (I–VIII). Figures are indicator values (IV% of perfect indication based on combining values for relative abundance and relative frequency, and p-values of most significant indicator species per vegetation group. p-value = Monte Carlo test of significance of the observed maximum indicator value for each species, based on 999 randomizations). The highest indicator values are in bold type.
Vegetation GroupIIIIIIIVVVIVIIVIIIp-ValueSpecies Abbreviations
Number of Sample Plots33443242
Group I (3 significant indicator species)
Calotropis procera (Aiton) W.T. Aiton6700000000.040C pro
Phragmites australis (Cav.) Trin.ex Steud.6700000000.040P aus
Pulicariaundulata (Lam.) DC.6700000000.037P und
Group II (1 significant indicator species)
Haloxylon salicornicum (Moq.) Bunge276722700070.022H sal
Group III (2 significant indicator species)
Ochradenus baccatus Delile00551717717270.014O bac
Zygophyllum coccineum L.00712212017220.041Z coc
Group IV (3 significant indicator species)
Acacia tortilis (Forssk.) Hayne subsp. raddiana (Savi) Brenan0065600000.046A tor
Panicum turgidum Forssk.01005200000.050P tur
Launaea spinosa (Forssk.) Sch. Bip. ex Kuntze0007500000.025L spi
Group V (2 significant indicator species)
Artemisia judaica L.00003821000.016A jud
Reaumuria hirtella Jaub. and Spach000036172000.022R hir
Group VI (1 significant indicator species)
Heliotropium bacciferum Forssk.0000080500.013H bac
Group VII (2 significant indicator species)
Lasiurus scindicus Henrard00004971350.038L sci
Nitraria retusa (Forssk.) Asch.0000005000.044N ret
Group VIII (2 significant indicator species)
Orobanche cernua Loefl.0000005800.021O cer
Fagonia bruguieri DC.00006140550.049F bru
Table 3. Mean values, standard deviations (±SD) and ANOVA F-values of the soil variables, anthropogenic factors, and diversity indices in the sample plots representing the four vegetation groups obtained by cluster analysis of the Cairo-Suez road unprotected area (SR). Abbreviations of soil factors: OM = organic matter, pH = soil reaction, EC = electrical conductivity. Significant differences: * p ≤ 0.05, ** p ≤ 0.01. Categories of anthropogenic activities: H = high, M = moderate, L = low.
Total MeanVegetation GroupsF-Ratiop-Value
IIIIIIIV
Total Number of Sample Plots3344
Soil Variables
Sand (%)93.1 ± 1.592.3 ± 2.194.0 ± 0.593.7 ± 0.992.4 ± 2.03.060.08
Silt (%)1.5 ± 0.21.8 ± 0.31.3 ± 0.11.4 ± 0.11.6 ± 0.14.06 *0.04
Clay (%)5.3 ± 1.55.8 ± 2.04.6 ± 0.44.9 ± 0.86.0 ± 2.12.650.10
OM (%)0.4 ± 0.20.23 ± 0.10.7 ± 0.20.4 ± 0.10.3 ± 0.23.330.06
pH7.6 ± 0.37.7 ± 0.18.0 ± 0.037.6 ± 0.17.4 ± 0.418.17 **0.001
EC (dS m−1)2.0 ± 0.91.7 ± 1.13.0 ± 0.22.03 ± 0.31.5 ± 0.92.120.16
Na+ (meq L−1)8.7 ± 3.87.1 ± 4.1213.6 ± 2.38.5 ± 1.06.31 ± 3.52.730.09
K+ (meq L−1)1.4 ± 0.70.9 ± 1.01.8 ± 0.41.6 ± 0.41.2 ± 0.80.760.57
Ca2+ (meq L−1)5.4 ± 2.24.8 ± 3.07.8 ± 0.35.4 ± 0.53.9 ± 2.31.840.20
Mg2+ (meq L−1)4.3 ± 2.03.7 ± 2.76.4 ± 0.34.9 ± 0.93.1 ± 2.21.550.27
Cl (meq L−1)11.5 ± 5.28.4 ± 5.118.5 ± 2.611.7 ± 1.68.4 ± 4.73.46 *0.05
HCO3(meq L−1)5.6 ± 2.25.0 ± 3.07.7 ± 0.35.8 ± 0.74.1 ± 2.61.330.33
CO32− (meq L−1)0.3 ± 0.40.2 ± 0.30.5 ± 0.50.3 ± 0.40.2 ± 0.30.540.71
SO42− (meq L−1)2.6 ± 1.43.02 ± 2.63.5 ± 0.72.1 ± 0.32.0 ± 1.50.730.59
Anthropogenic Factors
Over-collection (OC)1.93 ± 0.6 1.00 ± 0.0 (L)1.0 ± 0.5 (L)1.3 ± 0.6 (L)2.5 ± 0.6 (H)3.07 *0.03
Over-grazing (OG)1.36 ± 0.71.00 ± 0.0 (L)1.0 ±0.0 (L)1.2 ± 0.5 (L)2.0 ± 1.2 (H)4.50 *0.01
Introduced species (IS)1.21 ± 1.01.67 ± 1.2 (M)0.7 ±1.2 (L)1.0 ± 0.8 (L)1.7 ± 1.3 (M)2.21 *0.04
Land degradation (LD)1.50 ± 0.91.00 ± 0.0 (L)1.7 ± 1.2 (M)1.2 ± 0.5 (L)0.7 ± 1.0 (L)1.260.17
Urbanization (UR)1.43 ± 1.11.50 ± 1.2 (M)1.3 ± 1.2 (L)1.2 ± 1.5 (L)1.7 ± 1.0 (M)6.10 **0.009
Solid wastes (SW)1.36 ± 1.11.00 ± 1.0 (L)2.3 ± 1.2 (H)0.7 ± 1.0 (L)0.7 ± 1.0 (L)1.590.40
Military activities (MA)1.29 ± 1.10.33 ± 0.6 (L)1.2 ± 1.5 (L)2.5 ± 0.6 (H)1.0 ± 1.3 (L)1.760.22
Diversity Indices
Species richness (α-diversity)6.9 ± 4.59.7 ± 2.51.7 ± 1.24.0 ± 1.4 11.7 ± 1.329.76 **0.001
Shannon–Wiener index (H’)1.6 ± 0.92.2 ± 0.30.4 ± 0.61.3 ± 0.32.4 ± 0.122.81 **0.002
Table 4. Mean values, standard deviations (±SD), and ANOVA F-values of the soil variables and diversity indices in the sample plots representing the four vegetation groups obtained by cluster analysis of the Wadi Degla protected area (WD). Abbreviations of soil factors: OM = organic matter, pH = soil reaction, EC = electrical conductivity. Significant differences: * p < 0.05.
Total MeanVegetation GroupsF-Ratiop-Value
VVIVIIVIII
Total Number of Sample Plots3242
Soil Factors
Sand (%)94.8 ± 1.594.6 ± 2.394.7 ± 0.794.36 ± 1.596.35 ± 0.40.7500.56
Silt (%)2.03 ± 0.81.8 ± 0.41.5 ± 0.42.56 ± 1.21.84 ± 0.10.9750.46
Clay (%)3.1 ± 1.23.6 ± 2.13.8 ± 0.33.09 ± 0.61.81 ± 0.51.1640.39
OM (%)0.4 ± 0.20.5 ± 0.30.5 ± 0.20.27 ± 0.20.19 ± 0.031.1110.41
pH7.7 ± 0.17.8 ± 0.18.0 ± 0.17.89 ± 0.037.84 ± 0.022.0020.20
EC (dS m−1)2.9 ± 1.23.0 ± 0.73.0 ± 1.92.36 ± 0.73.94 ± 2.10.7450.56
Na+ (meq L−1)6.3 ± 6.44.9 ± 2.19.3 ± 1.14.31 ± 4.49.68 ± 1.20.4220.74
K+ (meq L−1)1.2 ± 0.41.2 ± 0.51.3 ± 0.81.12 ± 0.21.52 ± 0.50.3310.80
Ca2+ (meq L−1)16.7 ± 6.119.3 ± 6.613.2 ± 4.013.75 ± 2.122.50 ± 10.61.4970.048 *
Mg2+ (meq L−1)5.0 ± 2.04.8 ± 2.46.1 ± 2.64.40 ± 1.95.65 ± 2.30.3360.80
Cl (meq L−1)11.6 ± 7.512.7 ± 5.510.5 ± 9.28.25 ± 3.618.00 ± 15.60.7270.036 *
HCO3 (meq L−1)0.5 ± 0.10.5 ± 0.10.4 ± 0.00.50 ± 0.10.50 ± 0.10.6040.63
SO42− (meq L−1)17.3 ± 5.116.9 ± 3.319.1 ± 9.514.83 ± 4.520.85 ± 5.40.6540.61
Diversity Indices
Species richness α-diversity)28.8 ± 2.426.3 ± 1.531.0 ± 1.428.7 ± 2.130.5 ± 2.13.290.088
Shannon–Wiener index (H’)3.4 ± 0.13.3 ± 0.13.4 ± 0.043.4 ± 0.13.4 ± 0.13.370.084
Publisher’s Note: MDPI stays neutral with regard to jurisdictional claims in published maps and institutional affiliations.

