
Influence of Geographical and Climatic Factors on Quercus variabilis Blume Fruit Phenotypic Diversity


1
Key Laboratory of Cultivation and Protection for Non-Wood Forest Trees, Ministry of Education, Central South University of Forestry and Technology, Changsha 410004, China
2
Paulownia Research and Development Center, State Forestry Administration, Zhengzhou 450003, China
3
Forestry College, Henan Agriculture University, Zhengzhou 450002, China
4
Texas A & M Agri Life Research and Extension Center, 17360 Coit Rd, Dallas, TX 75252, USA
*
Authors to whom correspondence should be addressed.
Diversity 2021, 13(7), 329; https://0-doi-org.brum.beds.ac.uk/10.3390/d13070329
Submission received: 7 June 2021
/
Revised: 15 July 2021
/
Accepted: 15 July 2021
/
Published: 18 July 2021
Abstract
:Quercus variabilis Blume is one of the most ecologically valuable tree species in China and is known to have adaptive mechanisms to climate change. Our objective was to quantify the variation pattern in the fruit morphology of Q. variabilis. Fruit samples were collected from 43 natural populations in autumn of 2019. Our results indicated that the coefficient of variation (CV) of the fruit length (FL) and fruit width (FW) were 10.08% and 11.21%, respectively. There were significant differences in the FL, FW, and fruit length-to-width ratios (FL/FW) among the studied populations. Also, there was a significant positive correlation between the FW and FL. The FL decreased with increasing precipitation in the wettest quarter (PWQ). A concave trend was observed in the variations in FL with the equivalent latitude (ELAT), longitude (LON), annual mean air temperature (MAT), and annual precipitation (AP). A similar concave trend was observed for the FL/FW with LON, MAT, and AP. A positive correlation was observed between the FW, FL and FL/FW, and the ELAT. The cluster analysis revealed five groups of the 43 natural populations. Our study findings suggests that Q. variabilis has high levels of phenotypic plasticity for geographical and climatic factors.
1. Introduction
Phenotypic variation among a population of the same species usually reflects the plant’s response to different environmental pressures [1,2]. The phenotypic diversitycommonly refers to leaf, flower, fruit, and seed morphology [3,4,5,6,7,8]. In general, seed size is considered a component of a co-evolving complex of variables, including plant biomass, dispersal, niche specialization, seed dormancy, and competitiveness [9]. Seed size also affects plant dissemination, settlement, and individual development [10,11]. Seed phenotype is malleable to changes in the environment that allow the plant to be better fitted to environmental conditions [1].
Studying the variation pattern of seed morphology and its relationship with environmental factors helps in the understanding of plant plasticity in response to changes in environmental factors and reveals the role of genetics and the environment in plant ecological adaptation [12]. The diversity of fruit morphology often indicates adaptation to different dispersal modes [13]. Recent research has focused on fruit size differences [14,15] and the relationship between the environment and fruit characteristics [16,17,18]. Maranz and Wiesman [19] found that temperature and rainfall had significant effects on fruit size. Wu et al. [20] indicated that fruit size (length and width) decreased with longitude from west to east. Also, Liu et al. [21] noted an increase in fruit width and fruit weight with longitude, and a gradual decrease with increasing latitude. Leal-Sáenz et al. [22] suggested that populations found in warmer and wetter climates had larger fruits. Soil properties can influence fruit size as well. For instance, the sweet chestnut populations from acidophilic and thermophilic forests were characterized with smaller fruits. In contrast, populations from forests of mesophilic character were characterized with larger fruits [23].
More than 400 species of the genus Quercus L. (Fagaceae) are distributed in the northern hemisphere, and there are 51 species of Quercus in China [24]. Quercus variabilis Blume is an important deciduous broadleaved oak of benefit to the ecology, economy, and culture in China [25,26]. At present, research on Q. variabilis has focused mainly on biological characteristics [27,28], population ecosystems [25], and physiological characteristics [29,30]. In this study, we analyzed the morphological characteristics of fruit from 43 natural populations of Q. variabilis. To understand the morphological variation of Q. variabilis fruits due to environmental influences, we asked: what is the degree of fruit phenotypic diversity within and among populations of Q. variabilis? What are the factors playing key roles in the fruit morphological variation of the Q. variabilis population? Thus, the aim of this study was to quantify the phenotypic diversity of Q. variabilis fruits and the response to climate factors.
2. Materials and Methods
2.1. Study Area
In the geographical distribution area of Q. variabilis in China [31], the climate may be temperate, warm temperate, north subtropical, and south subtropical. The soil types in these regions may be dark brown, cinnamon, yellow, red, and other main zonal soil types [12]. Forty-three typical natural secondary forests of Q. variabilis were selected in seventeen Chinese provinces (Figure S1; Table 1). The geographical span of the selected region ranged between 23.33° N (Honghe Prefecture, Yunnan) and 43.83° N (Urumqi city, Xinjiang), and between 87.62° E (Urumqi city, Xinjiang) and 123.30° E (Liaoyang city, Liaoning). The annual precipitation ranged between 231 mm (Urumqi city, Xinjiang) and 1556 mm (Nanchang city, Jiangxi). The wettest season precipitation ranged from 87 mm in Urumqi, Xinjiang, to 761 mm in Honghe Prefecture, Yunnan. The average temperature was 7.06 °C in Urumqi, Xinjiang, and 17.78 °C in Changsha city, Hunan. The highest monthly temperature ranged from 20.16 °C in Linzhi city, Tibet, to 33.42 °C in Nanchang city, Jiangxi (Table 1).
2.2. Sample Collection
In each forest stand, we selected a study area with healthy Q. variabilis trees and with little to no human interference. We established a 20 m × 20 m plot and recorded the latitude, longitude, and altitude of the test plot [12]. At the peak of fruit maturity in autumn 2019, at least 100 fully developed, disease-free fruits were collected from each plot. Fruits were sterilized by soaking in 5% chlorine bleach for ten minutes [32]. The samples were placed in separate nylon bags and air dried, then stored at 2 °C until the measurements were done [33].
2.3. Geographic Information and Climate Data of the Sample Plot
The climate data for all sites, including the annual mean air temperature (MAT), annual precipitation (AP), maximum temperature of warmest month (MTW), and precipitation of wettest quarter (PWQ), were obtained from the Global Climate and Weather Data website (http://www.worldclim.org (accessed on 15 December 2020)) [34] and are presented in Table 1. We used ArcMap10.8 to extract climate data from the WorldClim data website according to Slave [35]. Due to the large differences in altitude among sites, we converted all latitudes into equivalent latitudes (ELAT), as proposed by Alena et al. [36], in order to determine the true effect of latitude and eliminate the influence of altitude factors. The conversion formulas used are as follows:
equivalent latitude = latitude + (altitude −300)/200 (for altitude lower than 300 m)
equivalent latitude = latitude + (altitude −300)/140 (for altitude greater than 300 m)
2.4. Determination of Fruit Morphological Characters
The fruit width and fruit length of at least 20 fruits in each population were measured by vernier caliper with an accuracy of 0.01 mm [30]. Fruit width (FW) refers to the distance between the widest points on the left and right side of the fruit, and fruit length (FL) refers to the distance from the bottom to the top of the fruit. All measurements were accurate to two decimal places. Each fruit was measured three times and the data was averaged. The fruit length-to-width ratio (FL/FW) of each fruit was also calculated [17].
2.5. Statistical Analysis
First, the main statistics (arithmetic means, maximum value, minimum value, standard deviation, and coefficient of variation) were calculated for the studied characteristics and populations. Second, a oneway analysis of variance (ANOVA), as implemented in SPSS 25.0 software (IBM company, New York, NY, USA), was used to test the differences between the studied populations [37]. Significant differences among means were assessed using Duncan’s multiple comparison at p ≤ 0.05. Origin 2019b software (Origin Lab company, Northampton, MA, USA) was used to quantify the variability in phenotypic traits as influenced by regional climatic factors [38]. To eliminate dimension and the order of magnitude, the original data were standardized, converted into dimensionless data with a mean of 0 and a variance of 1, and then principal component analysis (PC) was performed. Cluster analysis was carried out by the between groups linkage method and measured according to squared Euclidean distance. Canoco5 (Microcomputer Power, New York, NY, USA) was used in the principal component analysis (PCA) of Q. variabilis fruits morphology [39]. These statistical analyses were performed using SPSS 25.0 [1]. Correlation between phenotypic traits and environmental factors were analyzed using Pearson correlation analysis by SPSS 25.0 [40]. In addition, we computed and tested the correlations between: (1) the matrix of geographical distances between pairs of populations and the matrix of morphological differences among populations—the isolation-by-distance pattern [41], and between (2) the matrix of environmental distances and the matrix of morphological differences among populations—the isolation-by-environmental distance [42]. The significance level was assessed after 9,999 permutations, and the simple Mantel test was performed with the R package “Vegan” [43].
3. Results
3.1. Fruit Morphological Characters and Variation Characteristics
The width, length, and length-to-width ratio of fruits were significantly different among the various populations (Table 2 and Table 3). The variation in fruit width among groups ranged between 7.96 mm and 27.17 mm, with an average of 17.35 mm. Fruits from the SXH site had the largest width (20.93 mm), while the smallest fruit width was observed in fruits from ESH (11.70 mm). Fruit length ranged between 9.96 mm and 35.04 mm, with an average of 19.97 mm. The average fruit length was largest in UQX (31.69 mm), and shortest in fruits came from BDH (17.17 mm). Fruit length-to-width ratio of fruits ranged between 0.70 and 2.31, with an average value of 1.17. The mean variation coefficient of fruit width, fruit length, and fruit length-to-width ratio among the different populations were 11.21%, 10.08%, and 14.48%, respectively (Table 2). In addition, we revealed that there was a significant correlation between Q. variabilis fruit width and fruit length of Q. variabilis (R2 = 0.17, p ≤ 0.0001) (Figure S2).
3.2. The Relationship in the Variation Pattern between Fruit Morphology and Geographical and Environmental Factors
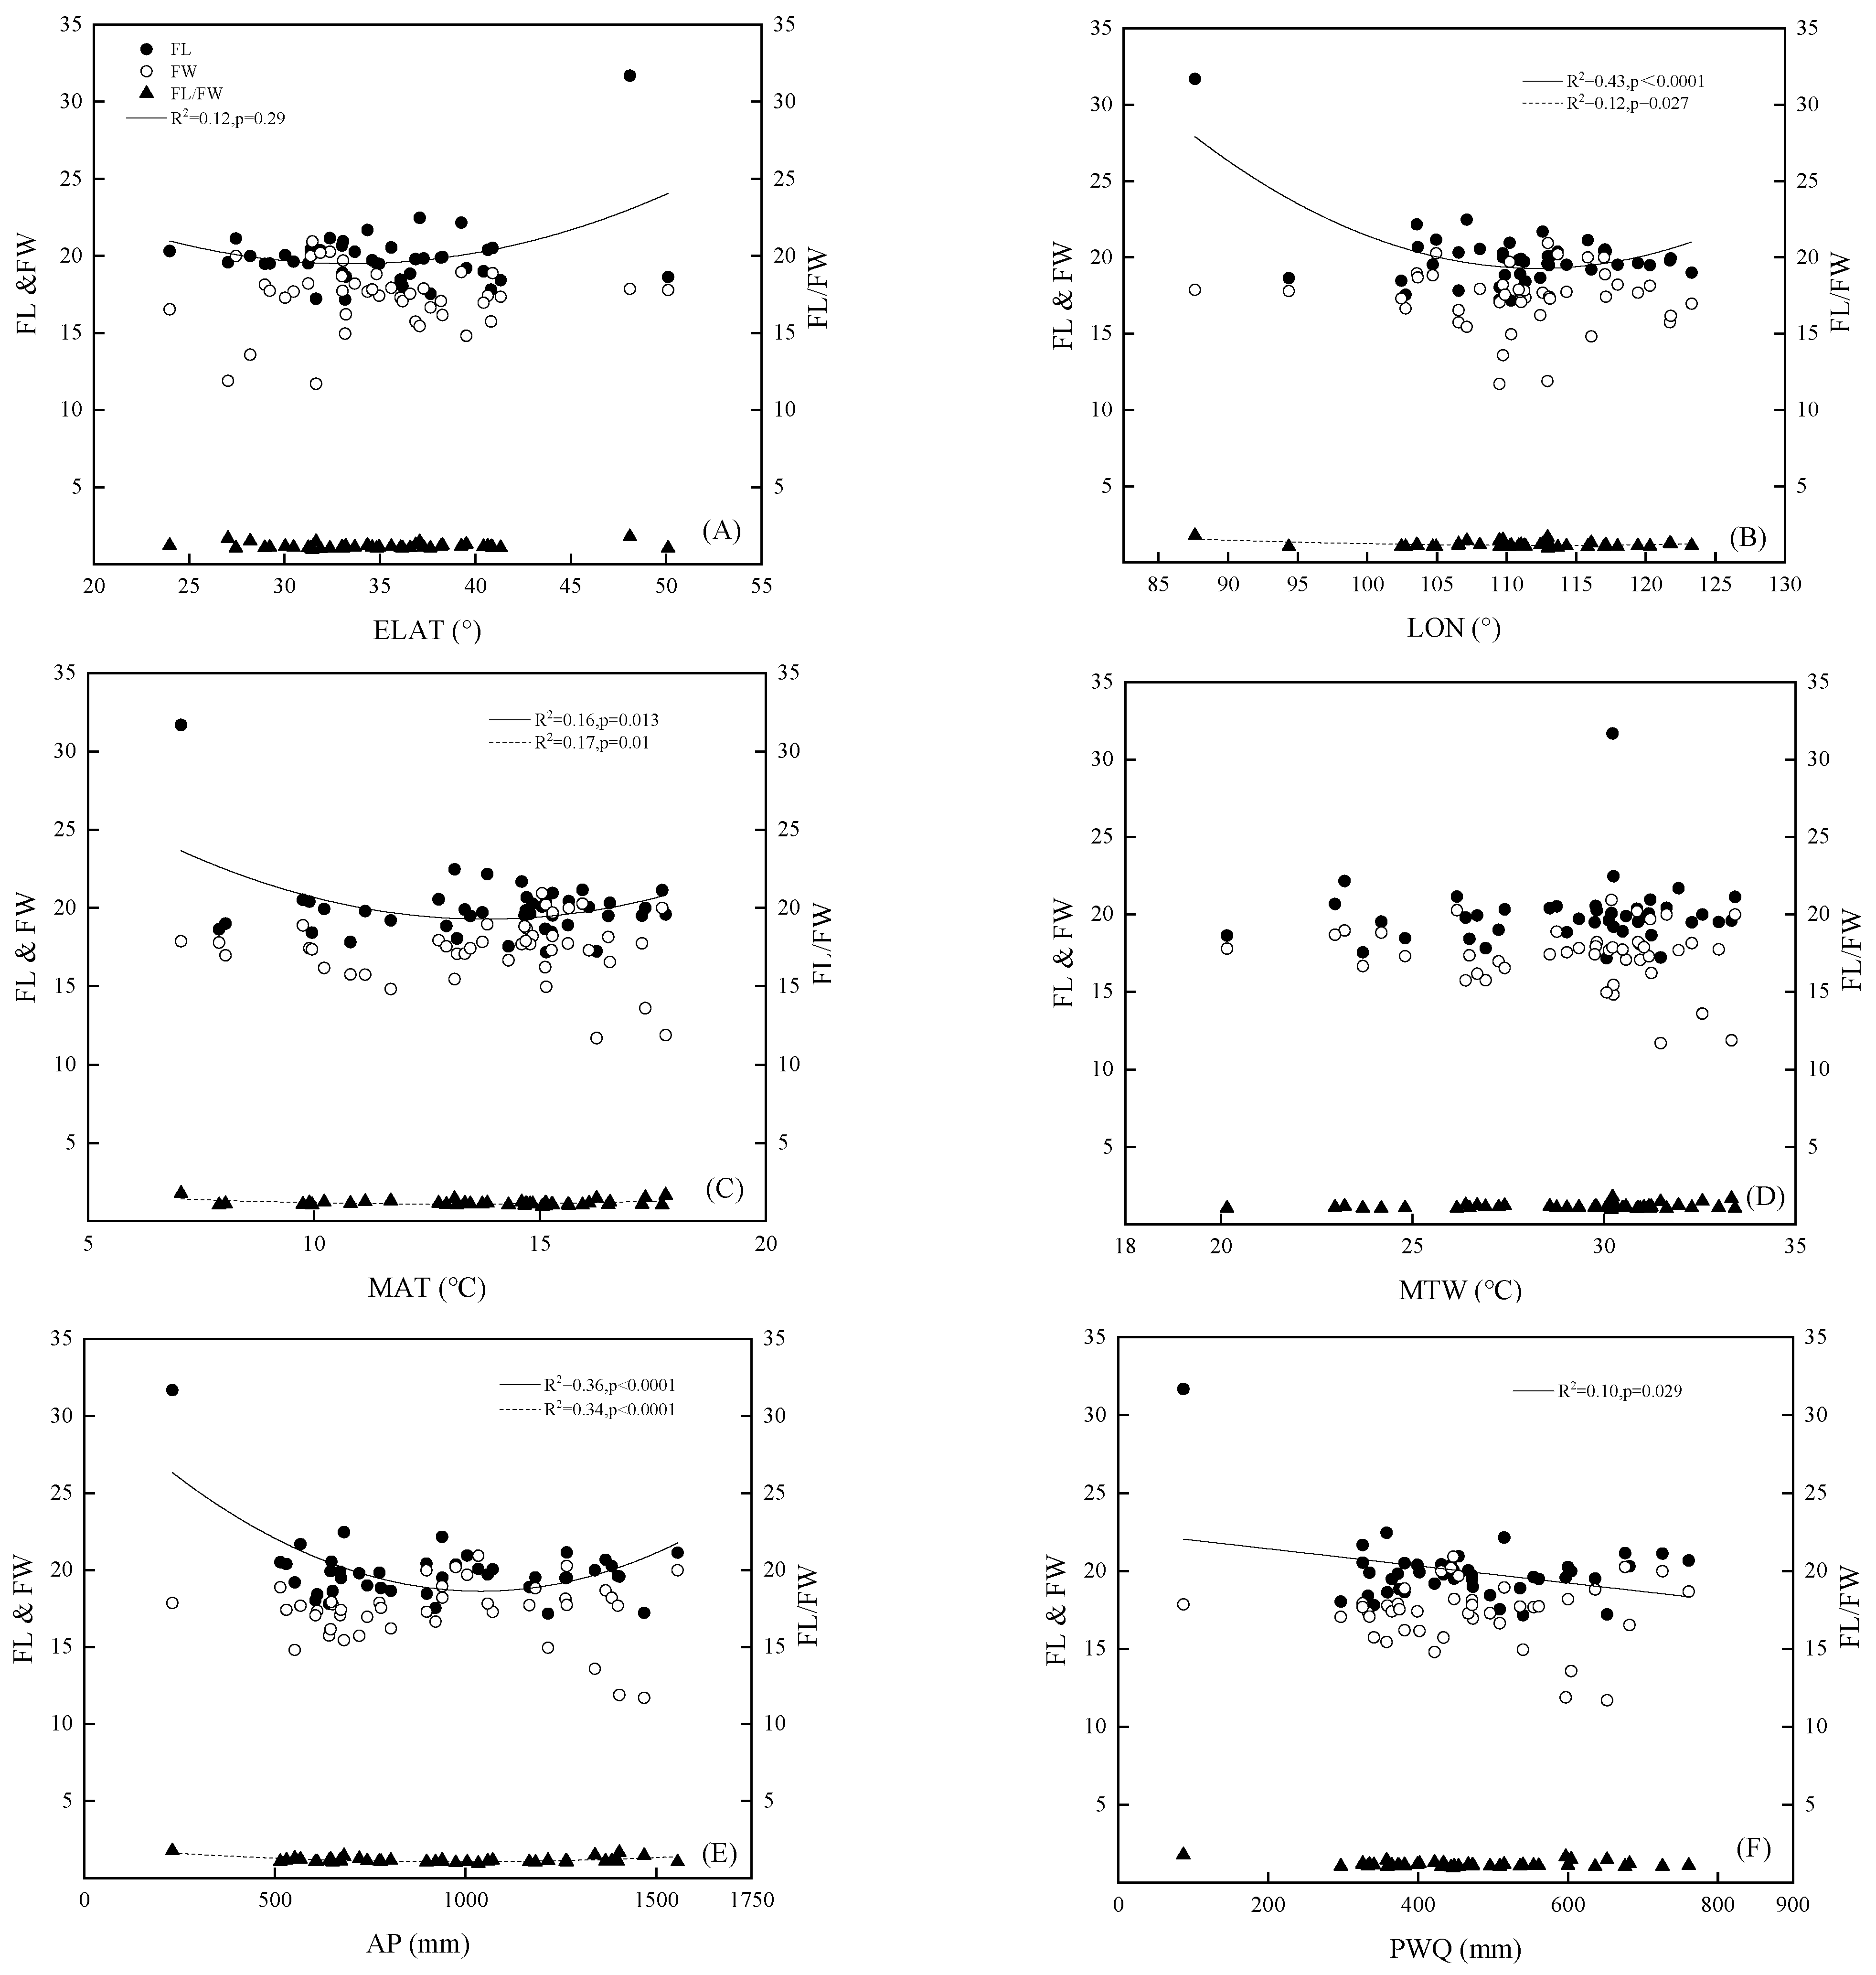
Results of the correlation analysis between the various morphological indicators of Q. variabilis fruits and the geographical and ecological factors are presented in Figure 1. Fruit length and ELAT had a concave variation trend (R2 = 0.12; p = 0.029; y = 0.016x2 − 1.1x + 37.94), with a minimum value at 33°–35° N (Figure 1A). Fruit length also had a concave variation trend with longitude (R2 = 0.43; p < 0.0001; y = 0.014x2 − 3.19x + 198.26), with a minimum value at 111°–113° E (Figure 1B). The fruit length-to-width ratio did not correlate with ELAT, but showed a concave variation trend with longitude (R2 = 0.12; p = 0.027; y = 0.0001x2 − 0.15x + 9.55), with a minimum value at 111°–113° E (Figure 1B).
Fruit length and annual mean air temperature showed a concave variation trend (R2 = 0.16; p = 0.013; y = 0.096x2 − 2.65x + 37.58) and reached a minimum value at 13.46–14.65 °C (Figure 1C). Fruit length-to-width ratio and annual mean air temperature also showed a concave variation trend (R2 = 0.17; p = 0.01; y = 0.009x2 − 0.24x + 2.69) and reached a minimum value at 12.93–13.72 °C (Figure 1C). However, fruit length and length-to-width ratio did not correlate with the maximum temperature of the warmest month (Figure 1D).
Fruit length and annual precipitation showed a concave variation trend (R2 = 0.36; p < 0.0001; y = 0.0001x2 − 0.024x + 31.29) and reached a minimum value at 974–1071 mm (Figure 1E). The fruit length-to-width ratio and annual precipitation showed a concave variation trend (R2 = 0.34; p < 0.0001; y = 0.0001x2 − 0.002x + 2.02) and reached a minimum value at 939–1004 mm (Figure 1C). Fruit length was negatively correlated with precipitation in the wettest quarter (R2 = 0.10; p = 0.029; y = −0.005x + 22.53) (Figure 1F). But there was no correlation between the fruit length-to-width ratio and precipitation in the wettest quarter.
Fruit width, fruit length, and fruit length-to-width ratio were positively correlated with the equivalent latitude (ELAT) (Table 4). However, fruit length was significantly negatively correlated with precipitation of the wettest quarter and longitude.
The Simple Mantel test identified significant correlations between the morphological, geographic, and climatic distance matrices (Table 5). Correlations were higher between morphological and climatic matrices (r = 0.988, p < 0.001), and weaker, but significant, correlations were observed between the morphological and geographical matrices (r = 0.633, p < 0.001).
3.3. Principal Component Analysis and Cluster Analysis
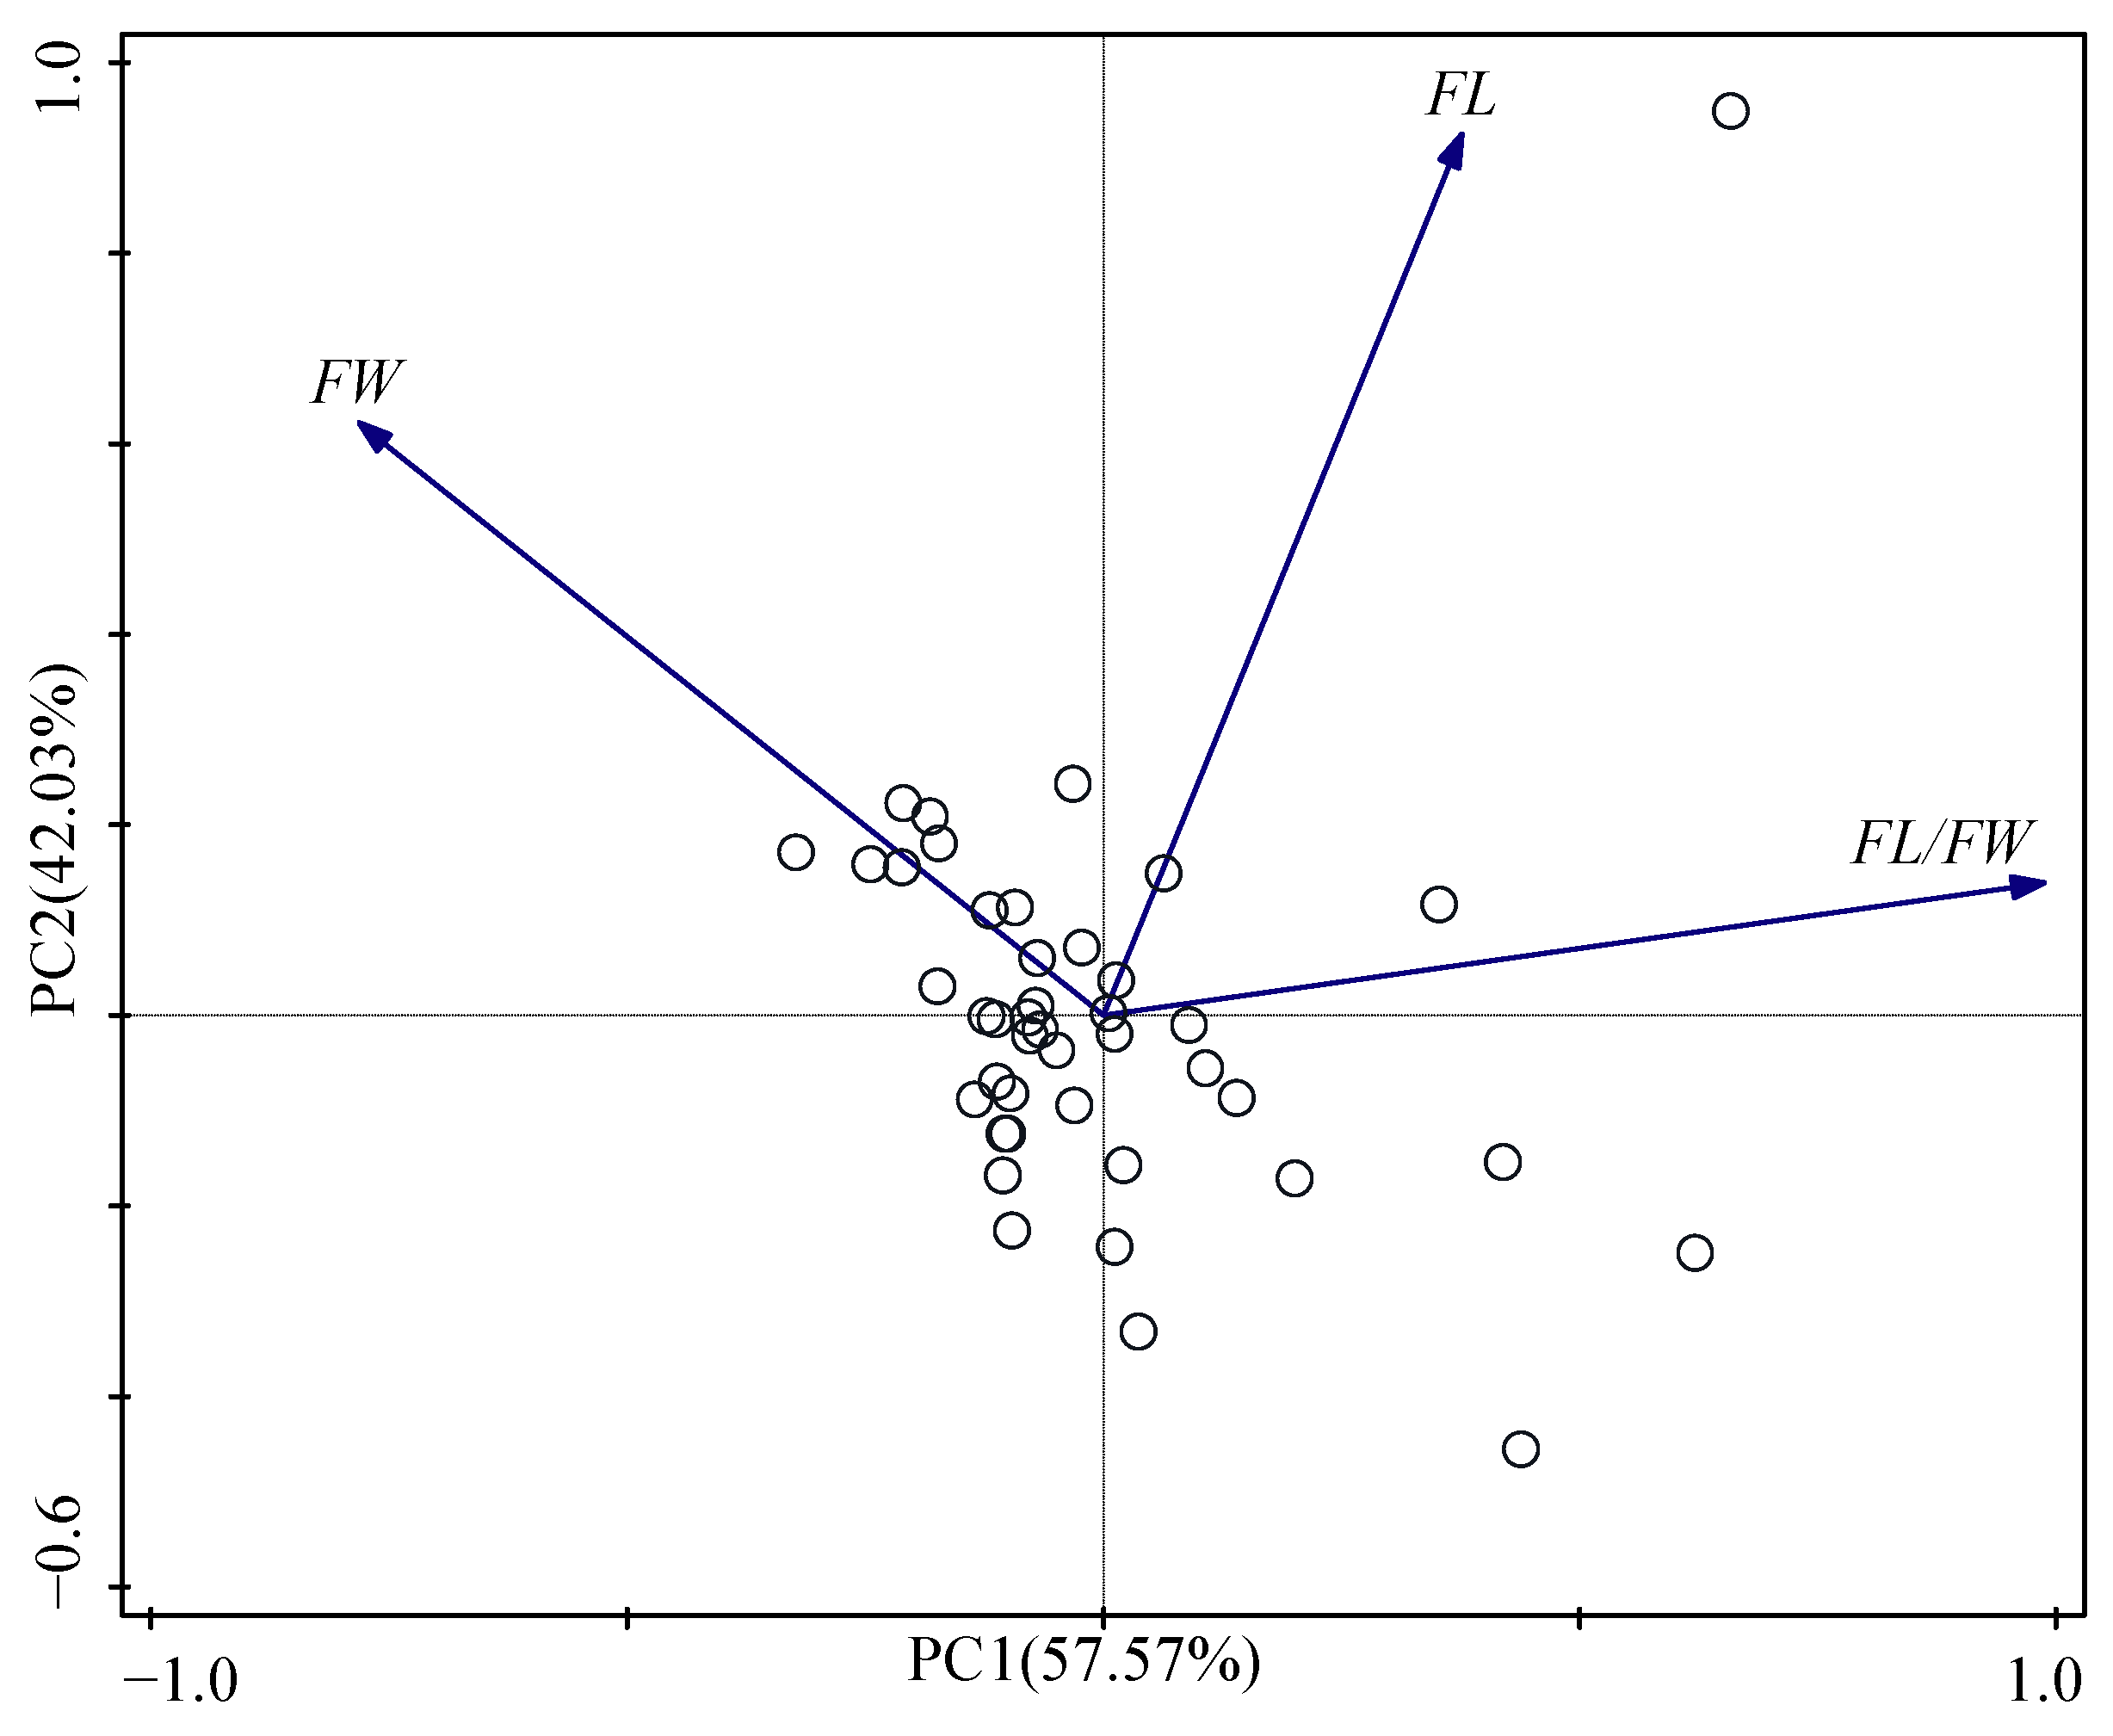
Based on the results of principal component analysis (Figure 2, Table 6), 99.60% of the total variance was explained by the first two principal components. The principal component score, associated to each variable on the three principal components, identifies the variables that mostly defined them (Table 6). The PC1, showing 57.57% of total variability, was positively correlated with following variables: FW and FL/FW. The PC2 indicated 42.03% of cumulative variance was positively correlated with FL and FW.
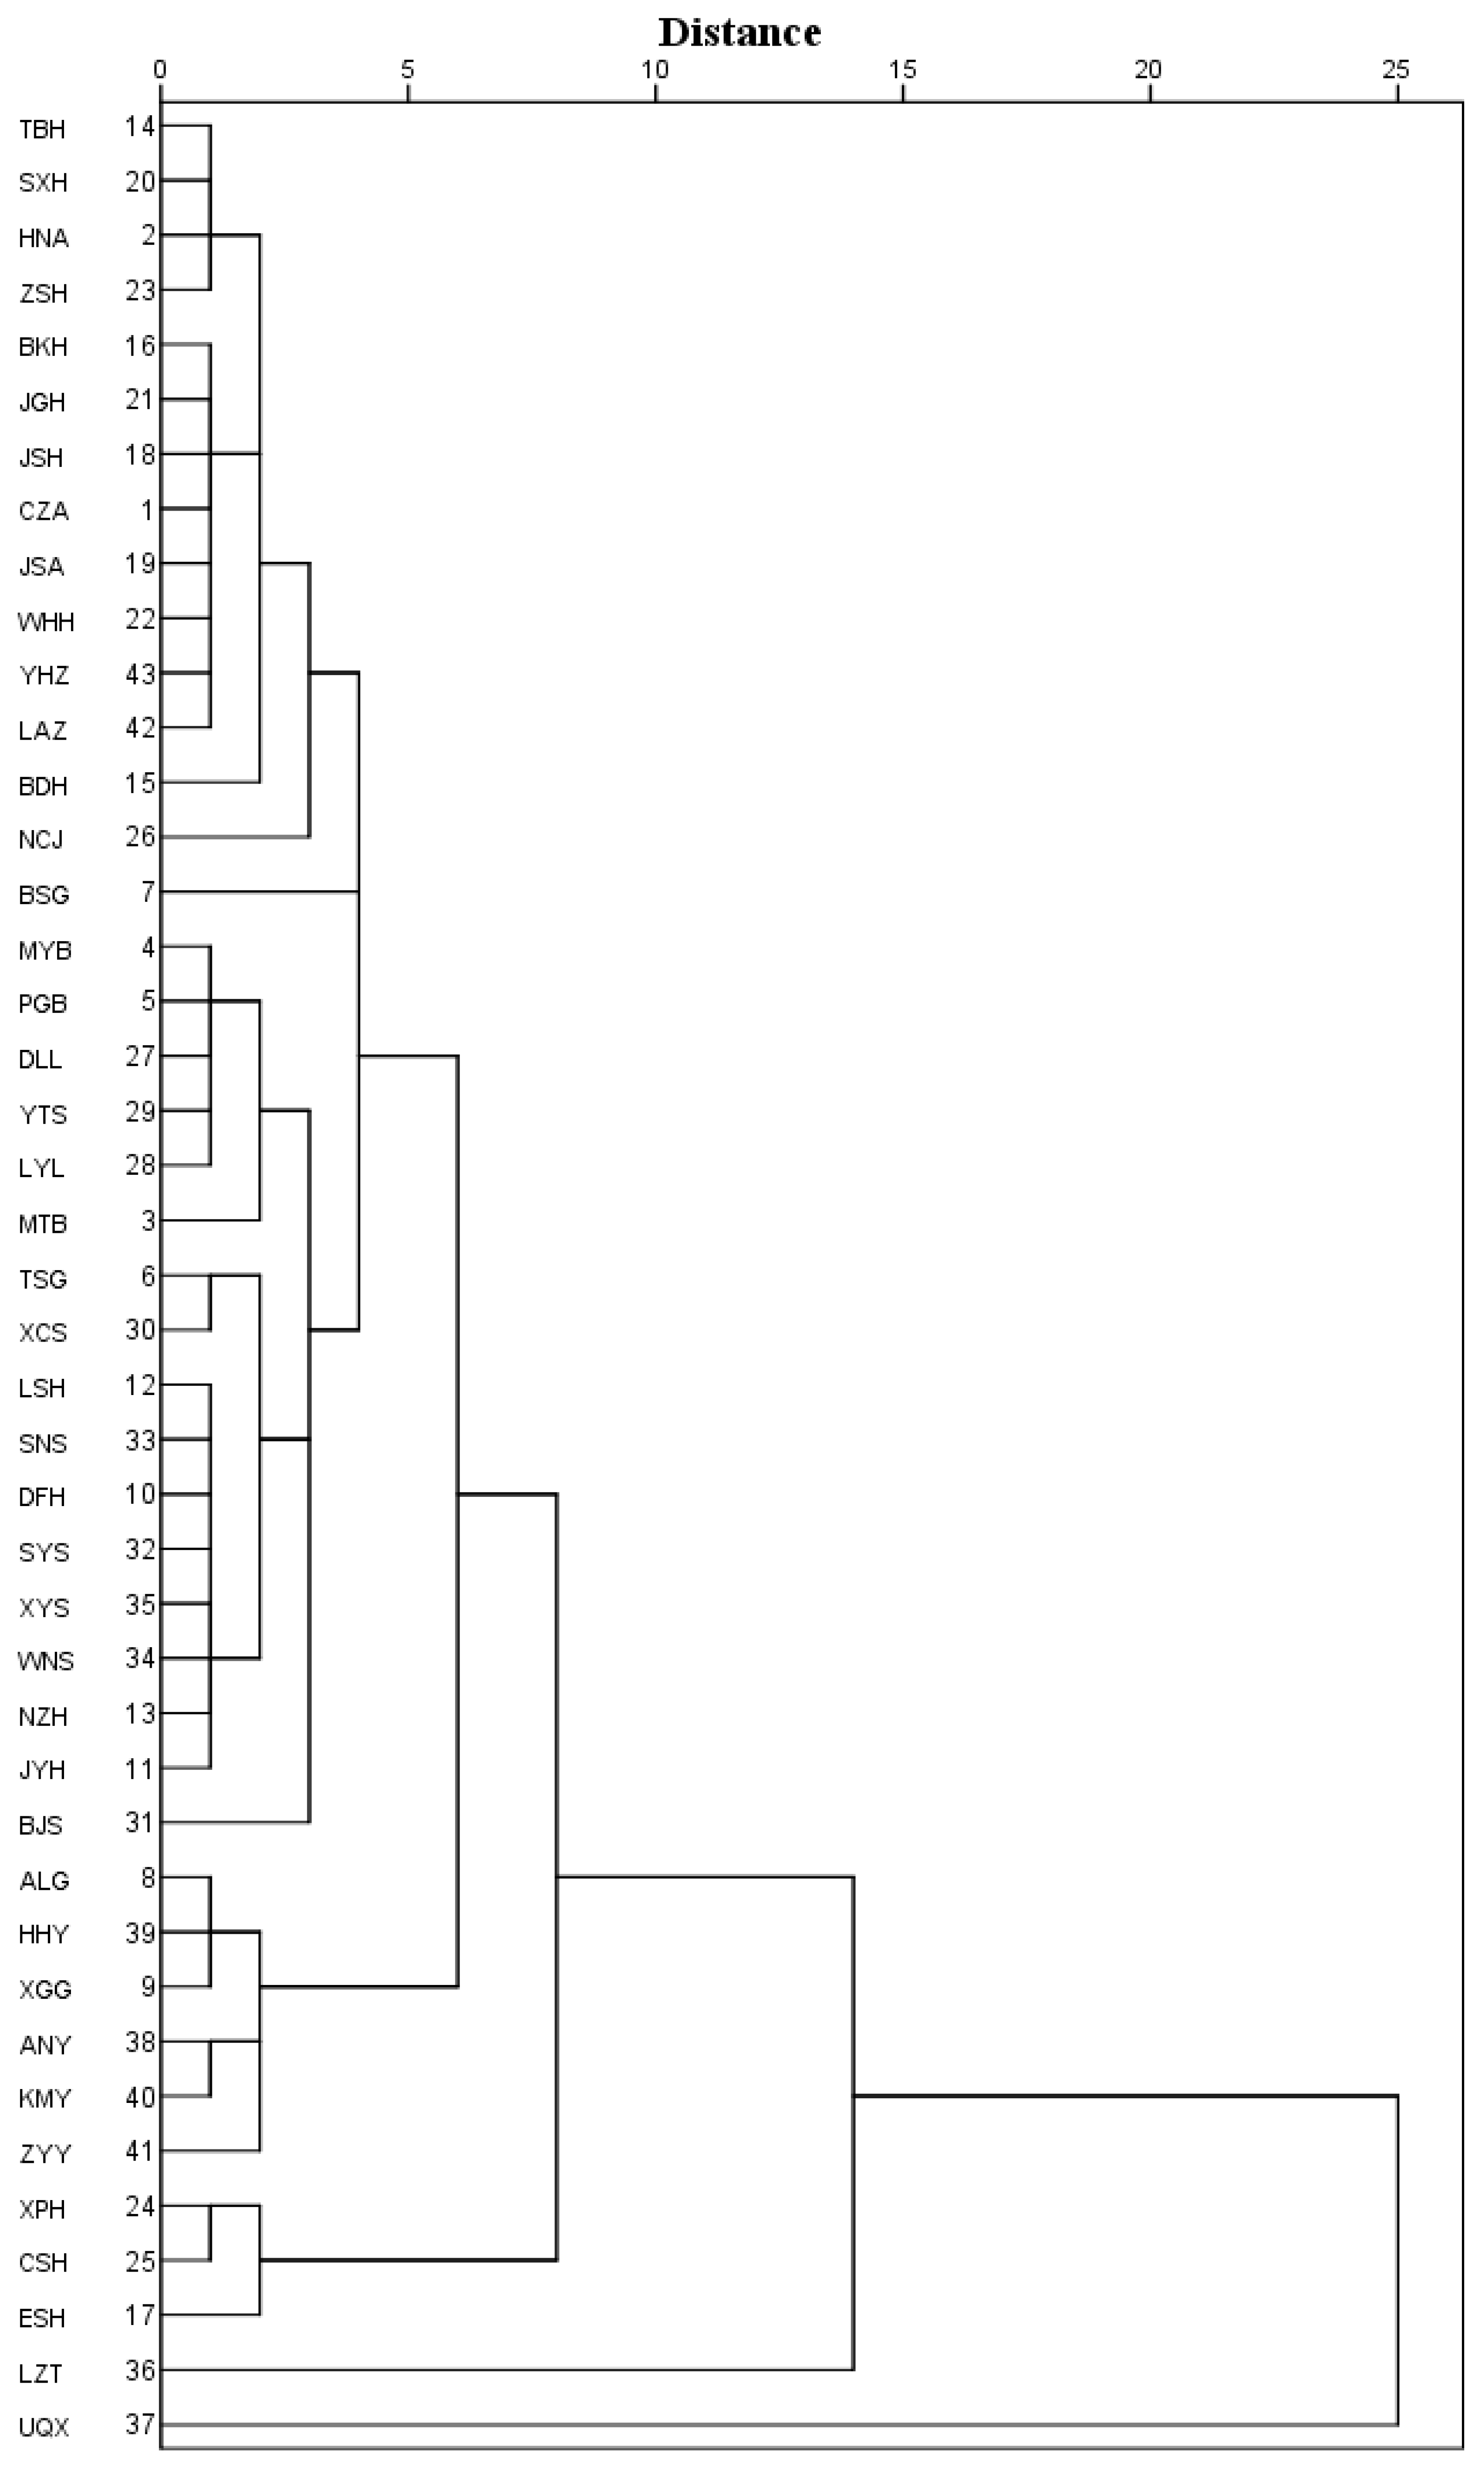
The 43 natural populations of Q. variabilis were clustered into five groups with a Euclidean distance of five as the threshold (Figure 3). TBH, SXH, HNA, ZSH, BKH, JGH, JSH, CZA, JSA, WHH, YHZ, LAZ, BDH, NCJ, BSG, MYB, PGB, DLL, YTS, LYL, MTB, TSG, XCS, LSH, SNS, DFH, SYS, XYS, WNS, NZH, JYH, and BJS populations were clustered into the first group, ALG, HHY, XGG, ANY, KMY, and ZYY populations into the second, XPH, CSH, and ESH into the third, LZT was in the fourth, and UQX was in the fifth.
4. Discussion
Indeed, fruit morphology can vary significantly among locations, but plants of the same genus can maintain similar fruit size. In this paper, the variation in the average fruit length-to-width ratios of Q. variabilis ranged between 0.96 and 1.78. Chen et al. [44] reported that the variation range of the fruit length-to-width ratio of Q. virginiana Mill. was between 1.19 and 1.93. Li et al. [45] indicated that the fruit length-to-width ratio of Q. mongolica Fisch. ex Ledeb. was between 1.21 and 1.49. Chang et al. [46] observed that the fruit length-to-width ratio of Q. cocciferoides Hand.-Mazz. ranged between 0.86 and 1.48. These results are similar with our data. Therefore, the variation in the fruit length-to-width ratios in the Quercus genus is relatively moderate. In addition, in the present study, the fruit width and fruit length of Q. variabilis showed significant differences among the various populations, with a relatively low intrapopulation variability. These results are consistent with the results published by Zhou et al. [12].
The variation of fruit phenotypic diversity is closely associated with geographical area [1,47]. The geographic isolation from other regions leads to fruit phenotypic variation [20]. Fu et al. [48] showed that the fruit morphological characteristics of Cornus officinalis Sieb. have obvious geographical characteristics. Similar trends were observed in our study. Fruit morphological traits of Q. variabilis exhibited geographic patterns. The hierarchical tree dendrogram of the 43 populations of Q. variabilis showed that populations with close geographic distance, such as the SYS, SNS, WNS, and XYS populations, and the XPH and CSH populations are clustered together. This indicates the regional and continuous pattern of geographic variation. However, a few distant populations were found to be clustered together, such as MYB and LAZ populations, demonstrating random variation patterns. These results indicated that the fruit phenotypic diversity of Q. variabilis represented three geographical variation patterns: continuous variation, regional variation, and random variation. In addition, the populations of Q. variabilis were characterized by significant phylogeographic structure. The results of previous studies showed morphological variability of seeds along the latitudinal gradient [21,49]. Rewicz et al. [49] found that there was a trend of an increase in seed morphology towards the higher latitude areas. Equally, the results of our study showed that the fruit length, fruit width, and fruit length-to-width ratio of Q. variabilis had a positive correlation with the equivalent latitude. This correlation may reflect the adaptability and high phenotypic plasticity of Q. variabilis.
In addition to geographical factors, climatic factors also affected the fruit morphology. Fruit phenotypic diversity provides useful results for understanding the adaptation mechanism of plants under different climatic conditions [1,49]. The phenotypic variation was the synthetic effect of multiple climatic factors [50]. The variation trend of Q. variabilis fruit width and fruit length, as affected by climatic factors, showed regular variations in fruit morphological characteristics (the fruit width, fruit length, and fruit length-to-width ratio). The fruit length-to-width ratio showed a concave variation trend as affected by annual mean air temperature and annual precipitation, and was similar to fruit length. This showed that the fruit length-to-width ratio of Q. variabilis had a synergistic variation in different climatic conditions. Moreover, our results indicated that the fruit width of Q. variabilis was negatively correlated with temperature and precipitation, similar to the responses of Pinus tabuliformis Carr [50].
Early research on Quercus showed that phenotypic diversity was tightly related to local climatic factors with respect to temperature or rainfall [30,51,52]. Thus, the phenotypic characters of Q. variabilis should be variable in response to the changes of climatic factors because of its large distribution area. Generally, in a climate of low temperature and low annual precipitation, fruit length is negatively correlated with temperature and rainfall. On the contrary, in a climate of high temperature and high annual precipitation, fruit length is positively correlated with temperature and rainfall [12,53,54,55]. Similarly, we found various correlation patterns between those phenotypic traits and the climatic factors. In our study, the fruit length of Q. variabilis was negatively correlated with precipitation in the wettest quarter. During the development period of fruits between July and September, precipitation in the wettest quarter significantly affected the morphology of Q. variabilis fruits. In addition, when the annual precipitation was below 1000 mm, the fruit length was negatively correlated with the annual precipitation. Besides, we found that when the annual precipitation was greater than 1000 mm, the fruit length increased with increasing annual precipitation, and when the temperature was above 13 °C, the fruit length increased with the annual mean air temperature. In addition, we observed that when the temperature was less than 13 °C, the fruit length was negatively correlated with annual mean air temperature. Those various correlation patterns between phenotypic traits and the climatic factors have resulted in a strong adaptability to climate changes.
According to the results of the simple Mantel tests, it was determined that both geographical and climate variables affect the structure of Q. variabilis populations [56,57]. Similarly, Poljak et al. [43] suggested that phenotypic divergence of Alnus incana (L.) Moench subsp. incana populations was the result of a significant level of isolation both by distance and by the environment. Furthermore, DeWoody et al. [42] revealed that adaptive differentiation and persistent isolation by colonization (IBC) acted in combination to produce the genetic and morphological patterns observed in Populus nigra L. populations. In our study, we found that acorn morphological variation was significantly correlated with both climatic heterogeneity and geographic distance.
5. Conclusions
Our study revealed that the phenotypic diversity of Q. variabilis fruit is related to both geographical and climatic factors. In terms of geographical factors, the acorn morphology of Q. variabilis was significantly different among and within the 43 natural populations, with gradations in different geographical distribution areas. Moreover, the hierarchical tree dendrogram of the five major groups reflects diversified geographic variation patterns of Q. variabilis fruit phenotype, namely, random variation, continuous variation, and regional variation. In terms of climatic factors, Q. variabilis fruit phenotypic diversity was tightly related to local climate factors with respect to temperature and rainfall. In summary, the fruits of Q. variabilis have high phenotypic plasticity, which is conducive to the expansion of its adaptation range.
Supplementary Materials
The following are available online at https://0-www-mdpi-com.brum.beds.ac.uk/article/10.3390/d13070329/s1, Figure S1: Location of the 43 study sites, covering the geographical distribution of Quercus variabilis in China. Figure S2: Correlation analysis between fruit width (FW) and fruit length (FL) of 43 populations of Quercus variabilis.
Author Contributions
S.G. contributed the data analysis and wrote the manuscript. H.X., F.Z., Y.R., and J.Z. collected the samples. J.M., H.X., J.Z., and F.Z. revised the manuscript. J.Z. and H.X. secured funding for the research. All authors have read and agreed to the published version of the manuscript.
Funding
This work was funded by the basic scientific research business expenses of the central public welfare scientific research institutes of the Chinese Academy of Forestry (CAFYBB2018ZB001-11), the key research and development program of Hunan Province (2020NK2017), and Innovation and Entrepreneurship training program of Central South University of Forestry and Technology ([2021] no.34).
Institutional Review Board Statement
Not applicable.
Informed Consent Statement
Not applicable.
Data Availability Statement
The data in this study are available in presented Tables.
Conflicts of Interest
The authors have no conflict of interest.
References
- Li, Y.; Li, S.; Lu, X.H.; Wang, Q.Q.; Han, H.Y.; Zhang, X.M.; Ma, Y.H.; Gan, X.H. Leaf phenotypic variation of endangered plant Tetracentron sinense Oliv. And influence of geographical and climatic factors. J. For. Res. 2020, 32, 623–636. [Google Scholar] [CrossRef]
- Alcántara-Ayala, O.; Oyama, K.; Ríos-Muñoz, C.; Rivas, G.; Ramirez-Barahona, S.; Luna-Vega, I. Morphological variation of leaf traits in the Ternstroemia lineata species complex (Ericales: Penthaphylacaceae) in response to geographic and climatic variation. PeerJ 2020, 8, e830. [Google Scholar] [CrossRef] [Green Version]
- Thomas, C.L.; Alcock, T.D.; Graham, N.S.; Hayden, R.; Matterson, S.; Wilson, L.; Young, S.D.; Dupuy, L.X.; White, P.J.; Hammond, J.P.; et al. Root morphology and seed and leaf ionomic traits in a Brassica napus L. diversity panel show wide phenotypic variation and are characteristic of crop habit. BMC Plant Biol. 2016, 16, 214. [Google Scholar] [CrossRef] [Green Version]
- Jasińska, A.K.; Rucińska, B.; Kozlowski, G.; Bétrisey, S.; Safarov, H.; Boratyńska, K.; Boratyński, A. Morphological differentiation of leaves in the relict tree Zelkova carpinifolia (Ulmaceae). Dendrobiology 2015, 74, 109–122. [Google Scholar] [CrossRef] [Green Version]
- Miljković, D.; Čortan, D. Morphometric and morphological analysis of Populus nigra L. leaves in flooded regions. Sumar. List 2020, 144, 139–147. [Google Scholar] [CrossRef]
- Poljak, I.; Kajba, D.; Ljubić, I.; Idžojtić, M. Morphological variability of leaves of Sorbus domestica L. in Croatia. Acta Soc. Bot. Pol. 2015, 84, 249–259. [Google Scholar] [CrossRef] [Green Version]
- Gómez, J.M.; Perfectti, F.; Armas, C.; Narbona, E.; González-Megías, A.; Navarro, L.; DeSoto, L.; Torices, R. Within-individual phenotypic plasticity in flowers fosters pollination niche shift. Nat. Commun. 2020, 11, 4019. [Google Scholar] [CrossRef] [PubMed]
- Daničić, V.; Kovačević, B.; Ballian, D. Variability in fruit morphology of European sweet chestnut (Castanea sativa Mill.) in natural populations in Bosnia and Herzegovina. Sumar. List 2018, 142, 517–528. [Google Scholar] [CrossRef] [Green Version]
- Pluess, A.R.; Schütz, W.; Stocklin, J. Seed weight increases with altitude in the Swiss Alps between related species but not populations of individual species. Oecologia 2005, 144, 55–61. [Google Scholar] [CrossRef] [PubMed] [Green Version]
- Yi, F.Y.; Wang, Z.R.; Baskin, C.C.; Baskin, J.M.; Ye, R.H.; Sun, H.L.; Zhang, Y.Y.; Ye, X.H.; Liu, G.F.; Yang, X.J.; et al. Seed germination responses to seasonal temperature and drought stress are species-specific but not related to seed size in a desert steppe: Implications for effect of climate change on community structure. Ecol. Evol. 2019, 9, 2149–2159. [Google Scholar] [CrossRef] [PubMed] [Green Version]
- Wirth, L.R.; Graf, R.; Gugerli, F.; Landergott, U.; Holdergger, R. Between-year variation in seed weights across altitudes in the high-alpine plant Eritrichium nanum. Plant Ecol. 2010, 207, 227–231. [Google Scholar] [CrossRef] [Green Version]
- Zhou, X.; He, Z.B.; Kang, H.Z.; Sun, X.; Liu, C.J. Variations of seed morphology related to climate for Quercus variabilis across temperate subtropical China. Chin. J. Plant Ecol. 2013, 37, 481–491. [Google Scholar] [CrossRef]
- Liu, M.L.; Yu, W.B.; Li, D.Z.; Mill, R.; Wang, H. Seed morphological diversity of Pedicularis (Orobanchaceae) and its taxonomic significance. Plant Syst. Evol. 2013, 299, 1645–1657. [Google Scholar] [CrossRef]
- Kaliniewicz, Z.; Markowski, P.; Anders, A.; Jadwisieńczak, K.; Żuk, Z.; Krzysiak, Z. Physical properties of seeds of eleven fir species. Forests 2019, 10, 142. [Google Scholar] [CrossRef] [Green Version]
- Velázquez-Rosas, N.; Ruiz-Guerra, B.; Sánchez-Coronado, M.E.; Buen, A.G.; Orozco-Segovia, A. Morphological variation in fruits and seeds of Ceiba aesculifolia and its relationship with germination and seedling biomass. Bot. Sci. 2017, 95, 81–91. [Google Scholar] [CrossRef] [Green Version]
- Kijowska-Oberc, J.; Staszak, A.M.; Wawrzyniak, M.K.; Ratajczak, E. Changes in proline levels during seed development of orthodox and recalcitrant seeds of genus Ace in a climate change scenario. Forests 2020, 11, 1362. [Google Scholar] [CrossRef]
- Liu, G.F.; Zang, R.G.; Liu, H.; Bai, Z.Q.; Guo, Z.J.; Ding, Y. Geographic variation of seed morphological traits of Picea schrenkiana var. tianschanica in Tianshan Mountains, Xinjiang of Northwest China. Chin. J. Appl. Ecol. 2012, 23, 1455–1461. [Google Scholar]
- Wang, Y.J.; Wang, J.J.; Lai, L.M.; Jiang, L.H.; Zhuang, P.; Zhang, L.H.; Zheng, Y.R.; Jerry, M.; Baskin, J.M.; Baskin, C.C. Geographic variation in seed traits within and among forty-two species of Rhododendron (Ericaceae) on the Tibetan plateau: Relationships with altitude, habitat, plant height, and phylogeny. Ecol. Evol. 2014, 4, 1913–1923. [Google Scholar] [CrossRef]
- Maranz, S.; Wiesman, Z. Evidence for indigenous selection and distribution of the shea tree, Vitellaria paradoxa and its potential significance to prevailing parkland savanna tree patterns in sub-Saharan Africa north of the equator. J. Biogeogr. 2003, 30, 1505–1516. [Google Scholar] [CrossRef]
- Wu, H.; Meng, H.J.; Wang, S.T.; Wei, X.Z.; Jiang, M.X. Geographic patterns and environmental drivers of seed traits of a relict tree species. For. Ecol. Manag. 2018, 422, 59–68. [Google Scholar] [CrossRef]
- Liu, Z.L.; Yu, M.K.; Ma, Y.; Tang, L.Z.; Fang, S.Z. A trend surface analysis of geographic variation in the traits of seeds and seedlings from different Quercus acutissima provenances. Acta Ecol. Sin. 2011, 31, 6796–6804. [Google Scholar]
- Leal-Sáenz, A.; Waring, K.M.; Menon, M.; Cushman, S.A.; Eckert, A.; Flores-Rentería, L.; Hernández-Díaz, J.C.; López-Sánchez, C.A.; Martínez-Guerrero, J.H.; Wehenkel, C. Morphological differences in Pinus strobiformis across latitudinal and elevational gradients. Front. Plant Sci. 2020, 11, 559–697. [Google Scholar] [CrossRef] [PubMed]
- Poljak, I.; Idžojtić, M.; Zebec, M.; Perković, N. The variability of European sweet chestnut (Castanea sativa Mill.) in the region of northwest Croatia according to morphology of fruits. Sumar. List 2012, 136, 479–488. [Google Scholar]
- Liu, M.S.; Hong, B.G. The distribution of Fagaceae in China and its relationship with climatic and geographic characters. Acta Phytoecol. Sin. 1998, 22, 41–50. [Google Scholar]
- Gao, W.Q.; Liu, J.F.; Xue, M.Z.; Zhang, Y.T.; Gao, Z.H.; Ni, Y.Y.; Wang, X.F.; Jiang, Z.P. Geographical patterns and drivers of growth dynamics of Quercus variabilis. For. Ecol. Manag. 2018, 429, 256–266. [Google Scholar] [CrossRef]
- Yuan, J.; Sun, N.X.; Du, H.M.; Yin, S.; Kang, H.Z.; Umair, M.; Liu, C.J. Roles of metabolic regulation in developing Quercus variabilis acorns at contrasting geologically-derived phosphorus sites in subtropical China. BMC Plant Biol. 2020, 20, 389. [Google Scholar] [CrossRef]
- Shi, W.H.; Villar-Salvador, P.; Li, G.L.; Jiang, X.X. Acorn size is more important than nursery fertilization for outplanting performance of Quercus variabilis container seedlings. Ann. For. Sci. 2019, 76, 1–12. [Google Scholar] [CrossRef] [Green Version]
- Sun, X.; Kang, H.; Chen, H.Y.H.; Björn, B.; Samuel, B.F.; Liu, C. Biogeographic patterns of nutrient resorption from Quercus variabilis Blume leaves across China. Plant Biol. 2016, 18, 505–513. [Google Scholar] [CrossRef] [PubMed]
- Zhang, Y.W.; Yang, L.N.; Wang, D.M.; Li, D.W. Structure elucidation and properties of different lignins isolated from acorn shell of Quercus variabilis Bl. Int. J. Biol. Macromol. 2018, 107, 1193–1202. [Google Scholar] [CrossRef]
- Sun, Q.Y.; Dumroese, R.K.; Liu, Y. Container volume and subirrigation schedule influence Quercus variabilis seedling growth and nutrient status in the nursery and field. Scand. J. For. Res. 2018, 33, 560–567. [Google Scholar] [CrossRef]
- Liu, J.F.; Deng, Y.P.; Wang, X.F.; Ni, Y.Y.; Wang, Q.; Xiao, W.F.; Lei, J.P.; Jiang, Z.P.; Li, M.H. The concentration of non-structural carbohydrates, N, and P in Quercus variabilis does not decline toward its northernmost distribution range along a 1500 km transect in China. Front. Plant Sci. 2018, 9, 1444. [Google Scholar] [CrossRef] [PubMed] [Green Version]
- Llanderal-Mendoza, J.; Gugger, P.F.; Oyama, K.; Uribe-Salas, D.; González-Rodríguez, A. Climatic determinants of acorn size and germination percentage of Quercus rugosa (Fagaceae) along a latitudinal gradient in Mexico. Bot. Sci. 2017, 95, 37–45. [Google Scholar] [CrossRef] [Green Version]
- Long, T.J.; Jones, R.H. Seedling growth strategies and seed size effects in fourteen oak species native to different soil moisture habitat. Trees Struct. Funct. 1996, 11, 1–8. [Google Scholar] [CrossRef]
- Hijmans, R.J.; Cameron, S.E.; Parra, J.L.; Jones, P.G.; Jarvis, A. Very high resolution interpolated climate surfaces for global land areas. Int. J. Climatol. 2005, 25, 1965–1978. [Google Scholar] [CrossRef]
- Slave, C. Using arcmap to create a cadastral database. Case study. J. Inf. Syst. Oper. Manag. 2018, 12, 180–190. [Google Scholar]
- Alena, J.; Gösta, E.; Ingegerd, D.; Jan, I. Studies on frost hardiness of Pinus contorta Dougl. seedlings grown in climate chambers. Studia For. Suec. 1981, 157, 4–47. [Google Scholar]
- Wagstaff, K.; Cardie, C.; Rogers, S.; Schroedl, S. Constrained K-means clustering with background knowledge. Int. Conf. Mach. Learn. 2001, 1, 577–584. [Google Scholar]
- Smith, I.M.; Forbes, A.B. Algorithms and software for fitting polynomial functions constrained to pass through the origin. J. Phys. Conf. Ser. 2018, 1065, 212022. [Google Scholar] [CrossRef]
- Lepš, J.; Šmilauer, P. Multivariate analysis of ecological data using canoco 5. Bull. Ecol. Soc. Am. 2014, 85, 5. [Google Scholar]
- Li, H.C.; Gan, X.H.; Zhang, Z.P.; Zhang, C.; Song, L. Effects of altitudes and the DBH of seed trees on biological characteristics of Tetracentron sinense (Tetracentraceae) seeds. Plant Divers. Resour. 2015, 37, 177–183. [Google Scholar]
- Wright, S. Isolation by distance. Genetics 1943, 28, 139–156. [Google Scholar] [CrossRef] [PubMed]
- DeWoody, J.; Trewin, H.; Taylor, G. Genetic and morphological differentiation in Populus nigra L. Isolation by colonization or isolation by adaptation? Mol. Ecol. 2015, 24, 2641–2655. [Google Scholar] [CrossRef] [Green Version]
- Poljak, I.; Idžojtić, M.; Šapić, I.; Korijan, P.; Vukelić, J. Diversity and structure of Croatian continental and Alpine-Dinaric populations of grey alder (Alnus incana/L./Moench subsp. incana): Isolation by distance and environment explains phenotypic divergence. Sumar. List 2018, 142, 19–31. [Google Scholar] [CrossRef]
- Chen, Y.T.; Wang, S.F.; Chen, Y.C.; Yuan, J.; Wang, T.; Chen, B.; Qian, Y.N. Variation and stability of seed yield, fall-off process, seed size and form in live oak. For. Res. 2015, 28, 524–530. [Google Scholar]
- Li, Y.Q.; Li, Y.C.; Wu, Z.Z. Variation in phenotype characters and starch content of Quercus mongolica Fisch seed from different provenances. For. Res. 2013, 26, 528–532. [Google Scholar]
- Chang, E.F.; Zhang, Q.; Xiao, G.Y.; Li, P.R.; Li, Y.; Ding, Y.X.; Huang, C.L.; Jing, Y.B. Morphological characteristics and variation analysis of seeds from different provenances and families of Quercus cocciferoides. Seed 2020, 39, 53–58. [Google Scholar]
- Rao, G.R.; Shanker, A.K.; Srinivas, I.; Korwar, G.R.; Venkateswarlu, B. Diversity and variability in seed characters and growth of Pongamia pinnata (L.) Pierre accessions. Trees 2011, 25, 725–734. [Google Scholar] [CrossRef]
- Fu, X.X.; Liu, H.N.; Zhou, X.D.; Hong, X.T. Morphological variation of Cornus Officinalis seeds in relation to environmental factors. Chin. J. Ecol. 2013, 32, 27–32. [Google Scholar]
- Rewicz, A.; Bomanowska, A.; Magda, J.; Rewicz, T. Morphological variability of Consolida regalis seeds of south-eastern and central Europe. Syst. Biodivers. 2016, 15, 25–34. [Google Scholar] [CrossRef]
- Ji, M.F.; Zhang, X.W.; Wang, Z.Q.; Zhang, Q.; Deng, J.M. Intra- versus inter-population variation of cone and seed morphological traits of Pinus tabulaeformis Carr in northern China: Impact of climate-related conditions. Pol. J. Ecol. 2011, 59, 717–727. [Google Scholar]
- Rodríguez-Gómez, F.; Oyama, K.; Ochoa-Orozco, M.; Mendoza-Cuenca, L.; Gaytán-Legaria, R.; González-Rodríguez, A. Phylogeography and climate-associated morphological variation in the endemic white oak Quercus deserticola (Fagaceae) along the trans-Mexican volcanic belt. Botany 2018, 96, 121–133. [Google Scholar] [CrossRef] [Green Version]
- Du, B.M.; Zhu, Y.H.; Kang, H.Z.; Liu, C.J. Spatial variations in stomatal traits and their coordination with leaf traits in Quercus variabilis across eastern Asia. Sci. Total Environ. 2021, 789, 147757. [Google Scholar] [CrossRef] [PubMed]
- Zhang, J.B.; Dong, X.; Xin, Z.M.; Liu, M.H.; Zhang, R.H.; Huang, Y.R.; Sun, F. Effects of artificial simulated precipitation on seed characters and germination of Nitraria tangutorum. Southwest China J. Agric. Sci. 2019, 5, 1181–1186. [Google Scholar]
- Shu, X.; Yang, Z.L.; Yang, X.; Duan, H.P.; Yu, H.H.; Huang, J.C.; Li, S.C. Variation in seed characters of Magnolia officinalis from different locations. For. Res. 2010, 23, 457–461. [Google Scholar]
- Gao, Z.Y.; Zhang, H.F.; Chen, G.P.; Feng, X.M.; Zhao, T.J.; Gao, X.; Shi, F.C. Fruit stone morphology and geographic variation in Juglans mandshurica populations. Chin. J. Appl. Environ. Biol. 2017, 23, 609–615. [Google Scholar]
- Scrivanti, L.R.; Mestre, L.; Anton, A.M. Phenotypical variation and taxonomic correlates of five closely related andean species of Poa (Poaceae) along geographic and climatic gradients. Phytotaxa 2014, 183, 121–144. [Google Scholar] [CrossRef]
- Malanson, G.P.; Cheney, A.B.; Kinney, M. Climatic and geographic relations of alpine tundra floras in western North America. Alp. Bot. 2015, 125, 21–29. [Google Scholar] [CrossRef]
Figure 1.
Relationship between fruit width (FW), fruit length (FL), and FL/FW with geographic and climatic factors in 43 populations of Q. variabilis. (A) relationship between morphological factors with ELAT; (B) relationship between morphological factors with LON; (C) relationship between morphological factors with MAT; (D) relationship between morphological factors with MTW; (E) relationship between morphological factors with AP; (F) relationship between morphological factors with PWQ. AP, annual precipitation; ELAT, equivalent latitude; LON, longitude; MAT, annual mean air temperature; MTW, maximum temperature of warmest month; and PWQ, precipitation of wettest quarter.

Figure 2.
Principal components analysis (PCA) ordination diagram based on morphological variables.

Figure 3.
Hierarchical tree dendrogram of 43 populations of Q. variabilis based on fruit morphological characters and environmental factors.
Figure 3.
Hierarchical tree dendrogram of 43 populations of Q. variabilis based on fruit morphological characters and environmental factors.


Table 1.
Geographical locations and climatic conditions of the 43 study sites of Q. variabilis in China.
Table 1.
Geographical locations and climatic conditions of the 43 study sites of Q. variabilis in China.
| Site Number | Site Location | Code | LON (° E) | LAT (° N) | ALT (m) | MAT (°C) | MTW (°C) | AP (mm) | PWQ (mm) | ELAT (°) |
|---|---|---|---|---|---|---|---|---|---|---|
| 1 | Chuzhou City, Anhui Province | CZA | 117.97 | 32.35 | 80 | 15.28 | 30.89 | 939 | 448 | 31.25 |
| 2 | Huainan County, Anhui Province | HNA | 117.00 | 32.63 | 49 | 15.64 | 31.64 | 897 | 431 | 31.37 |
| 3 | Mentougou District, Beijing | MTB | 116.09 | 39.96 | 213 | 11.70 | 30.25 | 552 | 422 | 39.53 |
| 4 | Miyun County, Beijing | MYB | 117.07 | 40.50 | 357 | 9.75 | 28.76 | 514 | 382 | 40.90 |
| 5 | Pinggu District, Beijing | PGB | 117.13 | 40.28 | 353 | 9.90 | 28.59 | 530 | 399 | 40.66 |
| 6 | Tianshui City, Gansu Province | TSG | 106.55 | 34.47 | 1189 | 10.81 | 26.91 | 642 | 341 | 40.82 |
| 7 | Baise City, Guangxi Province | BSG | 106.55 | 24.77 | 142 | 16.55 | 27.41 | 1270 | 682 | 23.98 |
| 8 | Anlong county, Guizhou Province | ALG | 104.70 | 24.85 | 1697 | 14.66 | 24.19 | 1183 | 636 | 34.82 |
| 9 | Xingren County, Guizhou Province | XGG | 104.95 | 25.25 | 1298 | 15.94 | 26.16 | 1265 | 676 | 32.38 |
| 10 | Dengfeng City, Henan Province | DFH | 113.05 | 34.45 | 371 | 13.46 | 29.76 | 673 | 365 | 34.96 |
| 11 | Jiyuan City, Henan Province | JYH | 112.60 | 35.07 | 155 | 14.60 | 31.95 | 567 | 326 | 34.34 |
| 12 | Lushi County, Henan Province | LSH | 111.05 | 34.05 | 880 | 13.33 | 30.58 | 671 | 335 | 38.20 |
| 13 | Nanzhao County, Henan Province | NZH | 112.43 | 33.46 | 251 | 15.11 | 31.24 | 804 | 382 | 33.21 |
| 14 | Tongbai County, Henan Province | TBH | 113.68 | 32.53 | 170 | 15.13 | 30.86 | 974 | 444 | 31.88 |
| 15 | Badong County, Hubei Province | BDH | 110.34 | 31.04 | 598 | 15.14 | 30.07 | 1216 | 540 | 33.17 |
| 16 | Baokang County, Hubei Province | BKH | 111.26 | 31.88 | 680 | 13.72 | 29.35 | 1058 | 472 | 34.59 |
| 17 | Enshi City, Hubei Province | ESH | 109.49 | 30.28 | 491 | 16.26 | 31.48 | 1468 | 652 | 31.65 |
| 18 | Jianshi County, Hubei Province | JSH | 109.73 | 30.60 | 730 | 14.84 | 29.81 | 1383 | 600 | 33.67 |
| 19 | Jingshan City, Hubei Province | JSA | 113.12 | 31.02 | 103 | 16.08 | 31.17 | 1071 | 467 | 30.03 |
| 20 | Suixian County, Hubei Province | SXH | 112.98 | 31.53 | 287 | 15.05 | 30.20 | 1033 | 447 | 31.46 |
| 21 | Jiangui County, Hubei Province | JGH | 110.98 | 30.83 | 610 | 15.62 | 30.49 | 1167 | 536 | 33.04 |
| 22 | Wuhan City, Hubei Province | WHH | 114.31 | 30.59 | 27 | 17.26 | 33.00 | 1265 | 561 | 29.23 |
| 23 | Zhushan County, Hubei Province | ZSH | 110.23 | 32.22 | 418 | 15.28 | 31.21 | 1004 | 454 | 33.07 |
| 24 | Xiangxi Prefecture, Hunan Province | XPH | 109.74 | 28.31 | 277 | 17.33 | 32.57 | 1339 | 604 | 28.20 |
| 25 | Changsha City, Hunan Province | CSH | 112.94 | 28.23 | 61 | 17.78 | 33.33 | 1403 | 597 | 27.03 |
| 26 | Nanchang City, Jiangxi Province | NCJ | 115.83 | 28.76 | 37 | 17.70 | 33.42 | 1556 | 726 | 27.44 |
| 27 | Dalian City, Liaoning Province | DLL | 121.79 | 39.10 | 137 | 10.22 | 26.69 | 646 | 402 | 38.28 |
| 28 | Liaoyang City, Liaoning Province | LYL | 123.30 | 41.08 | 171 | 8.04 | 27.25 | 742 | 473 | 40.43 |
| 29 | Yantai City, Shandong Province | YTS | 121.74 | 37.26 | 222 | 11.13 | 26.39 | 721 | 434 | 36.87 |
| 30 | Xia County, Shanxi Province | XCS | 111.37 | 35.01 | 1185 | 9.95 | 26.49 | 611 | 333 | 41.33 |
| 31 | Baoji City, Shaanxi Province | BJS | 107.14 | 34.37 | 680 | 13.11 | 30.25 | 681 | 358 | 37.08 |
| 32 | Shanyang County, Shaanxi Province | SYS | 109.88 | 33.53 | 726 | 12.93 | 29.03 | 778 | 375 | 36.58 |
| 33 | Shangnan County, Shaanxi Province | SNS | 110.88 | 33.53 | 826 | 14.69 | 31.05 | 774 | 373 | 37.29 |
| 34 | Weinan County, Shaanxi Province | WNS | 109.50 | 34.50 | 536 | 13.16 | 30.94 | 606 | 297 | 36.19 |
| 35 | Xianyang City, Shaanxi Province | XYS | 108.08 | 34.27 | 486 | 12.76 | 29.78 | 648 | 326 | 35.60 |
| 36 | Linzhi City, Tibet | LZT | 94.36 | 29.65 | 3164 | 7.90 | 20.16 | 651 | 359 | 50.11 |
| 37 | Urumqi, Xinjiang | UQX | 87.62 | 43.83 | 899 | 7.06 | 30.22 | 231 | 87 | 48.10 |
| 38 | Anning City, Yunnan Province | ANY | 102.45 | 24.99 | 1852 | 15.25 | 24.81 | 898 | 496 | 36.07 |
| 39 | Honghe Prefecture, Yunnan Province | HHY | 103.61 | 23.33 | 1655 | 14.71 | 22.98 | 1367 | 761 | 33.01 |
| 40 | Kunming, Yunnan Province | KMY | 102.75 | 25.14 | 2051 | 14.30 | 23.70 | 921 | 509 | 37.65 |
| 41 | Zhanyi County, Yunnan Province | ZYY | 103.55 | 25.59 | 2214 | 13.84 | 23.23 | 938 | 515 | 39.27 |
| 42 | Lin’an District, Zhejiang Province | LAZ | 119.44 | 30.33 | 320 | 14.78 | 30.13 | 1399 | 554 | 30.47 |
| 43 | Yuhang District, Zhejiang Province | YHZ | 120.30 | 30.42 | 9 | 16.51 | 32.29 | 1262 | 472 | 28.96 |
ELAT, equivalent latitude; LON, longitude; LAT, latitude; ALT, altitude; MAT, annual mean air temperature; MTW, maximum temperature of warmest month; AP, annual precipitation; and PWQ, precipitation of wettest quarter. The climate data for all sites were obtained from the Global Climate and Weather Data website (http://www.worldclim.org (accessed on 15 December 2020)).
Table 2.
Statistical data of fruit length (FL), fruit width (FW), and FL/FW of 43 populations of Q. variabilis.
Table 2.
Statistical data of fruit length (FL), fruit width (FW), and FL/FW of 43 populations of Q. variabilis.
| Site | FL | FW | FL/FW | Sample Size | ||||||||||||
|---|---|---|---|---|---|---|---|---|---|---|---|---|---|---|---|---|
| Mean | Max | Min | SD | CV (%) | Mean | Max | Min | SD | CV (%) | Mean | Max | Min | SD | CV (%) | ||
| 1 | 19.51 defghijk | 23.56 | 15.02 | 1.71 | 8.74 | 18.21 ijk | 26.78 | 13.13 | 1.58 | 8.70 | 1.07 bcde | 1.58 | 0.70 | 0.10 | 9.08 | 100 |
| 2 | 20.42 hijkl | 24.22 | 15.88 | 1.13 | 5.53 | 19.99 lmn | 27.17 | 13.82 | 1.50 | 7.51 | 1.04 abc | 1.32 | 0.76 | 0.06 | 6.21 | 120 |
| 3 | 19.20 cdefghij | 22.94 | 15.49 | 1.49 | 7.79 | 14.82 bc | 18.46 | 10.87 | 1.26 | 8.50 | 1.30 i | 1.60 | 1.05 | 0.07 | 5.56 | 80 |
| 4 | 20.52 ijkl | 22.75 | 18.68 | 0.97 | 4.74 | 18.88 klm | 21.90 | 16.33 | 1.43 | 7.56 | 1.09 bcde | 1.36 | 0.94 | 0.10 | 9.26 | 20 |
| 5 | 20.40 hijkl | 24.27 | 16.69 | 1.89 | 9.26 | 17.42 fghijk | 20.97 | 15.00 | 1.41 | 8.09 | 1.18 efgh | 1.50 | 0.86 | 0.14 | 11.55 | 20 |
| 6 | 17.81 abc | 21.52 | 13.36 | 2.12 | 11.88 | 15.75 cde | 19.52 | 12.44 | 1.77 | 11.26 | 1.14 cdefg | 1.40 | 0.94 | 0.12 | 10.55 | 20 |
| 7 | 20.31 hijkl | 24.49 | 14.14 | 2.13 | 10.48 | 16.53 defghi | 20.69 | 13.75 | 1.57 | 9.52 | 1.23 fghi | 1.52 | 1.00 | 0.13 | 10.46 | 30 |
| 8 | 19.53 defghijk | 22.80 | 13.45 | 1.92 | 9.82 | 18.82 klm | 24.56 | 14.26 | 2.07 | 10.99 | 1.04 abc | 1.24 | 0.85 | 0.10 | 9.37 | 30 |
| 9 | 21.15 klmn | 23.84 | 18.20 | 1.42 | 6.71 | 20.26 mn | 22.89 | 17.97 | 1.02 | 5.03 | 1.04 abc | 1.23 | 0.90 | 0.07 | 6.89 | 30 |
| 10 | 19.49 defghijk | 26.80 | 13.97 | 1.60 | 8.23 | 17.42 fghijk | 22.08 | 12.57 | 1.48 | 8.48 | 1.12 bcdef | 1.61 | 0.82 | 0.10 | 8.72 | 438 |
| 11 | 21.69 lmn | 26.10 | 17.08 | 1.61 | 7.44 | 17.68 fghijk | 21.57 | 13.97 | 1.23 | 6.94 | 1.23 fghi | 1.50 | 0.98 | 0.09 | 6.94 | 60 |
| 12 | 19.89 efghijk | 20.74 | 18.92 | 0.46 | 2.29 | 17.07 efghij | 18.83 | 14.47 | 1.27 | 7.41 | 1.17 defgh | 1.36 | 1.00 | 0.09 | 7.85 | 20 |
| 13 | 18.65 abcdefg | 23.00 | 13.90 | 1.63 | 8.76 | 16.20 cdef | 21.50 | 10.45 | 1.53 | 9.43 | 1.16 cdefgh | 1.76 | 0.85 | 0.11 | 9.25 | 80 |
| 14 | 20.36 hijkl | 24.45 | 15.70 | 1.29 | 6.35 | 20.20 mn | 23.42 | 16.6 | 1.49 | 7.35 | 1.01 ab | 1.20 | 0.86 | 0.05 | 5.15 | 60 |
| 15 | 17.17 a | 24.35 | 9.96 | 1.43 | 8.33 | 14.95 bc | 20.08 | 9.78 | 1.26 | 8.44 | 1.14 cdefg | 1.44 | 0.80 | 0.12 | 10.82 | 60 |
| 16 | 19.71 fghijkl | 22.82 | 14.62 | 1.32 | 6.70 | 17.82 ghijk | 20.40 | 14.26 | 1.05 | 5.89 | 1.11 cdefg | 1.41 | 0.90 | 0.09 | 8.55 | 40 |
| 17 | 17.22 a | 20.79 | 11.56 | 1.64 | 9.54 | 11.70 a | 13.79 | 9.28 | 0.91 | 7.74 | 1.48 j | 1.99 | 1.03 | 0.16 | 10.62 | 60 |
| 18 | 20.27 ghijkl | 23.89 | 17.58 | 1.91 | 9.41 | 18.19 ijk | 21.99 | 15.31 | 1.66 | 9.14 | 1.12 bcde | 1.41 | 0.99 | 0.10 | 8.87 | 30 |
| 19 | 20.05 fghijkl | 23.58 | 17.02 | 1.05 | 5.25 | 17.29 efghijk | 21.63 | 13.55 | 1.16 | 6.69 | 1.17 defgh | 1.62 | 0.94 | 0.09 | 7.31 | 60 |
| 20 | 20.08 fghijkl | 22.02 | 16.65 | 1.21 | 6.04 | 20.93 n | 23.13 | 18.49 | 1.12 | 5.36 | 0.96 a | 1.12 | 0.82 | 0.07 | 7.25 | 30 |
| 21 | 18.90 bcdefghi | 22.82 | 14.62 | 1.95 | 10.34 | 17.72 fghijk | 19.88 | 15.30 | 1.19 | 6.70 | 1.07 abcde | 1.36 | 0.90 | 0.13 | 12.22 | 20 |
| 22 | 19.51 cdefghijk | 24.49 | 13.79 | 1.28 | 6.57 | 17.73 fghijk | 23.33 | 12.72 | 1.20 | 6.75 | 1.10 bcde | 1.45 | 0.81 | 0.07 | 6.78 | 99 |
| 23 | 20.95 jklm | 22.73 | 19.19 | 0.90 | 4.30 | 19.70 lmn | 21.72 | 17.22 | 1.06 | 5.38 | 1.06 abcde | 1.13 | 0.96 | 0.05 | 4.49 | 20 |
| 24 | 19.99 efghijk | 23.93 | 15.12 | 1.50 | 7.52 | 13.58 b | 18.20 | 9.46 | 1.34 | 9.84 | 1.50 j | 2.01 | 1.08 | 0.13 | 8.47 | 49 |
| 25 | 19.58 defghijk | 26.79 | 12.87 | 1.35 | 6.90 | 11.89 a | 20.17 | 7.96 | 0.85 | 7.11 | 1.68 k | 2.25 | 1.01 | 0.14 | 8.26 | 180 |
| 26 | 21.12 klmn | 23.61 | 17.46 | 1.51 | 7.14 | 19.99 lmn | 22.34 | 16.79 | 1.54 | 7.68 | 1.06 abcde | 1.22 | 0.95 | 0.06 | 5.95 | 20 |
| 27 | 19.93 efghijk | 22.45 | 16.91 | 1.49 | 7.49 | 16.16 cdefg | 18.21 | 12.74 | 1.34 | 8.27 | 1.24 ghi | 1.44 | 0.96 | 0.11 | 8.62 | 20 |
| 28 | 19.00 bcdefghi | 24.73 | 14.30 | 2.06 | 10.85 | 16.96 defghij | 21.32 | 13.19 | 2.08 | 12.27 | 1.13 bcdefg | 1.42 | 0.93 | 0.12 | 10.85 | 30 |
| 29 | 19.79 efghijk | 26.69 | 15.66 | 1.69 | 8.55 | 15.73 cde | 19.03 | 12.22 | 1.27 | 8.08 | 1.26 hi | 1.86 | 1.04 | 0.11 | 8.82 | 80 |
| 30 | 18.42 abcdef | 20.94 | 15.68 | 1.42 | 7.71 | 17.34 efghijk | 21.42 | 14.32 | 1.53 | 8.81 | 1.07 abcde | 1.22 | 0.91 | 0.07 | 6.65 | 20 |
| 31 | 22.46 n | 24.86 | 20.48 | 1.29 | 5.74 | 15.45 cd | 17.23 | 13.68 | 1.06 | 6.86 | 1.46 j | 1.58 | 1.34 | 0.06 | 4.38 | 20 |
| 32 | 18.84 abcde | 21.78 | 14.62 | 1.43 | 7.56 | 17.54 efghijk | 21.42 | 12.07 | 1.44 | 8.19 | 1.08 abcde | 1.35 | 0.84 | 0.08 | 7.69 | 60 |
| 33 | 19.83 efghijk | 21.78 | 17.02 | 1.01 | 5.12 | 17.88 ghijk | 21.42 | 14.16 | 1.58 | 8.81 | 1.11 bcde | 1.30 | 0.91 | 0.08 | 7.55 | 20 |
| 34 | 18.04 abcd | 22.62 | 14.08 | 1.78 | 9.89 | 17.06 efghij | 21.37 | 14.09 | 1.46 | 8.54 | 1.06 abcde | 1.28 | 0.81 | 0.11 | 10.09 | 60 |
| 35 | 20.55 ijkl | 24.04 | 16.24 | 1.91 | 9.30 | 17.93 hijk | 20.88 | 13.72 | 1.53 | 8.54 | 1.16 cdefg | 1.44 | 0.86 | 0.15 | 13.25 | 30 |
| 36 | 18.63 abcdefgh | 22.50 | 13.84 | 1.92 | 10.32 | 17.78 fghijk | 21.34 | 13.45 | 1.87 | 10.51 | 1.05 abcd | 1.25 | 0.86 | 0.09 | 8.76 | 30 |
| 37 | 31.69 o | 35.04 | 24.65 | 2.43 | 7.67 | 17.86 ghijk | 20.97 | 14.53 | 1.76 | 9.86 | 1.78 l | 2.31 | 1.56 | 0.16 | 8.97 | 30 |
| 38 | 18.46 a | 20.64 | 15.27 | 1.36 | 7.38 | 17.29 defgh | 19.48 | 15.52 | 1.04 | 6.02 | 1.07 abc | 1.25 | 0.89 | 0.06 | 6.02 | 50 |
| 39 | 20.67 ijkl | 23.33 | 18.00 | 0.93 | 4.52 | 18.69 jkl | 21.09 | 15.77 | 1.40 | 7.50 | 1.11 bcde | 1.34 | 0.96 | 0.10 | 9.16 | 30 |
| 40 | 17.54 ab | 20.42 | 11.78 | 1.80 | 10.29 | 16.65 defghi | 20.91 | 12.28 | 1.51 | 9.09 | 1.06 abcde | 1.24 | 0.81 | 0.09 | 8.93 | 47 |
| 41 | 22.16 mn | 25.48 | 17.78 | 1.50 | 6.77 | 18.95 klm | 20.83 | 15.67 | 1.16 | 6.14 | 1.17 defgh | 1.42 | 1.03 | 0.09 | 7.85 | 30 |
| 42 | 19.62 defghijk | 24.70 | 14.76 | 2.02 | 10.29 | 17.69 fghijk | 21.61 | 15.53 | 1.44 | 8.15 | 1.11 bcde | 1.26 | 0.91 | 0.08 | 7.54 | 30 |
| 43 | 19.48 defghijk | 21.79 | 16.01 | 1.30 | 6.68 | 18.14 hijk | 21.46 | 13.25 | 1.74 | 9.60 | 1.08 bcde | 1.42 | 0.91 | 0.11 | 10.16 | 30 |
| Total | 19.97 | 23.65 | 15.77 | 1.53 | 7.72 | 17.35 | 21.09 | 13.77 | 1.40 | 8.11 | 1.17 | 1.46 | 0.94 | 0.10 | 8.41 | - |
| CV betweenPopulations(%) | 10.80 | 11.21 | 14.48 | |||||||||||||
Different letters in a column indicate significant differences at p ≤ 0.05. Refer to Table 1 for details of site locations.
Table 3.
ANOVA of fruit width, fruit length, and fruit length-to-width ratio of 43 populations of Q. variabilis.
Table 3.
ANOVA of fruit width, fruit length, and fruit length-to-width ratio of 43 populations of Q. variabilis.
| Variance Source | df | SS | MS | F | p | |
|---|---|---|---|---|---|---|
| Fruit Length | Inter-group | 7183 | 42 | 171.015 | 39.28 | <0.001 |
| Intra-group | 10,232 | 2350 | 4.354 | |||
| Total | 17,415 | 2392 | ||||
| Fruit Width | Inter-group | 11,452 | 42 | 272.667 | 67.70 | <0.001 |
| Intra-group | 9464 | 2350 | 4.027 | |||
| Total | 20,916 | 2392 | ||||
| Fruit Length-to-Width Ratio | Inter-group | 84 | 42 | 2.009 | 105.42 | <0.001 |
| Intra-group | 45 | 2350 | 0.019 | |||
| Total | 129 | 2392 | ||||
Table 4.
Correlation between geoclimatic factors and phenotypic traits of Q. variabilis populations.
Table 4.
Correlation between geoclimatic factors and phenotypic traits of Q. variabilis populations.
| LON (°) | ELAT (°) | ALT (m) | MAT (°C) | MTW (°C) | AP (mm) | PWQ (mm) | |
|---|---|---|---|---|---|---|---|
| FL | −0.402 ** | 0.243 | −0.040 | −0.261 | 0.103 | −0.282 | −0.333 * |
| FW | −0.038 | 0.042 | 0.126 | −0.019 | −0.155 | −0.055 | −0.042 |
| FL/FW | −0.244 | 0.071 | −0.174 | −0.103 | 0.263 | −0.088 | −0.150 |
AP, annual precipitation; ELAT, equivalent latitude; LON, longitude; MAT, annual mean air temperature; MTW, maximum temperature of warmest month; PWQ, precipitation of wettest quarter; and ALT, altitude. ** p ≤ 0.01, * p ≤ 0.05.
Table 5.
Correlations between morphological (FL, FW), climatic (MAT, MTW, AP, and PWQ) and geographic (LON, LAT, ALT, and ELAT) distance matrices.
Table 5.
Correlations between morphological (FL, FW), climatic (MAT, MTW, AP, and PWQ) and geographic (LON, LAT, ALT, and ELAT) distance matrices.
| Comparison | r | p-Value |
|---|---|---|
| Morphological, Geographic | 0.633 | <0.001 |
| Morphological, Climate | 0.988 | <0.001 |
Table 6.
Principal component analysis loadings and percentage variance contributions by principal components.
Table 6.
Principal component analysis loadings and percentage variance contributions by principal components.
| Principal Component | PC1 | PC2 |
|---|---|---|
| FL | 0.38 | 0.93 |
| FW | −0.78 | 0.62 |
| FL/FW | 0.99 | 0.14 |
| Eigenvalue | 1.73 | 1.26 |
| Variance (%) | 57.57 | 42.03 |
| % Total Variance | 57.57 | 99.60 |
Publisher’s Note: MDPI stays neutral with regard to jurisdictional claims in published maps and institutional affiliations. |
© 2021 by the authors. Licensee MDPI, Basel, Switzerland. This article is an open access article distributed under the terms and conditions of the Creative Commons Attribution (CC BY) license (https://creativecommons.org/licenses/by/4.0/).
Share and Cite
MDPI and ACS Style
Gao, S.; Ren, Y.; Masabni, J.; Zou, F.; Xiong, H.; Zhu, J. Influence of Geographical and Climatic Factors on Quercus variabilis Blume Fruit Phenotypic Diversity. Diversity 2021, 13, 329. https://0-doi-org.brum.beds.ac.uk/10.3390/d13070329
AMA Style
Gao S, Ren Y, Masabni J, Zou F, Xiong H, Zhu J. Influence of Geographical and Climatic Factors on Quercus variabilis Blume Fruit Phenotypic Diversity. Diversity. 2021; 13(7):329. https://0-doi-org.brum.beds.ac.uk/10.3390/d13070329
Chicago/Turabian StyleGao, Shuang, Yue Ren, Joseph Masabni, Feng Zou, Huan Xiong, and Jingle Zhu. 2021. "Influence of Geographical and Climatic Factors on Quercus variabilis Blume Fruit Phenotypic Diversity" Diversity 13, no. 7: 329. https://0-doi-org.brum.beds.ac.uk/10.3390/d13070329
Note that from the first issue of 2016, this journal uses article numbers instead of page numbers. See further details here.