Article

The Role of Small Lowland Patches of Exotic Forests as Refuges of Rare Endemic Azorean Arthropods

by
Noelline Tsafack
1,2,
Simone Fattorini
3,
Mário Boieiro
1,
François Rigal
4,
Alejandra Ros-Prieto
1,
Maria Teresa Ferreira
2 and
Paulo A. V. Borges
1,*
1
cE3c—Centre for Ecology, Evolution and Environmental Changes/Azorean Biodiversity Group, Faculty of Agriculture and Environment, Department of Environmental Sciences and Engineering, Universidade dos Açores, 9700-042 Angra do Heroismo, Azores, Portugal
2
Project LIFE BEETLES (LIFE 18 NAT/PT/000864), Regional Secretariat of Environment and Climate Change, Rua do Galo n118, 9700-040 Angra do Heroismo, Azores, Portugal
3
Department of Life, Health and Environmental Sciences, University of L’Aquila, Via Vetoio, 67100 L’Aquila, Italy
4
Institut des Sciences Analytiques et de Physico-Chimie pour l’Environnement et les Matériaux, CNRS-Université de Pau et des Pays de l’Adour, E2S, UMR 5254, BP, CEDEX, 64000 Pau, France
*
Author to whom correspondence should be addressed.
Submission received: 27 August 2021 / Revised: 9 September 2021 / Accepted: 14 September 2021 / Published: 16 September 2021
(This article belongs to the Collection Evolution and Extinctions on Islands)

Abstract

:
Islands have been disproportionately affected by the current biodiversity crisis. In island biotas, one of the most recurrent anthropic alterations is species introduction. Invasion of exotic species may represent a major threat for island biotas, because invasive species may change species composition and simplify community dynamics. We investigated diversity patterns of native and introduced species in native and exotic forests of Terceira Island (Azores, Portugal) by using diversity profiles based on Hill numbers. Use of diversity profiles allows for a complete characterization of the community diversity because they combine information on species richness, rarity, and dominance. We found that native forest remnants are crucial for the maintenance of endemic Azorean arthropod diversity. However, we also found that some lowland patches of exotic forests can sustain populations of rare endemic species. Our findings reinforce the importance of the few and small remnants of native forests, which are a pillar to the conservation of Azorean endemic arthropods. However, areas occupied by exotic forests, whether they are large and contiguous or small and isolated, close to native forests, or embedded in a matrix of agriculture activities, can also play a role in the conservation of native species, including endemics.

Graphical Abstract

1. Introduction

A growing number of studies are providing clear evidence of an unprecedented and rapid decline in arthropod communities [1,2,3,4], with alarming decrease in flying insect biomass [5] and, more generally, in insect species diversity measures including richness and phylogenetic and functional diversity measures [6,7,8].
Islands have been disproportionately affected by the current biodiversity crisis [9,10]. Since human colonization, most islands have undergone dramatic human-mediated habitat changes and massive species introduction as a direct consequence of human colonization [11,12,13,14]. Invasion of exotic species may represent a major threat for island biotas, because invasive species may change species composition and simplify community dynamics [15,16,17,18]. Colonized by the Europeans since the fifteenth century, the Azorean Islands (Portugal) are an example of the impact of alien insects on island faunas. Exotic species constitute today a great part of the arthropod fauna of the Azores, reaching almost 60% of the total diversity [19], and represent one of the main threats to indigenous biota in the Azorean native forests. Recent evidence shows that instead of a direct general insect decline, Azorean Islands are experiencing the decline of a few native species and a general increase in exotic arthropod species diversity in pristine native habitats [20].
Conservation programs in the Azorean Islands have been so far mostly addressed the preservation of endemic arthropod species [21,22]. Endemics are important to inform conservation planning and aims as their higher conservation value [23] and relatively fast response to environmental changes [24]. Furthermore, due to their past adaptation to island native habitats, endemic arthropod might capture biodiversity trends on islands better than exotic species.
In the Azores, natural protected areas are essentially forest ecosystems. Because of intense human exploitation of lowland areas, current available native forests occur mostly above 500 m elevation and are principally composed of Laurus azorica (Seub.) Franco (Lauraceae), Ilex azorica Gand. (Aquifoliace), and Juniperus brevifolia (Hochst. ex Seub.) Antoine subsp. brevifolia (Cupressaceae) tree species [25], while exotic forests occur mostly at mid and lower elevations and are principally composed of Cryptomoria japonica D. Don (Cupressaceae), Pittosporum undulatum Vent. (Pittosporaceae), Eucalyptus globulus Labill. (Myrtaceae), and Acacia melanoxylon R. Br. (Fabaceae) species [26]. The remaining habitats are represented by urban areas, intensive pasture lands, and agricultural fields. Previous studies on the impact of anthropogenic activities on the Azorean arthropod fauna found that endemic species tend to be restricted to patches of native vegetation [26,27,28,29,30,31], whereas introduced species are favored in human modified habitats [26,31].
In this study, we analyzed arthropod communities of Terceira Island (the second largest island in the Azorean archipelago) to highlight how the abundance and diversity of endemic, native non-endemic, and exotic species are influenced by the type (native or exotic) of forests. Use of diversity profiles based on Hill numbers [32] allows for a complete characterization of the diversity of a community [33], because they combine information on species richness, species rarity, and species dominance. Then, we used beta diversity metrics to assess how species composition endemic, native non-endemic, and exotic arthropods vary between native and exotic forests. We also focused our study on four most dominant taxonomic groups—Araneae, Coleoptera, Hemiptera, and Psocoptera.
In particular:
(1)
We predict that endemic and native non-endemic species should exhibit higher values of diversity and abundance in the native forests than in the exotic forests, while introduced species should display opposite patterns;
(2)
Given the differences in community dynamics of rare, common, or dominant species, we hypothesized that some dominant endemic and native non-endemic species with broad ecological needs will also find refuge in exotic forest sites, while some introduced species will be common in native forests if they are superior competitors in respect to endemic and native non-endemic species;
(3)
We predict that introduced species should show higher β-diversity between and within forests, while endemic and native non-endemic species should present high β-diversity between native and exotic forests and within exotic forest sites, but lower β-diversity values within native forest sites [20,34].
Based on recent evidence about the occurrence of some endemic arthropods in low-elevation small patches of exotic forest [35,36,37,38,39], our study illustrate the relative importance of lowland isolated exotic forest areas for arthropod conservation in the Azores.

2. Materials and Methods

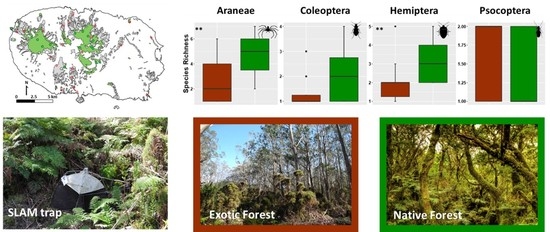
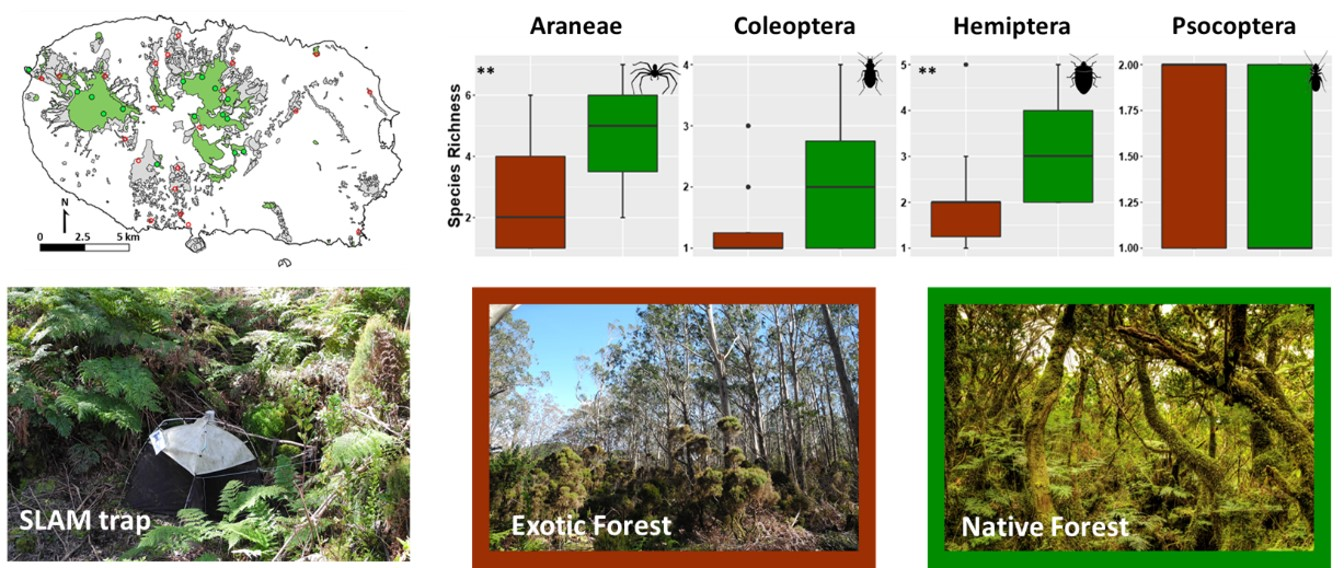
2.1. Study Area and Site Selection

The study was carried out in Terceira, one of the nine islands of the Azorean archipelago (Portugal). Terceira belongs to the Central Group of islands (being located at 38°43′40″ N, 27°12′48″ W), it is roughly circular and is the third largest (402 km2) island of this archipelago [40]. Terceira is the Azorean Island with the largest continuous total surface occupied by native forests and hosts some of the most pristine forest fragments [22]. Native forests covered most of the island’s land surface before human colonization but suffered a reduction of over 90% during the past five centuries [10,41,42]. In Terceira, only five native forest fragments survived the severe and generalized human impact, occupying ~6% of the island’s surface (i.e., 23 km2). These fragments are mostly restricted to mountain areas above 500 a.s.l. The dominant tree and shrub species in the Azorean native forests are the endemic Erica azorica Hochst. Ex Seub. (Ericaceae), Ilex azorica Gand. (Aquifoliace), Juniperus brevifolia (Hochst. Ex Seub.) Antoine subsp. brevifolia (Cupressaceae), Laurus azorica (Seub.) Franco (Lauraceae), and Vaccinium cylindraceum Sm. (Ericaceae) [25,40]. The native forest fragments harbor a high number of endemic arthropod species and were included in the recently created Terceira Island Natural Park [21,43]. Forest plantations of exotic trees are also an important feature of Terceira’s landscapes and occupy nearly 14% of the island’s surface. Exotic forests are represented by plantations of Cryptomeria japonica D. Don (Cupressaceae), which were planted in the last century to fuel local industries and for protection of pastures against wind; Pittosporum undulatum Vent. (Pittosporaceae), introduced on the island to protect orange tree orchards from wind became one of the worst invasive species in the Azores after the abandonment of orange production [44]. In this study, we selected 36 sampling sites representative of the different native and exotic forests present on the island. Fifteen sites were located in native forest areas encompassing the five extant forest fragments and 21 sites including all exotic trees sites (Figure S1, species’ authorities and families are given in Table S1).

2.2. Arthropod Sampling and Identification

We adopted a multi-taxon approach by sampling four different taxonomic groups: spiders (Araneae), bugs (Hemiptera), Psocoptera (booklice), and Coleoptera (beetles). These arthropod groups play key roles for forest ecosystems and their diversity; taxonomy and ecology is well known in the Azores [19]. Furthermore, they may be susceptible to habitat changes and may provide complementary information for conservation management due to their differences in trophic ecology and dispersal ability. We sampled the target groups by using SLAM (sea, land, and air malaise) traps fixed to the soil and covering an area of at least 5 m × 5 m or larger depending on the density of trees in the forest. SLAM is a type of passive flight interception trap suitable to sample mobile arthropods. These traps are a modified version of traditional malaise traps and consist of a framework of shock-corded poles to which the netting trap clips and allow the interception of arthropods moving from four different directions. The trap has 110 × 110 × 110 cm dimensions and a central black mesh to funnel the individuals to a sampling bottle at the top. Sampling bottles contained propylene glycol as a preservative and were monitored every three months to reflect seasonal changes (with samples taken in mid-March, June, September, and December 2019). The sampled specimens were transported to the lab, sorted to morphospecies, and identified to species level by one of the authors (P.A.V.B.). The specimens were identified using a Leica M5 stereomicroscope using specific literature and a reference collection on the Azorean terrestrial arthropod biodiversity. When identification was not possible, we kept a morphospecies identifier to a given taxon. Later, the specimens were deposited in the Entomological Collection Dalberto Teixeira Pombo at the University of the Azores. Each species was assigned to one of the three biogeographical categories according to its distribution in Azorean archipelago ([19]: endemic (species restricted to the Azores), native non-endemic (species that arrived naturally to the archipelago, but are also present elsewhere), and non-native (species accidentally or deliberately introduced by man).

2.3. Data Analysis

Arthropod assemblages in native and exotic forests were characterized by their diversity and composition using alpha diversity, beta diversity, and sites’ contribution to beta diversity. Statistical analyses were run using the R analysis language [45].
Alpha diversity was expressed using Hill numbers corresponding to Chao’s species richness (q = 0), exponential Shannon diversity (q = 1), and Simpson diversity (q = 2) with an interpolation–extrapolation method [46]. Alpha diversity values were calculated at the type of forest level and at the site level. Alpha diversity estimates were calculated using the function “iNEXT” in the R package iNEXT version 2.0.20. Alpha diversity estimates at the site level were compared using a Kruskal–Wallis test.
We computed β-diversity on presence–absence data using Jaccard’s dissimilarity coefficient. To capture the processes underlying species dissimilarity among communities, we partitioned the overall β-diversity values into their species replacement (change in diversity due to species turnover) and species richness (change in diversity due to differences in species richness) components [47]. We calculated β-diversity within sites in exotic and in native forests using the function “beta.div” in the R package “adespatial” version 0.3-14 [48]. In order to assess the uniqueness of study sites in term of species composition, we computed the local contributions to beta diversity (LCBD indices) of each site [49] using the functions beta.div.comp and LCBD.comp in adespatial [48]. LCBD indices were computed within each type of forest (native and exotic). High LCBD values indicate sites that have a unique species composition [50].
Finally, species abundances between the two habitats were compared using a Wilcoxon test. Total abundances between the three biogeographical categories were also compared using a Chi-square test (regardless of the type of forest) and for each types of forests (native vs. exotic) using a binomial test.

3. Results

3.1. Overall Patterns of Abundances and Species Richness of Arthropods Communities in Native and Exotic Forests

We collected a total of 17,557 individuals belonging to 378 (morpho)species. Beetles were the richest group, accounting for 55% of collected species, followed by spiders (20% of the species) and bugs (18%); booklice included some 7% of the species. Bugs were the most abundant group (49% of collected individuals), followed by booklice (21%), spiders (16%), and beetles (15%) (Table 1).
More than half of the species (57%) were introduced species; native non-endemic species represented 29% of collected species, and endemics 15%. However, almost half of the collected specimens (47%) belonged to native non-endemic species; endemic species accounted for 35% of collected specimens, whereas introduced species were 18% of the collected specimens. Therefore, although introduced taxa are the richest in the number of species, they were not the dominant group, which was represented by native non-endemics. Differences in abundance and species richness between endemic, introduced, and native non-endemic species were significant for the four taxonomic groups, except in booklice species where the total number of species in endemic, introduced, and non-native categories were not significantly different (Table 1).
For all groups, abundance of endemic, introduced, and native species differed from a uniform distribution. When all groups were considered together, native species were more abundant than the endemic ones, whereas the introduced species were the less abundant. However, when the various groups were analyzed separately, different patterns emerged. In spiders, the most abundant species were the endemic, followed by the introduced and the native species. In beetles, introduced species were the most abundant, followed by the native; endemic species were the least abundant. In bugs and booklice, introduced species were the least abundant, whereas native non-endemic species were the most abundant (Table 1).
For all groups, proportions of endemic, introduced, and native species deviated significantly from a uniform distribution, with most of the species being introduced. When all groups were considered together, introduced species were the most represented in spiders (followed by endemic) and beetles (followed by native), whereas native non-endemic (followed by introduced) were the most represented in bugs and booklice (Table 1).
Comparing species richness of the three biogeographical categories (endemic, introduced, and native species), the total number of endemic species and native non-endemic species was similar between exotic and native forests, whereas introduced species were more abundant in the exotic forests (Table 2). Among beetles and bugs, introduced species had more species in exotic than in native forests, whereas both endemic and native non-endemic species had similar number of species in native and exotic forests. In spiders and booklice, endemic, introduced, and native non-endemic had similar values in native and exotic forests (Table 2).
Comparing abundances of the three biogeographical categories between native and exotic forests, endemic, and native non-endemic species were more abundant in native than in exotic forests (but the difference was not significant for native non-endemic species), whereas introduced species were more abundant in the exotic forests (Table 2). Among spiders, endemic species were more abundant in native than in exotic forests, whereas both introduced and native non-endemic species were more abundant in the exotic forests. Endemic, native non-endemic, and introduced beetles and booklice were all more abundant in exotic than in native forests (differences between native and exotic forests for endemic species were not significant). Among bugs, endemic and native non-endemic species were more abundant in native than in exotic forests, whereas the introduced species were more abundant in the exotic forests (Table 2).
Comparing the abundance of each species between native and exotic forests, most of the endemic species were shared between native and exotic forests, but some spiders and beetle species were present only in exotic forests (taxonomic details are given in Table S2). Two spider species (Rugathodes acoreensis and Acorigone acoreensis) were significantly more abundant in the native forests than in the exotic forests. However, one spider species was more abundant in exotic forests (Savigniorrhipis acoreensis). Among beetles, four species were commonly shared by the two habitats, but only one was significantly more abundant in native forests (Notothecta dryochares). All bugs species were present in both native and exotic forests, and two endemic species (Cixius azoterceirae and Pinalitus oromii) were significantly more abundant in native forest. The two booklice endemic species were both present in native and exotic forests with no difference in their abundance (Table S2).
In general, native non-endemic spiders and booklice were observed in both native and exotic forests, while for beetles and bugs, most of native species were observed only in exotic forests. All spider species were present in both native and exotic forests except Macaroeris diligens, only present in exotic forests, and Xysticus cor, only present in the native forests. Among the species common to both habitats, one was significantly more abundant in the native forests (Macaroeris cata), and one was significantly more abundant in exotic forests (Porrhoclubiona decora) (taxonomic details are given in Table S3). Out of the thirty native non-endemic beetle species sampled, sixteen were present only in exotic forests and three where present only in the native forests. Among the species found in both native and exotic forests, two showed significant differences in abundance: Aloconota sulcifrons was more abundant in the native forests, and Kalcapion semivittatum in the exotic forest. (Table S3). Out of the twenty-seven native non-endemic bug species sampled in our study, nine were observed only in exotic forests. Among the shared species, four (Cinara juniperi, Loricula elegantula, Nabis pseudoferus ibericus, and Trioza laurisilvae) were significantly more abundant in the native forests, while one (Campyloneura virgula) was more abundant in exotic forests (Table S3). All native non-endemic booklice species were present in both native and exotic forests with similar abundances except two species (Trichopsocus clarus and Valenzuela burmeisteri), which were more abundant the exotic than in the native forests (Table S3).
Introduced species were more abundant in exotic than native forests (taxonomic details are given in Table S4). One introduced spider species (Ero furcata) was significantly associated with native forests. Among beetles, one was significantly associated with native forests (Sericoderus lateralis), while three were associated with exotic forests (Anobium punctatum and Tachyporus chrysomelinus). Among bugs, only one species (Acizzia uncatoide) was observed in native and exotic forests with no significant difference. One booklouse species (Ectopsocus briggsi) was significantly more abundant in exotic forests (Table S4).

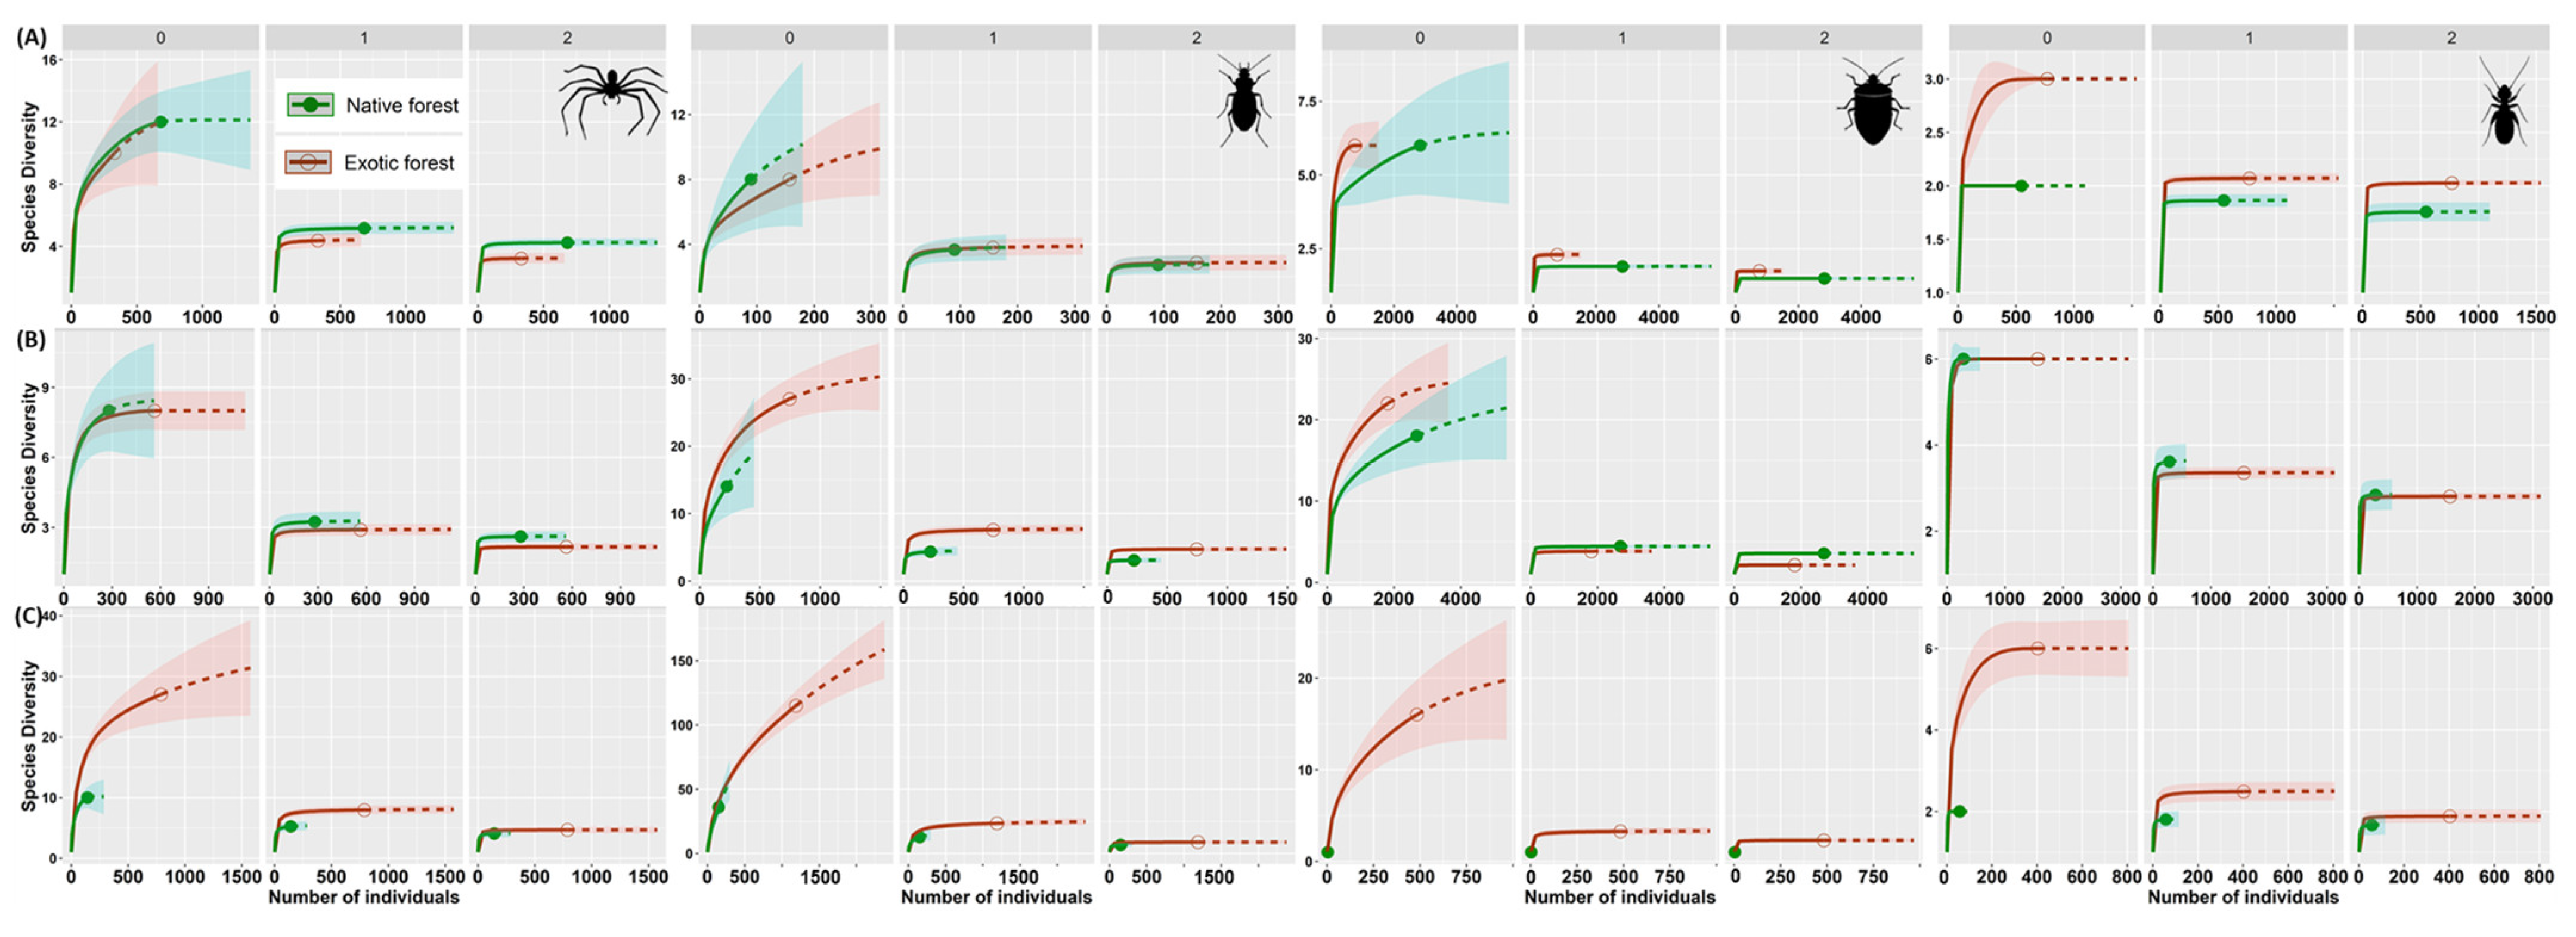
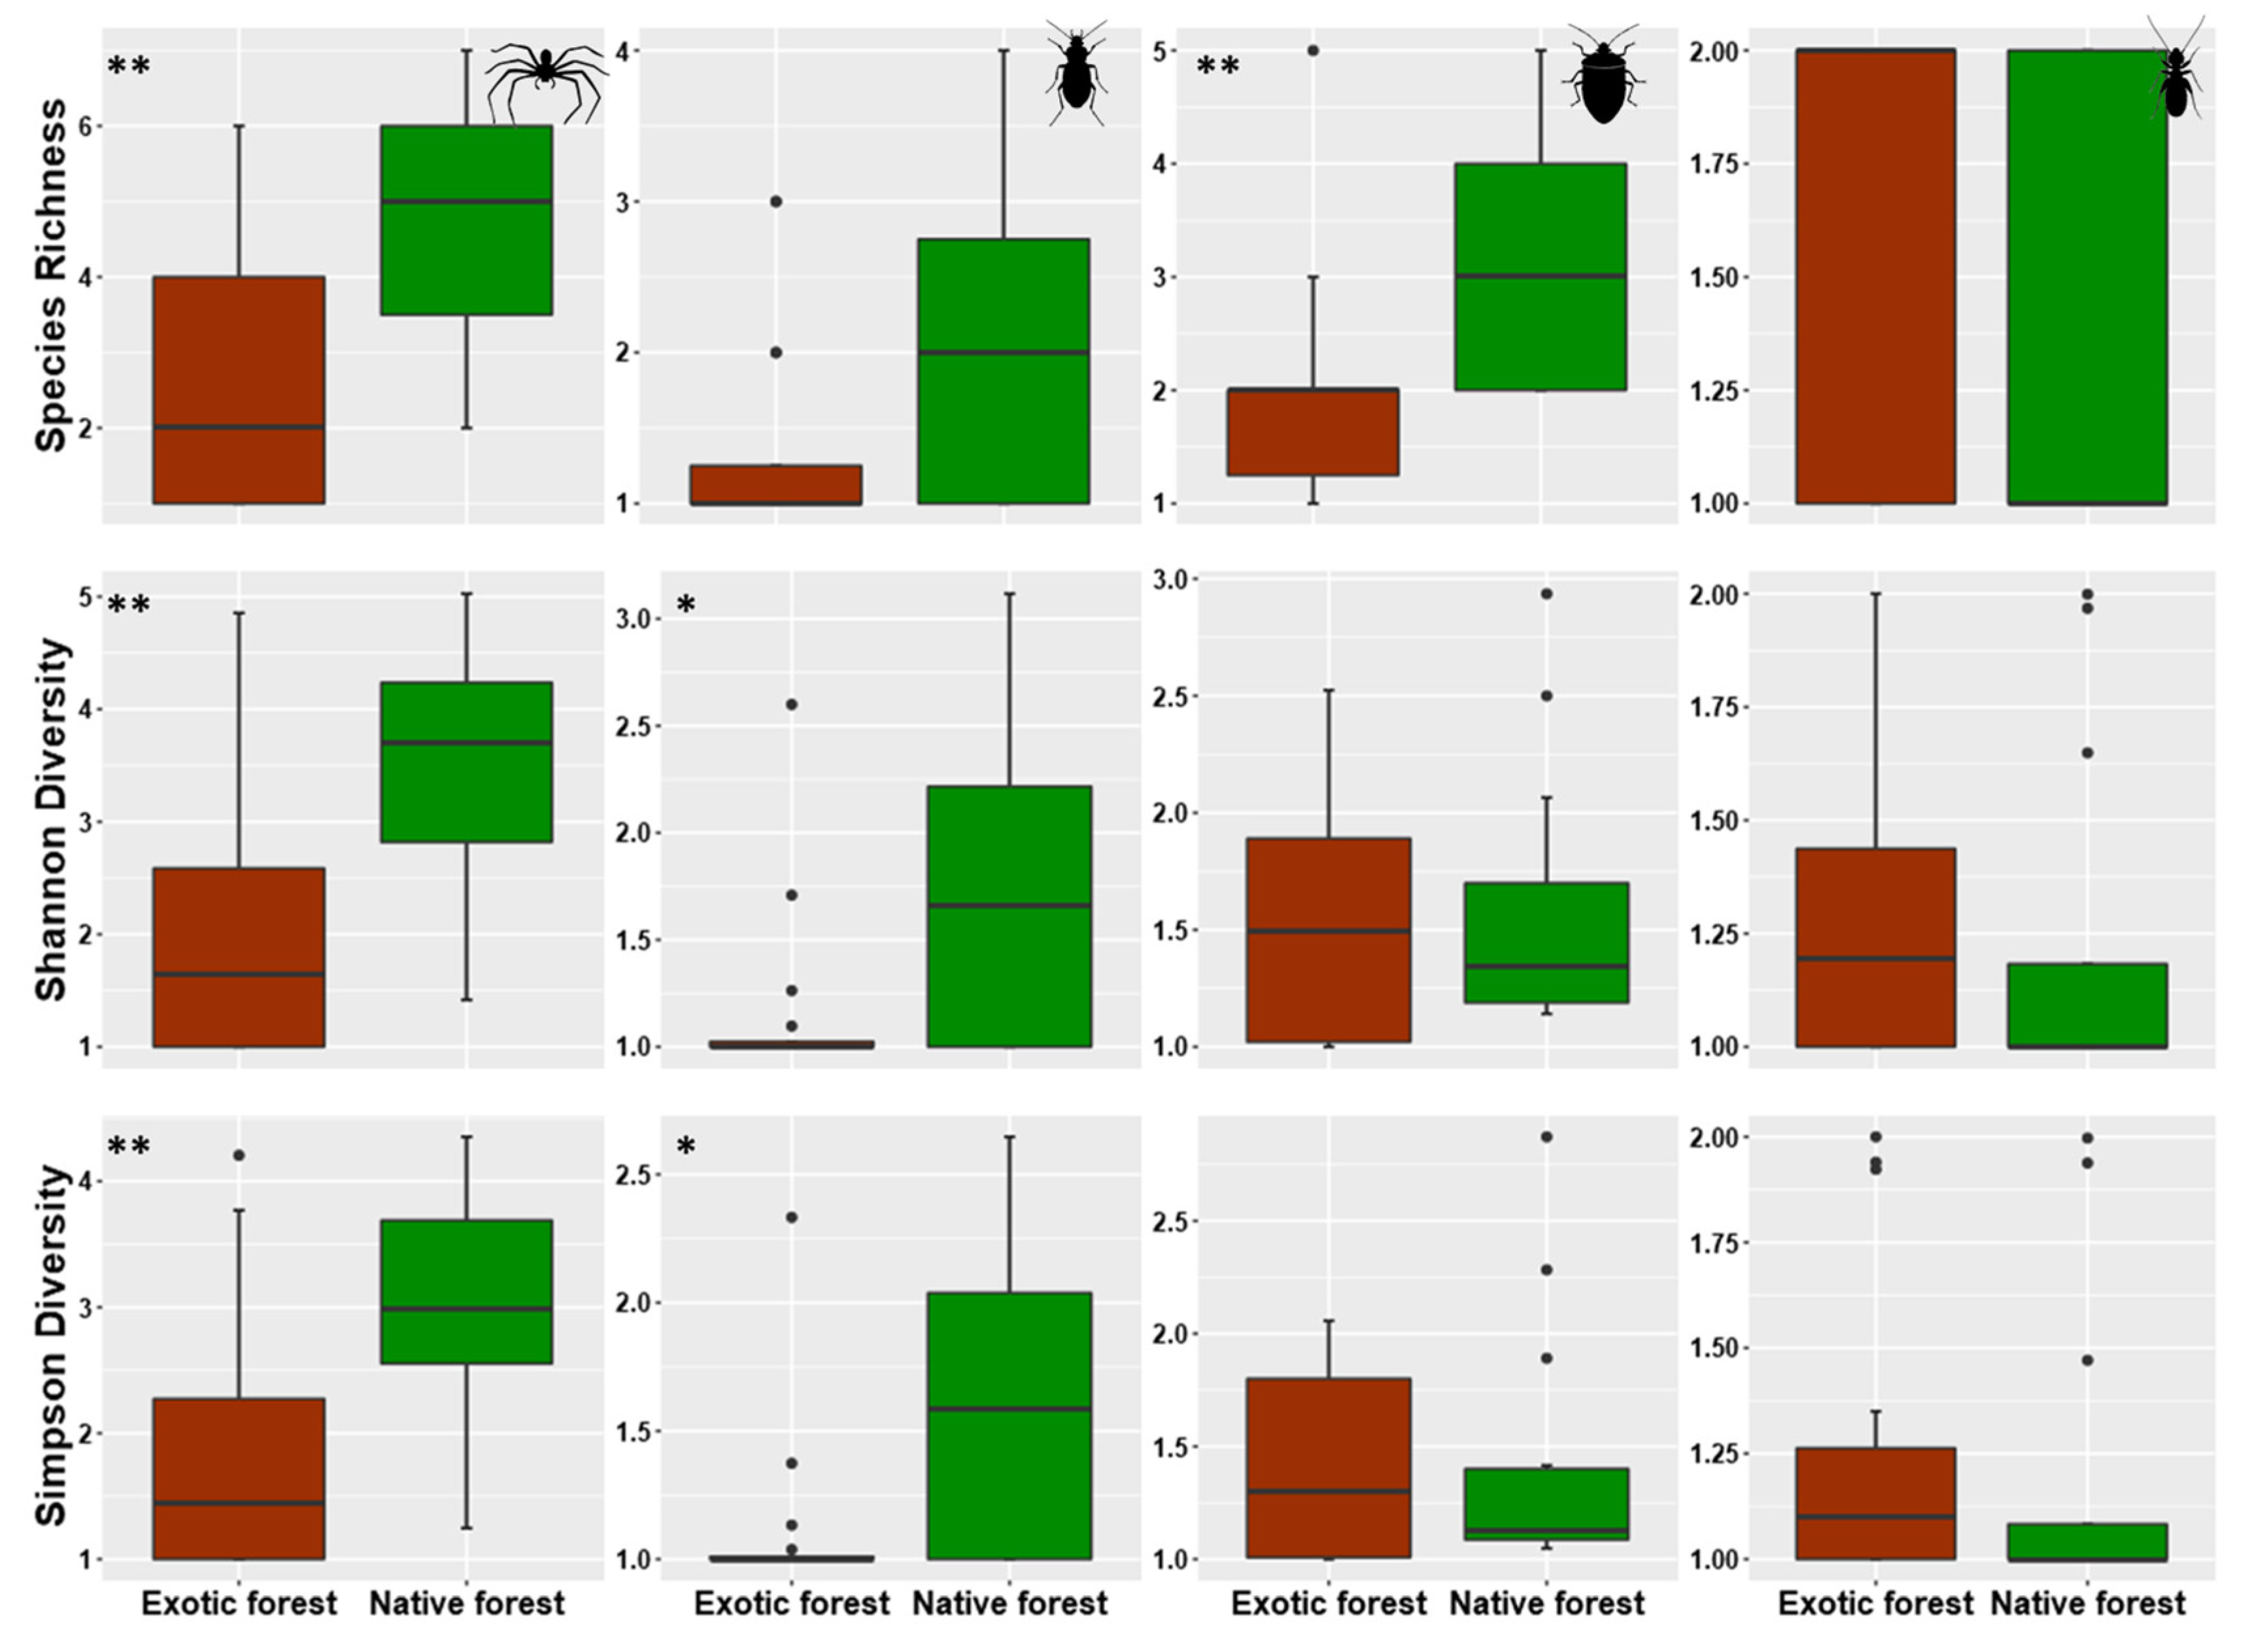
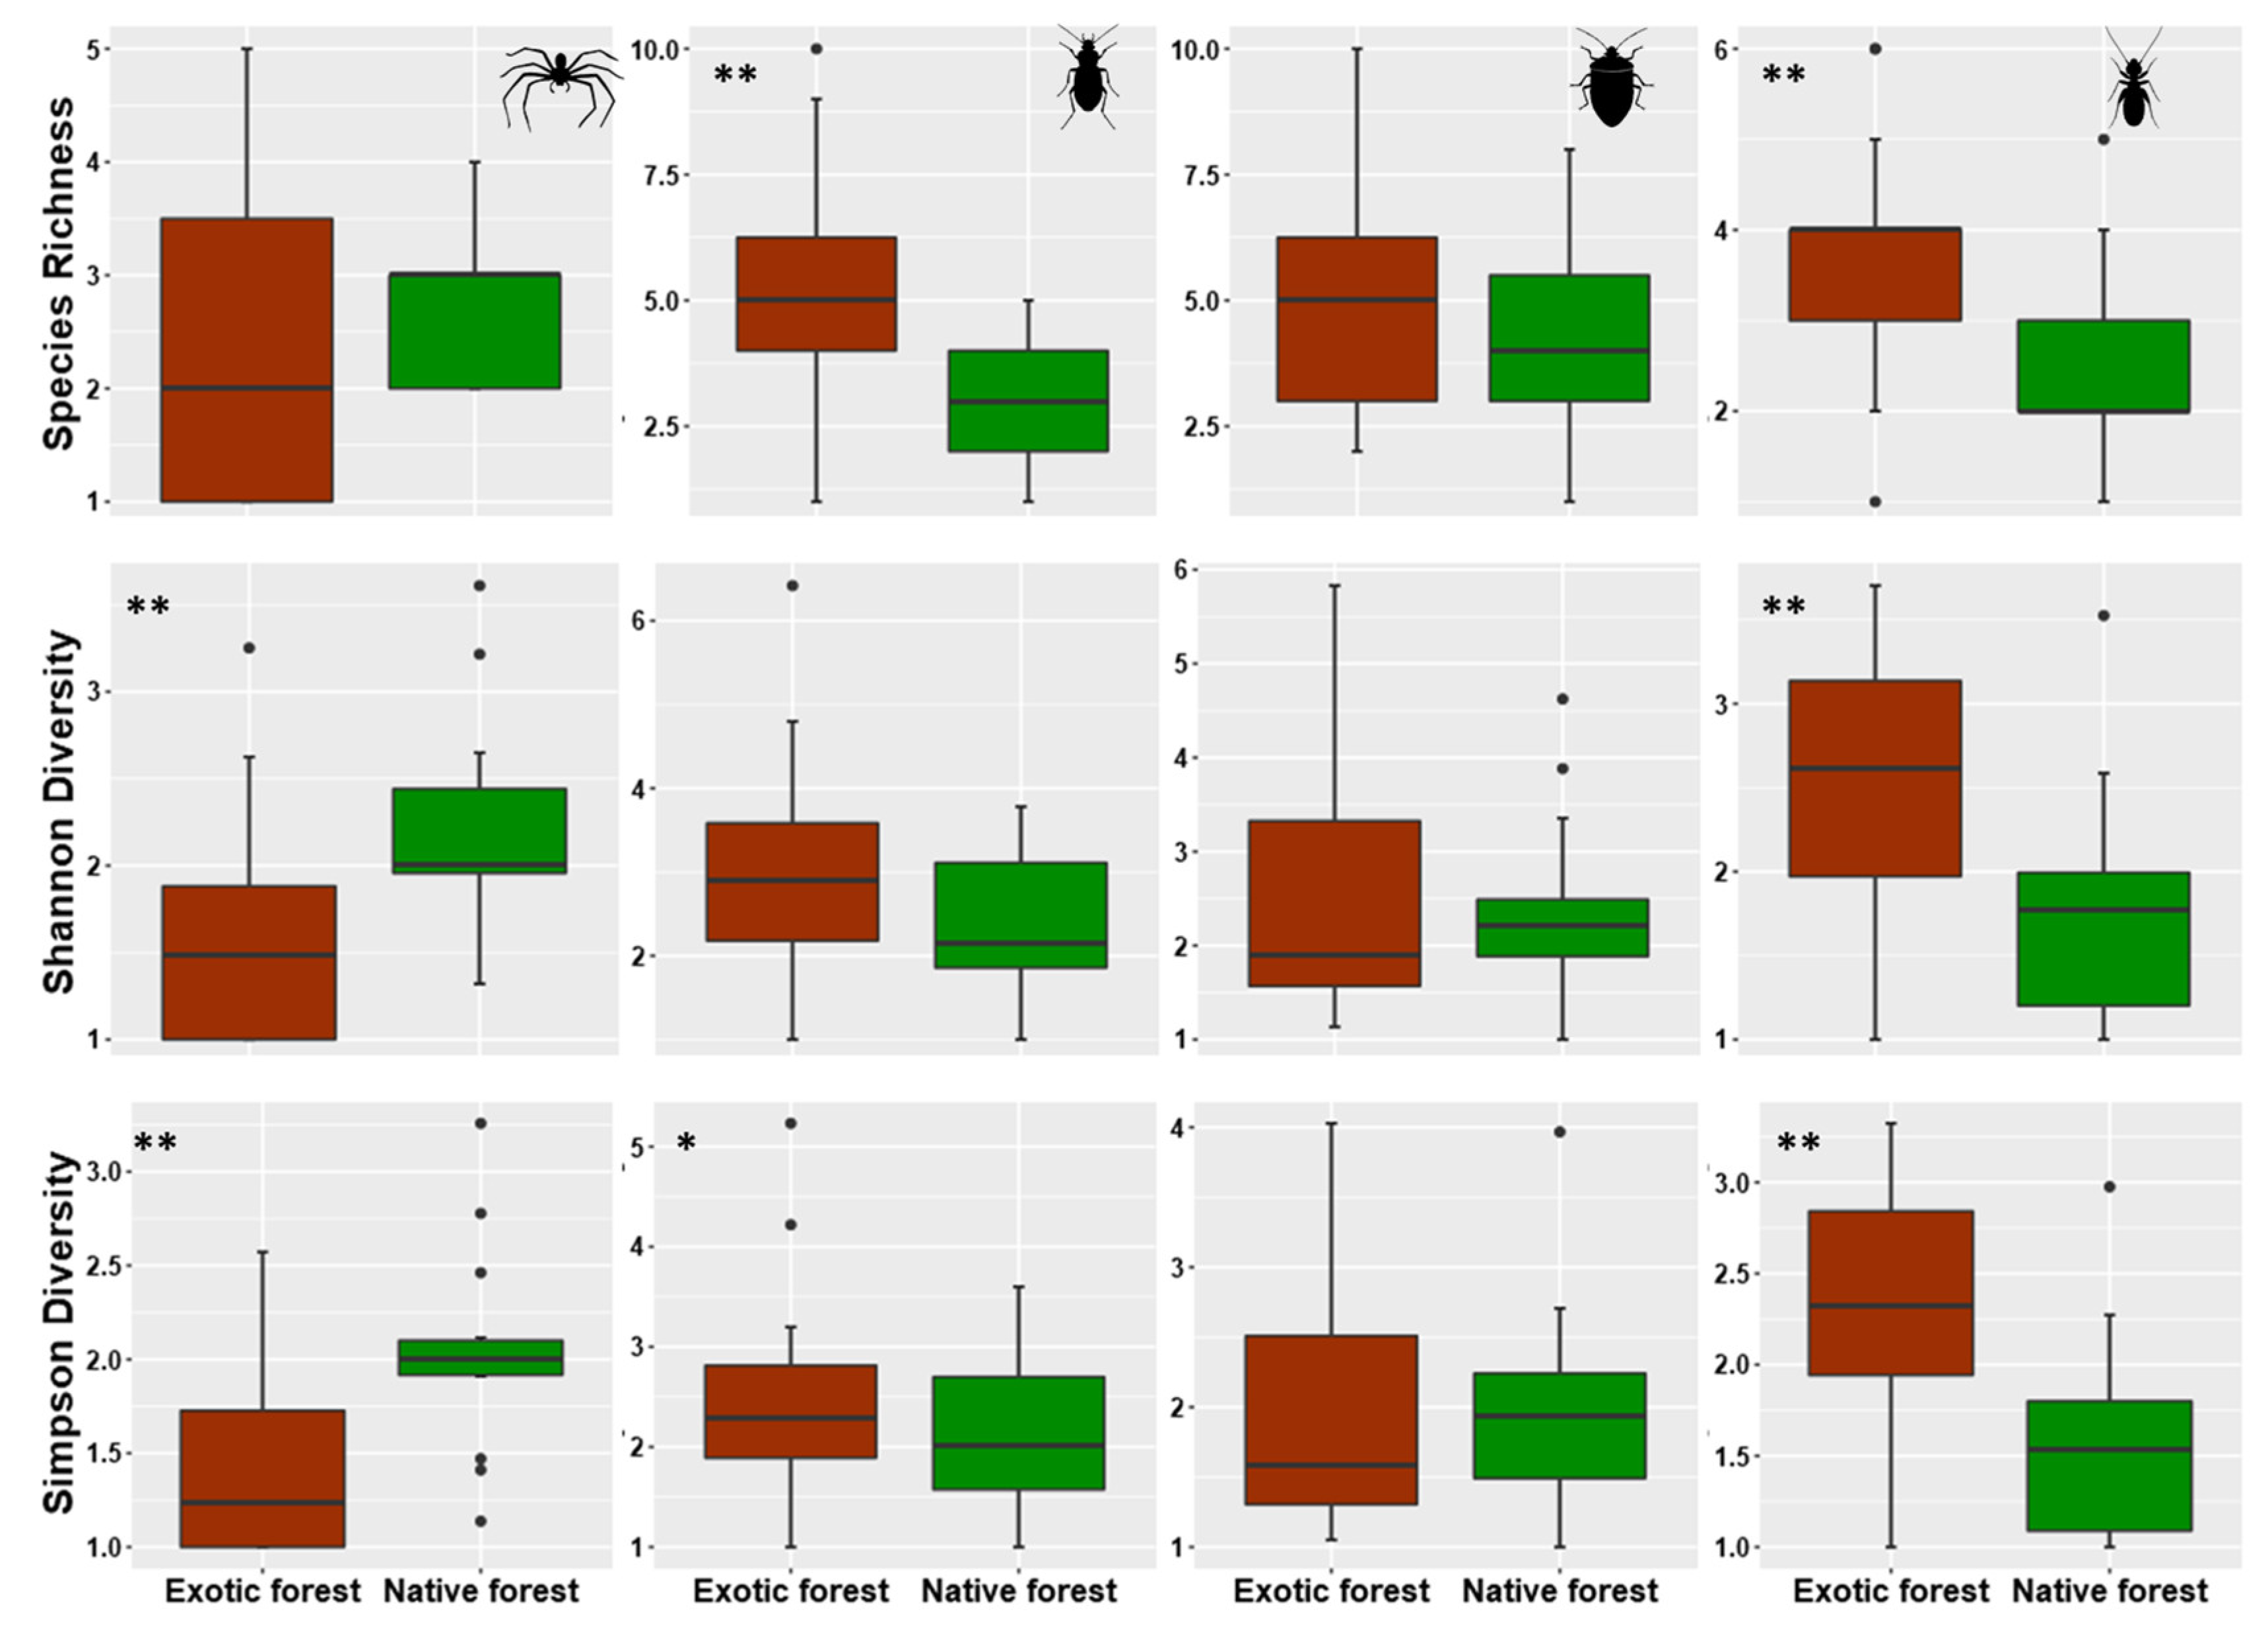
3.2. Assessing Local Diversity: α-Diversity in Native and Exotic Forests

Regarding endemic species, for spider, native forests were more diverse than exotic forests for all three indices (Chao richness, q = 0; Shannon Diversity, q = 1; Simpson Diversity q = 2) at both forest (Figure 1A) and site (Figure 2) scales of analysis, with strong significant differences (p < 0.01). We found similar results for beetles where diversity at the site scale (Figure 1A) was higher in native forests than in exotic forests with significant differences for common (q = 1) and dominant (q = 2) species (but not for rare species, q = 0). However, at the forest scale, diversity was slightly higher in native forests than in exotic forests, while species diversity was similar within common (q = 1) and dominant (q = 2) species (Figure 3). Among bugs, richness (q = 0) was significantly higher in native than in exotic forests; for the other indices (q = 1, q = 2), diversity was lower in the native forests (Figure 1A), but differences were significant when tested at site level (Figure 2). In the booklice, native forests had lower diversity values, although this was not significant when tested at site level, possibly because of the small number of trapped species (Figure 2).
For native non-endemic species, native forests were more diverse than exotic forests for the spider assemblages (Figure 1B) with significant differences for the Shannon (q = 1) and Simpson indices (q = 2) at site level (Figure 3). The same pattern was observed in the booklice (Figure 1B) with significant differences at site level for all three indices (Figure 3). By contrast, exotic forests were more diverse than native forests in beetles (Figure 1B) for all three indices, with significant differences at site level for richness (q = 1) and Simpson (q = 2) indices (Figure 3). No difference was found between exotic and native forests for the bug diversity at site level (Figure 3), although richness (q = 0) was higher in the exotic forest diversity curve (Figure 1B).
Finally, concerning introduced species, exotic forests supported higher diversity than native forests for all four taxonomic groups and for all three diversity indices (Figure 1C). However, for spiders, exotic forests had a significantly higher diversity at site level only for richness (q = 0), whereas in beetles, the difference was significant for both richness (q = 0) and Shannon diversity (q = 1) (Figure 4). Additionally, caution should be taken with the booklice (only nine introduced species were trapped, Table 1) and bugs (which had only one introduced species in the native forest) results (Table 2).

3.3. Detecting Diversity Change between Native and Exotic Forests and within Sites of Each Type of Forest: β-Diversity and Its Components

3.3.1. Change in Diversity between Native and Exotic Forest

In all taxonomic groups, β-diversity values were higher among introduced species and mostly due to the differences in richness (which contributed for 80% to beetle and spider β-diversity and was the only source of β-diversity in bugs and booklice) (Table 3). Among the endemic species, β-diversity was relatively high in beetles (0.333), low in spiders and booklice (0.154 and 0.167, respectively), and absent in bugs, as the same species composition was trapped in both native and exotic forest. (Table 3, Figure 5A). The main source of β-diversity varied among taxonomic groups: β-diversity was entirely due to replacement in endemic beetles and to richness in endemic booklice, whereas both richness and replacement contributed similarly to β-diversity among endemic spider species (Table 3, Figure 5A). Finally, β-diversity was very low for native non-endemic booklice and native spiders (where it was completely due to replacement), relatively high in native bugs (where it was mostly due to replacement), and highest in beetles (where it was completely due to replacement) (Table 3, Figure 5A).

3.3.2. Change in Diversity between Sites (Inside) of Each Forest Type

In native forest sites, β-diversity was higher in introduced spiders and beetles, where, however, endemic and native species also had relatively high values. In all cases, richness and replacement contributed to β-diversity with similar proportions (Figure 5B). In bugs and booklice, β-diversity was highest for the native species, and it was mostly due to richness differences; endemics had lower values of β-diversity, and among introduced species, β-diversity had very low values (and entirely due to richness) in booklice and absent in bugs, because only one introduced bug species was collected in native forest) (Table 3, Figure 5B). In exotic forest, β-diversity was relatively high in all taxonomic groups and mostly due to differences in species richness (Figure 5C). The highest β-diversity values were observed for introduced species, except for bugs, where it was highest in native non-endemic species (Table 3).

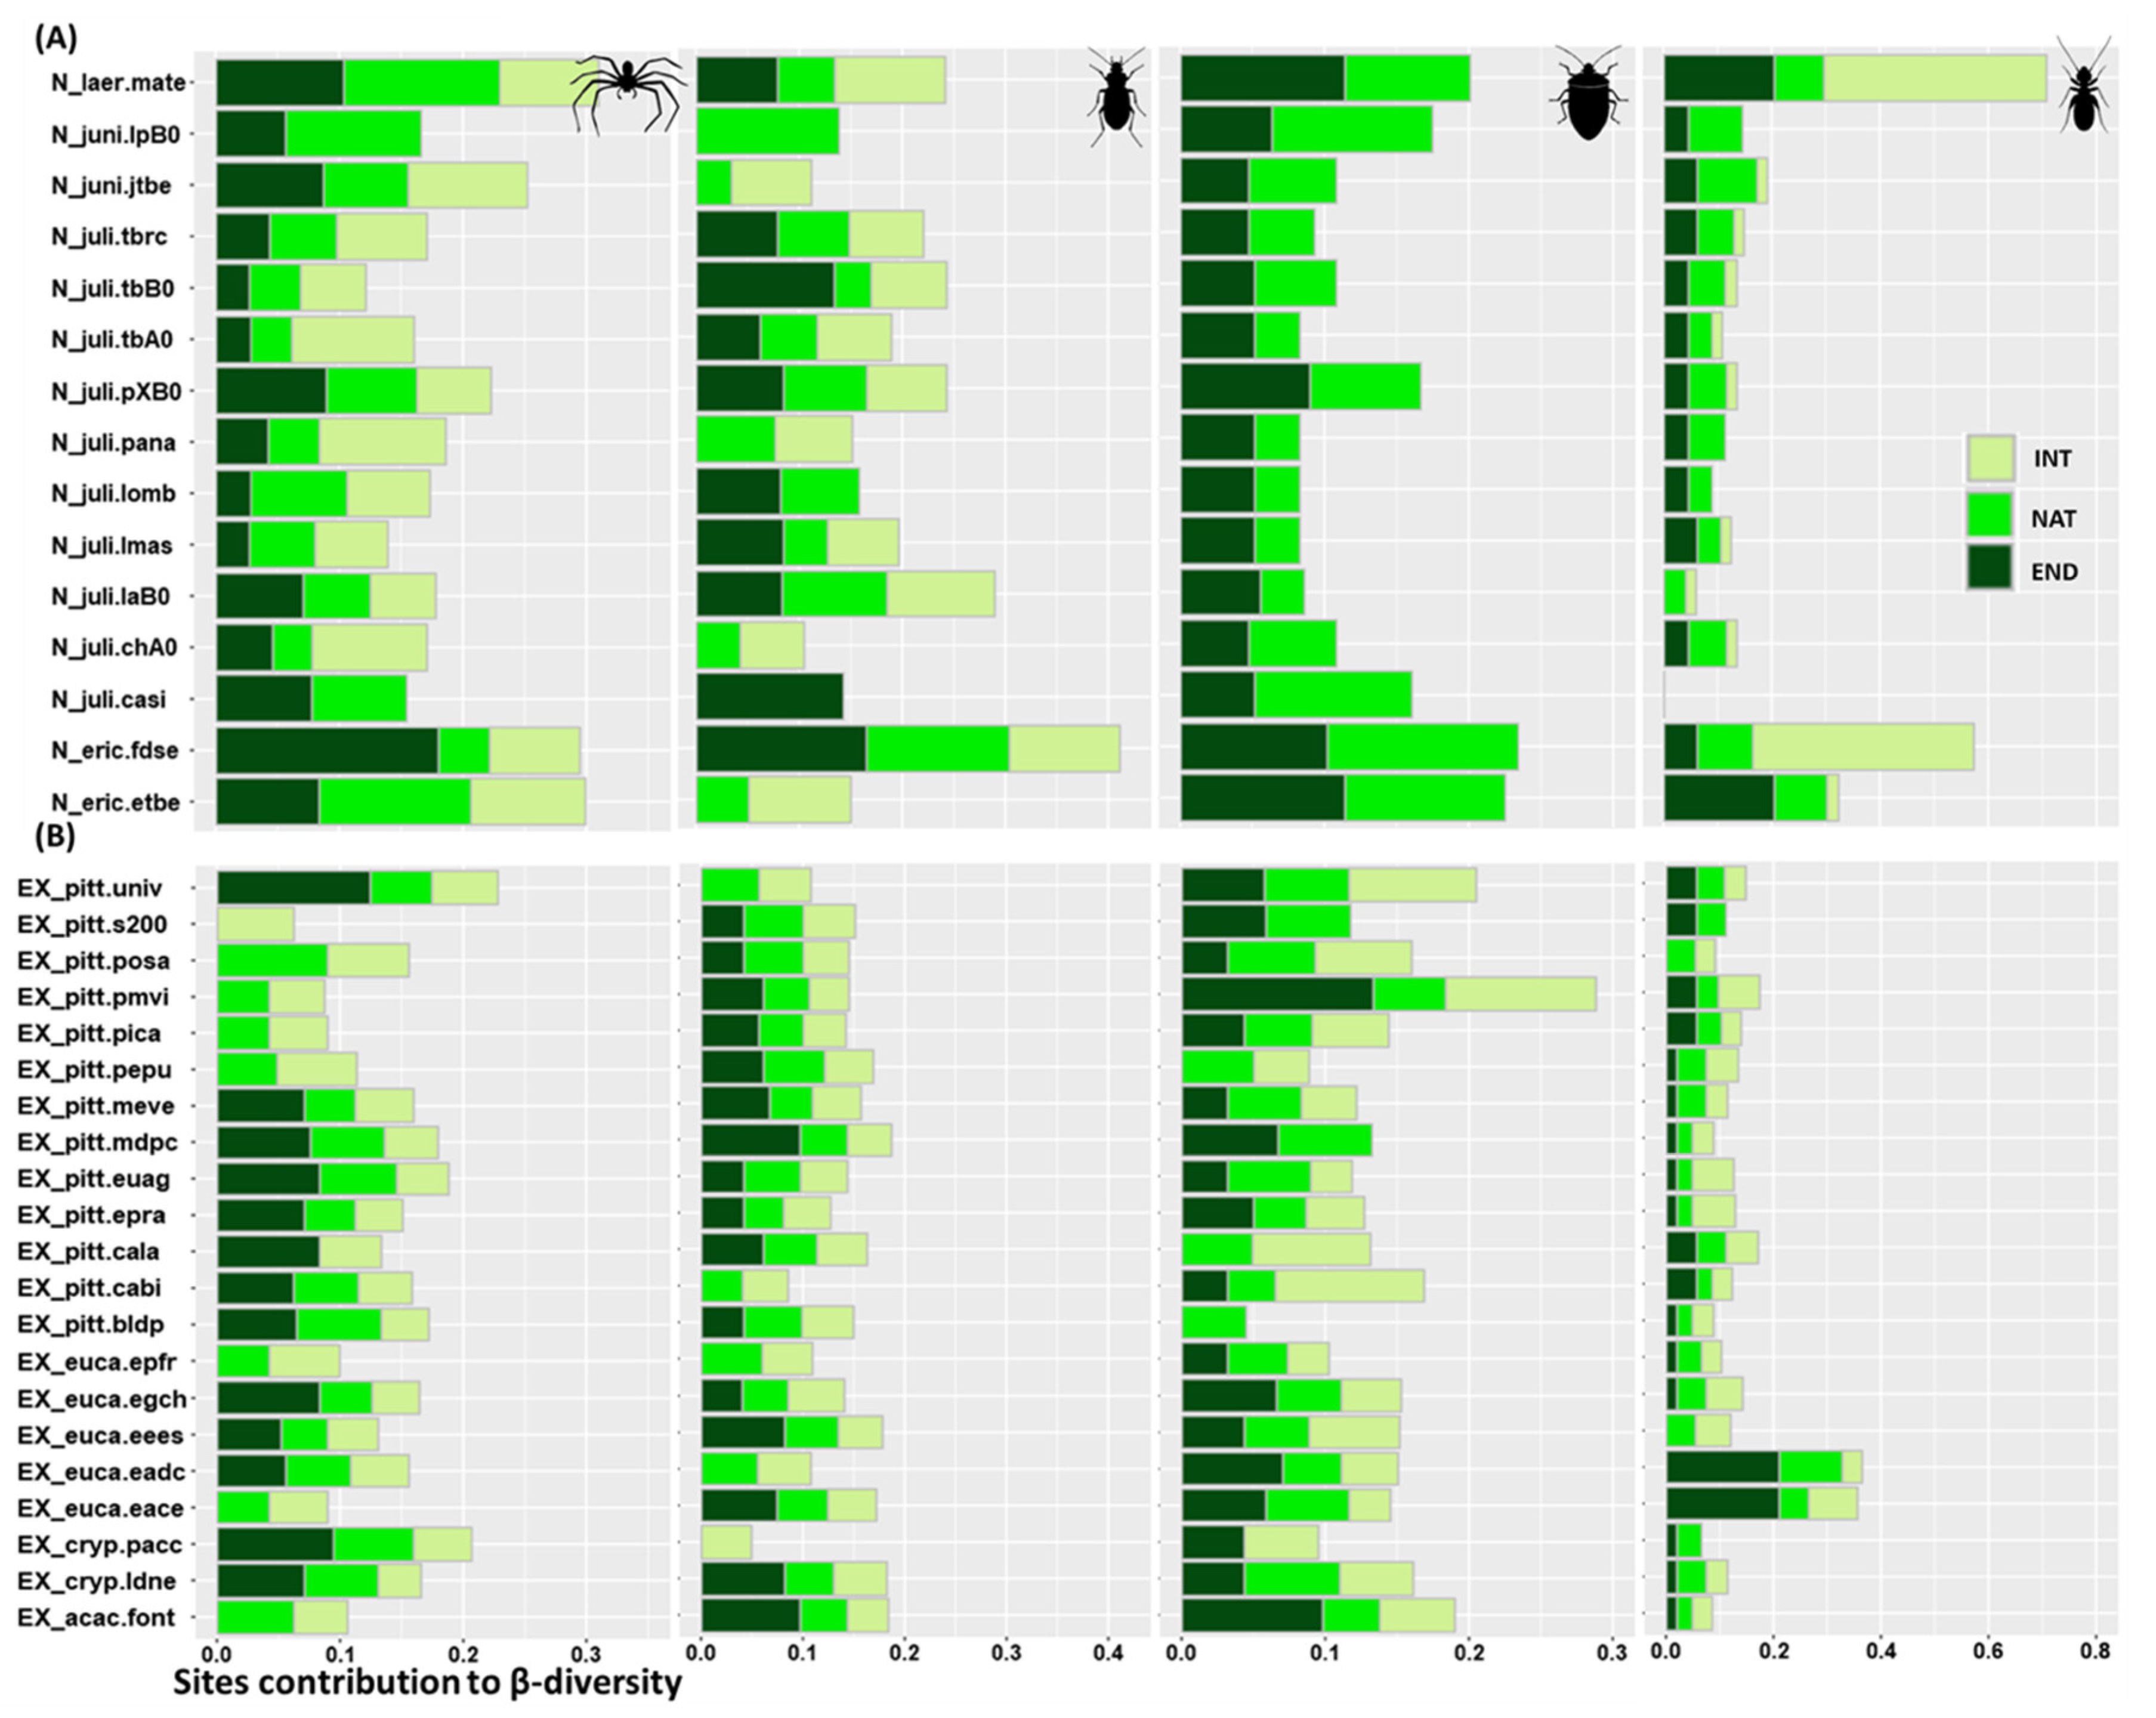
3.4. Sites Contribution to β-Diversity

In general, local contributions to beta diversity (LCBD indices) of native forest sites were higher than LCBD values of exotic forest sites (Figure 6).
We found high variability among different taxonomic groups. All sites of native and exotic forests contributed to β-diversity for native non-endemic spider species. All sites in native forests also contributed to β-diversity of endemic spiders, but in exotic forests, only 13 out of 21 sites highly contributed to β-diversity of endemic spiders (Figure 6). All sites in exotic forests contributed to β-diversity of introduced spiders, whereas a few sites of native forests did not contribute to β-diversity of introduced spiders. Among beetles, a native forest site dominated by Juniperus, Laurus, and Ilex contributed to β-diversity of native non-endemic species, but not to β-diversity of introduced and endemic species, while another site with the same tree composition contributed to the beta β-diversity only for endemic species (Figure 6A). All native forest sites contributed to β-diversity of native and endemic bugs (but not to the β-diversity of introduced species as only one introduced bug was trapped in native forest). Exotic forest sites contributed to β-diversity of endemic, native, and introduced bugs, except a Pittosporum site, which was not important for introduced species (Figure 6B). The contribution of sites to booklice β-diversity was relatively homogeneous with the exception of one native forest site (where no booklice were found) and two exotic forest sites (Eucalyptus sites), which were very important for endemic species (Figure 6).

4. Discussion

We investigated the occurrence of endemics, native non-endemic, and introduced species in native and exotic forests of Terceira Island (Azorean Islands). We found that native forest remnants are crucial for the maintenance of endemic arthropod diversity. However, we also found that some lowland patches of exotic forests can sustain endemic species.

4.1. Abundance and Species Richness General Patterns within and between Native and Exotic Forests

As expected, we found that endemic species were more abundant in native than in exotic forests, but—contrary to expectation—the number of endemic species did not differ between the two habitats. Presence of endemics in exotic forests can have various, not mutually exclusive, explanations: (i) endemics can occur in exotic forests as relict populations; (ii) some endemics may be generalist species that do not depend strictly on the characteristics of the native forests (e.g., species that do not feed on the plants exclusive of endemic forests); (iii) some species may occur in exotic forests as sink populations. Species that had a wide distribution in lower elevations before human exploitation fall in the first and second category, and exotic forests may play an important role in their conservation (see also Borges et al., 2017 [37]). However, many of the exotic forest sites are highly disturbed and surrounded by a managed matrix not facilitating a proper management. For instance, in the case of the protected exotic forest of Fontinhas site, which is home to a recently described endemic beetle [37], there is a constant pressure for tree removal that, fortunately, receives negative responses from the Azorean Conservation Services.
We found that native non-endemics were equally supported by native and exotic forests in terms of both abundance and number of species, which may explain their broad ecological tolerance [20], which facilitated their colonization of exotic forests from adjacent native forests.
As expected, introduced species were more abundant and richer in exotic forests than in native forests (see also Cardoso et al., 2009 [26] and Meijer et al., 2011 [31]). The preference of introduced species for disturbed habitats might ideally prevent native forest habitats from biotic invasions [51]. However, in the Azores, exotic arthropods are a substantial part of the communities sampled [52,53], which indicates that these native forest habitats are strongly subject to biotic invasion.
In general, species richness of sampled arthropod taxa did not differ between the two types of forests, except for introduced beetles and bugs, where the number of species in exotic forests was higher than in native forests. By contrast, abundance values show more variable patterns. Endemic spiders and bugs were more abundant in native than in exotic forests, which is an expected result. Most bug species are herbivores and associated with particular host plant species [40,54], which can explain the higher abundance of indigenous (endemics and native non-endemic) species in native forests, while introduced species were more abundant in exotic forests.
Presence of some endemic beetles (e.g., Athous azoricus, Euconnus azoricus, Heteroderes azoricus, Metophthalmus occidentalis) mostly in exotic forests suggests that these species are the possible unique survivors (relicts) of major extinction events due to recent deforestation (see Terzopoulou et al. [9]). Other endemic species, such as Calacalles subcarinatus and Drouetius borgesi borgesi, are generalist species, very common in both native and exotic forests. However, other endemic species and subspecies of the genus Drouetius are particularly rare and under threat [38]. All endemic bug species (six sampled in this study) are present in exotic forests, and two of them (Aphrodes hamiltoni and Eupteryx azorica) are more abundant in this man-made habitat. In the case of E. azorica, an adaptation to non-native ferns may be the explanation (unpublished study). In the case of A. hamiltoni, invasion of the exotic forests may have been facilitated by its association with the soil litter [55]. In spiders, several species are abundant in exotic forests, which indicates that these generalist predators may find suitable prey in a wide range of habitats.

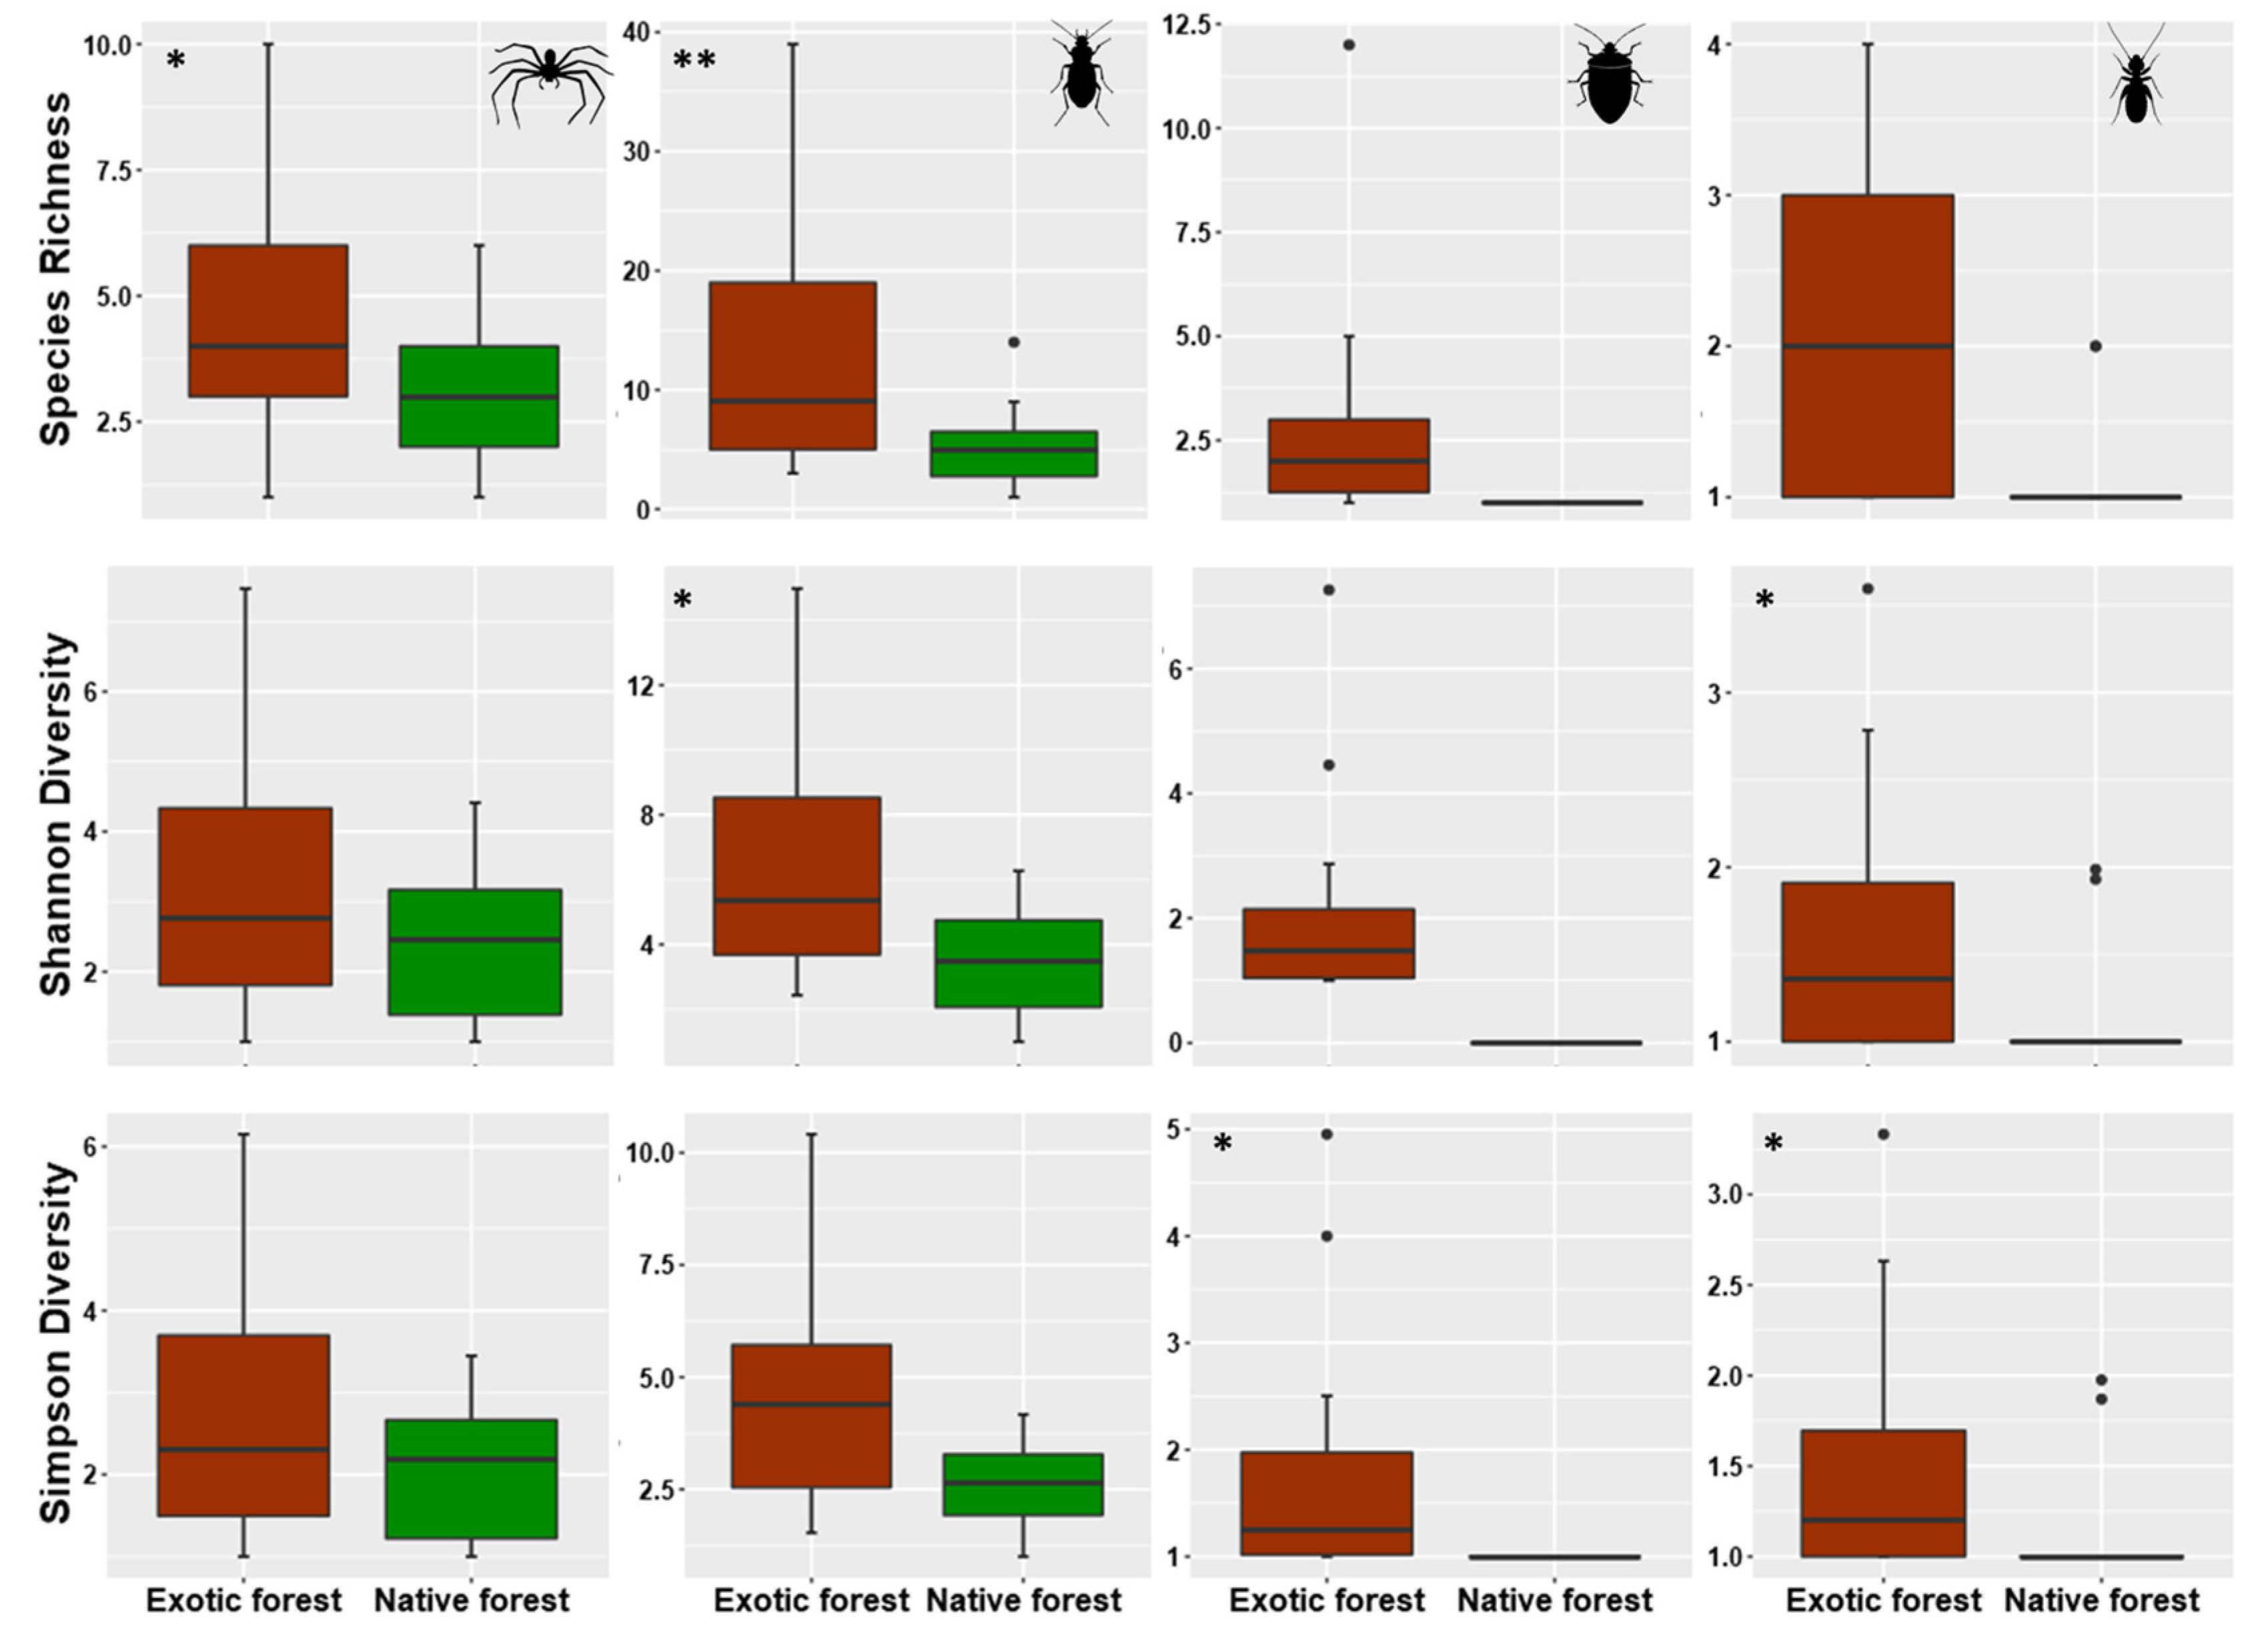
4.2. Alpha Diversity Patterns within Rare, Common, and Dominant Species

The use of Hill numbers brings insights into the role played by rare (q = 0), common (q = 1), and dominant (q = 2) species in native and exotic forest communities. We hypothesized that some dominant endemic species will find refuge in exotic forest sites, while some introduced species will adapt very well to native forests.
At both forest and site levels, introduced species showed a clear pattern: rare, common, and dominant species were more numerous in exotic than in native forests. This is consistent with the findings of [31], which showed a prevalence of introduced species in exotic forests and pasture habitats. In our case, however, the difference was significant only when the contribution of rare species was emphasized (q = 0). Indigenous (endemic and non-endemic) species showed a less clear pattern, but the general trend was that exotic forests host more non-endemic species than native forests, a possible consequence of their larger extent on the island [30].
Introduced species were more diversified in exotic than native forests in all taxonomic groups. However, accumulation curves for introduced spiders, beetles, and bugs, especially for native forests, did not reach their plateau, which suggests an insufficient sampling effort.
Contrary to introduced species, diversity patterns in indigenous (endemic and non-endemic) species communities varied according to the taxonomic group and the relative abundance of the species in the assemblage. Spiders was the only group where indigenous species had higher values of diversity in native forests for all the three Hill numbers (thus, independently from the influence of abundance differences). This result is consistent with previous studies, which showed the preference of endemic spiders species for native forests [56]. For instance, the endemic spider Rugathodes acoreensis was significantly more abundant in native than in exotic forests. However, given their high dispersal ability [56], almost all indigenous spiders found in native forests were also observed in exotic forests, and one species, the native Porrhoclubiona decora, was more abundant in exotic forests.
Indigenous beetles were either distributed similarly between native and exotic forests (endemic species) or more diversified in exotic forests (native non-endemic species). Coleoptera include species with the most disparate ecological needs, and therefore, we can assume that they can find suitable niches in both native and exotic forests. We can also expect that some beetles with broad ecological tolerance are superior competitors, being able to successfully colonize newly established habitats such as the exotic forests. We observed an interesting opposite pattern in indigenous booklice, with endemic species showing higher diversity in exotic forests and native non-endemic species similarly rich in native and exotic forests. Given the association of booklice with vegetation [57], we can assume that indigenous booklice switched their niches to exploit new vegetation, or occupy small suitable native habitats (endemic tree species) embedded in the exotic forests. However, these results should be considered with caution, since booklice were poorly represented in our samples. Indigenous bug species were either more diverse in native forests (endemic rare species) or similarly distributed in native and exotic forests (native non-endemic species). Bugs are phytophagous insects with variable degrees of specialization [58]. These results suggest that endemic bugs are highly specialized to native species, which makes colonizing exotic forests difficult; non-endemics are probably less specialized and, hence, able to feed on a variety of plants, including those present in exotic forests.

4.3. Change in Diversity between Native and Exotic Forests

We hypothesized that introduced species should show higher β-diversity values both between and within forests, while indigenous species (endemic and native non-endemic species) should present high β-diversity values between forests and within exotic forest sites, but lower β-diversity values within native forest sites. Our results support these expectations, thus confirming some previous results for native forests (see also [20,34]).
Patterns of β-diversity can arise by competitive interactions [59,60,61]. The high β-diversity values observed for introduced species suggest high negative interactions (competitive exclusion leading to high species replacement) among species inhabiting the two types of forests or occupying different places within the same forest. By contrast, low values observed in indigenous species suggest minor interactions. These results suggest that (1) communities of indigenous species (endemic and native non-endemic species) in natural forests are poorly influenced by competition, whereas (2) introduced species are strong competitors that exclude each other. However, when the components of β-diversity (that is, replacement and richness) are analyzed separately, we found that β-diversity in endemic species was largely due to replacement, which suggests that species are idiosyncratically distributed, possibly because of historical reasons (e.g., random extinction) [62]. In native non-endemic species, the two components contributed similarly to total β-diversity, which suggests that, here, current ecological factors (e.g., microhabitat preferences) play a major role [63]. Finally, most of the β-diversity in introduced species was due to richness, which indicates the importance of local factors in favoring the establishment of new species arriving.
Patterns of β-diversity inside each type of forest indicate that replacement and richness contributed in similar proportion to the β-diversity of introduced species, which contrasts with results of [34] in native forests, where the β-diversity of introduced species was largely determined by species replacement. However, β-diversity patterns varied widely among groups, which might be explained by the divergences in ecological preferences and dispersal ability.

4.4. Relative Importance of Sites in Supporting the Different Biogeographic Groups

The relative importance of sites in supporting species diversity varied among taxonomic and biogeographical groups and paralleled the species richness patterns. For instance, we trapped only one introduced bug (Acizzia uncatoides) in native forests and found that none of the native forest sites were important for introduced bugs, whereas all sites contributed to indigenous species diversity. However, within native forest sites, two particular sites (one dominated, respectively, by Laurus and Erica, and the other by Juniperus, Laurus, and Ilex) were characterized by the absence of introduced species for all taxonomic groups, thus showing variable resistance to biotic invasion. The location of these two sites inside the Caldeira St. Barbara at high elevation within the most pristine area of Azores [22] can explain why they were impermeable to exotic species. Within exotic forests, one specific site dominated by Pittosporum was important for indigenous bugs and two sites dominated by Eucalyptus were very important booklice. There is no clear explanation of the importance of these sites. One hypothesis might be the proximity with a native forest fragment for one site and the fact that the two other sites replaced ancient native forest fragments or, more broadly, the environmental conditions (herb composition, shade, higher humidity, etc.) provided in the forest site.

5. Conclusions

Our findings reinforce the results of previous studies showing that the few and small remnants of native forests are a pillar to the conservation of Azorean endemic arthropods. However, areas occupied by exotic forests, whether they are large and contiguous or small and isolated, close to native forests, or embedded in a matrix of agriculture activities, can also play a role, especially for endemics. In the context of the SLOSS debate (i.e., whether a single large or several small reserves should be preferred in conservation planning in fragmented landscapes) [64,65], these results confirm that there is no simple solution and that even small and isolated patches of exotic vegetation may play an unexpected important role in biological conservation.
Unprotected private forested areas are usually considered relevant in the conservation of species in various contexts [66,67,68], and our study supports the need of not discounting a priori these spaces in conservation planning. In particular, our findings call for further investment to assess the conservation status of populations of endemic species only found in these sites in the Azores. Similarly, studies should be conducted to reveal the features of these sites that make them important for endemic species. Intensification of human activities in the agricultural matrix and pressure to remove exotic forests for intensive pasture implementation are also of high concern. Knowing that some endemic species in the Azores do not occur in forest habitats but in open habitats, rock cliffs, etc., we suggest future studies to fully understand endemic species distribution.
Although some species with lower dispersal ability were trapped in this study, SLAM traps are mostly oriented toward higher dispersive species. Thus, additional sampling protocols should be implemented in lowland exotic forests to uncover the spatial distribution of further rare and specialized species among soil-adapted arthropods.
Long-term monitoring programs currently performed in the Azores involve only native forests [20]. A key message of our study is that such programs that use effective standard protocols [36] should be expanded to exotic forest patches at lowlands in all islands to improve the conservation of Azorean rare endemic arthropods. In addition, the observation that the number of exotic arthropod species in native forests increased over time [20] implies that we should improve our understanding of exotic arthropod population fluctuations across space and time and their potential impact on native species. Further studies should also be developed to understand the abiotic characteristics or other biotic elements of native forest sites that support introduced species.

Supplementary Materials

The following are available online at https://0-www-mdpi-com.brum.beds.ac.uk/article/10.3390/d13090443/s1, Figure S1: Map of study area. Sites Ex_pitt.Cala and Ex_pitt.mdpc were originally native forest fragments but are now invaded by Pittosporum. Table S1: Sampling sites in native and exotic forests of Terceira island. The dominant trees species is indicated. Table S2: Abundance differences (mean number) of endemic species from four taxonomic groups in Azorean native and exotic forests. The differences between habitats were assessed using Wilcoxon test. Wilcoxon test estimates (W) and p-values are indicated with significant differences in bold. Table S3: Abundance differences (mean number) of native non-endemic species from four taxonomic groups in Azorean native and exotic forests. The differences between habitats were assessed using Wilcoxon test. Wilcoxon test estimates (W) and p-values are indicated with significant differences in bold. Table S4: Abundance differences (mean number) of introduced species from four taxonomic groups in Azorean native and exotic forests. The differences between habitats were assessed using Wilcoxon test. Wilcoxon test estimates (W) and p-values are indicated with significant differences in bold.

Author Contributions

Conceptualization, N.T., S.F. and P.A.V.B.; data curation, A.R.-P. and P.A.V.B.; formal analysis, N.T.; funding acquisition, P.A.V.B.; investigation, N.T., S.F., M.B., F.R., M.T.F. and P.A.V.B.; methodology, N.T., S.F., F.R. and P.A.V.B.; project administration, P.A.V.B.; software, N.T. and F.R.; supervision, P.A.V.B.; validation, N.T., S.F., F.R. and P.A.V.B.; writing—original draft, N.T. and P.A.V.B.; writing—review and editing, N.T., S.F., M.B., F.R., A.R.-P., M.T.F. and P.A.V.B. All authors have read and agreed to the published version of the manuscript.

Funding

Field work for 2020 and N.T. were funded by Secretaria Regional do Ambiente e Alterações Climáticas—LIFE-BETTLES (LIFE18 NAT_PT_000864) (2020). This manuscript was also partly financed by Portuguese FCT-NETBIOME–ISLANDBIODIV grant 0003/2011 (between 2012 and 2015), Portuguese National Funds, through FCT–Fundação para aCiência e a Tecnologia, within the project UID/BIA/00329/2013–2020, the project from Direcção Regional do Ambiente—LIFE IP AZORES NATURA (LIFE17 IPE/PT/000010) (2019), AZORESBIOPORTAL–PORBIOTA (ACORES-01-0145-FEDER-000072) (2019). The Natural Park of Terceira (Azores) provided the necessary authorization for sampling.

Institutional Review Board Statement

Ethical review and approval were waived for this study since does not involve vertebrates.

Data Availability Statement

The data presented in this study are available on request from the corresponding author. The data are not publicly available due to current use within the conservation restoration actions of Project LIFE-Beetles.

Acknowledgments

We thank the many people who have assisted us with fieldwork, collecting specimens. A large number of students financed by the EU Programs ERASMUS and EURODYSSÉE sorted the samples prior to species assignment by one of us (PB), and we are grateful to all of them: Adal Humberto Díaz Raya, David Rodilla Rivas, Daniel Ehrhart, Juan Ignacio Pitarch Peréz, Juan Manuel Taboada Alvarez, Helena Marugán Páramo, Laura Cáceres Sabater, Laura Gallardo, Marija Tomašic, Óscar García Contreras, Percy de Laminne de Bex, Ruben Murillo Garcia, Rui Carvalho, Rui Nunes, Sergio Fernandez, Sophie Wallon, and William Razey. We are grateful to three anonymous reviewers for their comments on a previous version of this paper.

Conflicts of Interest

The authors declare no conflict of interest.

References

  1. Cardoso, P.; Barton, P.S.; Birkhofer, K.; Chichorro, F.; Deacon, C.; Fartmann, T.; Fukushima, C.S.; Gaigher, R.; Habel, J.C.; Hallmann, C.A.; et al. Scientists’ warning to humanity on insect extinctions. Biol. Conserv. 2020, 242, 108426. [Google Scholar] [CrossRef]
  2. Harvey, J.A.; Heinen, R.; Armbrecht, I.; Basset, Y.; Baxter-Gilbert, J.H.; Bezemer, T.M.; Böhm, M.; Bommarco, R.; Borges, P.A.V.; Cardoso, P.; et al. International scientists formulate a roadmap for insect conservation and recovery. Nat. Ecol. Evol. 2020, 4, 174–176. [Google Scholar] [CrossRef]
  3. Samways, M.J.; Barton, P.S.; Birkhofer, K.; Chichorro, F.; Deacon, C.; Fartmann, T.; Fukushima, C.S.; Gaigher, R.; Habel, J.C.; Hallmann, C.A.; et al. Solutions for humanity on how to conserve insects. Biol. Conserv. 2020, 242, 108427. [Google Scholar] [CrossRef]
  4. Sánchez-Bayo, F.; Wyckhuys, K.A.G. Worldwide decline of the entomofauna: A review of its drivers. Biol. Conserv. 2019, 232, 8–27. [Google Scholar] [CrossRef]
  5. Hallmann, C.A.; Sorg, M.; Jongejans, E.; Siepel, H.; Hofland, N.; Schwan, H.; Stenmans, W.; Müller, A.; Sumser, H.; Hörren, T.; et al. More than 75 percent decline over 27 years in total flying insect biomass in protected areas. PLoS ONE 2017, 12, e0185809. [Google Scholar] [CrossRef] [Green Version]
  6. Habel, J.C.; Trusch, R.; Schmitt, T.; Ochse, M.; Ulrich, W. Long-term large-scale decline in relative abundances of butterfly and burnet moth species across south-western Germany. Sci. Rep. 2019, 9, 14921. [Google Scholar] [CrossRef] [PubMed] [Green Version]
  7. Homburg, K.; Drees, C.; Boutaud, E.; Nolte, D.; Schuett, W.; Zumstein, P.; von Ruschkowski, E.; Assmann, T. Where have all the beetles gone? Long-term study reveals carabid species decline in a nature reserve in Northern Germany. Insect Conserv. Divers. 2019, 12, 268–277. [Google Scholar] [CrossRef] [Green Version]
  8. Seibold, S.; Gossner, M.M.; Simons, N.K.; Blüthgen, N.; Müller, J.; Ambarlı, D.; Ammer, C.; Bauhus, J.; Fischer, M.; Habel, J.C.; et al. Arthropod decline in grasslands and forests is associated with landscape-level drivers. Nature 2019, 574, 671–674. [Google Scholar] [CrossRef]
  9. Terzopoulou, S.; Rigal, F.; Whittaker, R.J.; Borges, P.A.V.; Triantis, K.A. Drivers of extinction: The case of Azorean beetles. Biol. Lett. 2015, 11, 20150273. [Google Scholar] [CrossRef]
  10. Triantis, K.A.; Borges, P.A.V.; Ladle, R.J.; Hortal, J.; Cardoso, P.; Gaspar, C.; Dinis, F.; Mendonça, E.; Silveira, L.M.A.; Gabriel, R.; et al. Extinction debt on oceanic islands. Ecography 2010, 33, 285–294. [Google Scholar] [CrossRef] [Green Version]
  11. Copsey, J.A.; Black, S.A.; Groombridge, J.J.; Jones, C.G. (Eds.) Species Conservation: Lessons from Islands; Ecology, Biodiversity and Conservation; Cambridge University Press: Cambridge, UK, 2018; ISBN 978-0-521-89939-0. [Google Scholar]
  12. Jupiter, S.; Mangubhai, S.; Kingsford, R.T. Conservation of Biodiversity in the Pacific Islands of Oceania: Challenges and Opportunities. Pac. Conserv. Biol. 2014, 20, 206–220. [Google Scholar] [CrossRef]
  13. Pétillon, J.; Privet, K.; Roderick, G.K.; Price, D. Non-native spiders change assemblages of Hawaiian forest fragment kipuka over space and time. NeoBiota 2020, 55, 1–9. [Google Scholar] [CrossRef]
  14. Raven, P.H.; Wagner, D.L. Agricultural intensification and climate change are rapidly decreasing insect biodiversity. Proc. Natl. Acad. Sci. USA 2021, 118, e2002548117. [Google Scholar] [CrossRef] [PubMed]
  15. Causton, C.E.; Peck, S.B.; Sinclair, B.J.; Roque-Albelo, L.; Hodgson, C.J.; Landry, B. Alien Insects: Threats and Implications for Conservation of Galápagos Islands. Ann. Entomol. Soc. Am. 2006, 99, 121–143. [Google Scholar] [CrossRef]
  16. Cronk, Q.C.B. Islands: Stability, diversity, conservation. Biodivers. Conserv. 1997, 6, 477–493. [Google Scholar] [CrossRef]
  17. Sax, D.F.; Gaines, S.D.; Brown, J.H. Species Invasions Exceed Extinctions on Islands Worldwide: A Comparative Study of Plants and Birds. Am. Nat. 2002, 160, 766–783. [Google Scholar] [CrossRef]
  18. Silva, L.; Smith, C.W. A Quantitative Approach to the Study of Non-indigenous Plants: An Example from the Azores Archipelago. Biodivers. Conserv. 2006, 15, 1661–1679. [Google Scholar] [CrossRef]
  19. Borges, P.A.V.; Gabriel, R.; Arroz, A.M.; Costa, A.; Cunha, R.T.; Silva, L.; Mendonça, E.; Martins, A.M.F.; Reis, F.; Cardoso, P. The Azorean Biodiversity Portal: An internet database for regional biodiversity outreach. Null 2010, 8, 423–434. [Google Scholar] [CrossRef] [Green Version]
  20. Borges, P.A.V.; Rigal, F.; Ros-Prieto, A.; Cardoso, P. Increase of insular exotic arthropod diversity is a fundamental dimension of the current biodiversity crisis. Insect Conserv. Divers. 2020, 13, 508–518. [Google Scholar] [CrossRef]
  21. Borges, P.A.V.; Aguiar, C.; Amaral, J.; Amorim, I.R.; André, G.; Arraiol, A.; Baz, A.; Dinis, F.; Enghoff, H.; Gaspar, C.; et al. Ranking protected areas in the Azores using standardised sampling of soil epigean arthropods. Biodivers. Conserv. 2005, 14, 2029–2060. [Google Scholar] [CrossRef] [Green Version]
  22. Gaspar, C.; Gaston, K.J.; Borges, P.A.V.; Cardoso, P. Selection of priority areas for arthropod conservation in the Azores archipelago. J. Insect Conserv. 2011, 15, 671–684. [Google Scholar] [CrossRef] [Green Version]
  23. Fattorini, S. Endemism in historical biogeography and conservation biology: Concepts and implications. Biogeogr. J. Integr. Biogeogr. 2017, 32, 47–75. [Google Scholar] [CrossRef] [Green Version]
  24. Ferreira, M.T.; Cardoso, P.; Borges, P.A.V.; Gabriel, R.; de Azevedo, E.B.; Reis, F.; Araújo, M.B.; Elias, R.B. Effects of climate change on the distribution of indigenous species in oceanic islands (Azores). Clim. Chang. 2016, 138, 603–615. [Google Scholar] [CrossRef]
  25. Elias, R.B.; Gil, A.; Silva, L.; Fernández-Palacios, J.M.; Azevedo, E.B.; Reis, F. Natural zonal vegetation of the Azores Islands: Characterization and potential distribution. Phytocoenologia 2016, 46, 107–123. [Google Scholar] [CrossRef]
  26. Cardoso, P.; Aranda, S.C.; Lobo, J.M.; Dinis, F.; Gaspar, C.; Borges, P.A.V. A spatial scale assessment of habitat effects on arthropod communities of an oceanic island. Acta Oecologica 2009, 35, 590–597. [Google Scholar] [CrossRef] [Green Version]
  27. Borges, P.A.V.; Ugland, K.I.; Dinis, F.O.; Gaspar, C. Insect and spider rarity in an oceanic island (Terceira, Azores): True rare and pseudo-rare species. In Insect Ecology and Conservation; Fattorini, S., Ed.; Research Signpost: Kerala, India, 2008; pp. 47–70. ISBN 978-81-308-0297-8. [Google Scholar]
  28. Florencio, M.; Rigal, F.; Borges, P.A.V.; Cardoso, P.; Santos, A.M.C.; Lobo, J.M. The role of plant fidelity and land-use changes on island exotic and indigenous canopy spiders at local and regional scales. Biol. Invasions 2016, 18, 2309–2324. [Google Scholar] [CrossRef]
  29. Florencio, M.; Lobo, J.M.; Cardoso, P.; Almeida-Neto, M.; Borges, P.A.V. The Colonisation of Exotic Species Does Not Have to Trigger Faunal Homogenisation: Lessons from the Assembly Patterns of Arthropods on Oceanic Islands. PLoS ONE 2015, 10, e0128276. [Google Scholar] [CrossRef] [PubMed]
  30. Florencio, M.; Cardoso, P.; Lobo, J.M.; de Azevedo, E.B.; Borges, P.A.V. Arthropod assemblage homogenization in oceanic islands: The role of indigenous and exotic species under landscape disturbance. Divers. Distrib. 2013, 19, 1450–1460. [Google Scholar] [CrossRef]
  31. Meijer, S.S.; Whittaker, R.J.; Borges, P.A.V. The effects of land-use change on arthropod richness and abundance on Santa Maria Island (Azores): Unmanaged plantations favour endemic beetles. J. Insect Conserv. 2011, 15, 505–522. [Google Scholar] [CrossRef] [Green Version]
  32. Hill, M.O. Diversity and Evenness: A Unifying Notation and Its Consequences. Ecology 1973, 54, 427–432. [Google Scholar] [CrossRef] [Green Version]
  33. Chao, A.; Chiu, C.-H.; Jost, L. Unifying Species Diversity, Phylogenetic Diversity, Functional Diversity, and Related Similarity and Differentiation Measures Through Hill Numbers. Annu. Rev. Ecol. Evol. Syst. 2014, 45, 297–324. [Google Scholar] [CrossRef] [Green Version]
  34. Matthews, T.J.; Sadler, J.; Carvalho, R.; Nunes, R.; Borges, P.A.V. Differential temporal beta-diversity patterns of native and non-native arthropod species in a fragmented native forest landscape. Ecography 2019, 42, 45–54. [Google Scholar] [CrossRef]
  35. Artega, A.; Malumbres-Olarte, J.; Gabriel, R.; Ros-Prieto, A.; Casimiro, P.; Sanchez, A.; Albergaria, I.; Borges, P.A.V. Arthropod diversity in two Historic Gardens in the Azores, Portugal. Biodivers. Data J. 2020, 8, e54749. [Google Scholar] [CrossRef] [PubMed]
  36. Borges, P.; Gabriel, R.; Pimentel, C.; Brito, M.; Serrano, A.; Crespo, L.; Assing, V.; Stüben, P.; Fattorini, S.; Soares, A.; et al. Biota from the coastal wetlands of Praia da Vitória (Terceira, Azores, Portugal): Part 1—Arthropods. Biodivers. Data J. 2018, 6, e27194. [Google Scholar] [CrossRef] [PubMed] [Green Version]
  37. Borges, P.; Amorim, I.; Terzopoulou, S.; Rigal, F.; Emerson, B.C.; Serrano, A. Cryptic diversity in the Azorean beetle genus Tarphius Erichson, 1845 (Coleoptera: Zopheridae): An integrative taxonomic approach with description of four new species. Zootaxa 2017, 4236, 401–449. [Google Scholar] [CrossRef] [PubMed]
  38. Borges, P.; Lamelas-López, L.; Amorim, I.; Nunes, R.; Serrano, A.; Boieiro, M.; Hochkirch, A.; Vieira, V. Conservation status of the forest beetles (Insecta, Coleoptera) from Azores, Portugal. Biodivers. Data J. 2017, 5, e14557. [Google Scholar] [CrossRef] [Green Version]
  39. Marcelino, J.; Borges, P.A.V.; Borges, I.; Pereira, E.; Santos, V.; Soares, A.O. Standardised arthropod (Arthropoda) inventory across natural and anthropogenic impacted habitats in the Azores archipelago. Biodivers. Data J. 2021, 9, e62157. [Google Scholar] [CrossRef]
  40. Rego, C.; Boieiro, M.; Rigal, F.; Ribeiro, S.P.; Cardoso, P.; Borges, P.A.V. Taxonomic and functional diversity of insect herbivore assemblages associated with the canopy-dominant trees of the Azorean native forest. PLoS ONE 2019, 14, e0219493. [Google Scholar] [CrossRef] [Green Version]
  41. Fernández-Palacios, J.M.; de Nascimento, L.; Otto, R.; Delgado, J.D.; García-del-Rey, E.; Arévalo, J.R.; Whittaker, R.J. A reconstruction of Palaeo-Macaronesia, with particular reference to the long-term biogeography of the Atlantic island laurel forests. J. Biogeogr. 2011, 38, 226–246. [Google Scholar] [CrossRef]
  42. Gaspar, C.; Borges, P.; Gaston, K. Diversity and distribution of arthropods in native forests of the Azores archipelago. Arquipel. Life Mar. Sci. 2008, 25, 1–30. [Google Scholar]
  43. Fattorini, S.; Cardoso, P.; Rigal, F.; Borges, P.A.V. Use of Arthropod Rarity for Area Prioritisation: Insights from the Azorean Islands. PLoS ONE 2012, 7, e33995. [Google Scholar] [CrossRef]
  44. Silva, L.; Ojeda Land, E.; Rodriguez Luengo, J.L.; Borges, P.A.V.; Oliveira, P.; Jardim, R. Invasive terrestrial Flora & Fauna of Macaronesia. In TOP 100 in Azores, Madeira and Canaries; ARENA: Ponta Delgada, Portugal, 2008; p. 546. [Google Scholar]
  45. R Core Team. R: A Language and Environment for Statistical Computing; R Foundation for Statistical Computing: Vienna, Austria, 2021; Available online: https://www.R-project.org/ (accessed on 5 July 2021).
  46. Hsieh, T.C.; Ma, K.H.; Chao, A. iNEXT: An R package for rarefaction and extrapolation of species diversity (Hill numbers). Methods Ecol. Evol. 2016, 7, 1451–1456. [Google Scholar] [CrossRef]
  47. Carvalho, J.C.; Cardoso, P.; Borges, P.A.V.; Schmera, D.; Podani, J. Measuring fractions of beta diversity and their relationships to nestedness: A theoretical and empirical comparison of novel approaches. Oikos 2013, 122, 825–834. [Google Scholar] [CrossRef] [Green Version]
  48. Dray, S.; Bauman, G.; Bocard, D.; Clappe, S.; Guenard, G. Adespatial: Multivariate Multiscale Spatial Analysis. 2019. Available online: https://cran.r-project.org/web/packages/adespatial (accessed on 5 July 2021).
  49. Legendre, P.; De Cáceres, M. Beta diversity as the variance of community data: Dissimilarity coefficients and partitioning. Ecol. Lett. 2013, 16, 951–963. [Google Scholar] [CrossRef]
  50. Legendre, P. Interpreting the replacement and richness difference components of beta diversity. Glob. Ecol. Biogeogr. 2014, 23, 1324–1334. [Google Scholar] [CrossRef]
  51. Searcy, K.B.; Pucko, C.; McClelland, D. The distribution and habitat preferences of introduced species in the mount Holyoke range, Hampshire co., Massachusetts. Rhodora 2006, 108, 43–61. [Google Scholar] [CrossRef]
  52. Gaston, K.J.; Borges, P.A.V.; He, F.; Gaspar, C. Abundance, spatial variance and occupancy: Arthropod species distribution in the Azores. J. Anim. Ecol. 2006, 75, 646–656. [Google Scholar] [CrossRef] [Green Version]
  53. Rigal, F.; Whittaker, R.J.; Triantis, K.A.; Borges, P.A.V. Integration of non-indigenous species within the interspecific abundance–occupancy relationship. Acta Oecologica 2013, 48, 69–75. [Google Scholar] [CrossRef]
  54. Ribeiro, S.P.; Borges, P.A.V.; Gaspar, C.; Melo, C.; Serrano, A.R.M.; Amaral, J.; Aguiar, C.; André, G.; Quartau, J.A. Canopy insect herbivores in the Azorean Laurisilva forests: Key host plant species in a highly generalist insect community. Ecography 2005, 28, 315–330. [Google Scholar] [CrossRef] [Green Version]
  55. Quartau, J.A.; Borges, P.A.V. A new species of the genus Aphrodes Curtis from the Azores (Hemiptera, Cicadellidae). Bocagiana 2003, 213, 1–11. [Google Scholar]
  56. Borges, P.A.V.; Wunderlich, J. Spider biodiversity patterns and their conservation in the Azorean archipelago, with descriptions of new species. Null 2008, 6, 249–282. [Google Scholar] [CrossRef] [Green Version]
  57. Broadhead, E.; Wolda, H. The Diversity of Psocoptera in Two Tropical Forests in Panama. J. Anim. Ecol. 1985, 54, 739–754. [Google Scholar] [CrossRef]
  58. Jaenike, J. Host Specialization in Phytophagous Insects. Annu. Rev. Ecol. Syst. 1990, 21, 243–273. [Google Scholar] [CrossRef]
  59. Farnon Ellwood, M.D.; Manica, A.; Foster, W.A. Stochastic and deterministic processes jointly structure tropical arthropod communities. Ecol. Lett. 2009, 12, 277–284. [Google Scholar] [CrossRef]
  60. Lessard, J.-P.; Borregaard, M.K.; Fordyce, J.A.; Rahbek, C.; Weiser, M.D.; Dunn, R.R.; Sanders, N.J. Strong influence of regional species pools on continent-wide structuring of local communities. Proc. R. Soc. B Biol. Sci. 2012, 279, 266–274. [Google Scholar] [CrossRef] [Green Version]
  61. Segre, H.; Ron, R.; De Malach, N.; Henkin, Z.; Mandel, M.; Kadmon, R. Competitive exclusion, beta diversity, and deterministic vs. stochastic drivers of community assembly. Ecol. Lett. 2014, 17, 1400–1408. [Google Scholar] [CrossRef]
  62. Gillespie, R.G.; Roderick, G.K. Arthropods on Islands: Colonization, Speciation, and Conservation. Annu. Rev. Entomol. 2002, 47, 595–632. [Google Scholar] [CrossRef]
  63. Kremen, C.; Colwell, R.K.; Erwin, T.L.; Murphy, D.D.; Noss, R.F.; Sanjayan, M.A. Terrestrial Arthropod Assemblages: Their Use in Conservation Planning. Conserv. Biol. 1993, 7, 796–808. [Google Scholar] [CrossRef] [Green Version]
  64. McNeill, S.E.; Fairweather, P.G. Single Large or Several Small Marine Reserves? An Experimental Approach with Seagrass Fauna. J. Biogeogr. 1993, 20, 429–440. [Google Scholar] [CrossRef]
  65. Tjørve, E. How to resolve the SLOSS debate: Lessons from species-diversity models. J. Theor. Biol. 2010, 264, 604–612. [Google Scholar] [CrossRef] [PubMed]
  66. Capano, G.C.; Toivonen, T.; Soutullo, A.; Di Minin, E. The emergence of private land conservation in scientific literature: A review. Biol. Conserv. 2019, 237, 191–199. [Google Scholar] [CrossRef]
  67. Kamal, S.; Grodzinska-Jurczak, M.; Kaszynska, A.P. Challenges and opportunities in biodiversity conservation on private land: An institutional perspective from Central Europe and North America. Biodivers. Conserv. 2015, 24, 1271–1292. [Google Scholar] [CrossRef] [Green Version]
  68. Shumba, T.; De Vos, A.; Biggs, R.; Esler, K.J.; Ament, J.M.; Clements, H.S. Effectiveness of private land conservation areas in maintaining natural land cover and biodiversity intactness. Glob. Ecol. Conserv. 2020, 22, e00935. [Google Scholar] [CrossRef]
Figure 1. Alpha diversity in native and exotic forests of Terceira. Alpha diversity was expressed using Hill numbers corresponding to Chao’s species richness (q = 0), exponential Shannon diversity (q = 1), and Simpson diversity (q = 2) with interpolation–extrapolation method. Alpha diversity estimates are computed for the four taxonomic groups (Araneae, Coleoptera, Hemiptera, and Psocoptera, respectively, first to fourth column) and for the three biogeographical categories (A) endemic, (B) native non-endemic, and (C) introduced species.
Diversity 13 00443 g001
Figure 2. Alpha diversity of four Endemic species communities for the four taxonomic groups (Araneae, Coleoptera, Hemiptera, and Psocoptera, respectively, first to fourth column) calculated for each sampling sites selected in native and exotic forests of Terceira. Alpha diversity was expressed using Hill numbers corresponding to Chao’s species richness (Species Richness), exponential Shannon diversity (Shannon Diversity), and Simpson diversity (Simpson Diversity) with interpolation–extrapolation method. Differences were assessed using a Kruskal Wallis test and asterisks represent significant differences with (*) p < 0.05 and (**) p < 0.001.
Diversity 13 00443 g002
Figure 3. Alpha diversity in native non-endemic species communities for the four taxonomic groups (Araneae, Coleoptera, Hemiptera, and Psocoptera, respectively, first to fourth column) calculated for each sampling sites selected in native and exotic forests of Terceira. Alpha diversity was expressed using Hill numbers corresponding to Chao’s species richness (Species Richness), exponential Shannon diversity (Shannon Diversity), and Simpson diversity (Simpson Diversity) with interpolation–extrapolation method. Differences were assessed using a Kruskal Wallis test and asterisks represent significant differences with (*) p < 0.05 and (**) p < 0.001.
Diversity 13 00443 g003
Figure 4. Alpha diversity of four introduced species communities for the four taxonomic groups (Araneae, Coleoptera, Hemiptera, and Psocoptera, respectively, first to fourth column) calculated for each sampling sites selected in native and exotic forests of Terceira. Alpha diversity was expressed using Hill numbers corresponding to Chao’s species richness (Species Richness), exponential Shannon diversity (Shannon Diversity), and Simpson diversity (Simpson Diversity) with interpolation–extrapolation method Differences were assessed using a Kruskal Wallis test and asterisks represent significant differences with (*) p < 0.05 and (**) p < 0.001.
Diversity 13 00443 g004
Figure 5. β-diversity values of four arthropods communities (Araneae, Coleoptera, Hemiptera, and Psocoptera, respectively, first to fourth column) calculated between native and exotic forests (A), between sites in native forests (B), and between sites in exotic forests (C). Beta diversity was calculated separately for endemic (END), native non-endemic (NAT), and non-native introduced (INT) species. The total height represents the overall β-diversity. Overall β-diversity is partitioned into replacement (repl. in grey) and species richness (rich in green) components.
Diversity 13 00443 g005
Figure 6. Local contribution to β-diversity (LCBD). Relative contribution of native forest sites (A) and exotic forest sites (B) for the four taxonomic orders (Araneae, Coleoptera, Hemiptera, and Psocoptera, respectively, first to fourth column). LCBD calculated separately for endemic (END), native non-endemic (NAT), and non-native introduced (INT) species.
Diversity 13 00443 g006
Table 1. Total of morphospecies and abundances for endemic (END), native non-endemic (NAT), and non-native introduced (INT) arthropods communities of four taxonomic groups. Differences were assessed using a Chi-square test. Chi-square test estimates and significance are indicated.
Number of SpeciesAbundance of Species
ENDNATINTχ2pENDNATINTχ2p
Araneae2216379.36<0.01101384593115.183<0.001
Coleoptera1641151148.8<0.0012479711340725.17<0.001
Hemiptera12401719.391<0.001359444984873095.8<0.001
Psocoptera51292.84620.24113181852461813.68<0.001
Total55109214103.76<0.0016172816632192117.1<0.001
Table 2. Number of morphospecies and number of individuals for endemic (END), native non-endemic (NAT), and non-native introduced (INT) arthropods communities of four taxonomic groups in native and exotic forests. Differences were assessed using binomial testing and significance is indicated.
ENDNATINT
Native ForestExotic ForestpNative ForestExotic ForestpNative ForestExotic Forestp
Number of morpho(species)
Araneae1270.359860.79110190.136
Coleoptera860.79114190.4873682<0.001
Hemiptera640.75418160.8641110.006
Psocoptera221640.754250.453
Total28190.2434645149118<0.001
Number of individuals
Araneae683236<0.001281403<0.001143563<0.001
Coleoptera901120.139225533<0.001151849<0.001
Hemiptera2835542<0.00126861294<0.0014345<0.001
Psocoptera5485500.9762851119<0.00158288<0.001
Total41561440<0.001347733490.1243562045<0.001
Number of species in exotic forests was standardized and rounded without decimal for test comparison purpose.
Table 3. Total β-diversity and the relative contribution of its component (replacement and species richness differences) for endemic (END), native non-endemic (NAT), and non-native introduced (INT) arthropods communities of four taxonomic groups in native and exotic forests. The contributions of beta diversity components are indicated between brackets (replacement/species richness differences).
ENDNATINT
TotalNative ForestExotic ForestTotalNative ForestExotic ForestTotalNative ForestExotic Forest
Araneae0.154 (0.077/0.077)0.265
(0.128/0.136)
0.375 (0.154/0.221)0.111
(0.111/0.000)
0.276 (0.166/0.111)0.364 (0.173/0.191)0.383
(0.100/0.283)
0.360
(0.205/0.155)
0.397
(0.235/0.163)
Coleoptera0.333
(0.333/0.000)
0.377 (0.201/0.176)0.391 (0.285/0.106)0.317 (0.100/0.217)0.339
(0.149/0.190)
0.388 (0.217/0.171)0.396
(0.08/0.316)
0.409
(0.238/0.171)
0.442
(0.236/0.206)
Hemiptera0.0000.191
(0.053/0.137)
0.287 (0.130/0.158)0.259 (0.125/0.074)0.298 (0.122/0.177)0.373 (0.201/0.172)0.469
(0.000/0.469)
0.0000.343
(0.144/0.199)
Psocoptera0.167
(0.000/0.167)
0.205
(0.090/0.115)
0.199 (0.039/0.160)0.0000.261 (0.078/0.183)0.207 (0.046/0.161)0.333 (0.000/0.333)0.082 (0.082/0.000)0.226
(0.042/0.184)
Total0.191
(0.176/0.015)
0.278
(0.198/0.079)
0.373
(0.226/0.147)
0.243
(0.125/0.118)
0.316
(0.168/0.148/)
0.358
(0.217/0.141)
0.398
(0.073/0.325)
0.386
(0.194/0.192)
0.417
(0.230/0.187)
Publisher’s Note: MDPI stays neutral with regard to jurisdictional claims in published maps and institutional affiliations.

