
Underwater Photogrammetry Captures the Initial Recovery of a Coral Reef at Lalo Atoll
by
 ,
,
Atsuko Fukunaga
1,2,* ,
,
Kailey H. Pascoe
3,4,
Ashley R. Pugh
4,
Randall K. Kosaki
2 and
John H. R. Burns
4 1
Cooperative Institute for Marine and Atmospheric Research, University of Hawai‘i at Mānoa, Honolulu, HI 96822, USA
2
Papahānaumokuākea Marine National Monument, Office of National Marine Sanctuaries, National Oceanic and Atmospheric Administration, Honolulu, HI 96818, USA
3
Center for Global Discovery and Conservation Science—Hilo, Arizona State University, Hilo, HI 96720, USA
4
Marine Science Department, University of Hawai‘i at Hilo, Hilo, HI 96720, USA
*
Author to whom correspondence should be addressed.
Diversity 2022, 14(1), 39; https://0-doi-org.brum.beds.ac.uk/10.3390/d14010039
Submission received: 7 December 2021
/
Revised: 30 December 2021
/
Accepted: 6 January 2022
/
Published: 8 January 2022
(This article belongs to the Special Issue Technological Innovation to Support Reef Research and Conservation)
Abstract
:Recovery of coral reefs after physical damage sustained from storm events can be affected by various factors. Here, we examined the initial recovery of a coral reef at the southern end of uninhabited Lalo Atoll of Papahānaumokuākea Marine National Monument after its complete destruction by Hurricane Walaka in 2018. While the site was still mostly (98%) covered by a mixture of rubble and sand, surveys utilizing underwater photogrammetry allowed for detailed quantitative assessments of benthic cover and confirmed colonization of coral (Pocillopora meandrina and Porites lobata), macroalgae and sponges. The proportion of sand in the rubble–sand mixture also decreased from the level observed in 2019. Visual fish surveys confirmed the presence of 35 reef fish species, a large increase from no reef fish in 2019, despite the low biotic benthic cover. Overall, the colonization of benthic organisms and the return of reef fish, which is potentially supported by the benthos and cryptofauna in the rubble bed, offer positive signs of reef recovery. The photogrammetric surveys in the present study captured the subtle changes in the benthic cover and provided us with a procedure to continue monitoring the succession of the site. Continuous monitoring of the site should reveal whether the reef returns to the original state of Acropora coral dominance or progresses towards a coral assemblage with a different composition.
1. Introduction
Coral reefs are vulnerable to physical damage from extreme weather events such as hurricanes and cyclones. The extent of damage and subsequent recovery are dependent on the spatial scale, intensity and frequency of the storm disturbances [1]. While recovery of a reef following partial mortality of coral can be relatively quick due to regeneration and/or regrowth of fragmented coral colonies, repeated disturbances can interrupt and hinder the process [2,3]. Other factors affecting the recovery of coral reefs following disturbances are the presence of chronic stressors such as loss of herbivores resulting from overfishing. Newly available substrata from storm damage are quickly colonized by macroalgae in the absence of herbivorous surgeonfishes and parrotfishes, preventing coral recruits from settling [4].
Papahānaumokuākea Marine National Monument (PMNM) is one of the largest fully protected marine conservation areas in the world, encompassing approximately 1.5 million km2 of the Pacific Ocean surrounding the Northwestern Hawaiian Islands. While islands and atolls of PMNM are rarely in the paths of tropical storms and hurricanes, Hurricane Walaka passed approximately 55 km west of Lalo Atoll (French Frigate Shoals) in PMNM in October 2018. After peaking as a Category 5 hurricane in the Central Pacific, Walaka moved toward the north–northeast and then across PMNM as a Category 3 hurricane (Figure 1a), with its estimated intensity of approximately 110 kt and eastern eyewall moving across Lalo [5]. Due to its remote location, damage to the underwater ecosystem was not confirmed until July 2019 when divers visited an iconic coral reef called Rapture Reef (23.63509° N, 166.1857° W) at the southern end of the atoll for a benthic survey (Figure 1). The surveyors were able to locate the permanent pins that were used to facilitate the long-term monitoring of the site and observed that all live coral had been destroyed, and the benthos was covered by a mixture of rubble and sand with no fish in the area except for a single shark [6]. While it is difficult to determine the exact spatial extent of the hurricane damage to coral reefs at Lalo due to the size of the atoll, surveys at other long-term monitoring sites in 2019 suggest that the extensive damage found at Rapture Reef might be relatively localized (K.H.P. personal observation).
Monitoring the recovery of Rapture Reef provides us with an important and rare scenario where we can examine the succession of a coral reef after its complete destruction by natural disturbance. Rapture Reef is located at approximately 26 m depth and was home to high cover of Acropora table coral and an abundant and diverse population of reef fish prior to the hurricane damage [7,8]. Benthic cover changed from ~70% Acropora coral before the hurricane to over 99% rubble and sand after the hurricane [6]. PMNM is also protected and largely uninhabited, which provides a unique perspective into coral reef recovery in the absence of anthropogenic stressors. The present study reports on changes in the biological community on the rubble bed and, thus, the initial recovery of Rapture Reef utilizing underwater photogrammetric techniques and a visual fish count and highlights cryptic organisms on the reef that can play critical ecological roles in reef succession following coral mortality.
2. Materials and Methods
2.1. Fish and Benthic Photogrammetry Surveys
The Rapture Reef site is marked by two permanent pins and was surveyed by three SCUBA divers on 4 August 4 2021, approximately three years after the hurricane passed through PMNM. A 10-m transect tape was first laid along the pins, and one of the divers who had been formally trained to conduct fish surveys in Hawaiian waters identified, sized and enumerated all fishes within a 2.5 m belt on either side of the transect (5 m in total width). After completing the fish survey along the transect, the diver moved away from the transect to allow for a three-dimensional (3D) photogrammetry survey to take place but continued to record the presence of reef fish in the area until the photogrammetry survey was completed. The recording of the presence of fish during the photogrammetry survey identified species that were in the reef area but not captured within the belt transect. Reef fishes were categorized into six trophic habits (herbivore, corallivore, invertivore, planktivore, omnivore and piscivore) based on various databases and references, including FishBase (www.fishbase.org (accessed on 5 December 2021)), Hiatt and Strasburg [9], Hobson [10] and Hoover [11].
A series of overlapping images was collected by another diver for 3D reconstruction of the same 50-m2 (10 m × 5 m) reef plot for the fish survey using photogrammetric techniques, co-locating the fish and benthic surveys. The imagery was taken using a Sony α7IIIR mirrorless camera in an underwater housing with an 8-inch dome port. The focal length of the lens was set to 24 mm throughout the imagery collection. The diver swam along the transect approximately 1 m above the substratum in a lawnmower pattern while taking photographs with approximately 70~80% overlap. Calibrated scale bars with coded targets were placed around the plot prior to the imagery collection for orthorectification of the resulting 3D reconstruction.
The same divers returned to the site on 17 August 2021 to collect multiple sets of imagery for 3D reconstruction of coral recruits. A 10-m transect tape was laid along the permanent pins for reference, and eight recruit colonies were haphazardly selected in the 50-m2 survey area for 3D reconstruction. Calibrated scale bars with coded targets were placed around each colony, and the photogrammetry diver collected overlapping images while swimming around the colony and the surrounding scale bars in a spiral pattern, aiming for 70~80% overlap between images. During the imagery collection, the fish diver also recorded the presence of reef fish in the area.
2.2. Generation and Analysis of 3D Models
Three-dimensional reconstructions of the reef plot and individual coral recruits were completed using the software Agisoft Metashape Professional v1.7 (Agisoft Metashape LLC., St. Petersburg, Russia) following the methods of Burns et al. [12]. For each model, markers were first placed on the images by the software using automatic detection of the coded targets of the scale bars. A sparse point cloud was generated through the software’s photoalignment process, and the known distances between coded targets were used to optimize the photoalignment and scale the model. A dense point cloud was then generated. A digital elevation model (DEM) and an orthophotomosaic were produced from the single projected overhead planar angle and exported as GeoTIFF files for further analysis. The cell resolutions of DEMs were set to 0.01 m for the reef plot following the methods of Burns et al. [12] and 0.003 m for the recruits to increase the capacity to capture details of the 3D structure of the small colonies.
The orthophotomosaics of the 50-m2 reef plot and recruit colonies were digitized in the Geographic Information System software QGIS v.3.10 (https://qgis.org (accessed on 5 December 2021), QGIS project). For the reef plot, all benthic features (coral, algae, sponge and a mixture of rubble and sand) were digitized to quantify the percent cover and density of all organisms colonizing the rubble bed (i.e., initial colonizers). The 2D planar area was calculated for each feature using QGIS’s field calculator. Note that it is possible to obtain 3D surface area instead of 2D planar area (see below for details), but we used 2D planar area here for consistency with our initial survey in 2019 [6] and due to the relatively flat nature of the rubble bed. Coral colonies were identified to the species level by a single coral ecologist who was well trained in NOAA Pacific Islands Fisheries Science Center’s benthic survey procedures [13]. The size of each colony was obtained as the diameter of the minimum enclosing circle of the polygon using the vector geometry tool of QGIS to determine the size distribution of the coral recruits. To obtain the rubble-to-sand ratio, 400 points were randomly generated over the abiotic features of the survey plot (i.e., the mixture of rubble and sand) and manually annotated to denote if the point covered either sand or rubble.
For the recruits, coral colonies were digitized on the orthophotomosaics and exported into the statistical software R v.4.0.3 along with the corresponding DEMs. The 3D surface area of each recruit colony was calculated following the method of Jenness [14] using custom R scripts (Text S1). DEMs were cropped to the extent of the polygons with a 3 mm padding (i.e., 1 cell) on all four sides prior to the calculation. The padding was needed as the calculation of the 3D surface area of each cell required the eight surrounding cells to compute elevational differences. The volume of each recruit was also estimated by subtracting the minimum elevation value of the cropped DEM from the elevation value of each cell and multiplying it by the cell area (i.e., 0.000009 m2). The 3D surface area and volume data would offer the initial starting point for a future tracking of coral growth at the site.
3. Results and Discussion
Ground sampling distance values (resolution/pixel) of the 3D reconstructions were 0.322 mm/pixel for the reef plot and ranged from 0.070 to 0.089 mm/pixel for the eight recruits. Root mean standard error (RMSE) values were 0.00019 m for the reef plot and ranged from 0.00005 to 0.00043 m for the recruits. These values confirmed that the DEM resolutions of 0.01 m for the reef plot and 0.003 m for the recruits were well within the accuracy of the 3D reconstructions.
Benthic cover inside the 50-m2 reef plot was 0.31% Pocillopora meandrina, 0.04% Porites lobata, 0.32% filamentous green algae, 0.03% red macroalgae, 0.66% sponge and 98.65% a mixture of rubble and sand (Table S1). Of the mixture of rubble and sand, the percentages of rubble and sand were estimated to be 82% and 18%, respectively, thus accounting for 80.66% and 17.70% of the total area. While the benthic cover was still dominated by rubble and sand, there were a slight decrease from 99.7% in the previous survey in 2019 [6] and, more importantly, an increase in the rubble-to-sand ratio from 67.9–31.8% in 2019 [6] to 80.7–17.7% (Table 1). This suggests that calcium carbonate sediment that was brought in or generated by the hurricane is being carried away by the hydrological forcing in the area. Note that the sand cover at the site before the hurricane was less than 1% without accounting for the space under Acropora table coral [6]. As coral larvae cannot successfully settle on shifting sediment [15], the decrease in the proportion of sand to rubble has the potential to promote the process of coral recruitment.
Despite the low percent of cover of coral, there were 56 colonies of P. meandrina inside the 50-m2 reef plot, with their sizes ranging from 2 cm to 12 cm (Table S1). There were also 100 recruit/juvenile colonies of P. lobata, and all of them were 4 cm in size or smaller except for one that was 7 cm in size (Table S1). Due to the small size of P. lobata and its encrusting morphology at the site, eight colonies of branching P. meandrina were haphazardly selected for 3D morphometric analysis. The recruits had the mean 3D surface area of 0.0107 m2 (standard error = 0.0010), and their 3D surface area was, on average, 2.6 times larger than the 2D planar area (Table S2), confirming the 3D structure that was added to the relatively flat rubble bed by these recruits. The mean volume of the recruits was 210.5 mL (standard error = 35.1). Prior to Hurricane Walaka, benthic cover at the site was dominated by large Acropora table coral, and no P. meandrina colonies were detected inside the 3D reconstruction of a 50-m2 reef plot in 2017 [6]. However, the settlement of P. meandrina in the present study is consistent with a previous description of this species being most successful at colonizing new substrata among coral species in Hawai‘i [16]. The present study shows that P. meandrina is also successful at colonizing on an unconsolidated rubble bed.
In total, 35 species of reef fish were recorded during two fish surveys: 25 species on 4 August 2021 and 23 species on 17 August 2021 (Table A1). There were nineteen invertivores, six herbivores, five planktivores, two omnivore and three piscivores. No corallivores were observed. A large school of sharks (Carcharhinus galapagensis) was also observed on both days. Although there are no quantitative fish data available from the reef area prior to the hurricane damage, the abundance of reef fishes in the present study was a considerable change from the previous survey in July 2019, which occurred nine months after the hurricane, when no reef fish were observed in the area except for a single individual of C. galapagensis [6]. While fish assemblages in Papahānaumokuākea are associated with the structural complexity of habitats, including the complexity of different coral morphologies [17], no visually obvious change occurred in the 3D habitat structure at this site from 2019 to 2021; the site was predominantly covered by rubble and sand in both years. The mechanisms of this surprising return of reef fish are unknown, but in an opposite scenario where a mass coral bleaching event caused the loss of coral tissues, changes in the fish assemblage were observed at the site while the carbonate colony structure was still intact [18]. Thus, the small changes in benthic cover captured by the numerical analyses (i.e., colonization of coral, sponges and algae and the increase in the rubble-to-sand ratio) might have contributed to the observed reef fish abundance in 2021. A rubble field can also host a great density and diversity of sessile and motile cryptofauna including ascidians, bryozoans, molluscs, tunicates, crustaceans and polychaetes, and some invertivorous reef fishes (e.g., labrids, mullids and lutjanids) are often observed in association with rubble beds [19]. During the survey in 2019, a large number of dead gastropod shells were observed at the site (K.H.P personal observation), which could suggest the mortality of cryptic invertebrates due to the physical forces of the hurricane and sedimentation. The abundance of invertivores (19 of the 35 species) at the site in the present study (Table A1) could then be an indication of recovery of these cryptic organisms following the mortality. A further study utilizing a technique such as environmental DNA is required to detect such cryptic organisms on coral reefs.
The present study reported on the initial recovery of Rapture Reef following its destruction by Hurricane Walaka in 2018. The quantitative investigations utilizing underwater photogrammetry allowed us to capture the subtle changes in benthic cover and provided us with a procedure, including the volumetric analysis of coral recruits, to conduct detailed assessments of benthic recovery at this site. Grigg and Maragos [20] described that coral reefs in sheltered areas of Hawai‘i could take, at minimum, 50 years to reach successional maturity. The earliest successional stage of Hawaiian reefs after lava flows usually consists of algae, followed by pioneering coral species such as P. meandrina after the early algal colonizers die out [20,21]. In the case of Rapture Reef, where the site was turned into a rubble bed, rubble binding and stabilization are also important initial steps of the recovery process. The colonization of sponges in the present study is an encouraging sign of recovery, as sponges can work as intermediate binders alongside the pioneer binders of turf algae and macroalgae before rigid binding by late-stage binders, such as crustose coralline algae, takes place [22]. While quick colonization of macroalgae can prevent coral larvae from settling, ultimately progressing to a state of algal dominance [4], this does not seem to be a concern at the remote location of Rapture Reef since the coral and algal cover were approximately the same in the present study.
Lalo Atoll hosts one of the most diverse coral assemblages in the Hawaiian archipelago, with Acropora coral species from Johnston Atoll likely colonizing the area via the subtropical countercurrent [23]. The colonization of P. meandrina at Rapture Reef is consistent with the previously described successional stages of Hawaiian reefs, but this species was not abundant at the site prior to the disturbance event [6]. Acropora coral at Lalo Atoll showed resilience to an outbreak of white syndrome in the 2000s [24], but the complete destruction of the reef structure offers a different scenario. Continuous annual monitoring of the site utilizing underwater photogrammetry and visual fish count is planned, which should quantitatively capture successional changes of the reef and growth rates of the coral community and reveal whether the reef returns to its original Acropora-dominated state or progresses towards a new community composition. Photogrammetric techniques also allow for the resulting 3D reconstructions to be archived for future analyses; thus, various metrics of structural complexity can be compared over many years, or even decades, as the reef goes through successional changes.
Supplementary Materials
The following are available online at https://0-www-mdpi-com.brum.beds.ac.uk/article/10.3390/d14010039/s1, Text S1: R scripts to obtain 3D surface area and volume estimate inside polygons based on corresponding DEMs; Table S1: List of benthic features digitized in the 50-m2 reef plot and their 2D planar area (m2), 3D surface area (m2) and size (m) calculated at 0.01 m DEM resolution; Table S2: 2D planar area (m2), 3D surface area (m2) and volume estimate (ml) of eight coral recruits calculated at 0.003 m DEM resolution.
Author Contributions
Conceptualization, A.F. and J.H.R.B.; methodology, A.F.; formal analysis, A.F.; investigation, K.H.P. and A.R.P.; writing—original draft preparation, A.F.; writing—review and editing, A.F., K.H.P., A.R.P., R.K.K. and J.H.R.B.; funding acquisition, R.K.K. and J.H.R.B. All authors have read and agreed to the published version of the manuscript.
Funding
This work was funded by the National Oceanic and Atmospheric Administration’s Office of National Marine Sanctuaries through the Papahānaumokuākea Marine National Monument, by the National Science Foundation under the CREST-PRF Award #1720706 and EPSCoR Program Award OIA #1557349 granted to J.H.R. Burns and by the National Fish and Wildlife Foundation under Award # NFWF-UHH-059023 granted to J.H.R. Burns.
Institutional Review Board Statement
Not applicable.
Informed Consent Statement
Not applicable.
Data Availability Statement
All data are included in the manuscript and Supplementary Materials as tables.
Acknowledgments
We thank NOAA Papahānaumokuākea Marine National Monument’s field team for their logistic support and LTJG Luke Evancoe and Joseph Mangiafico for their field assistance. We also thank three anonymous reviewers who improved the manuscript through their input. The scientific results and conclusions, as well as any views or opinions expressed herein, are those of the authors and do not necessarily reflect the views of NOAA or the Department of Commerce.
Conflicts of Interest
The authors declare no conflict of interest.
Appendix A

Table A1.
Species of reef fish that were present during the surveys on 4 August 2021 and 17 August 2021. Trophic categories are listed in the parentheses: H—herbivore, I—invertivore, O—omnivore, P—planktivore and Pis—piscivore. The “x” denotes presence. Species with size and count data were on the belt transect on August 4, while all other species were in the area but not on the transect.
| Species | 4 August 2021 | 17 August 2021 | Size × Count |
|---|---|---|---|
| Acanthuridae | |||
| Acanthurus olivaceus (H) | x | x | |
| Naso lituratus (H) | x | ||
| Balistidae | |||
| Melichthys niger (P) | x | x | |
| Melichthys vidua (H) | x | ||
| Sufflamen bursa (I) | x | x | |
| Sufflamen fraenatum (I) | x | ||
| Chaetodontidae | |||
| Chaetodon fremblii (I) | x | x | 8 cm × 4 |
| Chaetodon kleinii (P) | x | x | 7 cm × 3 |
| Heniochus diphreutes (P) | |||
| Cirrhitidae | |||
| Cirrhitops fasciatus (I) | x | x | |
| Fistulariidae | |||
| Fistularia commersonii (Pis) | x | ||
| Labridae | |||
| Anampses chrysocephalus (I) | x | ||
| Bodianus albotaeniatus (I) | x | x | 31 cm × 1 |
| Coris ballieui (I) | x | x | |
| Coris gaimard (I) | x | ||
| Coris venusta (I) | x | ||
| Labroides phthirophagus (I) | x | x | |
| Novaculichthys taeniourus (I) | x | ||
| Pseudocheilinus evanidus (I) | x | x | 6 cm × 1 |
| Stethojulis balteata (I) | x | ||
| Thalassoma duperrey (I) | x | ||
| Thalassoma duperrey/quinquevittatum (I) | x | 11 cm × 6, 16 cm × 1 | |
| Lutjanidae | |||
| Aprion virescens (Pis) | x | 54 cm × 1 | |
| Lutjanus kasmira (I) | x | x | |
| Monacanthidae | |||
| Cantherhines verecundus (H) | x | ||
| Pervagor spilosoma (O) | x | ||
| Mullidae | |||
| Mulloidichthys flavolineatus (I) | x | ||
| Parupeneus multifasciatus (I) | x | 17 cm × 1 | |
| Muraenidae | |||
| Gymnothorax meleagris (Pis) | x | ||
| Pomacanthidae | |||
| Apolemichthys arcuatus (I) | x | ||
| Centropyge fisheri (H) | x | x | |
| Centropyge potteri (H) | x | x | |
| Paracentropyge multifasciata (O) | |||
| Pomacentridae | |||
| Chromis hanui (P) | x | x | |
| Chromis vanderbilti (P) | x | x | 4 cm × 6 |
References
- Pearson, R.G. Recovery and recolonization of coral reefs. Mar. Ecol. Prog. Ser. 1981, 4, 105–122. [Google Scholar] [CrossRef]
- Connell, J.H. Diversity in tropical rain forests and coral reefs. Science 1978, 199, 1302–1310. [Google Scholar] [CrossRef] [PubMed] [Green Version]
- Dollar, S.J.; Tribble, G.W. Recurrent storm disturbance and recovery: A long-term study of coral communities in Hawaii. Coral Reefs 1993, 12, 223–233. [Google Scholar] [CrossRef]
- Rogers, C.S.; Miller, J. Permanent ’phase shifts’ or reversible declines in coral cover? Lack of recovery of two coral reefs in St. John, US Virgin Islands. Mar. Ecol. Prog. Ser. 2006, 306, 103–114. [Google Scholar] [CrossRef]
- Houston, S.; Birchard, T. Tropical Cyclone Report: Hurricane Walaka (29 September–6 October 2018); Cnetral Pacific Hurricane Center: Honolulu, HI, USA, 2020.
- Pascoe, K.H.; Fukunaga, A.; Kosaki, R.K.; Burns, J.H.R. 3D assessment of a coral reef at Lalo Atoll reveals varying responses of habitat metrics following a catastrophic hurricane. Sci. Rep. 2021, 11, 12050. [Google Scholar] [CrossRef] [PubMed]
- Fukunaga, A.; Kosaki, R.K.; Hauk, B.B. Distribution and abundance of the introduced snapper Lutjanus kasmira (Forsskål, 1775) on shallow and mesophotic reefs of the Northwestern Hawaiian Islands. Bioinvasions Rec. 2017, 6, 259–268. [Google Scholar] [CrossRef]
- Meyer, C.G.; Holland, K.N.; Papastamatiou, Y.P. Seasonal and diel movements of giant trevally Caranx ignobilis at remote Hawaiian atolls: Implications for the design of Marine Protected Areas. Mar. Ecol. Prog. Ser. 2007, 333, 13–25. [Google Scholar] [CrossRef]
- Hiatt, R.W.; Strasburg, D.W. Ecological relationships of the fish fauna on coral reefs of the Marshall Islands. Ecol. Monogr. 1960, 30, 65–127. [Google Scholar] [CrossRef]
- Hobson, E.S. Feeding relationships of teleostean fishes on coral reefs in Kona, Hawaii. Fish. Bull. 1974, 72, 915–1031. [Google Scholar]
- Hoover, J.P. Hawaii’s Fish; Mutual Publishing: Honolulu, HI, USA, 1993; p. 183. [Google Scholar]
- Burns, J.H.R.; Delparte, D.; Gates, R.D.; Takabayashi, M. Integrating structure-from-motion photogrammetry with geospatial software as a novel technique for quantifying 3D ecological characteristics of coral reefs. PeerJ 2015, 3, e1077. [Google Scholar] [CrossRef] [PubMed]
- Swanson, D.; Bailey, H.; Schumacher, B.; Ferguson, M.; Vargas-Ángel, B. Ecosystem Sciences Division Standard Operating Procedures: Data Collection for Rapid Ecological Assessment Benthic Surveys; NOAA Technical Memorandum NMFS-PIFSC-71: Honolulu, HI, USA, 2018; p. 63.
- Jenness, J.S. Calculating landscape surface area from digital elevation models. Wildl. Soc. Bull. 2004, 32, 829–839. [Google Scholar] [CrossRef]
- Rogers, C.S. Responses of coral reefs and reef organisms to sedimentation. Mar. Ecol. Prog. Ser. 1990, 62, 185–202. [Google Scholar] [CrossRef]
- Smith, L.W. Status Review Report: Pocillopora Meandrina; National Marine Fisheries Service, Pacific Islands Regional Office: Honolulu, HI, USA, 2019.
- Fukunaga, A.; Kosaki, R.K.; Pascoe, K.H.; Burns, J.H.R. Fish assemblage structure in the Northwestern Hawaiian Islands is associated with the architectural complexity of coral-reef habitats. Diversity 2020, 12, 430. [Google Scholar] [CrossRef]
- Richardson, L.E.; Graham, N.A.J.; Pratchett, M.S.; Eurich, J.G.; Hoey, A.S. Mass coral bleaching causes biotic homogenization of reef fish assemblages. Globa. Chang. Biol. 2018, 24, 3117–3129. [Google Scholar] [CrossRef] [PubMed] [Green Version]
- Wolfe, K.; Kenyon, T.M.; Mumby, P.J. The biology and ecology of coral rubble and implications for the future of coral reefs. Coral Reefs 2021, 40, 1769–1806. [Google Scholar] [CrossRef]
- Grigg, R.W.; Maragos, J.E. Recolonization of hermatypic corals on submerged lava flows in Hawaii. Ecology 1974, 55, 387–395. [Google Scholar] [CrossRef]
- Grigg, R.W. Community structure, succession and development of coral reefs in Hawaii. Mar. Ecol. Prog. Ser. 1983, 11, 1–14. [Google Scholar] [CrossRef]
- Ceccarelli, D.M.; McLeod, I.M.; Boström-Einarsson, L.; Bryan, S.E.; Chartrand, K.M.; Emslie, M.J.; Gibbs, M.T.; Gonzalez Rivero, M.; Hein, M.Y.; Heyward, A.; et al. Substrate stabilisation and small structures in coral restoration: State of knowledge, and considerations for management and implementation. PLoS ONE 2020, 15, e0240846. [Google Scholar] [CrossRef] [PubMed]
- Grigg, R.W. Acropora in Hawaii. Part 2. Zoogeography. Pac. Sci. 1981, 35, 15–24. [Google Scholar]
- Aeby, G.S. Outbreak of coral disease in the Northwestern Hawaiian Islands. Coral Reefs 2005, 24, 481. [Google Scholar] [CrossRef]
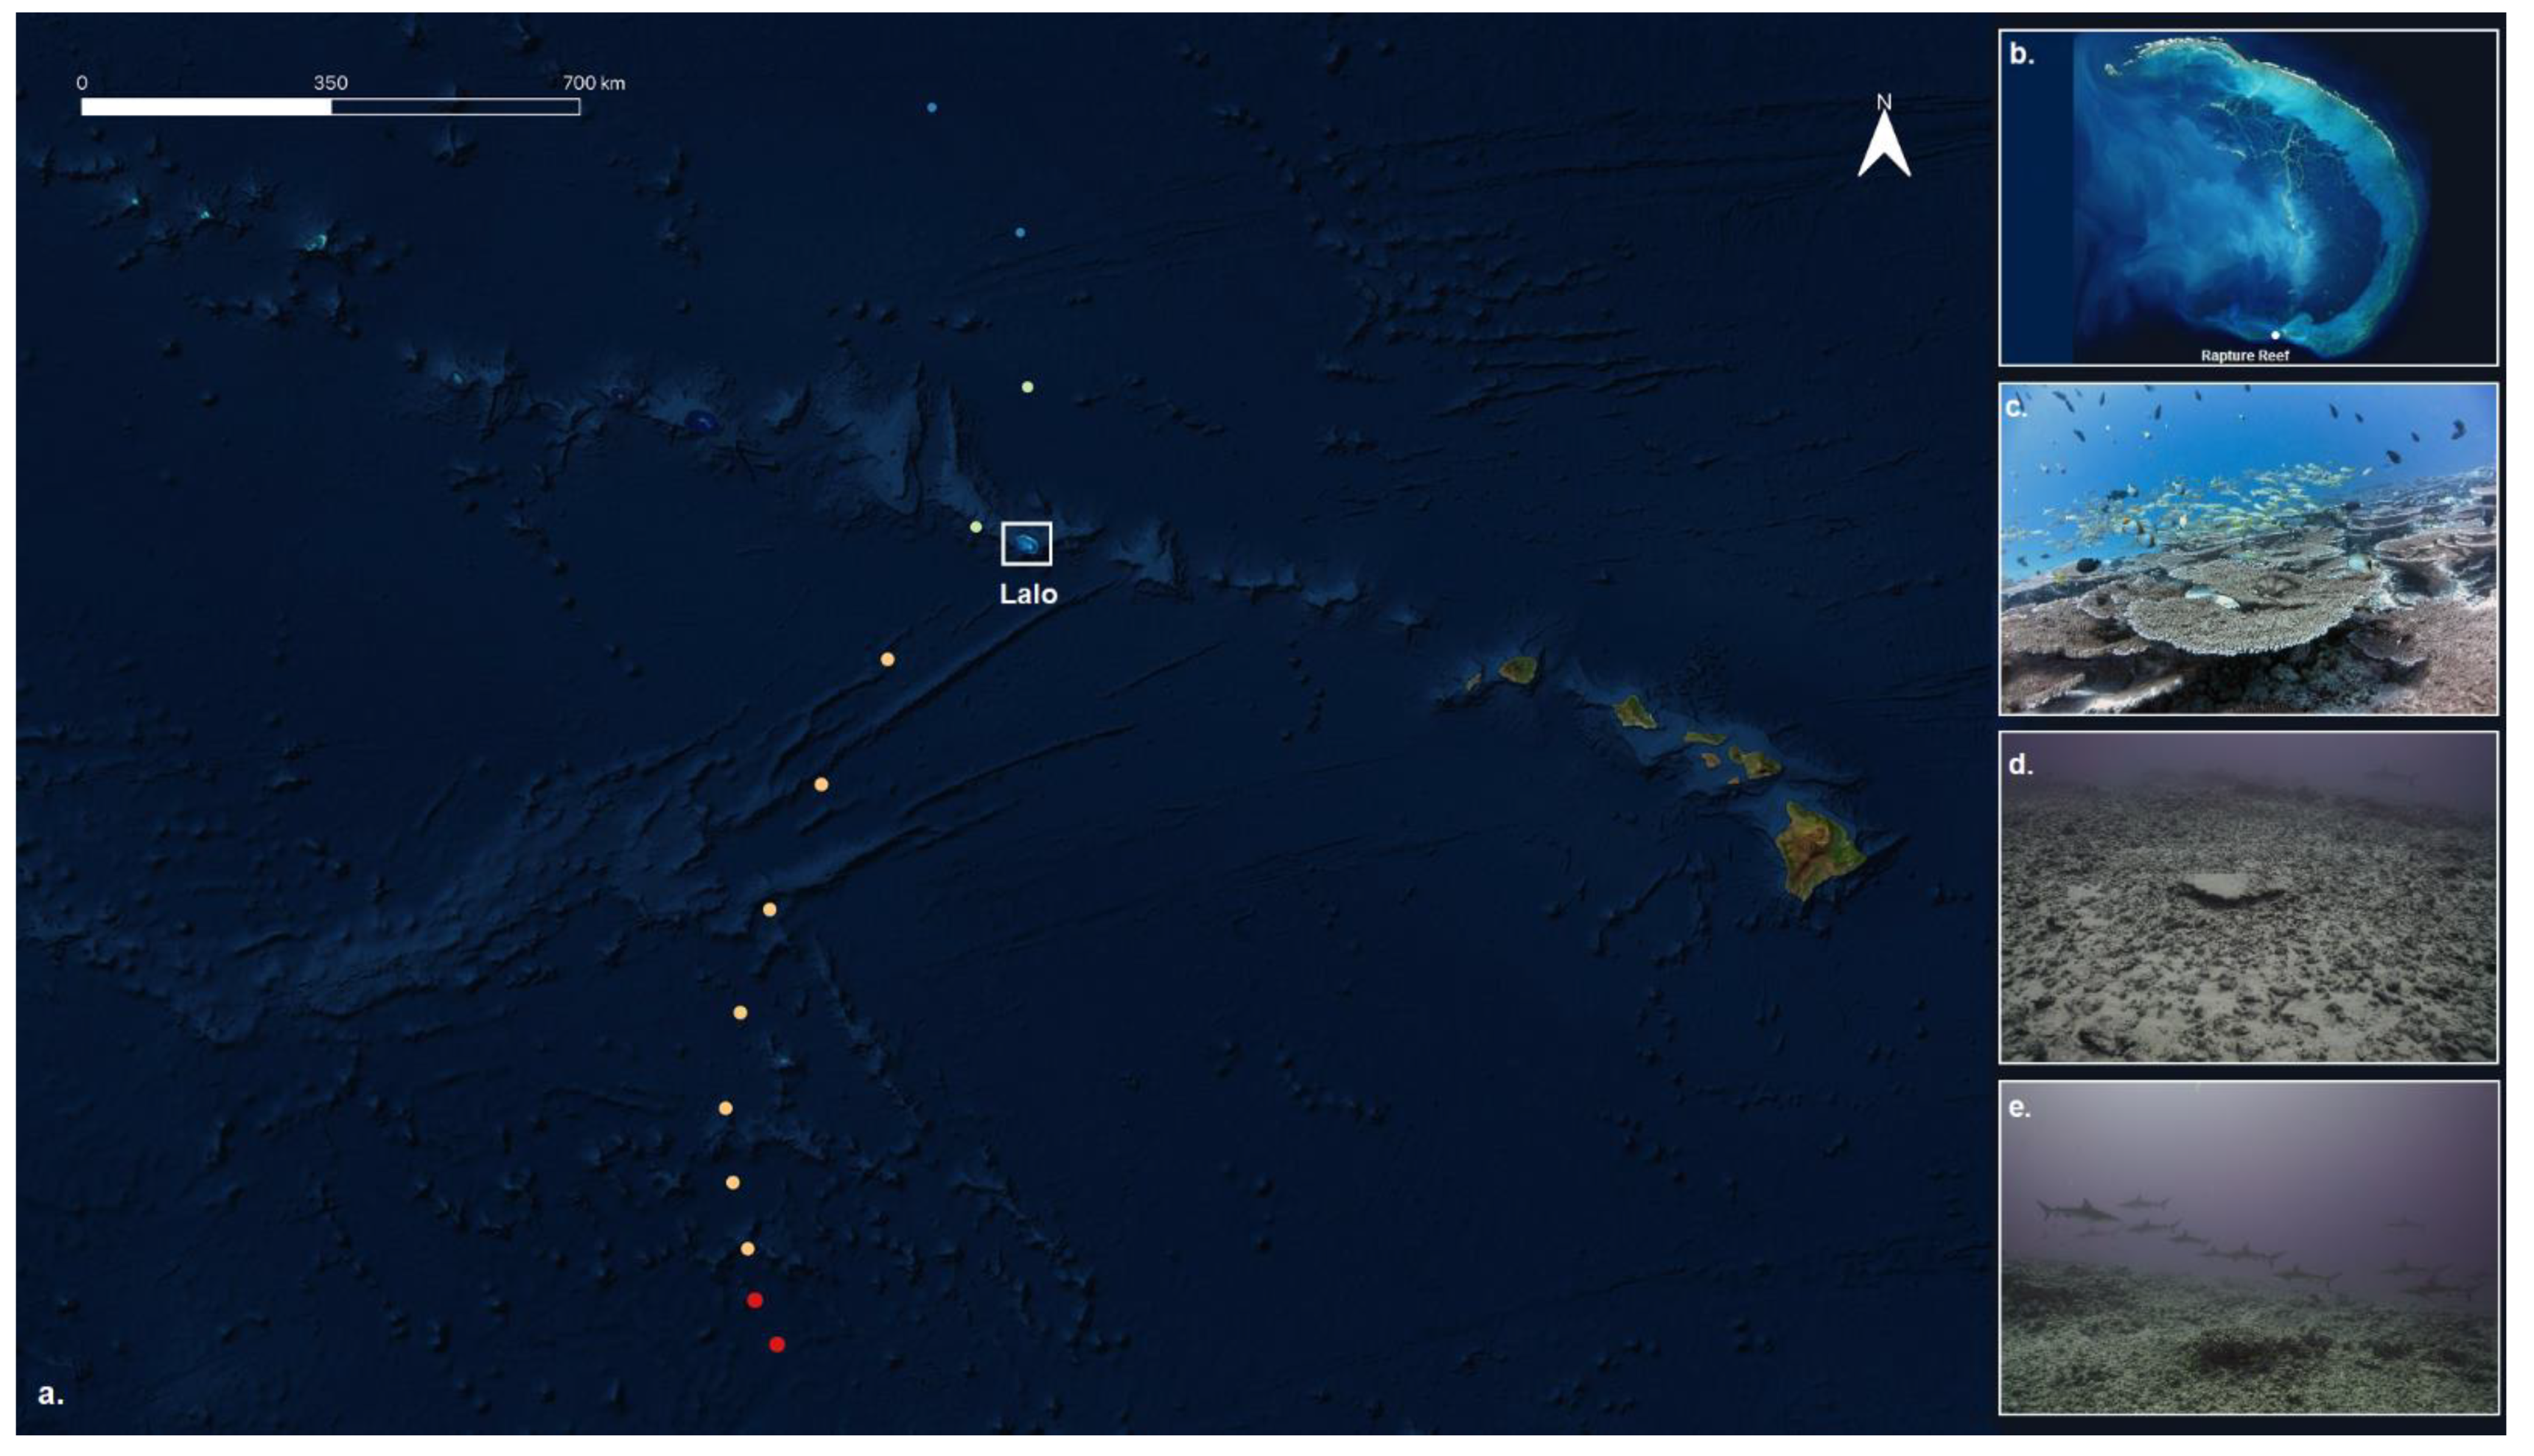
Figure 1.
Maps of (a) the Hawaiian archipelago with the track of Walaka and (b) Lalo. The colors are showing the intensity: Categories 5 (red), 4 (yellow), 3 (green) and 2 (blue). Site photos of Rapture Reef from (c) 2017, (d) 2019 and (e) 2021 are also shown.
Figure 1.
Maps of (a) the Hawaiian archipelago with the track of Walaka and (b) Lalo. The colors are showing the intensity: Categories 5 (red), 4 (yellow), 3 (green) and 2 (blue). Site photos of Rapture Reef from (c) 2017, (d) 2019 and (e) 2021 are also shown.

Table 1.
Percentage of benthic cover in 2017 (before Walaka), 2019 (nine months after Walaka) and 2021 (three years after Walaka), with “-” denoting no detection.
Table 1.
Percentage of benthic cover in 2017 (before Walaka), 2019 (nine months after Walaka) and 2021 (three years after Walaka), with “-” denoting no detection.
| 2017 1 | 2019 1 | 2021 | |
|---|---|---|---|
| Tabulate Acropora | 69.7 | - | - |
| Encrusting Porites | 0.8 | - | 0.04 |
| Encrusting Montipora | 0.1 | - | - |
| Branching Pocillopora | - | - | 0.31 |
| Crustose coralline algae | 1.7 | - | - |
| Macro and filamentous algae | - | - | 0.35 |
| Sponges | - | - | 0.66 |
| Hard substrata | 27.0 | 0.3 | - |
| Rubble | - | 67.9 | 80.66 |
| Sand | 0.7 | 31.8 | 17.70 |
1 Source: Pascoe et al., 2021 [6].
Publisher’s Note: MDPI stays neutral with regard to jurisdictional claims in published maps and institutional affiliations. |
© 2022 by the authors. Licensee MDPI, Basel, Switzerland. This article is an open access article distributed under the terms and conditions of the Creative Commons Attribution (CC BY) license (https://creativecommons.org/licenses/by/4.0/).
Share and Cite
MDPI and ACS Style
Fukunaga, A.; Pascoe, K.H.; Pugh, A.R.; Kosaki, R.K.; Burns, J.H.R. Underwater Photogrammetry Captures the Initial Recovery of a Coral Reef at Lalo Atoll. Diversity 2022, 14, 39. https://0-doi-org.brum.beds.ac.uk/10.3390/d14010039
AMA Style
Fukunaga A, Pascoe KH, Pugh AR, Kosaki RK, Burns JHR. Underwater Photogrammetry Captures the Initial Recovery of a Coral Reef at Lalo Atoll. Diversity. 2022; 14(1):39. https://0-doi-org.brum.beds.ac.uk/10.3390/d14010039
Chicago/Turabian StyleFukunaga, Atsuko, Kailey H. Pascoe, Ashley R. Pugh, Randall K. Kosaki, and John H. R. Burns. 2022. "Underwater Photogrammetry Captures the Initial Recovery of a Coral Reef at Lalo Atoll" Diversity 14, no. 1: 39. https://0-doi-org.brum.beds.ac.uk/10.3390/d14010039
Note that from the first issue of 2016, this journal uses article numbers instead of page numbers. See further details here.