Article

Molecular and Phytochemical Variability of Endemic Juniperus sabina var. balkanensis from Its Natural Range

by
Nemanja Rajčević
1,*,
Tanja Dodoš
1,
Smiljana Janković
1,
Pedja Janaćković
1,
Valtcho D. Zheljazkov
2 and
Petar D. Marin
1
1
Faculty of Biology, University of Belgrade, 11000 Belgrade, Serbia
2
Crop and Soil Science Department, Oregon State University, Corvallis, OR 97331, USA
*
Author to whom correspondence should be addressed.
Submission received: 4 November 2022 / Revised: 24 November 2022 / Accepted: 30 November 2022 / Published: 2 December 2022
(This article belongs to the Special Issue Conservation Genetics and Biogeography of Seed Plant Species II)

Abstract

:
Juniperus sabina L. var. balkanensis R.P. Adams & Tashev is a recently described endemic variety from the Balkan Peninsula. Its strong sprouting ability and fast vegetative propagation, on one hand, and fragmented distribution, on the other, can lead to lower genetic diversity in local populations and to the differentiation of populations. As there has been no detailed investigation of this variety, we studied Balkan natural populations using phytochemical and molecular markers. Leaf essential oils (EOs) were chosen based on their proven usability in the population studies of Juniperus taxa, while ISSRs (Inter Simple Sequence Repeats) have been used due to their high resolution. In addition, since this variety is best described using molecular markers, the chloroplast trnS-trnG region was amplified from individuals from different populations having different chemotypes. Based on the essential oil profile, three chemotypes could be identified with a difference in their distribution. The analysis of molecular variance showed moderate differentiation of populations and regions, attesting to the start of the separation of three regions in the Balkans: west, east and south. The bioclimatic and environmental parameters and sex of the individual did not influence the EO profile, although some of the compounds present in low-to-medium concentrations showed strong correlation with several bioclimatic parameters.

1. Introduction

Juniperus sabina L. (Cupressaceae) is a dioecious coniferous evergreen shrub with both sexual and asexual reproduction strategies. J. sabina (savin juniper) covers a vast area of the northern hemisphere, but its distribution is fragmented across Eurasia, from Spain in the west to Mongolia and Siberia in the east. The World Flora (WFO) database recognises five varieties within this species: var. sabina, var. mongoliensis R.P. Adams, var. davurica (Pall.) Farjon, var. arenaria (E.H.Wilson) Farjon and var. balkanesis R.P. Adams & Tashev [1]. Due to its ability to spontaneously produce adventitious roots on soil covered branches and its resistance to pruning, it plays a significant role in the prevention of land desertification and the improvement of the urban landscape [2].
Balkan savin juniper is a just recently described variety [3]. It is an extremely rare variety that grows only in the Balkans. It can only be found in very inaccessible terrains, growing mostly on screes and vertical cliffs. The most recent research shows that it is common in the Balkans and Anatolia region [4,5,6,7,8,9]; however, there is no data for Serbia, where its central part of distribution should be found. While Adams found slight morphological differences (e.g., in the colour and texture of leaves, position of leaf glands and shape of seed cones), the most distinct characteristics are found in their genome, reflecting an ancient hybridisation event with J. thurifera [3]. This was also confirmed by Farhat et al. [4,10,11], who discovered that all of the var. balkanensis individuals had twice the amount of DNA than other varieties of this species, suggesting that the variety is tetraploid, rather than diploid.
In addition to its significance in natural and urban environments, savin juniper produces large amounts of bioactive compounds, mainly terpenoids; therefore, their essential oil composition has largely been studied from this aspect [8,12,13,14,15,16,17]. However, there are not many reports dealing with the intra- and inter-population variability of their essential oil. Essential oils (EOs) are mixtures of volatile organic compounds, mostly commonly terpenoids. Monoterpens and sesquiterpenes dominate juniper essential oils, in which up to 100 different terpene and non-terpene compounds could be found. In addition to their bioactivity, conifer essential oils, and particularly juniper essential oils, have been studied for their chemophenetic significance as chemophenetic markers that have proven useful in describing and assessing the genetic diversity of populations, as their composition is mostly genetically determined [18,19,20,21,22]. Present literature data on savin juniper shows the domination of two biosynthetically linked monoterpenes—sabinene and trans-sabinyl acetate (Figure 1); however, not all enzymes involved in the biosynthesis are known [23,24,25,26]. Nevertheless, it appears that sabinene is the starting compound for several highly abundant savin juniper terpenes.
While the species has been proven as hardy and is widely grown for ornamental purposes, it cannot withstand competition with other shrubs or trees in its natural habitat. As these remaining fragments of natural populations are important gene pools, it is important to preserve their genetic resources and reconstruct or find new habitats for this species. Thus, the starting point in these efforts is determining the genetic diversity and structure of natural populations of J. sabina var. balkanensis. However, previous investigations of the population variability using molecular markers have only been conducted in Asia [2], where two genetic pools were discovered. Recently, different authors have suggested using inter-simple sequence repeat (ISSR) markers as an alternative system with reliability and advantages over other molecular marker systems [27,28,29,30]. This technique involves the amplification of genomic segments flanked by inversely oriented microsatellite sequences. These regions are amplified using primers based on SSRs anchored with a couple of nucleotides. The resulting PCR products are multiple bands of different lengths that could be coded into a presence/absence matrix. ISSR markers are dominant markers that show Mendelian inheritance.
Protecting this narrowly distributed taxon and its genetic potential is of paramount significance in studies of changing climate on its growth and distribution. The aim of this study was to establish intra- and inter-population variability using leaf essential oil composition and their possible correlation with environmental factors. Individuals with different chemotypes were chosen for molecular analyses. ISSR were used to assess intra- and inter-population variability and correspondence with phytochemical markers, while chloroplast trnG-trnS sequences were used to further confirm that the samples are J. sabina var. balkanensis.

2. Materials and Methods

2.1. Plant Material

Twigs with leaves of 100 individuals from seven natural populations of J. sabina var. balkanensis were collected from 2009 to 2015, along an altitudinal gradient from 700 to 1450 m in the Balkan Peninsula. One population was sampled in two different years to account for seasonable variability. All samples were placed in individual PP zip-lock bags and placed in a portable freezer on the location site. Within a day, the bags were packed in the freezer, and kept at a temperature of −18 °C until extraction. Plant material for DNA isolation was desiccated in the field using silica gel and stored at room temperature until DNA extraction. In total, 21 individuals were used in ISSR and 12 in trnG-trnS analyses. Population details, geographic information, terrain inclination, exposure, altitudes and voucher numbers are given in Table 1 and Figure 2. Taxonomic identification of the species was conducted by the authors in the field (NR, PJ and PM) and confirmed in the taxonomical lab using keys for the identification of Junipers [31,32]. The voucher specimens (accession No. given in Table 1) were deposited at the Herbarium of the University of Belgrade, Faculty of Biology (BEOU).

2.2. Essential Oil Isolation

The leaves from the collected frozen material were ground in a laboratory mill prior to essential oil extraction. Distilled water (150 mL) was added to the homogenised material of each sample (ca. 3 g) and subjected to 2 h simultaneous hydrodistillation and extraction (SDE) in a Likens-Nickerson type apparatus [33]. Dichloromethane (CH2Cl2) 5 mL was used as primary solvent. The obtained extracts (0.5 mL) were stored in amber vials at 4 °C until further analyses.

2.3. GC-FID and GC/MS Analysis

The GC analysis was carried out using an Agilent 7890A apparatus equipped with a 5975C mass-selective detector, flame ionisation detector (FID) and DB-5 MS fused-silica gel cap. The conditions and analysis procedures for GC-FID and GC/MS are described in Rajčević et al. [19]. The relative amounts of volatile components were expressed as percentages of the peak area of total ion chromatograms. Values under 0.05% were not considered during compound identification. A library search and mass spectral deconvolution and extraction were performed using the software NIST AMDIS version 2.64.113.71, with the retention index (RI) calibration data analysis parameters set to “strong” level and 10% penalty for compounds without RI. The search was performed against our homemade library, containing 4972 spectra. The relative contents of the identified compounds were computed from the GC peak areas. The linear RI was calculated for all compounds using the following formula: LRI = 100 × (trs − trn)/(trn + 1 − trn) + 100 × n.

2.4. DNA Extraction

The DNA was isolated from the young leaves of seven populations (Table 1) using a modified CTAB protocol, previously described in Rajčević et al. [18]. DNA purity and quantity were determined using the Perkin Elmer spectrophotometer (LambdaBio, Beaconsfield, UK). The sample concentration was adjusted to 100 ng/µL and stored at −80 °C until further analyses.

2.5. Chloroplast Sequence Analysis

The DNA isolates were assessed by PCR amplification of the one cpDNA region, the trnG-trnS spacer region. The trnG-trnS spacer was PCR amplified using trnSGCU 5′-GCCGCTTTAGTCCACTCAGC-3′ as the forward, and trnGUCC 5′-GAACGAATCACACTTTTACCAC -3′ as the reverse primer [34]. PCR amplification was performed in 25 μL volumes, containing: 50 ng template DNA, 2.5 μL 1 × Taq Buffer with (NH4)2SO4 (Fermentas UAB, Vilnius, Lithuania), 2.5 mM MgCl2, 0.2 mM dNTPs, 0.25 μM of each forward and reverse primer, 0.80% BSA (Bovine Serum Albumin, Fermentas UAB, Vilnius, Lithuania), and 0.025 U/μL of Platinum taqDNA polymerase (Fermentas UAB, Vilnius, Lithuania). PCR amplifications were performed using Eppendorf Mastercycler Nexus GSX1 with the following program: initial denaturation at 94 °C for 10 min, followed by 35 cycles of denaturation at 94 °C for 45 s, annealing at 60 °C for 1 min, extension at 72 °C for 1 min, and final extension at 72 °C for 10 min. Macrogen Europe B.V. performed sequencing using ABI 3730XLs capillary DNA analyser. The resulting sequences were checked (Chromas, 2.6.6) and manually aligned (Mega X) [35].

2.6. ISSR Analysis

PCRs were performed in 25 µL volume consisting of 1 × KCl PCR buffer, 1.5 mM MgCl2, 0.2 mM of dNTPs mix, 0.8 µM primer, 0.5 U of Taq DNA polymerase (Thermo Fisher Scientific, Chesire, UK), 5% DMSO (Sigma Aldrich, St. Louis, MO, USA), and 50 ng of template DNA. Five ISSR primers were tested in this research (Table 4). Amplification was performed in an Eppendorf Mastercycler Nexus GSX1 using touchdown protocol of the following conditions: 10 min at 94 °C for 1 cycle, followed by 30 s at 94 °C, 60 s at Tm for specific primer (cf. Table 4), and 2 min at 72 °C for, next 30 s at 94 °C, 60 s at Tm −5 °C for specific primer, and 2 min at 72 °C for 37 cycles and 10 min at 72 °C for a final extension. Amplification products were separated on 2% agarose gels run for 45 min at 4.5 V/cm in 1 × TAE, visualized by staining with green safe (NZY tech, Lisboa, Portugal), and 6X Orange DNA Loading Dye (Thermo Scientific). Gels were photographed under ultraviolet light using a gel documentation and image analysis system (Vilber Loumat Doc-Print VX2). Fragment lengths were estimated using a GeneRuler 1 kb DNA Ladder (Thermo Fisher Scientific). Polymorphic bands were scored as present (1) or absent (0) and assembled in a data matrix. Only reproducible and clear bands in the replications were considered potential polymorphic markers.

2.7. Environmental Data

The bioclimatic data (temperature, precipitation, solar radiation) of all seven studied localities were taken from the WorldClim 2.0 set of global climate layers, with the precision of ~1 sq km [36]. The data were analysed using QGIS software (QGIS Development Team 2015). Geological substratum information was obtained from the International Geological Map of Europe and Adjacent Areas [37].

2.8. Statistical Analyses

The mean, standard deviation and distribution were tested before performing univariate (Analysis of variance, ANOVA) and multivariate analyses (principal components analysis, PCA; discriminant analysis, DA; hierarchical cluster analysis, HCA; multivariate analysis of variance, MANOVA). Simple linear correlation and multivariate correlation (Mantel and partial Mantel tests) were used to analyse the correlation of EO components with the environmental data. All statistical analyses were performed using PAST 4.11 [38].
For the ISSRs, the efficiency of each marker in giving polymorphic DNA bands was expressed with the total number of bands, number of polymorphic bands, number of monomorphic bands, percentage of polymorphic bands and polymorphism information contents (PICs) [39]. AMOVA (Analysis of Molecular Variance) was calculated using GenoDive v.3.0 [40], with 9999 permutations. The population structure, based on a squared Euclidean distance matrix using Fst-analogue independent of ploidy level and breeding system [41,42], was analysed. Bayesian model-based estimation of population structure was performed using Structure version 2.3.4 [43]. The analyses were performed under the admixture model assuming independent allele frequencies and using a burn-in period of 10,000, followed by 5000 Markov Chain Monte Carlo, and the most likely value of K was determined according to [44]. Principal coordinate analysis (PCoA) was performed to illustrate the overall similarity among the individuals using GenAlEx 6.5 [45]. The PCoA was inferred from the Jaccard’s distance between all pairs of ISSR phenotypes. The Mantel test was carried out to assess the correlation between genetic (Nei’s genetic distances of populations) and geographic distances.

3. Results

3.1. Essential Oil Composition

In the essential oils (EOs) obtained from 100 individuals, 114 compounds were detected and identified, representing, on average, 98.1–99.4% of the total oil composition (Supplementary Table S1). The number of compounds per EO varied between 62 and 89. The chemical composition was dominated by monoterpenes (46.4–73.8%), followed by either sesquiterpenes or diterpenes, depending on the population. Oxygenated compounds were dominant in most of the studied populations, ranging between 50.7% in the population from Central Balkan and 79.3% in the Resava gorge population, with the exception of the population of Mt. Korab, where oxygenated compounds were present below 48%. The two most abundant compounds were sabinene and trans-sabinyl acetate, accounting for approximately 31.5–53.2% of the total oil content on average. Four compounds were also present in medium-to-high concentrations: (>5.0)—abieta-7,13-dien-3-one, 4-epi-abietal, trans-sabinol, and germacrene D-4-ol. Twelve other compounds were present, on average, in low-to-medium concentrations—α-pinene, myrcene, limonene, γ-terpinene, bornyl acetate, germacrene D, γ-cadinene, δ-cadinene, τ-muurolol, 1,10-di-epi-cubenol, α-cadinol, and abietadiene. All other compounds were present under 1%, primarily only in traces (<0.1%). While the concentration of sabinene and trans-sabinyl acetate reached high values in individual samples (e.g., 54.5% and 59.2%, respectively, in individual samples), most of the populations showed relatively similar concentrations of these two compounds or slight domination of one of the compounds. In populations from Mt. Velebit and Resava gorge, trans-sabinyl acetate was four and ten times more abundant than sabinene, respectively. On the other hand, in Mt. Korab and Central Balkan populations, sabinene was approximately three times more abundant than trans-sabinyl acetate.

3.2. Essential Oil Variability

Twenty-one compounds not-correlated (−0.7 > R < 0.7) and present above 0.1%, on average, were used for further statistical analyses, with the exception of the two most abundant compounds (R = −0.81, p < 0.01). The first two eigenvectors of the PCA explained 93.1% of the total variability. Three compounds were responsible for most of the separation: sabinene, trans-sabinyl acetate, and abieta-7,13-dien-3-one, separating individuals into three clusters (Supplementary Figure S1).
K-cluster analysis (K = 3) was performed, and the grouping of the individuals was checked against PCA scatter plot. Three obtained groups of similar size (cf. Table 2) correlated with the trimodal distributions of sabinene and trans-sabinyl acetate, while abieta-7,13-dien-3-one showed a slightly skewed normal (unimodal) distribution. These results suggested the existence of three possible chemotypes. To test the differences between these three putative chemotypes, a series of univariate and multivariate tests were performed. ANOVA showed separation in all 21 analysed compounds. The more conservative post hoc pairwise test (Tukey’s) showed a strong separation in all three putative chemotypes and only in the concentration of trans-sabinyl acetate, sabinene and cis-thujone, while on all other components, different pairs were formed (Table 2).
The separation of three chemotypes was confirmed with MANOVA (F = 34.0, p < 0.001), including the post hoc pairwise Hotelling’s test (p < 0.001) and Discriminant analysis (DA). The DA Scatter plot (Figure 3a) showed clear separation. The first eigenvector accounted for 84.4% of the total variability, strongly differentiating the sabinene (S) from the trans-sabinyl acetate (SA) chemotype. The separation of the SA chemotype and the intermediary chemotype (I) was more pronounced on the second axis, though most of the individuals could be separated on the first one as well.
The present analysis (PCA, not shown) did not show the correlation of individual samples’ EO composition with either location, geological substratum, region or sex. Additionally, individuals sampled in different years from the same population showed similar EO composition. The same was confirmed in MANOVA, with the exception of the populations. MANOVA was able to differentiate populations based on the EO profile (F = 13.12, p = 2.2 × 1099), while the post hoc Hotelling’s pairwise test differentiated most of the populations. The pairwise test was not able to separate Mt. Bistra and Mt. Biokovo (p > 0.05) on one side, nor Central Balkan, Mt. Korab and Mt. Velebit (p > 0.05), on the other (Supplemental Table S2). Discriminant analysis (Figure 3b) with populations as groups showed the formation of three clusters that differed somewhat from MANOVA: (1) Mt. Velebit and Resava gorge, (2) Central Balkan, Mt. Korab, Mt. Prokletije, and (3) Mt. Bistra and Mt. Biokovo. These results correspond with the mean values of sabinene and trans-sabinyl acetate for the studied populations. Hierarchical cluster analysis (Sq. Mahalanobis distances, UPGMA) (Figure 4) also confirmed the results of the DA. As the obtained cladogram did not correspond to the geographic distribution (Mantel test, R = −0.4, p > 0.05), the distribution of chemotypes across populations was also considered (Figure 2). The ratio of the three chemotypes influenced the mean population EO profile strongly, with populations from Mt. Biokovo and Mt. Bistra being the only populations with just two chemotypes detected.

3.3. Genetic Variability

Individuals from different populations that had different chemotypes were used in molecular analyses. The PCR amplification and sequencing yielded PCR products between 795 and 802 bp long. The obtained sequences were aligned with the NCBI accessions of both J. sabina var. sabina and J. sabina var. balkanensis (Table 3) and were trimmed before further analysis. Analysis of the obtained chloroplast intergenetic spacer trnG-trnS sequences showed that all of the tested individuals share SNPs and indels congruent with J. sabina var. balkanensis, irrespective of their chemical composition (Table 3).
Three individuals per population with different chemotypes were selected for ISSR analyses, 21 individuals in total. The number of products generated by ISSR primers ranged from three to six, ranging from 250 to 2000 bp. Primers JS17 and JS16 gave the most fragments (6), while JS3 had the least (3). These five primers generated a total of 24 fragments (Table 4). Each ISSR primer had an average of 4.4 polymorphic bands per assay unit. The percentage of polymorphism ranged from 66.7% for JS3 to 100% for JS17 and JS16. PIC values ranged from 0.195 for ISSR01 to 0.334 for ISSR17.
Analysis of molecular variance (AMOVA) showed that most of the genetic variability was within the populations (72.8%), whereas the rest was between populations (20.4%) and the three geographic regions (Table 5).
The principle coordinate analysis (PCoA) scatter plot showed the separation of most populations only on the second axis (Figure 5a). This was because, in all populations, one-third differed strongly from the rest of the populations. Nevertheless, the neighbour-joining (NJ) tree (Nei’s genetic distances) showed a grouping of populations based on the geographic distribution (Figure 5b). In the NJ cladogram, three groups can be distinguished: (1) populations from the Resava gorge and Central Balkan that belong to the same mountain range; (2) populations from the northern and central Dinaric mountains; and (3) Prokletije and Korab, two populations from the southern Dinaric mountains. Interestingly, the population from Mt. Bistra grouped with the Central Balkan populations, rather than the much closer Mt. Korab and Mt. Prokletije. In addition, with the exception of the Mt. Bistra population, a strong north-south grouping is apparent. The genetic distances were rather low, ranging between 0.079 and 0.340, further suggesting a close relationship between populations. Structure analysis could not separate gene pools, nor could it separate the populations, suggesting the same origin of all populations and/or the constant gene flow between these populations. The Mantel test did not show a correlation with the geographic region (R = 0.2, p > 0.05). This is most probably due to the populations from Mt. Bistra and Mt. Korab, which are geographically the closest populations, being very different.

3.4. Environmental Data

PCA analysis of 19 bioclimatic factors showed three groups of localities: (1) Mt. Korab; (2) Resava gorge & Central Balkan; and (3) all others based on the minimum temperatures of the coldest month and the mean temperature of the wettest quarter. Additionally, the localities Resava gorge and Central Balkan were the driest, with at least 20% less precipitation than the others. Linear correlation analysis (Pierson correlation) with the raw data did not show a correlation between any of the 21 EO components with the environmental factors, with the exception of terpinen-4-ol with the precipitation seasonality (R = 0.6, p < 0.01) and summer precipitation (R = −0.7, p < 0.01). However, when the mean population values were tested, several compounds strongly correlated with the environmental factors (Supplemental Table S3). The concentration of the dominant compounds sabinene and trans-sabinyl acetate did not correlate with any environmental parameter. Some compounds, such as trans-sabinol, positively correlated only with the inclination, i.e., the steeper the locality, the more abundant the trans-sabinol, on average, in the population. Limonene, trans-thujone, citronellol, methyl citronellate, bornyl acetate, and β-oplopenone correlated negatively with the temperature parameters (i.e., the higher the temperature, the less abundant these compounds were). Additionally, terpinen-4-ol, citronellol and methyl citronellate were also positively correlated with the precipitation parameters (i.e., the higher the precipitation, the more abundant these compounds were). While some compounds were correlated with the environmental parameters, there is no evidence that the distribution of chemotypes (i.e., concentration of dominant compounds) is related to the tested environmental factors. This was also confirmed by both the Mantel test (R = 0.2, p > 0.05) and partial Mantel test (R = 0.3, p > 0.05).

4. Discussion

Analysis of EOs from 100 individuals from seven populations showed high variability in the EO composition between individuals from the same population that grow only a few meters apart, which corroborates the chemophenetic significance of EOs. This also suggests that the environment does not strongy influence EO composition, as different chemotypes could be detected on the same substratum, growing under the same conditions. Statistical analysis confirmed strong and statistically significant negative correlation of sabinene and trans-sabinyl acetate, thus confirming the hypothesis of their biosynthethic connection. Three chemotypes were detected in the studied populations. Our data correspond to the available literature data (Table 6). Previous reports show that sabinene was the dominant compound in most of the populations. However, trans-sabynil acetate was dominant in the populations from Canada, Switzerland, and Iran. Only in one sample, from Bulgaria, was myrtenyl acetate the dominant compound [9]. Our population from Bulgaria was very similar to those EOs obtained by Zheljazkov et al. [9]. Aside from the dominant compounds, the overall relatively high variability of the EO corresponds to the literature data.
In the present analysis, three chemotypes were more-or-less equally distributed in the sample; however, the distribution of chemotypes differed between populations. In the populations from Mt. Bistra and Mt. Biokovo, trans-sabinyl acetate chemotype was not detected. While in the case of Mt. Biokovo, this could be due to a sampling artefact (
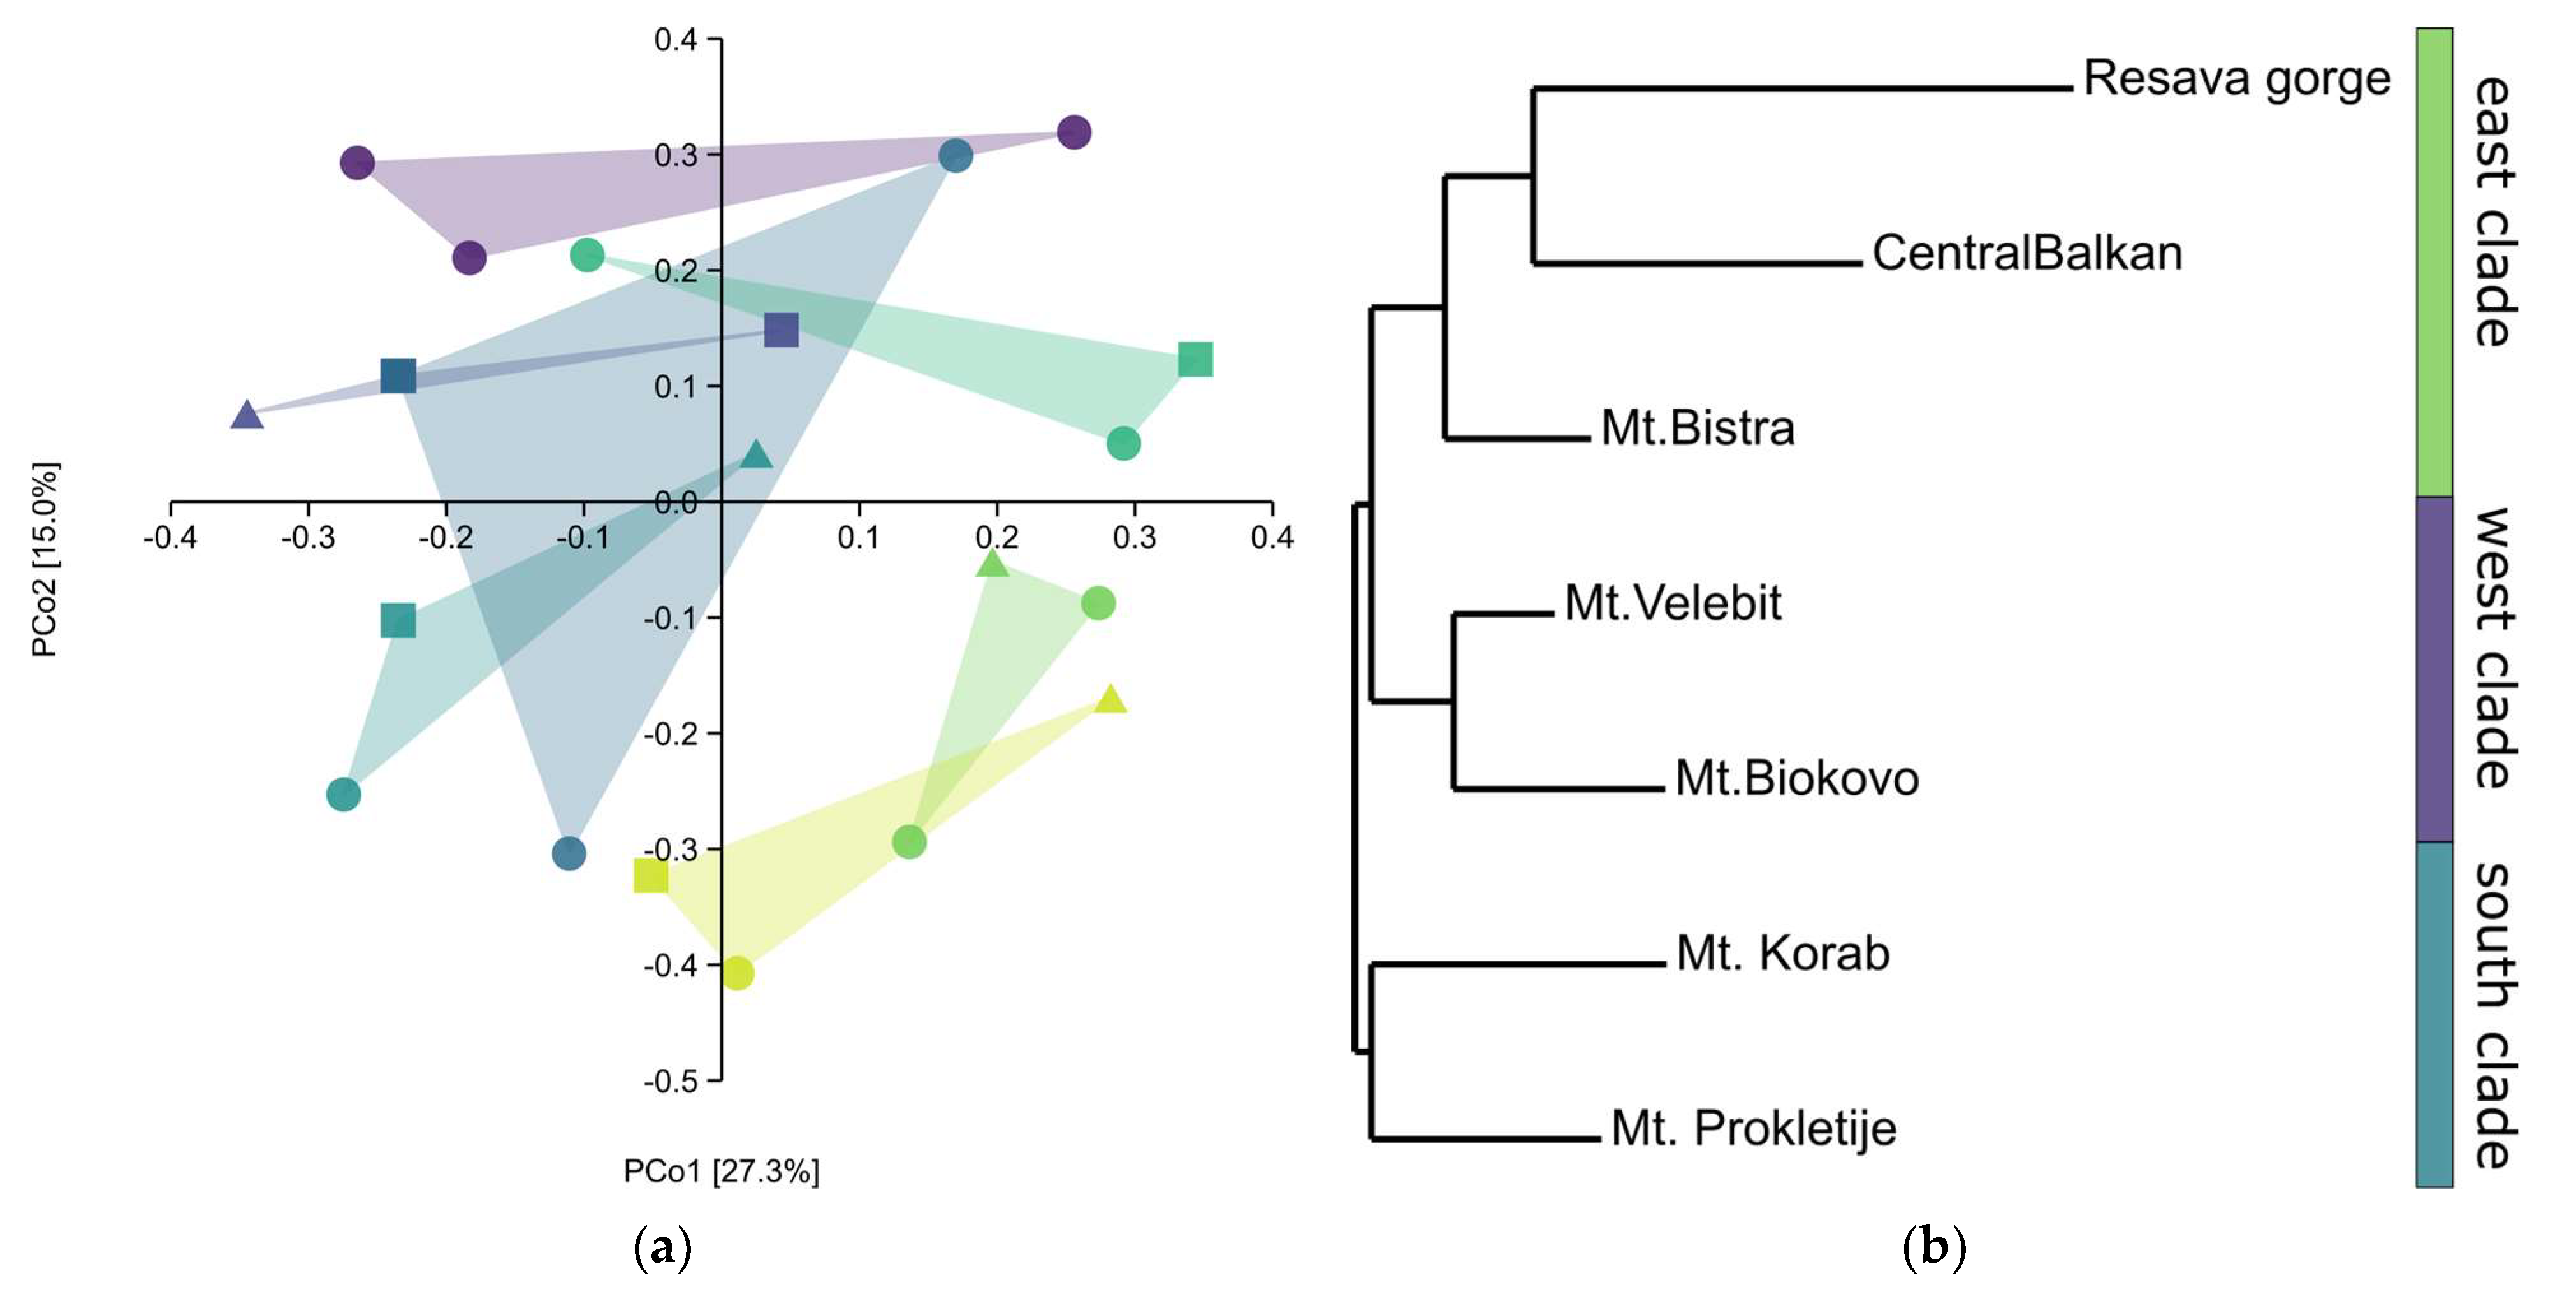
n = 5), this cannot be the case with the Mt. Bistra population, particularly considering the almost equal distribution of chemotypes in the whole sample. Additionally, ISSRs show that Mt. Bistra has more-or-less the same genetic diversity as most of other populations (Figure 5a). In the model, a single gene is crucial for the transformation of sabinene into trans-sabinyl acetate; it follows classic Mendelian dominant/recessive inheritance that the amount of these compounds would correspond to the number of alleles present in the genotype. However, isolation of the enzymes responsible for biosynthesis and the identification of the genes are necessary to confirm this. Previous reports on Juniperus deltoides, J. communis var. communis and J. communis var. saxatilis show different distributions of chemotypes across the Balkans [18,19,21,22]. In J. deltoides, the limonene chemotype was more common in coastal populations, while α-pinene was more common in the continental populations [21]. A similar pattern was observed in the two varieties of J. communis where five different chemotypes were detected [18,19]. In. J. communis var. communis, several chemotypes were detected in the literature [19,51,52,53,54], which showed different abundances related to the geographic distribution. While the distribution range of J. communis var. communis and J. deltoides is somewhat continuous in this region, J. communis var. saxatilis has a more fragmented distribution, as it grows above the tree line in high mountains. Nevertheless, in this taxon, the geographic distribution of chemotypes was also apparent, where δ-3-carene chemotype was most common in the areas with greater precipitation, and α-pinene and sabinene were more frequent in the more arid areas of the Balkans. In this research, the sabinene chemotype was more common in the areas with lower temperatures [18]. On the other hand, in more closely related species (J. phoenicea var. turbinata), EO was strongly dominated by a single compound (α-pinene), although several other compounds were present in higher concentrations (e.g., δ-3-carene, caryophyllene oxide, germacrene D, limonene and myrcene). No apparent pattern was noticed in the geographic distribution [20 and refs. cited therein].
The detected genetic variability was on par with the available literature data. To the best of our knowledge, ISSRs have never previously been used in J. sabina. However, Boogat et Salehi [28] used 12 ISSR primers to analyse five populations of Juniperus polycarpos, obtaining PIC values between 0.38 and 0.5, which was higher than our results. Since ISSRs are dominant genetic markers, their highest PIC value cannot be greater than 0.5; therefore, the obtained PIC values suggest that selected ISSRs were moderately informative in our study. J. sabina genetic diversity was previously studied using SSRs and RAPDs [2,55]. For SSRs, authors obtained PIC values between 0.179 and 0.751. ISSRs were used to study the genetic diversity and differentiation of populations of J. polycarpos, J. brevifolia, J. phoenicea, J. chinenesis, and J. excelsa [28,30,56,57,58]. In all of these studies, ISSRs showed a high number of polymorphic bands. Most of the studies of different junipers, however, relied on the SSRs [2,56,59,60,61,62,63,64] or AFLPs [18,65,66,67,68,69], which have shown to have high correlation with the ISSRs [56]. Furthermore, studies performed by several authors showed high correlation of SSRs and ISSRs with other genetic markers [58,60,70].
Juniperus sabina from Asia showed that 88% of variability lies within populations, while only 12% exists between populations [2]. These results are somewhat lower than ours, particularly when taking the area of study into consideration. Bettencourt et al. [56] showed that ISSRs tend to have a lower population variability than SSRs. Similar results of genetic diversity were obtained for other junipers, where intrapopulation variability accounted of between 50.9% in J. communis [69] and 98% in J. oxycedrus [71], depending on both the geographic area analysed and the species. However, in most cases, the population variability was around 90% [18,56,59,61,62,63,66,68]. Conifers, and juniper among them, tend to show high genetic diversity within populations, and low separation of populations and regions. This can be explained by the biology of conifers. Junipers are long living species, the seeds of which are dispersed by birds, and the pollen is carried by wind. As one can see from the widely available data, genetic distances between populations in junipers are usually low, even when the distribution is fragmented and populations live at great distances.
Both ISSRs and EOs showed high intrapopulation variability with moderate separation of populations. Additionally, both sets of markers did not show a correlation with the geographic region, according to the Mantel test. However, the grouping of the populations differed widely, and no correlation was found between genetic and phenotypic markers. Molecular markers showed that populations from the same mountain ranges were grouped closely together. The only exception was the population from Mt. Bistra, which grouped with the east clade, rather than the south. This could be due to the different origins of these two populations, with the population from Mt. Bistra coming from the east, rather than from Albania and Montenegro, but this could also be due to the low sample size in the present study and the high genetic diversity within this taxon. Additionally, the present genetic pattern could also be explained by the distribution of this taxon during Pleistocene. Savin juniper grows in very arid areas, where there is no competition from other trees and woody species. As pollen cannot be used in the reconstruction of savin juniper’s historic distribution, a precise distribution range cannot be reconstructed. Nevertheless, based on the biology of the species, one can assume that the areas suitable for this taxon were more abundant during the Pleistocene in the Balkans. The genetic data suggest the possibility of two refugia, although further studies are necessary to test this. The EO composition showed different groups than the molecular data, which were not geographically correlated. For example, populations from Mt. Biokovo and Mt. Bistra were grouped close to each other, as well as the populations from Mt. Velebit and Resavska gorge. The chemical composition of the leaf essential oils and the distribution of the chemotypes were not correlated with the environmental data and geological substratum, suggesting that other ecological factors might be at play, e.g., selection due to herbivory. The high genetic diversity detected in the studied populations suggests that the sexual reproduction is more prevalent than the vegetative, with the exception of the population from Resavska gorge, which had the lowest genetic diversity of the studied populations, indicating that this population might have gone through a genetic bottleneck.

5. Conclusions

A comprehensive survey of the diversity of endemic Juniperus sabina var. balkanensis from its range showed high genetic diversity, as indicated by both the molecular and phytochemical markers. The molecular markers suggest some slight separation of the populations in three regions, high genetic diversity, and quite possibly, strong genetic flow between populations. The high genetic variability also indicates that, in most populations, clonal reproduction is not common. On the other hand, the leaf essential oil showed the separation of populations based on the distribution of chemotypes, although no correlation with geographic, environmental and genetic parameters was found. However, the essential oil composition corroborated the biosynthetic link between sabinene and trans-sabinyl acetate. A more detailed population study using multiple genetic markers is necessary to fully describe and understand the genetic diversity within this taxon, particularly taking into consideration the loss of natural habitats due to the succession of vegetation and decrease in domestic grazing.

Supplementary Materials

The following supporting information can be downloaded at: https://0-www-mdpi-com.brum.beds.ac.uk/article/10.3390/d14121062/s1, Figure S1: PCA scatter plot of leaf essential oil composition of Juniperus sabina var. balkanensis; Table S1: Chemical composition of leaf essential oil of analysed Junuperus sabina var. balkanensis from the Balkans; Table S2: Pairwise Hotelling’s p values between EO composition of the studied populations of Juniperus sabina var. balkanensis from the Balkans; Table S3: Simple correlation between environmental factors and mean essential oil components.

Author Contributions

Conceptualization, N.R. and P.D.M.; Formal analysis, N.R.; Funding acquisition, P.D.M.; Investigation, N.R., T.D., S.J., P.J., V.D.Z. and P.D.M.; Methodology, T.D.; Visualization, N.R.; Writing—original draft, N.R.; Writing—review & editing, T.D., S.J., P.J., V.D.Z. and P.D.M. All authors have read and agreed to the published version of the manuscript.

Funding

This research was funded by the Ministry of Education, Science and Technological Development of Republic of Serbia (grant number 451-03-68/2022-14/200113).

Institutional Review Board Statement

Not applicable.

Informed Consent Statement

Not applicable.

Data Availability Statement

Not applicable.

Conflicts of Interest

The authors declare no conflict of interest.

References

  1. WFO. Juniperus sabina L. Published on the Internet. Available online: http://www.worldfloraonline.org/taxon/wfo-0000354994 (accessed on 21 November 2022).
  2. Lu, D.; Huang, H.; Wang, A.; Zhang, G. Genetic Evaluation of Juniperus sabina L. (Cupressaceae) in Arid and Semi-Arid Regions of China Based on SSR Markers. Forests 2022, 13, 231. [Google Scholar] [CrossRef]
  3. Adams, R.P.; Schwarzbach, A.E. Chloroplast capture in Juniperus sabina var. balkanensis RP Adams and AN Tashev, from the Balkan peninsula: A new variety with a history of hybridization with J. thurifera. Phytologia 2016, 98, 100–111. [Google Scholar]
  4. Farhat, P.; Siljak-Yakovlev, S.; Adams, R.P.; Bou Dagher Kharrat, M.; Robert, T. Genome size variation and polyploidy in the geographical range of Juniperus sabina L. (Cupressaceae). Bot. Lett. 2019, 166, 134–143. [Google Scholar] [CrossRef]
  5. Adams, R.P.; Farhat, P.; Shuka, L.; Siljak-Yakovlev, S. Discovery of Juniperus sabina var. balkanensis RP Adams and AN Tashev in Albania and relictual polymorphisms found in nrDNA. Phytologia 2018, 100, 187–194. [Google Scholar]
  6. Adams, R.P.; Boratynski, A.; Marcysiak, K.; Roma-Marzio, F.; Peruzzi, L.; Bartolucci, F.; Conti, F.; Mataraci, T.; Schwarzbach, A.E. Discovery of Juniperus sabina var. balkanensis RP Adams and AN Tashev in Macedonia, Bosnia-Herzegovina, Croatia and Central and Southern Italy and relictual polymorphisms found in nrDNA. Phytologia 2018, 100, 117–127. [Google Scholar]
  7. Adams, R.P.; Boratynski, A.; Mataraci, T.; Tashev, A.N.; Schwarzbach, A.E. Discovery of Juniperus sabina var. balkanensis R. P. Adams and A. N. Tashev in western Turkey (Anatolia). Phytologia 2017, 99, 22–31. [Google Scholar]
  8. Semerdjieva, I.B.; Shiwakoti, S.; Cantrell, C.L.; Zheljazkov, V.D.; Astatkie, T.; Schlegel, V.; Radoukova, T. Hydrodistillation Extraction Kinetics Regression Models for Essential Oil Yield and Composition in Juniperus virginiana, J. excelsa, and J. sabina. Molecules 2019, 24, 986. [Google Scholar] [CrossRef] [Green Version]
  9. Zheljazkov, V.D.; Cantrell, C.L.; Semerdjieva, I.; Radoukova, T.; Stoyanova, A.; Maneva, V.; Kačániová, M.; Astatkie, T.; Borisova, D.; Dincheva, I.; et al. Essential Oil Composition and Bioactivity of Two Juniper Species from Bulgaria and Slovakia. Molecules 2021, 26, 3659. [Google Scholar] [CrossRef]
  10. Farhat, P.; Siljak-Yakovlev, S.; Valentin, N.; Fabregat, C.; Lopez-Udias, S.; Salazar-Mendias, C.; Altarejos, J.; Adams, R.P. Gene flow between diploid and tetraploid junipers—Two contrasting evolutionary pathways in two Juniperus populations. BMC Evol. Biol. 2020, 20, 148. [Google Scholar] [CrossRef]
  11. Farhat, P.; Takvorian, N.; Avramidou, M.; Garraud, L.; Adams, R.P.; Siljak-Yakovlev, S.; Kharrat, M.B.D.; Robert, T. First evidence for allotriploid hybrids between Juniperus thurifera and J. sabina in a sympatric area in the French Alps. Ann. For. Sci. 2020, 77, 93. [Google Scholar] [CrossRef]
  12. Abdel-Kader, M.S.; Soliman, G.A.; Alqarni, M.H.; Hamad, A.M.; Foudah, A.I.; Alqasoumi, S.I. Chemical composition and protective effect of Juniperus sabina L. essential oil against CCl4 induced hepatotoxicity. Saudi Pharm. J. 2019, 27, 945–951. [Google Scholar] [CrossRef] [PubMed]
  13. Khani, A.; Rashid, B.; Mirshekar, A. Chemical composition and insecticidal efficacy of Juniperus polycarpus and Juniperus sabina essential oils against Tribolium confusum (Coleoptera: Tenebrionidae). Int. J. Food Prop. 2017, 20, 1221–1229. [Google Scholar] [CrossRef] [Green Version]
  14. Asgary, S.; Sahebkar, A.; Naderi, G.A.; Ardekani, M.R.S.; Kasher, T.; Aslani, S.; Airin, A.; Emami, S.A. Essential oils from the fruits and leaves of Juniperus sabina possess inhibitory activity against protein glycation and oxidative stress: An in vitro phytochemical investigation. J. Essent. Oil Res. 2013, 25, 70–77. [Google Scholar] [CrossRef]
  15. Doosti, F.; Bagherpasand, N.; Zolfagharian, F.; Sarabandi, S.; Emami, S.; Khayyat, H. Investigation of antioxidant activity of the essential oils of different parts of Juniperus sabina (Cupressaceae) by TBARS method in comparison with vitamin E. Res. Pharm. Sci. 2012, 7, 798. [Google Scholar]
  16. Asili, J.; Emami, S.A.; Rahimizadeh, M.; Fazly-Bazzaz, B.S.; Hassanzadeh, M.K. Chemical and Antimicrobial Studies of Juniperus sabina L. and Juniperus foetidissima Willd. Essential Oils. J. Essent. Oil Bear. Plants 2010, 13, 25–36. [Google Scholar] [CrossRef]
  17. Emami, S.A.; Shahidi, N.H.; Hassanzadeh-Khayyat, M. Antioxidant activity of the essential oils of different parts of Juniperus sabina L. and Juniperus foetidissima Willd (Cupressaceae). Int. J. Essent. Oil Ther. 2009, 3, 163–170. [Google Scholar]
  18. Rajčević, N.; Dodoš, T.; Novaković, J.; Kuzmanović, N.; Janaćković, P.; Marin, P. Are Environmental Factors Responsible for Essential Oil Chemotype Distribution of Balkan Juniperus communis var. saxatilis Populations? Plant Biosyst. 2022, 1–19. [Google Scholar] [CrossRef]
  19. Rajčević, N.; Dodoš, T.; Novaković, J.; Boršić, I.; Janaćković, P.; Marin, P.D. Differentiation of North-Western Balkan Juniperus communis L. (Cupressaceae) populations—Ecological and chemophenetic implications. J. Essent. Oil Res. 2020, 32, 562–570. [Google Scholar] [CrossRef]
  20. Rajčević, N.F.; Labus, M.G.; Dodoš, T.Z.; Novaković, J.J.; Marin, P.D. Juniperus phoenicea var. turbinata (Guss.) Parl. Leaf Essential Oil Variability in the Balkans. Chem. Biodivers. 2018, 15, e1800208. [Google Scholar]
  21. Rajčević, N.; Janaćković, P.; Dodoš, T.; Tešević, V.; Marin, P.D. Essential-Oil Variability of Juniperus deltoides RP Adams along the East Adriatic Coast–How Many Chemotypes Are There? Chem. Biodivers. 2015, 12, 82–95. [Google Scholar] [CrossRef]
  22. Rajčević, N.; Janaćković, P.; Bojović, S.; Tešević, V.; Marin, P.D. Variability of the Needle Essential Oils of Juniperus deltoides RP Adams from Different Populations in Serbia and Croatia. Chem. Biodivers. 2013, 10, 144–156. [Google Scholar] [CrossRef] [PubMed]
  23. Wise, M.L.; Croteau, R. Monoterpene Biosynthesis. In Comprehensive Natural Products Chemistry; Elsevier: Amsterdam, The Netherlands, 1999; pp. 97–153. ISBN 978-0-08-091283-7. [Google Scholar]
  24. Kshatriya, K. Thujone Biosynthesis in Western Redcedar (Thuja plicata). Ph.D. Thesis, The University of British Columbia, Vancouver, BC, Canada, 2017. [Google Scholar]
  25. Wise, M.L.; Croteau, R. 2.05 Monoterpene Biosynthesis. In Comprehensive Natural Products Chemistry; Elsevier Science: Amsterdam, The Netherlands, 1999; pp. 57–93. ISBN 978-0-08-091283-7. [Google Scholar]
  26. Usman, L.A.; Oguntoye, O.S.; Ismaeel, R.O. Phytochemical Profile, Antioxidant and Antidiabetic Potential of Essential Oil From Fresh and Dried Leaves of Eucalyptus globulus. J. Chil. Chem. Soc. 2022, 67, 5453–5461. [Google Scholar] [CrossRef]
  27. Sabreena; Nazir, M.; Mahajan, R.; Hashim, M.J.; Iqbal, J.; Alyemeni, M.N.; Ganai, B.A.; Zargar, S.M. Deciphering allelic variability and population structure in buckwheat: An analogy between the efficiency of ISSR and SSR markers. Saudi J. Biol. Sci. 2021, 28, 6050–6056. [Google Scholar] [CrossRef] [PubMed]
  28. Boogar, A.R.; Salehi, H. ISSR-based genetic diversity assessment of five populations of Juniperus polycarpos K. Koch in southern habitats of Iran. Flower Ornam. Plants 2021, 5, 139–150. [Google Scholar]
  29. Hadian, J.; Raeisi, S.; Azizi, A.; Pezhmanmehr, M.; Sarkhosh, A. Genetic diversity of natural populations of medicinally valuable plant Satureja khuzistanica Jamzad based on ISSR markers. Braz. J. Bot. 2017, 40, 771–781. [Google Scholar] [CrossRef]
  30. Meloni, M.; Perini, D.; Filigheddu, R.; Binelli, G. Genetic variation in five Mediterranean populations of Juniperus phoenicea as revealed by inter-simple sequence repeat (ISSR) markers. Ann. Bot. 2006, 97, 299–304. [Google Scholar] [CrossRef] [Green Version]
  31. Adams, R.P. Junipers of the World: The Genus Juniperus; Trafford Publishing: Bloomington, IN, USA, 2011; ISBN 1-4269-5382-8. [Google Scholar]
  32. Barkworth, M.E.; Adams, R.P. Juniperus. In Flora of North America: Volume 2: Pteridophytes and Gymnosperms; Morin, N.R., Ed.; Oxford University Press: New York, NY, USA, 1993; Volume 2, pp. 412–420. ISBN 0-19-508242-7. [Google Scholar]
  33. Chaintreau, A. Simultaneous distillation–extraction: From birth to maturity—Review. Flavour Fragr. J. 2001, 16, 136–148. [Google Scholar] [CrossRef]
  34. Adams, R.P.; Schwarzbach, A.E. Taxonomy of Juniperus deppeana varieties and formas based on nrDNA (ITS), petN-psbM, trnS-trnG, trnD-trnT, trnL-trnF sequences. Phytologia 2013, 95, 161–166. [Google Scholar]
  35. Kumar, S.; Stecher, G.; Li, M.; Knyaz, C.; Tamura, K. MEGA X: Molecular evolutionary genetics analysis across computing platforms. Mol. Biol. Evol. 2018, 35, 1547. [Google Scholar] [CrossRef]
  36. Fick, S.E.; Hijmans, R.J. WorldClim 2: New 1-km spatial resolution climate surfaces for global land areas. Int. J. Climatol. 2017, 37, 4302–4315. [Google Scholar] [CrossRef]
  37. Asch, K. IGME 5000: 1: 5 Million International Geological Map of Europe and Adjacent Areas; BGR: Hannover, Germany, 2005. [Google Scholar]
  38. Hammer, Ø.; Harper, D.A.T.; Ryan, P.D. PAST: Paleontological statistics software package for education and data analysis. Palaeontol Electron. 2001, 4, 9. [Google Scholar]
  39. Roldan-Ruiz, I.; Dendauw, J.; Van Bockstaele, E.; Depicker, A.; De Loose, M. AFLP markers reveal high polymorphic rates in ryegrasses (Lolium spp.). Mol. Breed. 2000, 6, 125–134. [Google Scholar] [CrossRef]
  40. Meirmans, P.G. Genodive version 3.0: Easy-to-use software for the analysis of genetic data of diploids and polyploids. Mol. Ecol. Resour. 2020, 20, 1126–1131. [Google Scholar] [CrossRef] [PubMed] [Green Version]
  41. Ronfort, J.; Jenczewski, E.; Bataillon, T.; Rousset, F. Analysis of population structure in autotetraploid species. Genetics 1998, 150, 921–930. [Google Scholar] [CrossRef]
  42. Meirmans, P.G.; Liu, S. Analysis of molecular variance (AMOVA) for autopolyploids. Front. Ecol. Evol. 2018, 6, 66. [Google Scholar] [CrossRef] [Green Version]
  43. Pritchard, J.K.; Stephens, M.; Donnelly, P. Inference of population structure using multilocus genotype data. Genetics 2000, 155, 945–959. [Google Scholar] [CrossRef]
  44. Evanno, G.; Regnaut, S.; Goudet, J. Detecting the number of clusters of individuals using the software STRUCTURE: A simulation study. Mol. Ecol. 2005, 14, 2611–2620. [Google Scholar] [CrossRef] [Green Version]
  45. Peakall, R.; Smouse, P.E. GENALEX 6: Genetic analysis in Excel. Population genetic software for teaching and research. Mol. Ecol. Notes 2006, 6, 288–295. [Google Scholar] [CrossRef]
  46. Rudloff, E.V. Gas-liquid chromatography of terpenes: Part IX. The volatile oil of the leaves of Juniperus sabina L. Can. J. Chem. 1963, 41, 2876–2881. [Google Scholar] [CrossRef]
  47. Adams, R.P.; Nguyen, S.; Liu, J. Geographic Variation in the Leaf Essential Oils of Juniperus sabina L. and J. sabina var. arenaria (E.H. Wilson) Farjon. J. Essent. Oil Res. 2006, 18, 497–502. [Google Scholar] [CrossRef]
  48. Adams, R.P. Systematics of multi-seeded eastern hemisphere Juniperus based on leaf essential oils and RAPD DNA fingerprinting. Biochem. Syst. Ecol. 1999, 27, 709–725. [Google Scholar] [CrossRef]
  49. Adams, R.P.; Dembitsky, A.D.; Shatar, S. The Leaf Essential Oils and Taxonomy of Juniperus centrasiatica Kom., J. jarkendensis Kom., J. pseudosabina Fisch., Mey. & Ave-Lall., J. sabina L. and J. turkestanica Kom. from Central Asia. J. Essent. Oil Res. 1998, 10, 489–496. [Google Scholar]
  50. Adams, R.P.; Schwarzbach, A.E. The multi-seeded, entire leaf taxa of Juniperus, section Sabina: Inclusion of Juniperus microsperma. Phytologia 2013, 95, 118–121. [Google Scholar]
  51. Chatzopoulou, P.S.; Katsiotis, S.T. Chemical Investigation of Juniperus communis L. J. Essent. Oil Res. 1993, 5, 603–607. [Google Scholar] [CrossRef]
  52. Caramiello, R.; Bocco, A.; Buffa, G.; Maffei, M. Chemotaxonomy of Juniperus communis, J. sibirica and J. intermedia. J. Essent. Oil Res. 1995, 7, 133–145. [Google Scholar] [CrossRef]
  53. Markó, G.; Novák, I.; Bernáth, J.; Altbäcker, V. Both Gas Chromatography and an Electronic Nose Reflect Chemical Polymorphism of Juniper Shrubs Browsed or Avoided by Sheep. J. Chem. Ecol. 2011, 37, 705–713. [Google Scholar] [CrossRef]
  54. Ottavioli, J.; Bighelli, A.; Casanova, J.; Tomi, F. Composition and Chemical Variability of Needle and Berry Oils from Corsican Juniperus communis var. communis. Nat. Prod. Commun. 2018, 13, 1043–1046. [Google Scholar] [CrossRef] [Green Version]
  55. Adams, R.P. The serrate leaf margined Juniperus (Section Sabina) of the western hemisphere: Systematics and evolution based on leaf essential oils and Random Amplified Polymorphic DNAs (RAPDs). Biochem. Syst. Ecol. 2000, 28, 975–989. [Google Scholar] [CrossRef]
  56. Bettencourt, S.X.; Mendonça, D.; Lopes, M.S.; Rocha, S.; Monjardino, P.; Monteiro, L.; da Câmara Machado, A. Genetic diversity and population structure of the endemic Azorean juniper, Juniperus brevifolia (Seub.) Antoine, inferred from SSRs and ISSR markers. Biochem. Syst. Ecol. 2015, 59, 314–324. [Google Scholar] [CrossRef]
  57. Kim, E.-H.; Shin, J.-K.; Jeong, K.-S.; Lee, C.-S.; Chung, J.-M. Genetic variation and structure of Juniperus chinensis L. (Cupressaceae) in Korea. J. Ecol. Environ. 2018, 42, 14. [Google Scholar] [CrossRef] [Green Version]
  58. Saeed, S.; Barozai, M.Y.K.; Ahmed, A.; Tareen, R.B.; Ali, S.B.G.M. Impact of ecological diversity on genetic and phytochemical variation in Juniperus excelsa from high elevation zones of Quetta valley, Pakistan. Pak. J. Bot. 2017, 49, 201–206. [Google Scholar]
  59. Reim, S.; Lochschmidt, F.; Proft, A.; Tröber, U.; Wolf, H. Genetic structure and diversity in Juniperus communis populations in Saxony, Germany. Biodivers. Res. Conserv. 2016, 42, 9–18. [Google Scholar] [CrossRef] [Green Version]
  60. García, C.; Guichoux, E.; Hampe, A. A comparative analysis between SNPs and SSRs to investigate genetic variation in a juniper species (Juniperus phoenicea ssp. turbinata). Tree Genet. Genomes 2018, 14, 87. [Google Scholar] [CrossRef]
  61. Teixeira, H.; Rodríguez-Echeverría, S.; Nabais, C. Genetic Diversity and Differentiation of Juniperus thurifera in Spain and Morocco as Determined by SSR. PLoS ONE 2014, 9, e88996. [Google Scholar] [CrossRef] [PubMed] [Green Version]
  62. Sobierajska, K.; Boratyńska, K.; Jasińska, A.; Dering, M.; Ok, T.; Douaihy, B.; Bou Dagher-Kharrat, M.; Romo, Á.; Boratyński, A. Effect of the Aegean Sea barrier between Europe and Asia on differentiation in Juniperus drupacea (Cupressaceae). Bot. J. Linn. Soc. 2016, 180, 365–385. [Google Scholar] [CrossRef] [Green Version]
  63. Taib, A.; Morsli, A.; Chojnacka, A.; Walas, Ł.; Sękiewicz, K.; Boratyński, A.; Romo, À.; Dering, M. Patterns of genetic diversity in North Africa: Moroccan-Algerian genetic split in Juniperus thurifera subsp. africana. Sci. Rep. 2020, 10, 4810. [Google Scholar] [CrossRef] [Green Version]
  64. Rumeu, B.; Sosa, P.A.; Nogales, M.; González-Pérez, M.A. Development and characterization of 13 SSR markers for an endangered insular juniper (Juniperus cedrus Webb & Berth.). Conserv. Genet. Resour. 2013, 5, 457–459. [Google Scholar]
  65. Rumeu, B.; Vargas, P.; Jaén-Molina, R.; Nogales, M.; Caujapé-Castells, J. Phylogeography and genetic structure of the threatened Canarian Juniperus cedrus (Cupressaceae): Phylogeography of Macaronesian juniper. Bot. J. Linn. Soc. 2014, 175, 376–394. [Google Scholar] [CrossRef] [Green Version]
  66. Jimenez, J.F.; Sánchez-Gómez, P.; Cánovas, J.L.; Hensen, I.; Aouissat, M. Influence of natural habitat fragmentation on the genetic structure of Canarian populations of Juniperus turbinata. Silva Fenn. 2017, 51, 1678. [Google Scholar] [CrossRef]
  67. Juan, A.; Fay, M.F.; Pastor, J.; Juan, R.; Fernández, I.; Crespo, M.B. Genetic structure and phylogeography in Juniperus oxycedrus subsp. macrocarpa around the Mediterranean and Atlantic coasts of the Iberian Peninsula, based on AFLP and plastid markers. Eur. J. For. Res. 2012, 131, 845–856. [Google Scholar] [CrossRef]
  68. Dzialuk, A.; Mazur, M.; Boratyńska, K.; Montserrat, J.M.; Romo, A.; Boratyński, A. Population genetic structure of Juniperus phoenicea (Cupressaceae) in the western Mediterranean Basin: Gradient of diversity on a broad geographical scale. Ann. For. Sci. 2011, 68, 1341–1350. [Google Scholar] [CrossRef] [Green Version]
  69. Michalczyk, I.M.; Opgenoorth, L.; Luecke, Y.; Huck, S.; Ziegenhagen, B. Genetic support for perglacial survival of Juniperus communis L. in Central Europe. Holocene 2010, 20, 887–894. [Google Scholar] [CrossRef]
  70. Adams, R.P.; Schwarzbach, A.E.; Pandey, R.N. The concordance of terpenoid, ISSR and RAPD markers, and ITS sequence data sets among genotypes: An example from Juniperus. Biochem. Syst. Ecol. 2003, 31, 375–387. [Google Scholar] [CrossRef]
  71. Curto, M.; Nogueira, M.; Beja, P.; Amorim, F.; Schümann, M.; Meimberg, H. Influence of past agricultural fragmentation to the genetic structure of Juniperus oxycedrus in a Mediterranean landscape. Tree Genet. Genomes 2015, 11, 32. [Google Scholar] [CrossRef]
Figure 1. Biosynthetic pathway for the most common savin juniper terpenoids, adapted from [26].
Diversity 14 01062 g001
Figure 2. Spatial distribution of analysed populations of Juniperus sabina var. balkanensis; for population details, cf. Table 1.
Diversity 14 01062 g002
Figure 3. Discriminant analysis scatter plot of leaf essential oil composition of Juniperus sabina var. balkanensis; (a) putative chemotypes as groups; symbols correspond to different chemotypes, while dots with same colour belong to same population; (b) populations as groups. Diversity 14 01062 i001—Central Balkan, Diversity 14 01062 i002—Resava gorge, Diversity 14 01062 i003—Mt. Bistra, Diversity 14 01062 i004—Mt. Korab, Diversity 14 01062 i005—Mt. Prokletije, Diversity 14 01062 i006—Mt. Biokovo, Diversity 14 01062 i007—Mt. Velebit. Principle components given in the left-hand side corner: S—Sabinene, SA—trans-Sabinyl acetate, So—trans-Sabinol, T—terpinen-4-ol, A—Abieta-7,13-dien-3-one.
Diversity 14 01062 g003
Figure 4. Dendrogram (UPGMA, Sq. Mahalanobis’ Distances); right hand side shows distribution of chemotypes in populations; SA—trans-Sabinyl chemotype; I—Intermediate chemotype; S—Sabinene chemotype.
Diversity 14 01062 g004
Figure 5. (a) PCoA scatter plot (Jaccard’s distances), Diversity 14 01062 i001—Central Balkan, Diversity 14 01062 i002—Resava gorge, Diversity 14 01062 i003—Mt. Bistra, Diversity 14 01062 i004—Mt. Korab, Diversity 14 01062 i005—Mt. Prokletije, Diversity 14 01062 i006—Mt. Biokovo, Diversity 14 01062 i007—Mt. Velebit; triangles —sabinene chemotype, squares—intermediate chemotype, dots—trans-sabinyl acetate chemotype; (b) NJ tree, Nei’s genetic distances.
Diversity 14 01062 g005
Table 1. Geographic distribution of studied Juniperus sabina L. var. balkanensis R.P.Adams & Tachev populations from the Balkans.
LocationCountryLongitudeLatitudeAltitudeIncl. 1Exp. 2S 3BEOU
Mt. VelebitCroatia44.24515.810135035SWSa17213
Mt. BiokovoCroatia43.29917.07770030ELi17094
Mt. ProkletijeMontenegro42.51019.834130015SLi17409
Mt. KorabAlbania41.78620.546125045WLi17837
Mt. BistraNorth Macedonia41.59420.665145060SSi17838
Resava gorgeSerbia44.08521.68172065SWLi17209
Central BalkanBulgaria42.68825.123135025SESa17403
1 Inclination presented as difference in m.a.s.l on a 100 m line; 2 Exposition; 3 Geological substratum, Sa—sandstone, Li—limestone, Si—silicate.
Table 2. ANOVA of three detected chemotypes of leaf essential oil of Junuperus sabina var. balkanensis from the Balkans.
SAIS
CompoundFpn = 32n = 34n = 35
1α-Pinene10.38***1.2 ± 0.6 a1.7 ± 1.0 a2.1 ± 0.8
2Sabinene180.6***5.6 ± 5.411.0 ± 7.037.4 ± 9.2
3Myrcene19.6***1.2 ± 1.1 a1.7 ± 1.2 a2.8 ± 0.9
4Limonene8.8***0.6 ± 0.51.4 ± 1.2 a1.3 ± 0.8 a
5cis-Thujone18.6***1.5 ± 1.60.7 ± 0.50.1 ± 0.1
6trans-Thujone26.81***0.9 ± 0.5 a1.1 ± 0.9 a0.1 ± 0.2
7trans-Sabinol19.52***4.0 ± 3.7 a3.1 ± 2.6 a0.3 ± 0.4
8Terpinen-4-ol11.6***0.8 ± 0.32.6 ± 2.3 a3.6 ± 3.4 a
9Citronellol6.5***0.5 ± 0.7 a0.5 ± 0.6 a1.0 ± 0.8
10Methyl citronellate3.1***1.5 ± 1.6 a2.0 ± 1.7 ab2.5 ± 1.4 b
11Bornyl acetate6.9***0.2 ± 0.9 a2.4 ± 3.90.5 ± 1.9 a
12trans-Sabinyl acetate383.4***45.6 ± 6.724.6 ± 8.11.8 ± 4.0
13Germacrene D4.4***0.8 ± 0.6 ab0.6 ± 0.3 a1.1 ± 0.8 b
14γ-Cadinene6.177***0.4 ± 0.3 b1.2 ± 1.2 a0.8 ± 0.9 ab
15Elemol6.5***1.5 ± 1.60.5 ± 0.6 a0.7 ± 0.9 a
16Germacrene B4.6***0.4 ± 0.6 a0.6 ± 0.6 ab0.9 ± 0.9 b
17Germacrene D-4-ol6.1***4.1 ± 2.2 a3.9 ± 2.9 a5.9 ± 2.5
18β-Oplopenone2.051-0.9 ± 0.5 a0.7 ± 0.4 a0.9 ± 0.4 a
19α-Cadinol11.4***2.7 ± 1.0 a2.8 ± 1.2 a3.8 ± 0.8
20Abietadiene3.5***1.0 ± 0.5 a1.3 ± 0.7 ab1.5 ± 1.2 b
21Abieta-7,13-dien-3-one3.6***4.4 ± 3.6 b7.0 ± 5.7 a4.7 ± 3.4 ab
F—ANOVA F value; p Level of significance for ANOVA (*** p < 0.001); Contents are given as percentages (mean ± SD) of the total essential oil composition, means with the same superscript letters within the same row did not differ significantly (Tukey’s pairwise test).; SA—trans-sabinyl acetate chemotype; I—intermediate chemotype; S—sabinene chemotype. Compounds that significantly differed between all three chemotypes in post-hoc test are marked in boldface.
Table 3. SNPs and indels in chloropast trnG-trnS intergenetic spacer of Juniperus sabina var. balkanensis populations.
LT 1Position in AlignmentGenBank Accession Numbers
Ind.Chemotype7148460466..483664709752761
V1SA795GCG+ 2G-GAOP297053
B1S802GCG+G-GAOP297042
B4I802GCG+G-GAOP297043
P10SA798GCG+G-GAOP297049
P4I800GCG+G-GAOP297050
K3S802GCG+G-GAOP297046
K8SA802GCG+G-GAOP297047
M1-799GCG+G-GAOP297048
R1S802GCG+G-GAOP297051
R7SA798GCG+G-GAOP297052
C1S797GCG+G-GAOP297044
C8SA802GCG+G-GAOP297045
var. balkanensis 3-GCG+G-GAMT136665.1
var. sabina 3-ATT-AAATMT136634.1
Alignment length 781 bp; 1 Total readable length in bp; 2 indel: AAAAATAGAATACATAAA; 3 Sequences downloaded from NCBI; V—Mt. Velebit, B—Mt. Biokovo, P—Mt. Prokletije, K—Mt. Korab, M—Mt. Bistra, R—Resava gorge, C—Central Balkan; Chemotypes—SA—sabinene acetate, S—sabinene, I—intermediate.
Table 4. Marker parameters calculated for each ISSR primer used with Juniperus sabina var. balkanensis.
NamePrimer SequenceTm [°C]TBPBMB%PBPIC
JS 175′-TCC TCC TCC TCC TCC TCC-3′61.36601000.334
JS 015′-GAG AGA GAG AGA GAG AC-3′49431750.195
JS 165′-AGA GAG AGA GAG AGA GCC-3′53.86601000.227
JS 035′-CAC ACA CAC ACA CAC AG-3′5332166.70.311
JS 045′-AGC AGC AGC AGC GT-3′54.95501000.298
Total 2422288.30.273
Tm primer melting temperature; TB—total bands; PB—number of polymorphic bands; MB—number of monomorphic bands; %PB—percentage of polymorphic bands; PIC—polymorphic information content calculated according to Roldan-Ruiz et al., 2000 [39].
Table 5. Analysis of molecular variance (AMOVA) in 7 populations of Juniperus sabina var. balkanensis.
Sourced.f. *S.s.VCTV (%)p
Within population1436.672.6272.8
Among populations419.280.7320.40.001
Among regions213.010.256.80.004
* Degrees of freedom; S.s.—sum of squares, VC—variance components, TV—total variation.
Table 6. Three dominant compounds in Juniperus sabina leaf essential oil composition from the literature.
Taxon 1OriginSexDominant Compounds (%)Ref.
J. sabinaCanada-trans-Sabinyl acetate (38.0), sabinene (30.5), myrcene/cadinene (4.5)[46]
Spain-Sabinene (38.1), trans-sabynil acetate (16.2), terpinen-4-ol (6.9)[47]
-Sabinene (54.9), limonene (2.4), terpinen-4-ol (7.2)[47]
Switzerland-trans-Sabinyl acetate (35.0), sabinene (34.8), limonene (3.0)[47]
Slovakia 2mSabinene (24.5), myrtenyl acetate (20.8), elemol (12.2)[9]
Bulgaria 2mSabinene (28.2), methyl eugenol (13.5), terpinen-4-ol (12.4)[9]
fMyrtenyl acetate (23.0), sabinene (16.7), elemol (13.2)[9]
mSabinene (31.0), elemol (13.7), terpinen-4-ol (13.6)[9]
Iranmtrans-Sabinyl acetate (46.2), sabinene (24.3), δ-cadinene (5.5)[14]
mtrans-Sabinyl acetate (30.3), sabinene (26.7), δ-cadinene (6.9)[14]
mSabinene (21.5), α-pinene (14.7), γ-terpinene (6.8)[16]
fSabinene (24.3), 4-terpineol (8.1), myrcene (5.4)[16]
Kazakhstan-Sabinene (42.6), trans-sabynil acetate (15.9), α-pinene (15.8)[47]
-Sabinene (36.8), α-pinene (17.2), cedrol (15.2)[48]
Mongolia-Sabinene (46.5), trans-sabynil acetate (15.9), cedrol (13.2)[47]
-Sabinene (50.0), trans-sabinyl acetate (18.3), terpinen-4-ol (3.1)[47]
-Sabinene (56.7), terpinen-4-ol (4.7), methyl citronellate (3.1)[47]
China-Sabinene (39.0), trans-sabynil acetate (17.5), cedrol (15.8)[49]
-Sabinene (46.5), trans-sabinyl acetate (15.9), cedrol (13.2)[50]
var. arenariaChina-sabinene (57.1), α-pinene (3.8), germacrene D-4-ol (3.5)[47]
var. erectopatensChina-Sabinene (33.3), unknown (13.2), elemol (3.7)[48]
1 Taxon as described in the reference, 2 Potentially J. sabina var. balkanensis.
Publisher’s Note: MDPI stays neutral with regard to jurisdictional claims in published maps and institutional affiliations.

