
Microbiome of Bacterially Impaired Watersheds: Distribution of Potential Bacterial Pathogens


1
Department of Biology, Missouri State University, Springfield, MO 65897, USA
2
Ozark Environmental and Water Resources Institute, Missouri State University, Springfield, MO 65897, USA
*
Author to whom correspondence should be addressed.
Diversity 2022, 14(2), 96; https://0-doi-org.brum.beds.ac.uk/10.3390/d14020096
Submission received: 31 December 2021
/
Revised: 26 January 2022
/
Accepted: 26 January 2022
/
Published: 29 January 2022
(This article belongs to the Section Microbial Diversity and Culture Collections)
Abstract
:Bacterial impairment of freshwater systems is a commonly studied global problem. However, studies on the relative distribution of bacterial pathogens in different impaired aquatic systems have been limited. Frequently, impaired freshwater systems are classified by the presence of fecal indicator bacteria (FIB) and the identification of sources of fecal contamination through microbial source tracking. In this study, we assessed the relative abundance of DNA sequences related to potential human bacterial pathogens along with human fecal indicator bacteria in three impaired watersheds. These watersheds consistently showed a high abundance of FIB for the past several years. Using Illumina paired-end DNA sequencing of 16S rRNA gene amplicons, we observed variation in the relative distribution of DNA sequences related to Legionellaceae, Enterobacteriaceae and Bacteroidaceae families across different sites. We identified potential hotspots sites in these impaired water systems, which showed a relatively high abundance of pathogen-related DNA sequences. This study demonstrates the significance of Next-Gen DNA sequencing for the initial screening of waterborne pathogens and the identification of high-risk sites for preferential remediation efforts in impaired water systems. Secondly, the frequent temporal monitoring of specifically identified pathogens that are in high abundance in a watershed can help in the accurate prediction and prevention of disease outbreaks.
1. Introduction
Bacterial contamination of drinking and recreational water is a major environmental health concern [1,2]. According to the World Health Organization [3], every year waterborne diseases cause more than 1.5 million human deaths worldwide. Although most of these deaths are reported in developing countries, there are still many incidences of waterborne diseases in developed countries [4]. For example, in the United States, every year 75,000 deaths and hospitalizations are attributed to waterborne bacterial pathogens [5].
Bacterial pathogens, such as Salmonella, Shigella and pathogenic E. coli from human or animal fecal material can enter drinking and recreational water resources [6]. Fecal material from infected individuals can carry high loads of bacterial pathogens [7], such as up to 1010 Salmonella cells and 109 Shigella cells per gram of human feces [8]. In addition to fecal pathogens, other pathogens can persist in water and cause disease under optimal growth conditions [9]. This highlights the need for continuous monitoring of the water systems for potential pathogens.
The health risks associated with water contamination are frequently tested through the presence of fecal indicator bacteria (FIB) using quick and cost-effective methods, such as IDEXX Colilert (Westbrook, ME, USA) and membrane filtration-based testing [10,11]. The presence of FIB, like E. coli, enterococci and fecal coliforms suggest fecal contamination of water systems. The detection of FIB has been used as the gold standard for determining bacterial impairment of watersheds. However, FIB testing does not provide information on the abundance or relative distribution of various waterborne pathogens [12,13,14,15,16].
Information on the distribution of different bacterial pathogens is critical for water resource managers to identify and prioritize the remediation efforts of high-risk sites. Considering the scarcity of freshwater resources, a pragmatic approach is to accurately assess the actual health risks associated with the potential use of a water resource based on the presence of actual pathogens rather than simply on the presence of FIB. Currently, 946,573 km of rivers and streams in the United States have been identified as impaired, mainly based on the presence of FIB [17], under Section 303 (d) of the United States Clean Water Act [18].
Secondly, the presence or quantification of a specific human pathogen in water is done through simple PCR or qPCR using target-specific primers. However, testing hundreds of different pathogens, such as Salmonella, Campylobacter, Legionella and pathogenic strains of E. coli and Vibrio vulnificus in a water sample without any prior knowledge is a very costly and time-consuming process. Therefore, an initial screening of site-specific pathogens is needed for the long-term temporal monitoring or quantification of concerned pathogens.
In the current study, we assessed the relative abundance of DNA sequences related to potential bacterial pathogens and human fecal indicator microorganisms in 65 water samples from three bacterially impaired watersheds. We used Next-Gen DNA sequencing for the initial screening of bacterial pathogens in impaired watersheds. Two surface water systems, the Little Sac watershed (LSW) and Pearson Creek (PC), were sampled spatially to determine if there were differences in the relative distribution of pathogens at various sites along with these impaired water systems. The third water system was a karst system at Sequiota spring (SEQ spring).
Water samples from the SEQ spring were collected intermittently to determine if variations in the relative abundance of potential pathogens changed temporally. The three water systems were chosen for this study because, previously, these sites consistently showed a high abundance of FIB as determined using the IDEXX Colilert testing approach [19,20,21,22,23,24]. To date, testing of these watersheds has been focused on FIB, which provides little information on the presence of pathogens and the potential health risks that are associated with these bacterially impaired watersheds. This study investigated the relative abundance of potential pathogen-related sequences associated with the three impaired watersheds and how they are distributed spatially and temporally.
2. Materials and Methods
2.1. Study Area
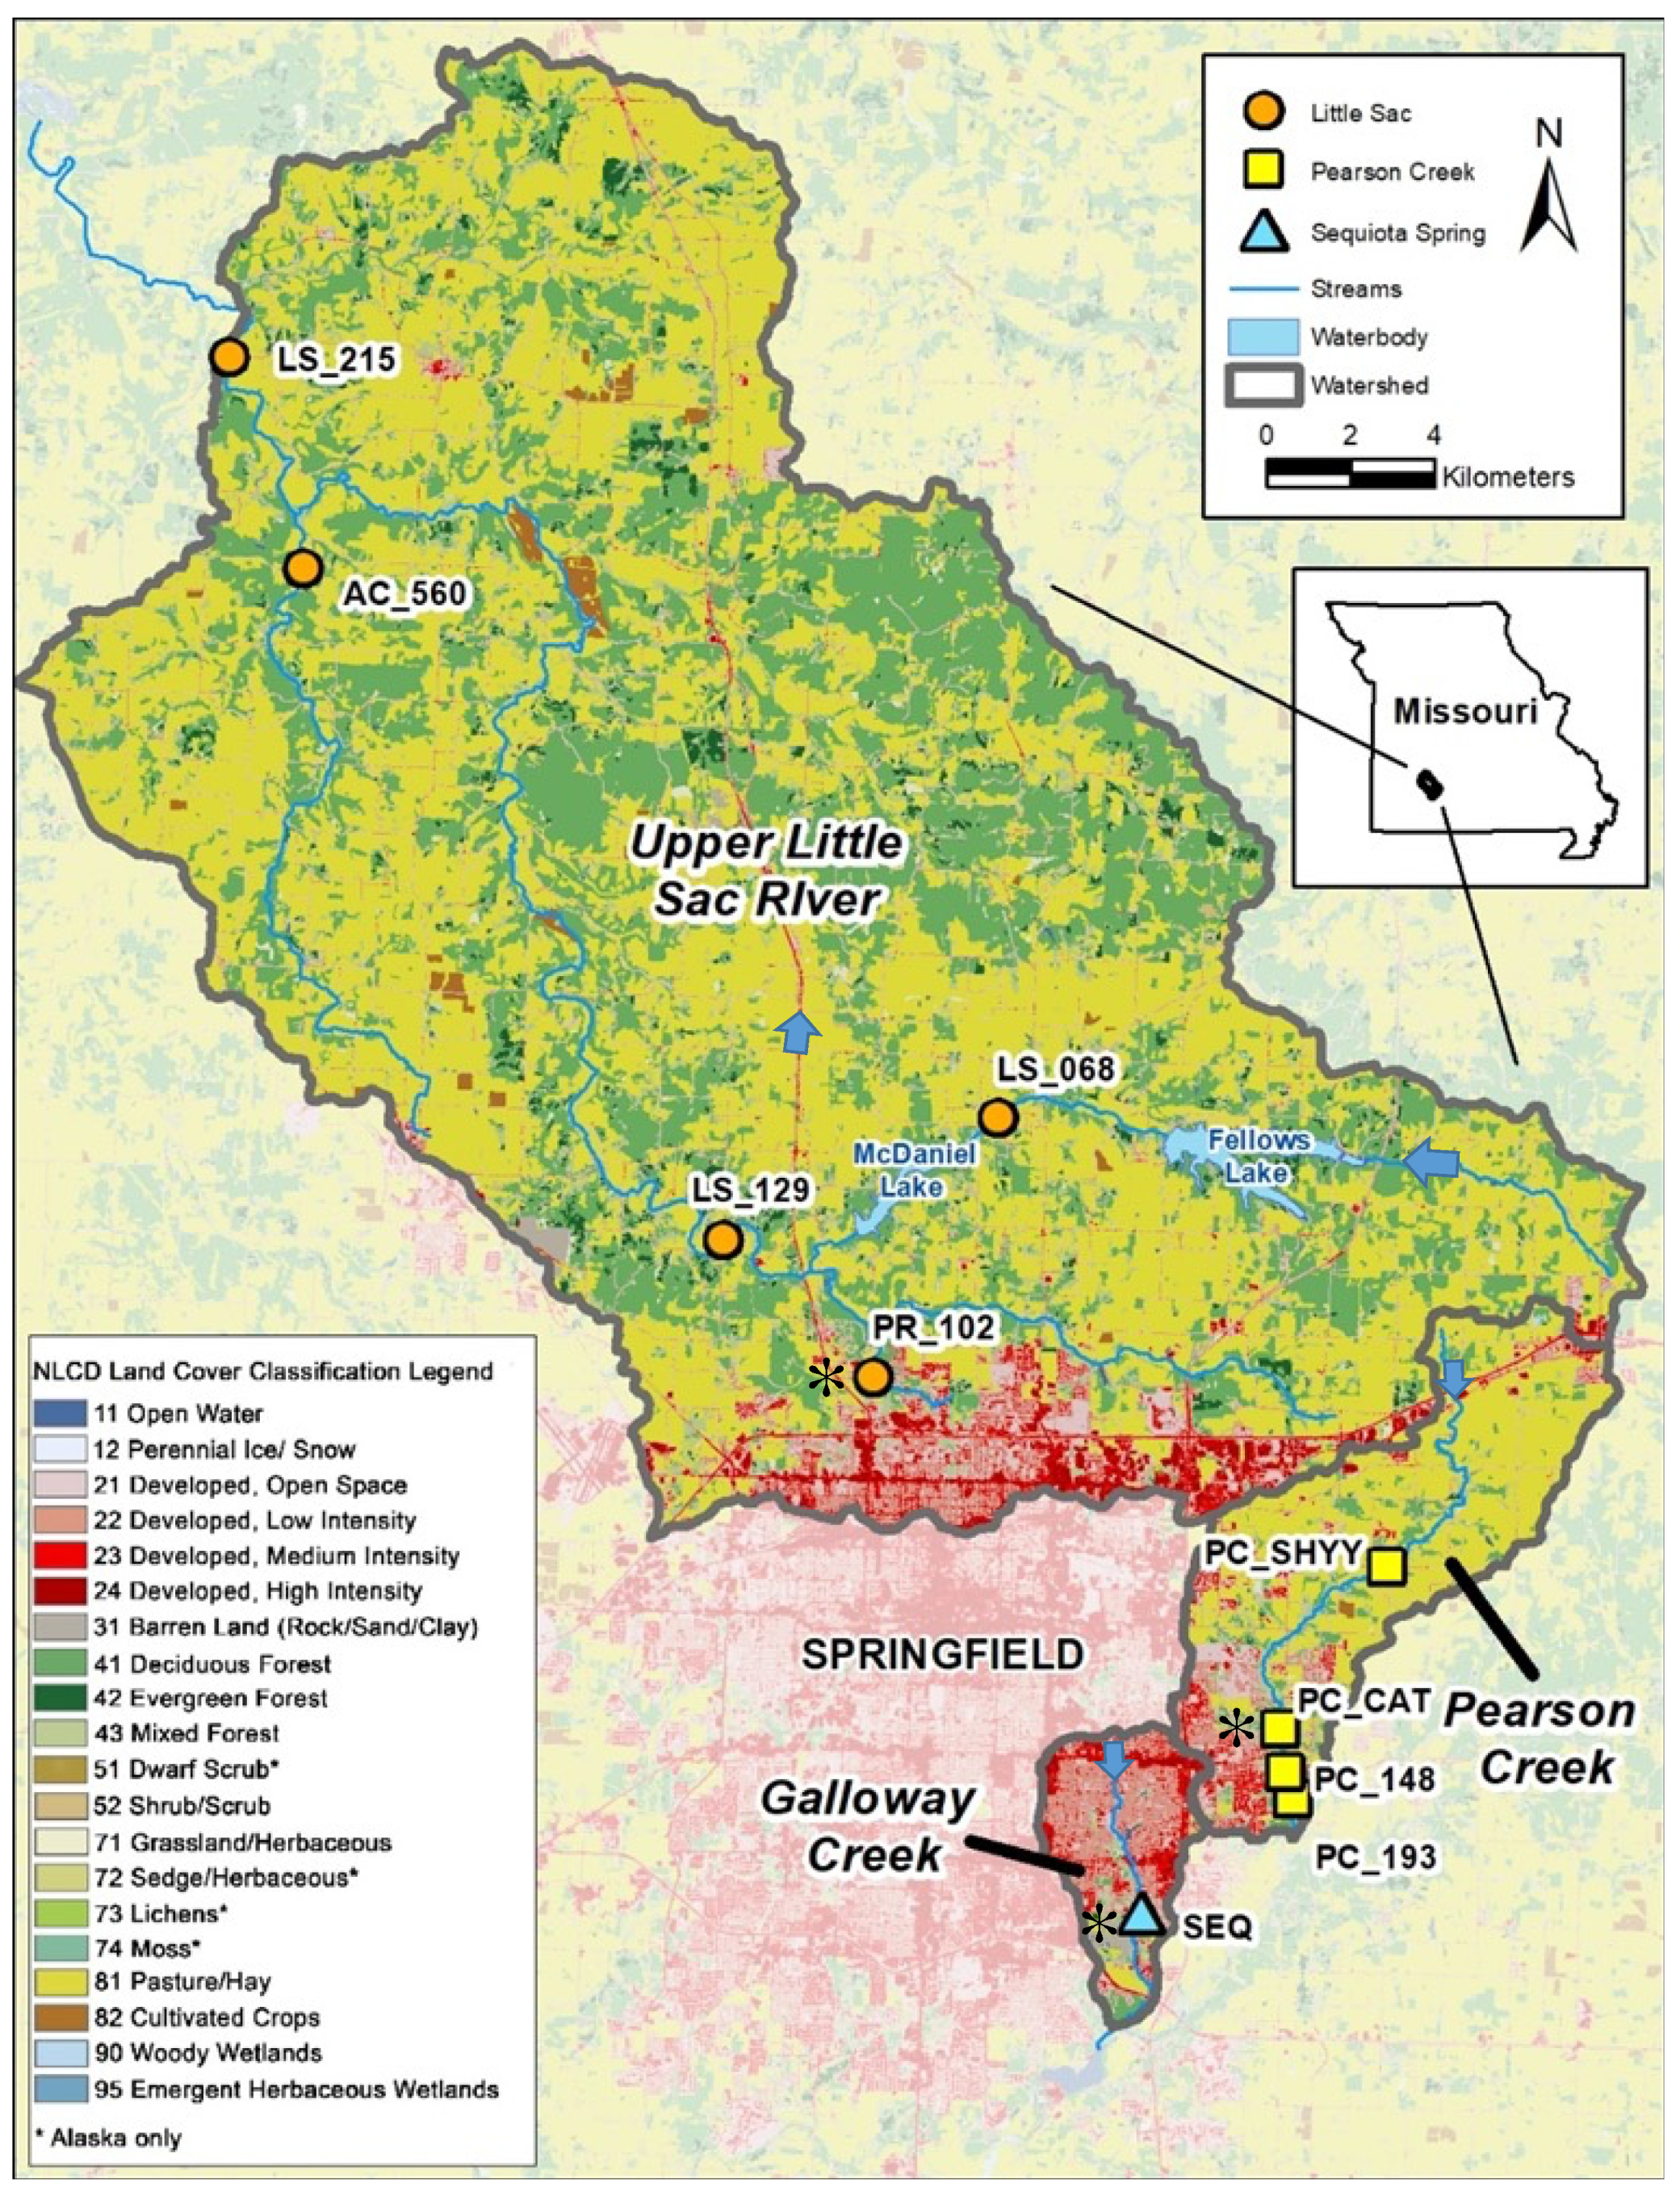
The ten sites sampled for this project are in three different watersheds surrounding Springfield, Missouri (Figure 1). Five sites are in the Upper Little Sac watershed, four sites are in the Pearson Creek watershed, and one site is in the Galloway Creek watershed (18.2 km2). Site-specific drainage areas range from 11–609 km2, and land uses in the contributing area are a mix of urban and agricultural consisting mainly of livestock and forage crop production.
The SEQ spring differs as it is an outlet for a spring with a recharge area of approximately 12.5 km2, draining significant portions of urbanized southeast Springfield. The samples from SEQ spring were collected three times over a period of 1.5 years to evaluate temporal changes in the microbial community (Table S1 in Supplementary Materials).
Two of the three watersheds (LSW and PC) have been classified as bacterially impaired and were placed on 303 (d) of the United States Clean Water Act [18] in 1998 and 2007, respectively [25]. Although SEQ spring is not on the 303 (d) list of bacterial impairments, it has shown a high abundance of indicator microorganisms from 1986 to 2021 [26,27,28,29]. The underlying geology of the region is mostly limestone in which a karst landscape has formed where sinkholes, losing streams, and springs are common [30]. Dye tracing experiments have linked several ponds and losing sections of Galloway Creek to the spring, with flow rates varying from 0.6–11.0 million gallons per day [19,31].
2.2. Water Collection and Processing
Overall, 65 water samples were collected in different 5-gallon sterilized polypropylene carboys and transported back to the laboratory on ice. A detailed description of sampling locations, sampling dates and volume of water filtered are reported in the Supplemental Table (Table S1). The E. coli and total coliforms were quantified using IDEXX Quanti-Tray/2000 systems (Table S2).
2.3. DNA Extraction
Water samples were filtered through 0.22 μm Sterivex filters (Millipore Corporation, Burlington, MA, USA) using a peristaltic pump (Masterflex, Cole–Pamer Co, Vernon Hills, IL, USA). Approximately, 0.75–1.75 L of water were filtered for each sample (Table S1). The filters were stored at −20 °C until further processing. Filters were then cut into small fragments using sterile scissors and placed into 50 mL tubes. Sterile water (25 mL) was added to the tubes containing fragments of filter and vortexed for five minutes to detach the bacterial cells from the filter. Suspended cells in water were harvested by centrifugation at 10,000 rpm for five minutes, and DNA was extracted using Qiagen’s DNeasy PowerLyzer PowerSoil kits (Mo Bio, Carlsbad, CA, USA). DNA was eluted with 25 μL sterile water and stored at −20 °C until further processing.
2.4. DNA Sequencing
Bacterial communities from each water sample were assessed using Illumina MiSeq paired-end DNA sequencing. A two-step PCR approach was used as described previously [32]. Briefly, in the first PCR, the V3–V5 region of bacterial 16S rRNA gene was amplified using primers F515 (5′-GTGCCAGCMGCCGCGG-3′) and R907 (5′-CCGTCAATTCMTTTRAGTTT-3′). These universal bacterial primers were also attached with the Illumina sequencing primers that were targeted in the second PCR amplification. Each 25 μL PCR reaction contained 1X buffer, 0.2 μM of each primer, 2.0 mM MgSO4, 0.2 μM of each deoxynucleoside triphosphates (dNTPs), 1.0 μL of template DNA and five units of High-Fidelity Platinum Taq polymerase (Thermo Fisher Scientific, Waltham, MA, USA).
The conditions for the first PCR were an initial 5 min denaturation at 95 °C, followed by 30 cycles of 95 °C for 45 s, an annealing step at 56 °C for 45 s, an extension at 72 °C for 45 s and a final extension at 72 °C for 7 min. As a standard PCR procedure, we ran positive control (E. coli DNA) and negative control (PCR grade sterilized water) along with each set of PCR reactions. The successful amplification of PCR samples along both controls were evaluated by gel electrophoresis and staining with ethidium bromide. Amplified PCR products were cleaned using ExoSap-IT PCR Cleanup System (ThermoFisher Scientific, Waltham, MA, USA) as per the manufacture’s protocol.
Cleaned PCR products of the first PCR reaction were used as the templates for the second PCR step. In the second PCR, all reagents and their concentrations were the same as described above, except for the PCR primers. The primers used in the second PCR contained the Illumina sequencing adapters A and B along with the standard unique multiplex identifier sequences. The PCR conditions for the second PCR were: initial denaturation for 3 min at 95 °C, followed by 10 cycles of denaturation at 94 °C for 30 s, annealing at 60 °C for 30 s and extension at 72 °C for 30 s, with a final extension at 72 °C for 7 min.
PCR products were quantified using a Nanodrop 2000 spectrophotometer (ThermoFisher Scientific, Waltham, MA, USA) and pooled together in equimolar concentrations. Pooled PCR amplicons from all samples were purified using the Agencourt AMPure beads (Beckman Coulter, Brea, CA, USA). The purified PCR products were sequenced using Illumina MiSeq paired-end DNA sequencing.
2.5. Sequence Processing and Phylogenetic Analysis
Raw sequences (Figure S1) were processed for initial quality control parameters, such as read length, ambiguous bases, removal of chimeric sequences etc. using Ribosomal Database Project II (http://rdp.cme.msu.edu; accessed on 1 September 2021) [33]. High-quality filtered DNA sequences were classified using the RDP naive Bayesian classifier 2.5 [34].
Bacterial sequences related to the Legionellaceae, Enterobacteriaceae and Bacteroidaceae families were extracted using Mothur [35]. These sequences were further assessed for additional quality control parameters, such as the presence of ambiguous bases (‘N’) and trimmed to a uniform sequence length using Sequencher 5.4.6 (Gene Codes Corp., Ann Arbor, MI, USA). Cleaned DNA sequences along with the reference sequences of these families from GenBank were aligned and clustered into operational taxonomic units (OTUs) at 98% similarity using RDP. Neighbor-joining based phylogenetic trees were then constructed using MEGA version 10.1.8 [36].
In addition to the OTU approach, we also assessed the data using the amplicon sequence variances (ASV). The overall distribution in bacterial communities did not greatly differ regardless of the approach (OUT or ASV; see the Supplemental Material for further details; Figure S2).
2.6. Statistical Analysis
Overall, the significance of differences among bacterial communities across different sites/times was assessed by analysis of similarity (ANOSIM, p < 0.05) and visualized with nonmetric multidimensional scaling (NMDS) plots generated in R version 3.6.0 [37]. The Bray–Curtis similarity data were square-root transformed prior to ANOSIM analysis.
3. Results and Discussion
Overall, Next-Gen DNA sequencing resulted in 2,815,170 good quality DNA sequences across all sites, and the average number of sequences per site are reported in (Table 1). We extracted all classified sequences related to Legionellaceae and Enterobacteriaceae families containing potential waterborne pathogens for detailed phylogenetic analysis. Likewise, we evaluated the distribution of DNA sequences related to the Bacteroidaceae family, which contains the biomarker bacterial species to detect human fecal contamination.
3.1. Distribution of Legionellaceae-Related Sequences
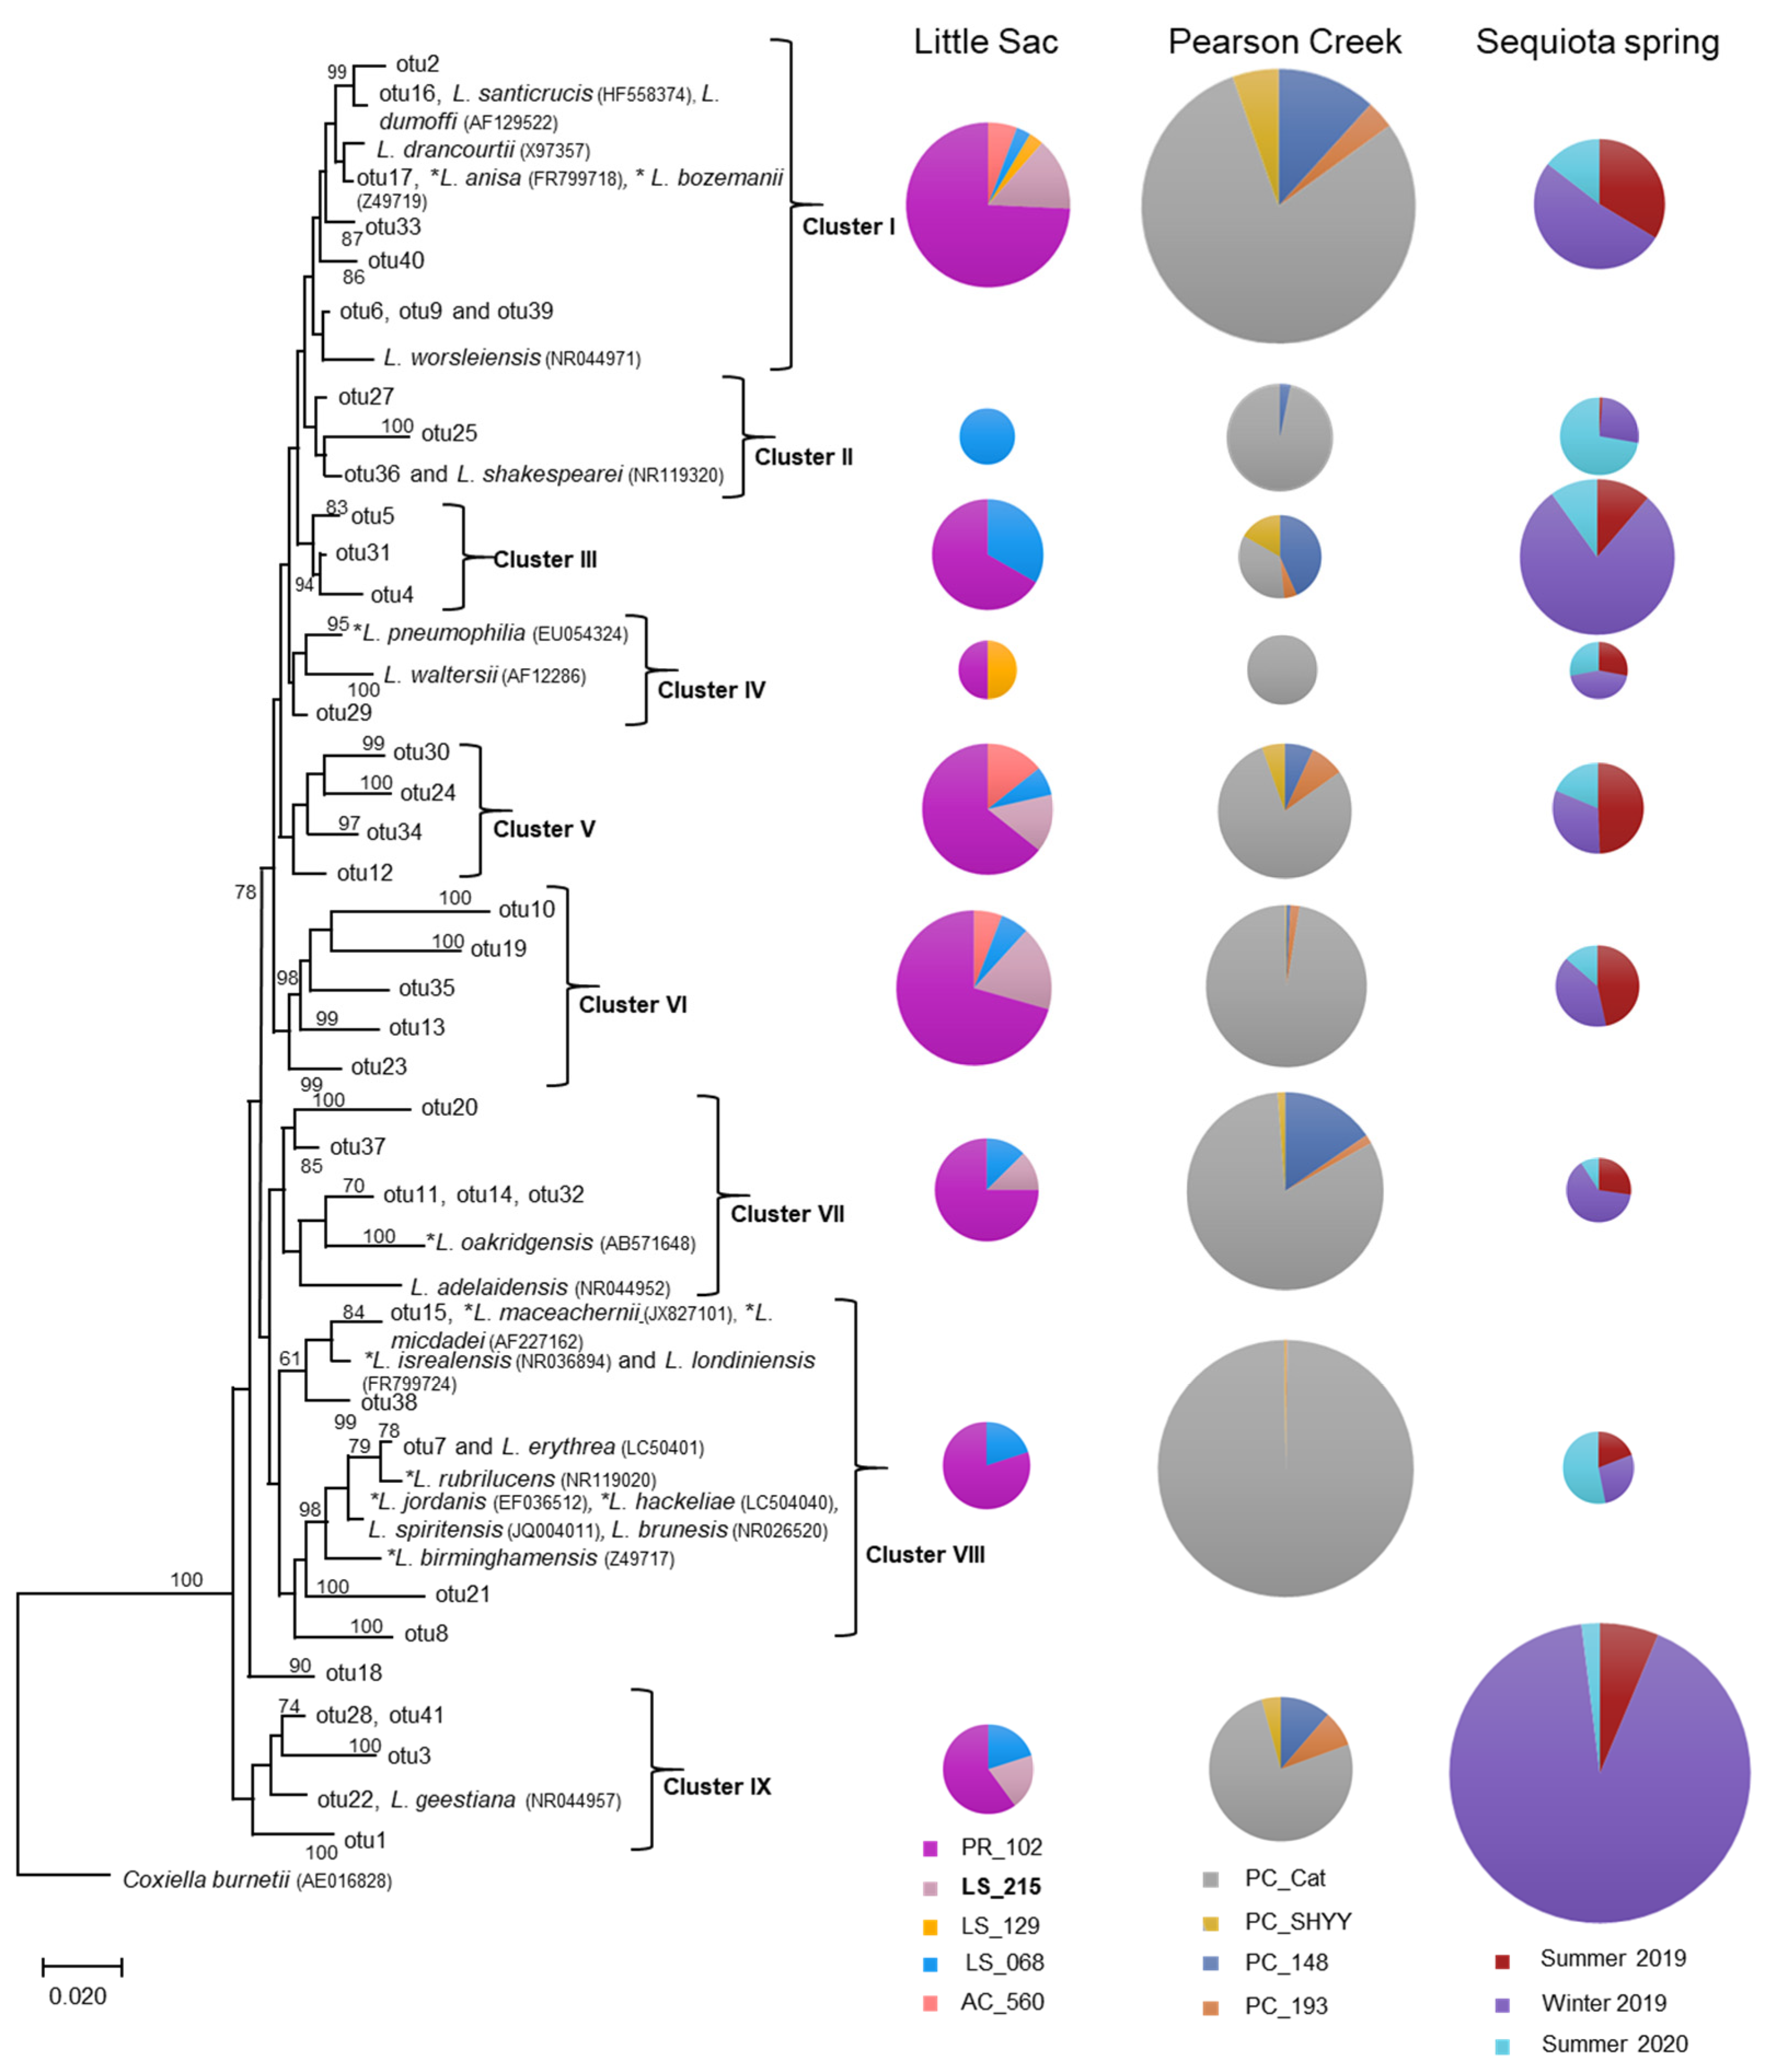
We identified 9767 sequences that were closely related to family Legionellaceae across all sampling locations. The overall abundance of Legionella-related sequences across different watersheds were 5776 sequences from Pearson Creek, 3433 from SEQ spring and 558 from Little Sac sites. These sequences were closely related to both pathogenic and non-pathogenic Legionella spp. from GenBank.
Representative sequences from each OTU containing 50 or more sequences were randomly selected to construct a phylogenetic tree to demonstrate the relative abundance of DNA sequences from various Legionella species (both pathogenic and non-pathogenic species) at different sites. In this phylogenetic analysis, we also included reference sequences of 23 Legionella spp. obtained from GenBank (Figure 2). The phylogenetic analysis suggested the presence of nine distinct phylogenetic clusters (I to IX). Some sequences within clusters I, IV, VII and VIII were closely related to pathogenic species of Legionella, such as L. pneumophila, L. dumoffi, L. anisa, L. parisiensis, L. maceachernii, L. micdadei, L. rubrilucens, L. jordanis, L. hackeliae and L. birminghamensis. (Figure 2).
We also observed the presence of sequences related to non-pathogenic Legionella spp. within clusters I, IV, VII, VIII and IX were related to non-pathogenic species of Legionella (Figure 2). Conversely, clusters III, V and VI were unique, i.e., without any closely related references DNA sequence from GenBank. Overall, 25 of 58 known Legionella species can be infectious to humans; however, the most frequently reported infections have been associated with L. pneumophila [38].
The relative abundance of different Legionella-related sequences greatly varied at different sites or sampling seasons in each watershed (Figure 2). For example, the five sites tested in the Little Sac watershed showed a relatively high abundance of Legionella-related sequences at the site PR_102 (50% to 80%). Site PR_102 resides in the city of Springfield and is under the direct influence of urbanization. The increase in Legionella-related sequences at this site could be due to bacterial contamination originating from the old sanitary sewer systems present in the northern part of the city.
Legionella spp. can survive or grow in corroded pipes by forming biofilms that sustain higher abundances of these bacteria [39]. Two of the most dominant clusters (I and VI) contained sequences that were closely related to three pathogenic species (L. dumoffii, L. anisa and L. bozemanii) and two non-pathogenic species (L. drancourtii and L. worsleiensis). The presence of Legionella-related sequences at the PR_102 site as compared to other locations in the Little Sac Watershed highlights the need for close monitoring of Legionella species at this location to prevent health risks.
Similarly, in the Pearson Creek watershed at site PC_Cat (Figure 2), we retrieved a relatively high abundance of Legionella-related sequences (35% to 100%). The abundance of Legionella-related sequences at an upstream site (PC_SHYY) and the two downstream sites (PC_193 and PC_148) were relatively very low compared to the PC_Cat site. The upstream site is not under urban influence, whereas other sites have moderate levels of urbanization. The relatively high abundance of Legionella sequences at the PC_Cat and not at the other two downstream sites suggests a site-specific source of contamination.
Overall, at the PC_Cat site, cluster I- and VIII-related sequences were in higher abundance and Cluster VIII contained pathogenic species, including L. maceachemii, L. israelensis and L. jordanis (Figure 2). These pathogens frequently cause pneumonia but have also been reported to cause Pontiac fever [40]. Plumbing systems can harbor these bacteria in biofilms and allow them to become abundant [39]. Since this stream runs through residential areas, it is possible that leaky domestic sewer systems or leaking plumbing systems may be contributing to this influx.
In the SEQ spring samples, clusters I, III and IX made up most sequences. Of these three major clusters, the abundance of Legionella-related sequences was increased in the winter of 2019 (26% to 92%) compared to the summer sampling events. Frequently, incidences of Legionnaire’s disease/Legionellosis are increased during the summer and fall seasons due to the preferred warmer temperatures [41,42,43]. Although disease cases increase more in the summer/fall, Legionella species can persist in the environment in relatively the same abundance year-round [44].
Previous dye tracer studies at this site [19,31] suggested bacterial contamination derived from old septic tanks and leaky sewer systems in the area. If the Legionella contamination is originated from the biofilms formed in the old corroded water pipes, then the low water flow during winter months might have contributed to their increased concentration in winter. Generally, less water is used for domestic purposes during winter as compared to summer months. Secondly, the availability of protozoan hosts may be influencing the increase in Legionella-related sequences in the winter at this recharge spring [45].
Generally, Legionella spp. are respiratory pathogens that can infect alveolar macrophages. Frequently Legionnaire’s cases have been associated with the L. pneumophila. However, nearly 40% of other known Legionella species can cause infections in humans [38]. In aquatic environments, Legionella spp. can be detected in lakes and streams; however, their numbers are relatively very low [46]. The relatively high abundance of Legionella cells in water can become a major health concern by aerosolization of Legionella cells in an environment [47].
In the United States, around 10,000 cases of Legionnaires disease were reported in 2018 with a fatality rate of 10% [48]. In the current study, we observed a relatively high abundance of both pathogenic and non-pathogenic Legionella spp.-related sequences at three locations (PR_102, PC_Cat and SEQ spring) as compared to other sites in these watersheds. These sites need to be further explored for the identification and remediation of the sources of Legionella contamination to eliminate the potential health risks associated with the recreational use of these sites.
It is important to mention that partial 16S rRNA sequencing may not be able to accurately assign phylogeny at the species and strain levels. Further testing of specific pathogenic species through qPCR using species-specific marker genes could help to quantify different Legionella species in impaired aquatic environments. On the other hand, we observed that the assignment of partial reference sequence corroborated well with the phylogenetic placement of Legionella species from other studies based on the complete 16S rRNA gene sequences [49].
3.2. Distribution of Enterobacteriaceae-Related Sequences
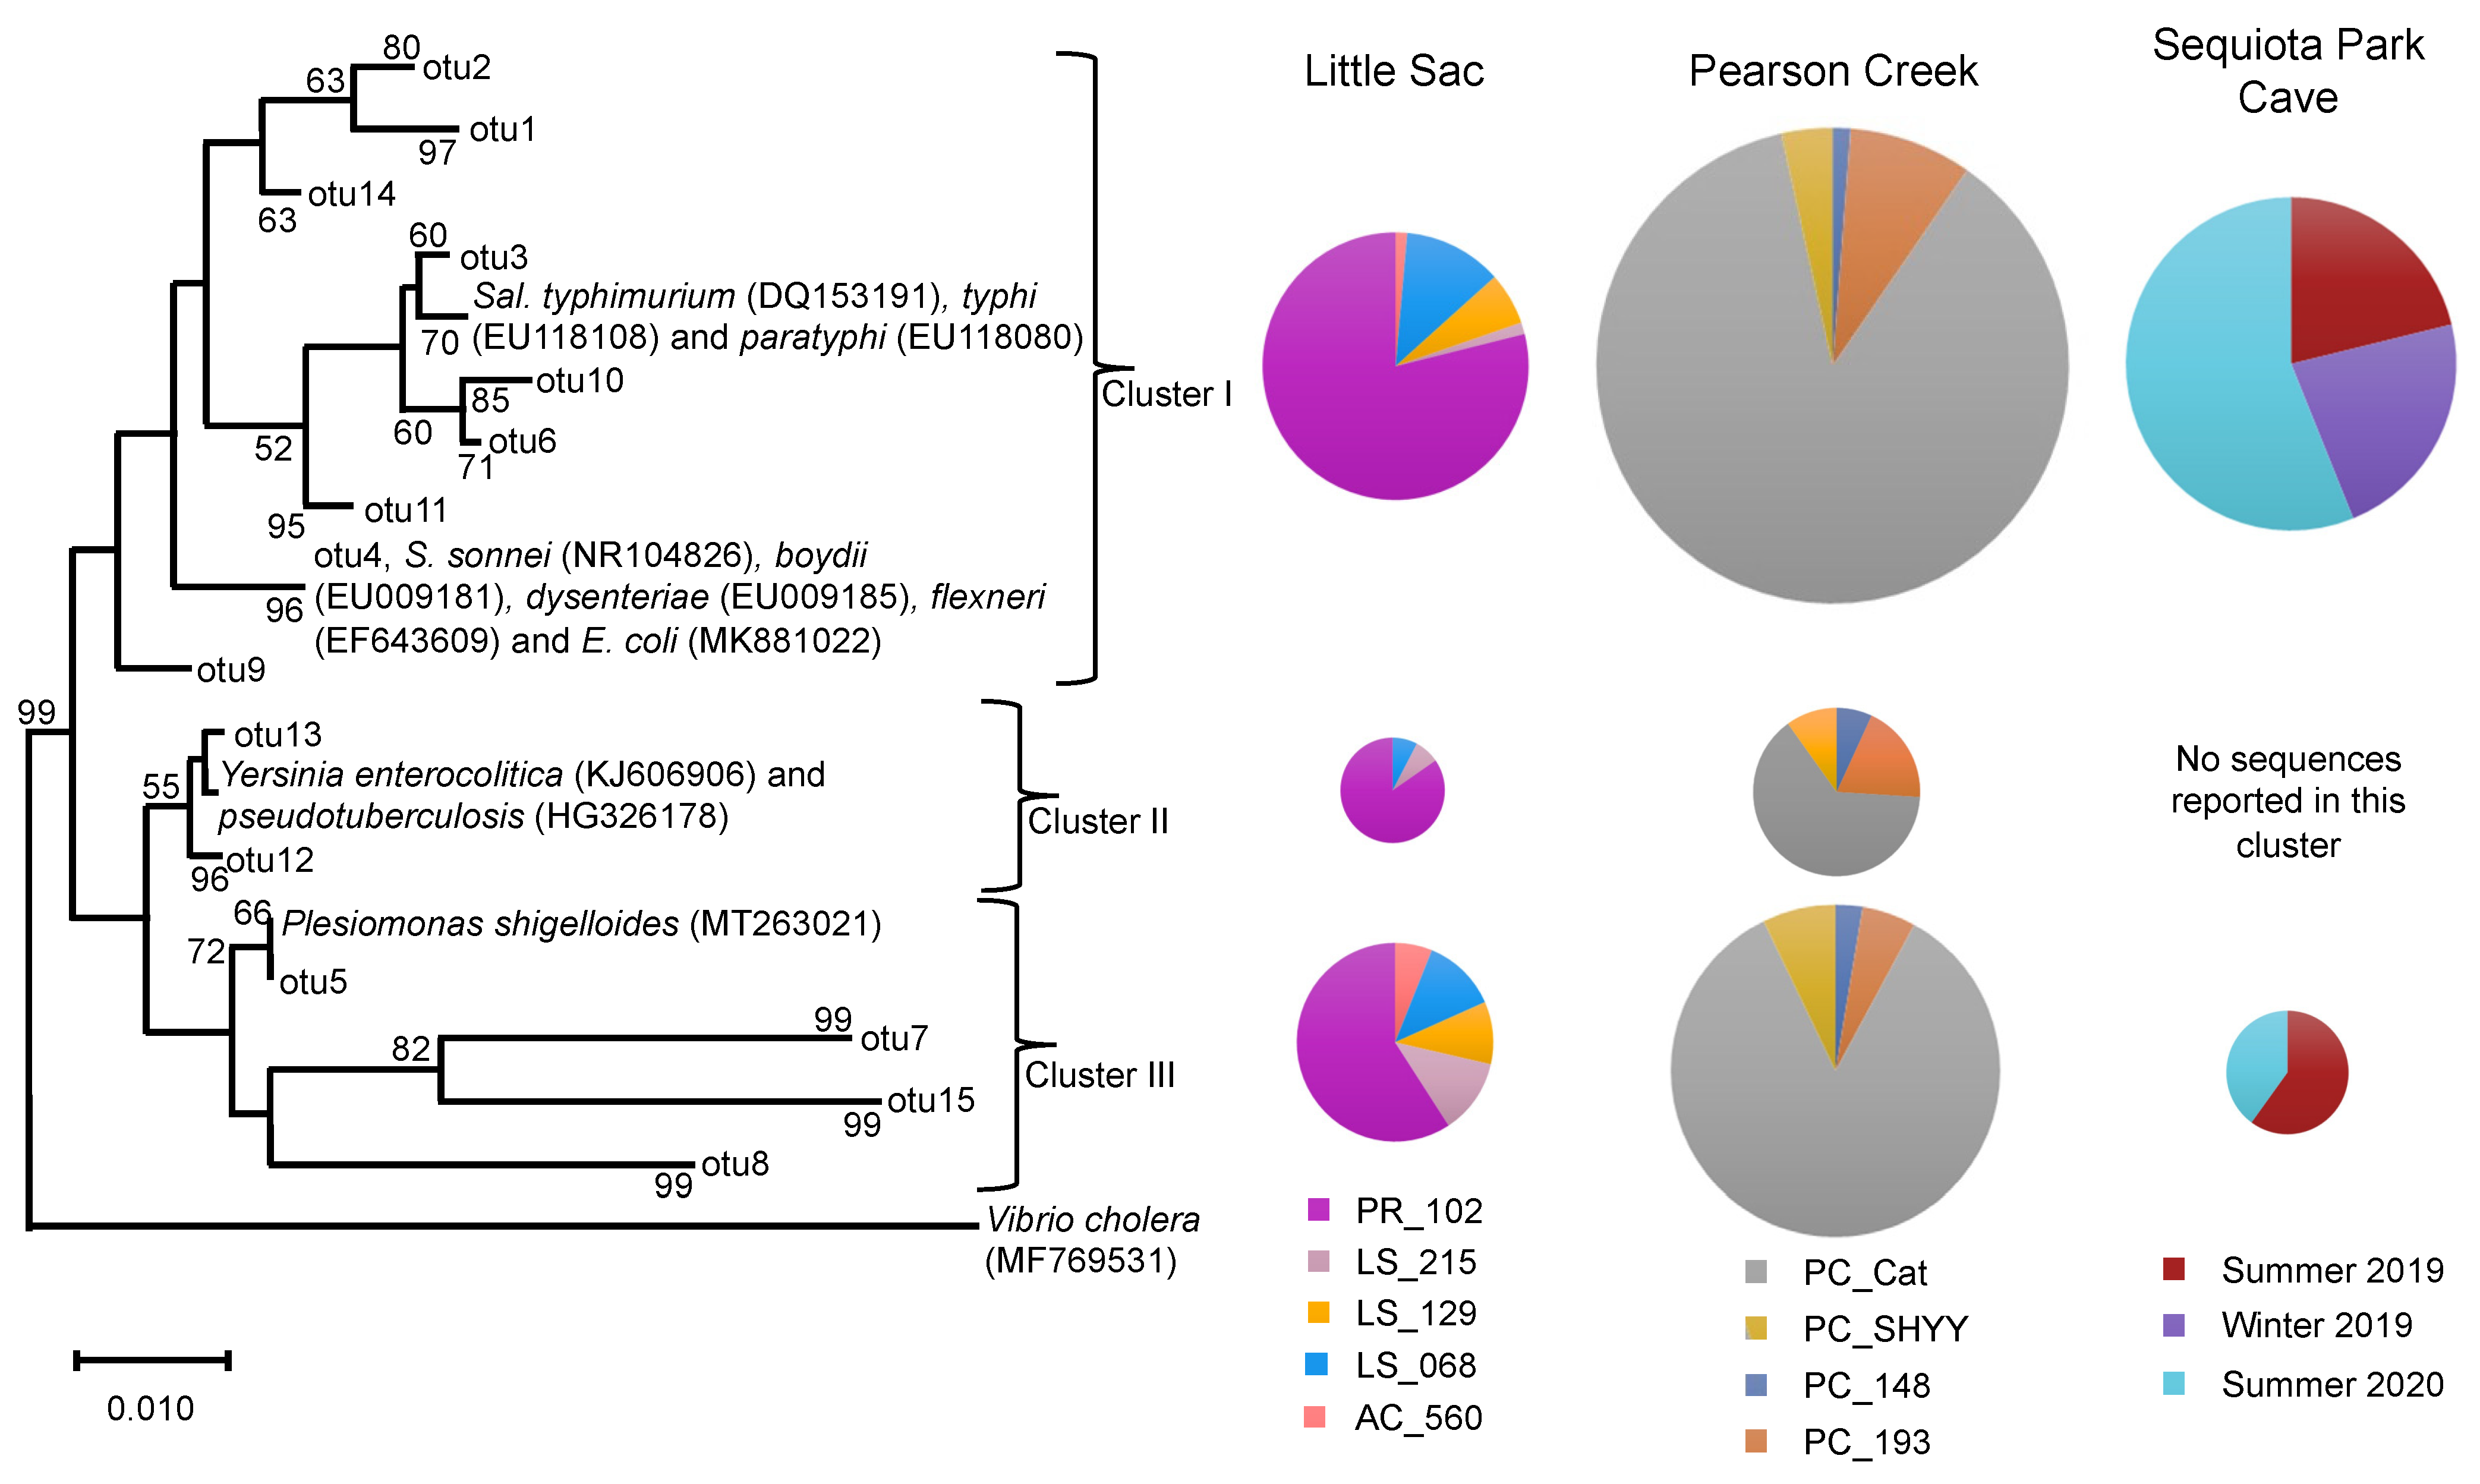
The phylogenetic analyses of 6760 Enterobacteriaceae-related sequences retrieved from the three different aquatic systems could be divided into three distinct clusters (I to III). The overall abundance of Enterobacteriaceae-related sequences across different aquatic systems were 5367 sequences from Pearson Creek, 703 from SEQ spring and 609 from Little Sac sites. Most of the sequences were classified into two clusters, I and III (Figure 3).
We used OTUs containing > 50 sequences (3213 sequences) along with the 11 references sequences of known human pathogens in this family from GenBank to construct a phylogenetic tree (Figure 3). As with the Legionella sequences, we detected variation in site-specific abundance of Enterobacteriaceae-related sequences. At sites PR_102 and PC_Cat, cluster-I-related sequences ranged from 79% to 87% of the Enterobacteriaceae sequences. Similarly, these two sites made up 59% and 85% of the sequences in cluster III (Figure 3).
Cluster I contained references from pathogenic Salmonella spp., Shigella spp. and E. coli. Salmonella species are intracellular parasites that usually invade the gastrointestinal tract and cause salmonellosis. Some species of Salmonella, such as S. enterica cause typhoid fever, which is frequently associated with drinking water contaminated with fecal material [50].
Approximately 0.20 to 1.3 billion infections and about 3 million deaths are caused by nontyphoid species of Salmonella each year [51]. The two serovars S. typhi and S. paratyphi cause 21.7 million infections and 217,000 deaths each year, mostly in developing counties [51,52]. Similarly, Shigella spp. and E. coli cause gastrointestinal diseases, such as diarrhea and dysentery. Both organisms are reported to annually cause about 0.5 billion disease incidences worldwide [53]. Some species of Shigella and E. coli genera in our study were assigned the same OTU because the 16S rRNA gene sequences from these genera were highly similar and could not be reliably distinguished [54].
Sequences in clusters II and III were related to references of pathogenic Yersinia spp. and Plesiomonas shigelloides, respectively. Plesiomonas shigelloides causes gastroenteritis infections in humans and is frequently reported to originate from freshwater environments and through the consumption of aquatic foods, such as shellfish and catfish [55]. Likewise, Yersinia spp. (Y. enterocolitica and Y. pseudotuberculosis) cause gastrointestinal infections and are reported to originate from untreated water that is contaminated with fecal material [56,57]. Furthermore, Galindo et al., [58] reported that spreading of Y. enterocolitica through the fecal-oral route can significantly increase the human–human transmission of this pathogen.
Overall, the relative abundance of Enterobacteriaceae-related sequences of the five sites from LSW suggests that most of these sequences were originated from site PR_102. The influx of Enterobacteriaceae-related sequences at PR_102 site could be originated from human sources of fecal contamination. As discussed above, the site PR_102 is under the direct influence of urbanization and a previously MST-based study of this site suggested the presence of human fecal contamination [22].
On the other hand, other sources of fecal contamination, such as fecal material of deer, birds, rodents, fish and turtles, have also been suggested to contain Enterobacteriaceae-related bacteria, such as Salmonella and Yersinia spp. [59,60,61,62,63]. However, at the other locations in LSW that are under agricultural influence, we did not detect a relatively high abundance of Enterobacteriaceae-related bacteria. Likewise, for Pearson Creek, most Enterobacteriaceae-related sequences originated from site PC_Cat. Overall, PR_102 in LSW and PC_Cat in Pearson Creek showed high abundances of both Legionella and Enterobacteriaceae-related sequences.
Most of the Enterobacteriaceae-related sequences from the SEQ spring samples were related to phylogenetic cluster I, and a few sequences were related to cluster III. During summer 2020, we observed an increase in the number of Enterobacteriaceae sequences (56%) as compared to the summer of 2019 (21%) and the winter of 2019 (23%) (Figure 3). SEQ spring is in southeast Springfield, and this watershed is part of a karst landscape that has several sinkholes, losing streams and springs in the area [30].
Its recharge area is approximately 18.2 km2, and it drains a significant portion of urbanized southeast Springfield. Previous studies reported an increase in Enterobacteriaceae abundance during the warmer months of the year, as well as increases due to sewage contamination [64,65,66]. Owen et al. [29] suggested the presence of human fecal contamination in this cave, and the city of Springfield has been working to remediate aging sanitary sewer infrastructure in the recharge area to help improve water quality and reduce human health risks in local streams.
3.3. Distribution of Bacteroidaceae-Related Sequences
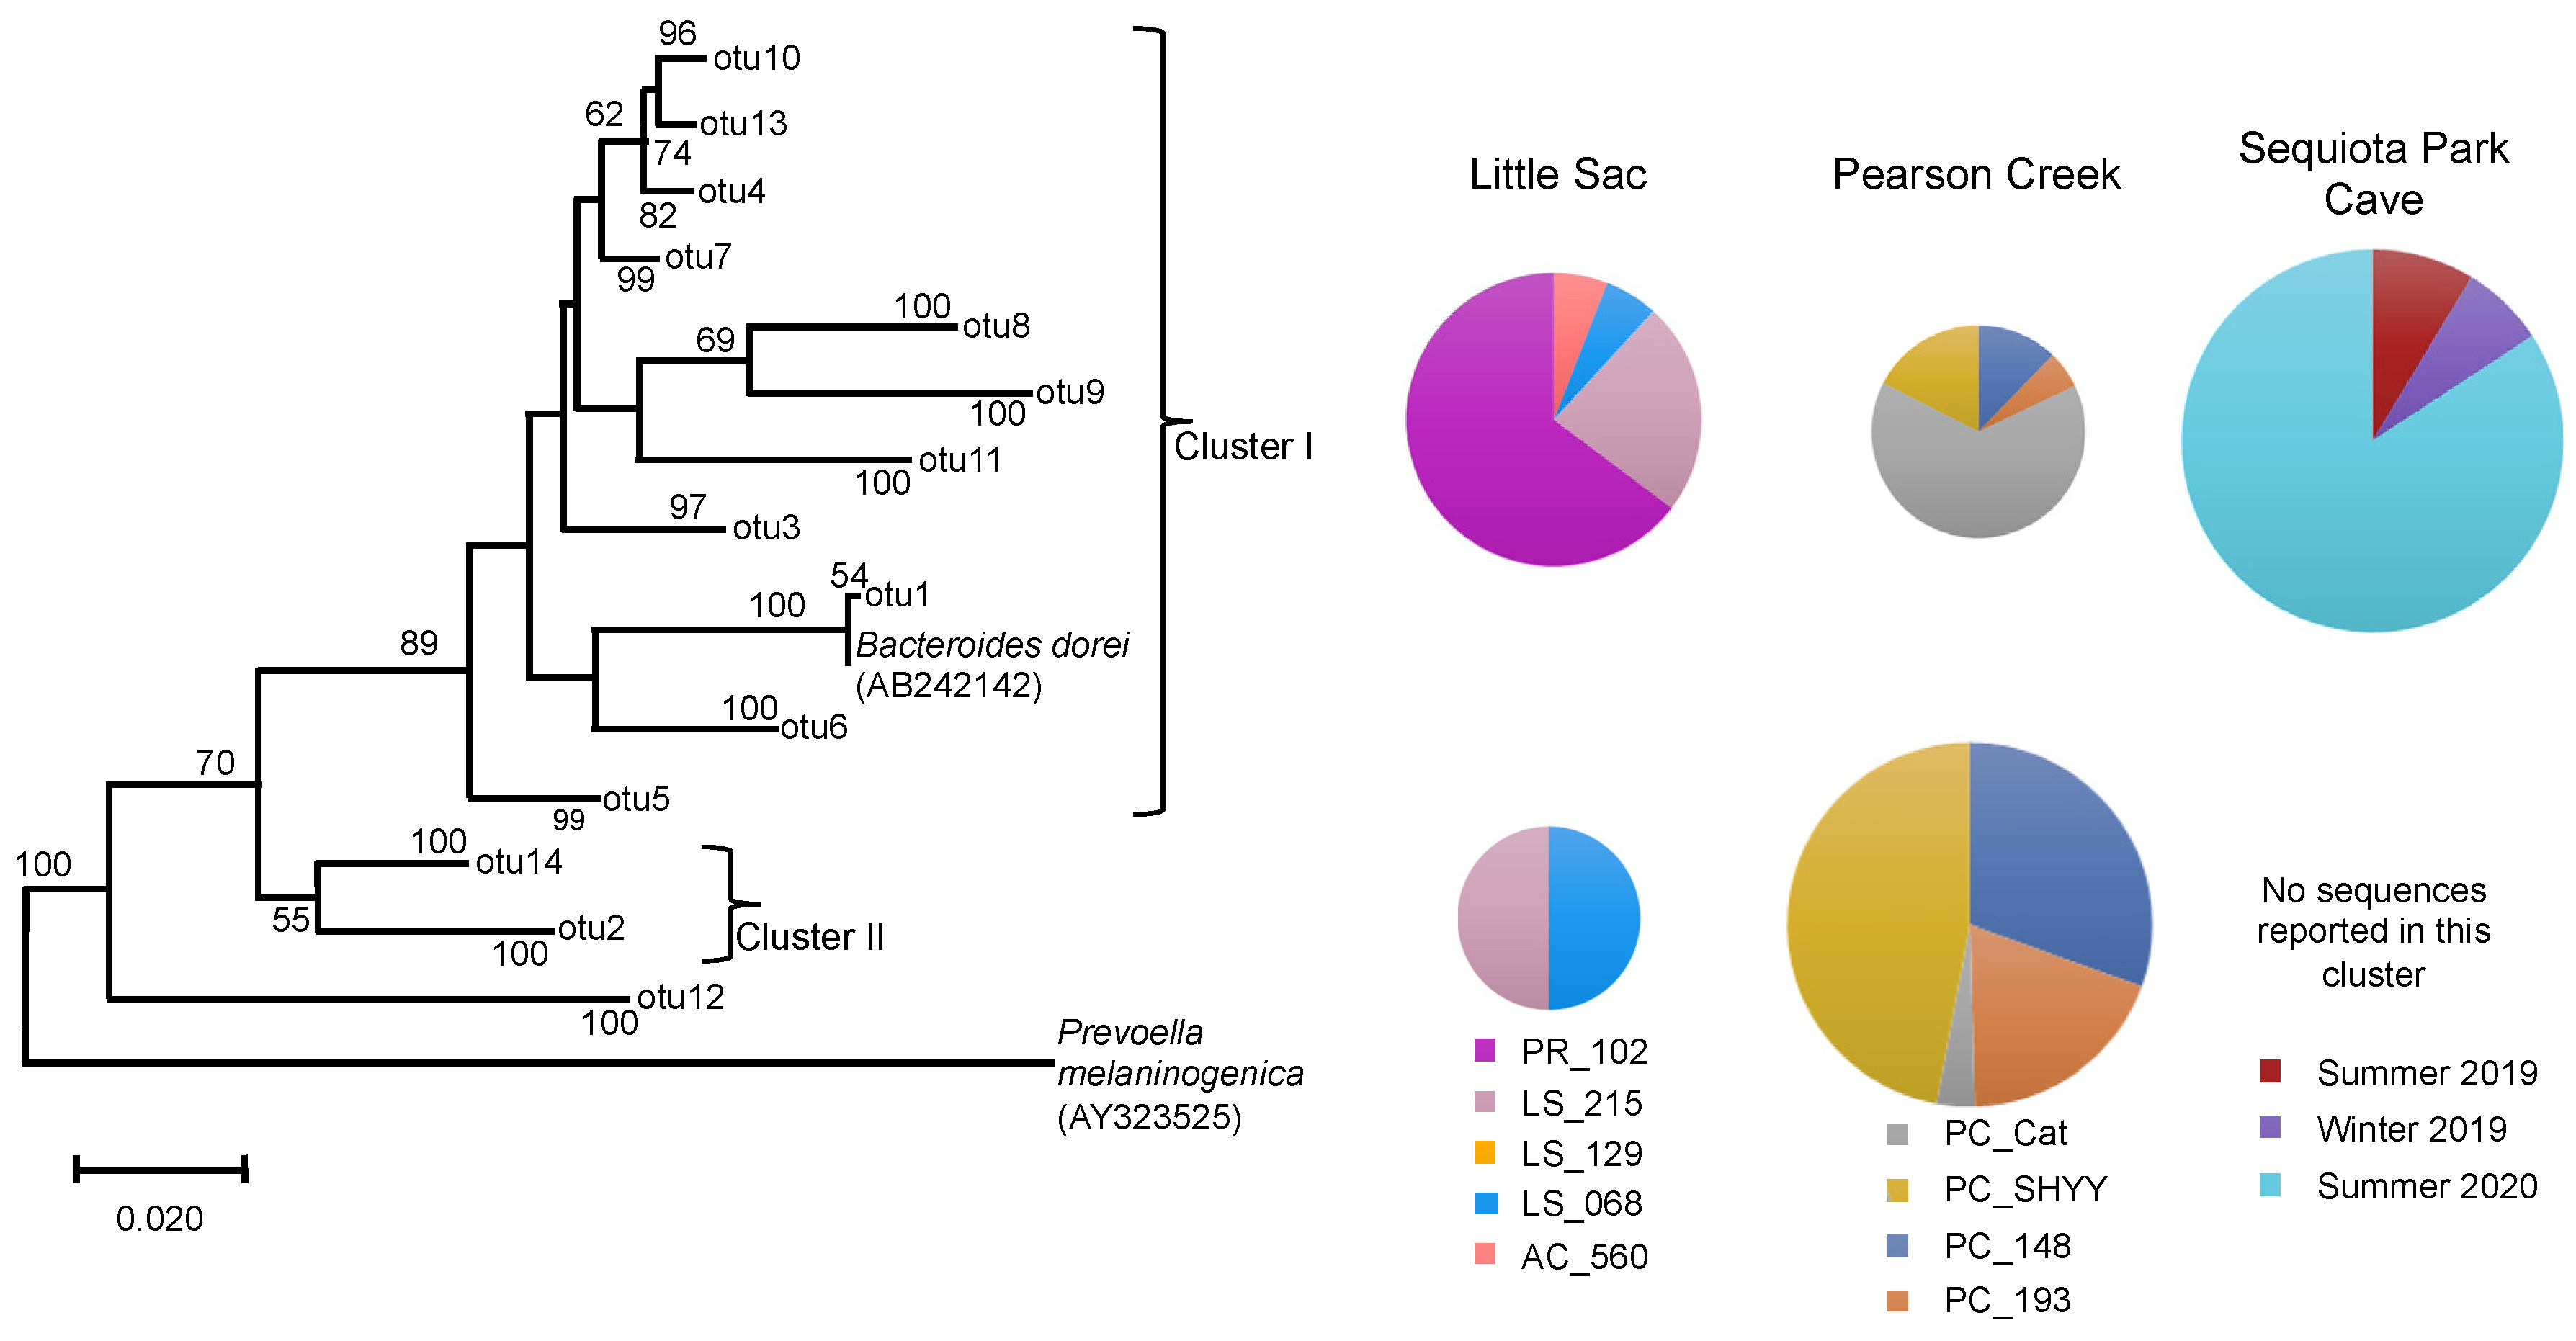
We also evaluated variation in the relative abundance of Bacteroidaceae-related sequences because species with this family are commonly used as a marker for the identification of fecal contamination sources [67]. Previous studies [22,23,29] evaluated these sites for various sources of fecal contamination. The PR_102 site in LSW, the PC_SHYY site in Pearson Creek and the SEQ spring have shown the presence of human fecal contamination.
We retrieved 4357 Bacteroides-classified sequences from the different watersheds. SEQ spring had 2693 sequences, followed by Pearson Creek (1598 sequences) and LSW (56 sequences) (Figure 4). The phylogenetic analysis suggested the presence of two major phylogenetic clusters within the Bacteroidaceae sequences. Cluster I (OTU1) contained the reference sequence Bacteroides dorei, which is commonly used as a marker gene for human fecal contamination and closely related sequences. This cluster contained most of the sequences retrieved from LSW and SEQ spring. In contrast to this, cluster II contained twice as many sequences as cluster I of the Pearson Creek samples.
Overall, we observed a similar trend in the distribution of Bacteroidaceae sequences within cluster I at different sites, as seen in the case of Legionella and Enterobacteriaceae-related sequences. The PR_102 site in LSW, PC_Cat in Pearson creek and summer 2020 samples from SEQ spring contained the most sequences in this cluster. Our results corroborated the previous MST report-based studies for sites PR_102 and SEQ spring samples [22,29]. For SEQ spring, summer 2020 made up 84% of the sequences in cluster I.
A previous MST-based study on the SEQ spring [29] reported a relatively high abundance of the human fecal markers in the summer of 2020 compared to the other two sampling periods. This validates our results, suggesting that the pathogens present in this system could be coming from the leaky sewer lines. In contrast, the PC_Cat site in Pearson Creek did not previously display human fecal contamination [23] despite the presence of high FIB and pathogen-related sequences.
3.4. Distribution of Other Genera Containing Pathogenic Species
In addition to the three bacterial families mentioned above, we also evaluated the distribution of other potential pathogenic bacterial genera (Table S3). We observed the presence of Pseudomonas-, Acinetobacter-, Clostridium- and Aeromonas-related sequences. Although some species within these genera are pathogenic, most of these species that can persist in aquatic environments are non-pathogenic [68]. Further testing is needed to determine if pathogenic species within these genera are present at these sampling sites. DNA sequences related to other bacterial genera that contain known pathogens, such as Campylobacter, Peptoclostridium and Helicobacter, were not detected at any of our sites.
We also assessed the phylum-level distribution of all good quality classified sequences across different watersheds (Figures S3 and S4) and measured the overall bacterial species richness and diversity across different sites (Table 1).
3.5. Overall Bacterial Diversity
The difference in bacterial diversity across different sites was evaluated through the Shannon diversity index and Chao 1 estimator of species richness as described previously [69]. Shannon diversity, which considers both the species richness and species relative abundance was significantly higher at the PR_102 site within the Little Sac watershed and site PC_Cat within the Pearson Creek watershed (Table 1). Both sites displayed a relatively high abundance of pathogen-related sequences as compared to other sites. However, overall bacterial diversity was not significantly different across different sites. The Sequiota Spring site displayed significantly lower diversity during the winter sampling events, compared to the summer samplings (Table 1).
The Chao 1 estimator, which describes the total species richness, was higher at the PR_102 site within LSW and summer 2020 samples from Sequiota Spring (Table 1). The latter can be explained by Enterobacteriacea-related sequences being higher in summer 2020 samples. Sequences related to Legionellacea were higher during winter 2019.
4. Conclusions
In summary, using Next-Gen DNA sequencing, we identified three potential high health-risk sites (PR_102, PC_Cat and SEQ spring) that displayed a relatively high abundance of sequences related to Legionellaceae and Enterobacteriaceae families that contained known human pathogenic species. This information can be valuable for water resource managers to preferentially focus remediation efforts at those three specific sites. The seven other locations in impaired watersheds pose relatively fewer risks to health due to the absence or very low abundance of pathogen-related sequences.
Considering the scarcity of water resources, these seven sites could be potentially used for recreational purposes, such as fishing, boating and swimming purposes. Future studies in the area will be focused on the temporal monitoring of these pathogens using specific primers in qPCR. In addition to the spatial variation in bacterial contamination, the SEQ spring site also showed the presence of pathogen-related sequences in high abundance that varied over time. Overall, this study demonstrates the significance of Next-Gen DNA sequencing for an initial screening of high-risk sites based on the relative abundance of pathogen-related sequences in bacterially impaired watersheds.
Supplementary Materials
The following supporting information can be downloaded at: https://0-www-mdpi-com.brum.beds.ac.uk/article/10.3390/d14020096/s1; Table S1. Details of sampling sites and volumes of water filtered across different samples; Table S2. Abundance of E. coli cells/100mL of water sample quantified using IDEXX Quanti-Tray/2000 systems. The range of E. coli cells reported here represents the cells counted at two different sampling times that were about two weeks apart (only done for IDEXX testing); Table S3. Sequences related to pathogen-containing genera across the three watersheds; Figure S1. Little sac and Pearson creek raw data files for forward and reverse reads; Figure S2. (A). Operational taxonomic unit based (OTU) based Non-metric multidimensional scaling plot of Pearson creek (triangles) and Little Sac (squares) sites, using Bray-Curtis similarity index. (B). OTU-based Non-metric multidimensional scaling plot of Sequiota spring temporal sampling, based on Bray-Curtis similarity index. (C). Amplicon Sequence Variance (ASV) based Non-metric multidimensional scaling plot of Pearson creek (triangles) and Little Sac (squares) sites, using Bray-Curtis similarity index. (D). ASV-based Non-metric multidimensional scaling plot of Sequiota spring temporal sampling, based on Bray-Curtis similarity index; Figure S3. Phylum level distribution of sequnces (2,035,589) across Little Sac and Pearson Creek sampling sites; Figure S4. Phylum level distribution of sequnces (779,581) as compared across temporal sampling of Sequiota Park’s recharge spring. Sequnces classified as phylum-related were used in construction of of bargraph.
Author Contributions
Conceptualization, J.C.K., M.R.O., R.T.P. and B.S.M.; data curation, J.C.K., M.R.O., R.T.P. and B.S.M.; formal analysis, J.C.K., resources, supervision and project administration, B.S.M.; writing, review and editing B.S.M. All authors have read and agreed to the published version of the manuscript.
Funding
This research received no external funding.
Data Availability Statement
The 16S rRNA gene sequences were deposited in the NCBI Sequence Read Archive (SRA) under Bio-Project PRJNA773504.
Conflicts of Interest
The authors declare no conflict of interest.
References
- Pandey, P.K.; Kass, P.H.; Soupir, M.L.; Biswas, S.; Singh, V.P. Contamination of water resources by pathogenic bacteria. AMB Express 2014, 4, 51. [Google Scholar] [CrossRef] [Green Version]
- Magana-Arachchi, D.N.; Wanigatunge, R.P. Ubiquitous waterborne pathogens. In Waterborne Pathogens; Prasad, M.N.V., Grobelak, A., Eds.; Elsevier Butterworth-Heinemann: Oxford, UK, 2020; pp. 15–42. [Google Scholar] [CrossRef]
- World Health Organization (WHO). Water Sanitation Hygiene. 2019. Available online: https://www.who.int/water_sanitation_health/diseases-risks/en/ (accessed on 16 August 2021).
- Centers for Disease Control and Prevention (CDC). Magnitude and Burden of Waterborne Disease in the U.S. 2016. Available online: https://www.cdc.gov/healthywater/burden/index.html (accessed on 7 September 2021).
- Adam, E.A.; Collier, S.A.; Fullerton, K.E.; Gargano, J.W.; Beach, M.J. Prevalence and direct costs of emergency department visits and hospitalizations for selected diseases that can be transmitted by water, United States. J. Water Health 2017, 15, 673–683. [Google Scholar] [CrossRef] [PubMed] [Green Version]
- Byappanahilli, M.N.; Nevers, M.B.; Korajkic, A.; Staley, Z.R.; Harwood, V.J. Enterococci in the environment. Microbiol. Mol. Bio. Rev. 2012, 76, 685–706. [Google Scholar] [CrossRef] [PubMed] [Green Version]
- Garcia-Aljaro, C.; Blanch, A.R.; Campos, C.; Jofre, J.; Lucena, F. Pathogens, faecal indicators and human specific microbial source-tracking markers in sewage. J. Appl. Microbiol. 2018, 126, 701–717. [Google Scholar] [CrossRef] [Green Version]
- Gentry, T.J. Environmentally transmitted pathogens. In Environmental Microbiology, 3rd ed.; Pepper, I.L., Gerba, C.P., Gentry, T.J., Eds.; Elsevier Academic Press: Cambridge, MA, USA, 2014; pp. 509–550. [Google Scholar]
- World Health Organization. Microbial aspects. In Guidelines for Drinking-Water Quality Incorporating the 1st Addendum, 4th ed.; World Health Organization: Geneva, Switzerland, 2017; pp. 117–153. Available online: https://www.who.int/publications/m/item/guidelines-for-drinking-water-quality-4th-ed.-incorporating-the-1st-addendum-(chapters) (accessed on 1 August 2021).
- Kinzelman, J.L.; Singh, A.; Clem, N.G.; Pond, K.R.; Bagley, R.C.; Gradus, S. Use of IDEXX Colilert-18® and Quanti-Tray/2000 as a rapid and simple enumeration method for the implementation of recreational water monitoring and notification programs. Lake Reserv. Manag. 2005, 21, 73–77. [Google Scholar] [CrossRef]
- Ramirez-Castillo, F.Y.; Loera-Muro, A.; Jacques, M.; Garneau, P.; Avelar-gonzález, F.J.; Harel, J.; Guerrero-barrera, A.L. Waterborne pathogens: Detection methods and challenges. Pathogens 2015, 4, 307–334. [Google Scholar] [CrossRef] [PubMed]
- Palmer, C.J.; Bonilla, G.F.; Roll, B.; Paszkokolva, C.; Sangermano, L.R.; Fujioka, R.S. Detection of Legionella species in reclaimed water and air with the ENVIROAMP Legionella PCR kit and direct fluorescent-antibody staining. Appl. Environ. Microbiol. 1995, 61, 407–412. [Google Scholar] [CrossRef] [Green Version]
- September, S.M.; Brozel, V.S.; Venter, S.N. Diversity of nontuberculoid Mycobacterium species in biofilms of urban and semiurban drinking water distribution systems. Appl. Environ. Microbiol. 2004, 70, 7571–7573. [Google Scholar] [CrossRef] [Green Version]
- Voytek, M.A.; Ashen, J.B.; Fogerty, L.R.; Kirshtein, J.D.; Landa, E.R. Detection of Helicobacter pylori and fecal indicator bacteria in five North American rivers. J. Water Health 2005, 3, 405–422. [Google Scholar] [CrossRef] [Green Version]
- Gronewold, A.D.; Borsuk, M.E.; Wolpert, R.L.; Reckhow, K.H. An assessment of fecal indicator bacteria-based water quality standards. Environ. Sci. Technol. 2008, 42, 4676–4682. [Google Scholar] [CrossRef]
- Bradshaw, J.K.; Snyder, B.J.; Oladeinde, A.; Spidle, D.; Berrang, M.E.; Meiners-mann, R.J.; Oakley, B.; Sidle, R.C.; Sullivan, K.; Molina, M. Characterizing relationships among fecal indicator bacteria, microbial source tracking markers, and associated waterborne pathogen occurrence in stream water and sediments in a mixed land use watershed. Water Res. 2016, 101, 498–509. [Google Scholar] [CrossRef] [PubMed] [Green Version]
- United States Environmental Protection Agency. Assessment and Total Maximum Daily Load Tracking and Implementation system (ATTAINS). Available online: https://ofmpub.epa.gov/waters10/attains_index.home (accessed on 1 September 2021).
- United States Environmental Protection Agency. Guidance for 2006 Assessment, Listing and Reporting Requirements Pursuant to Sections 303(d), 305(b) and 314 of the Clean Water Act. Available online: https://www.epa.gov/sites/default/files/2015-10/documents/2006irg-report.pdf (accessed on 28 December 2021).
- Southern Hills Lakes Preliminary Evaluation and Management Plan. Wright Water Engineers (WWE): Summary Report, Prepared for the City of Springfield. 2001. Available online: https://www.springfieldmo.gov/DocumentCenter/View/3235/Southern-Hills-Report-PDF?bidId= (accessed on 28 December 2021).
- Baffaut, C. Faecal Coliform Total Maximum Daily Load for Little Sac River Watershed. FAPRI-UMC Report # 07-05. Food and Agricultural Policy Research Institute (FAPRI), University of Missouri. Missouri Department of Natural Resources Water Protection Program. 2005. Available online: https://www.fapri.missouri.edu/wp-content/uploads/2015/02/FAPRI-MU-Report-07-05.pdf (accessed on 12 November 2021).
- Owen, M.R.; Pavlowsky, R.T. Water Quality Assessment and Load Reductions for Pearson Creek, Springfield, Missouri. Final Report to the James River Basin Partnership. OEWRI Report # EDR-14-001. Ozarks Environmental and Water Resources. 2014. Available online: https://oewri.missouristate.edu/Assets/OEWRI/Final_Report_2014_PearsonCreek_WaterQuality.pdf (accessed on 12 September 2021).
- Mirza, B.S.; Owen, M.R.; Kincaid, J.C.; Pavlowsky, R.T. Bacteria Source Tracking to Support Watershed Planning, Little Sac River, Southwest Missouri. Missouri State University. 2018. Available online: https://oewri.missouristate.edu/Assets/OEWRI/Final_Report_2018_LittleSacWatershed_BacteriaSourceTracking.pdf (accessed on 20 August 2021).
- Owen, M.R.; Mirza, B.S.; Kincaid, J.C.; Roman, G.F.; Pavlowsky, R.T. Bacteria Source Tracking to Support Watershed Planning, Pearson Creek, Greene County, Missouri. Missouri State University. 2019. Available online: https://bearworks.missouristate.edu/oewri-tech/25/ (accessed on 20 August 2021).
- Missouri Department of Natural Resources (MDNR). EPA Approval Letter for Missouri’s 2020 303(d) List. Available online: https://dnr.mo.gov/document/epa-approval-letter-missouris-2020-303d-list (accessed on 2 September 2021).
- Watershed Committee of the Ozarks (WCO). Sac River Healthy Watershed Plan. 2016. Available online: https://watershedcommittee.org/wp-content/uploads/2016/12/Sac-River-Report-Booklet-web-version.pdf (accessed on 20 December 2021).
- Gentry, R.W.; McCarthy, J.; Layton, A.; McKay, L.D.; Williams, D.; Koirala, S.R.; Sayler, G.S. Escherichia Coli loading at or near base flow in a mixed-use watershed. J. Eniviron. Qual. 2006, 35, 2244–2249. [Google Scholar] [CrossRef] [PubMed]
- Davis, R.K.; Hamilton, S.; Van Brahana, J. Escherichia Coli Survival in mantled karst springs and streams, northwest Arkansas Ozarks, USA. J. Am. Water Resour. Assoc. 2007, 41, 1279–1287. [Google Scholar] [CrossRef]
- Water Quality. Rules of Department of Natural Resources Division 20-Clean Water Commission. Missouri Secretary of State: Code of State Regulation. 2019. Available online: https://www.sos.mo.gov/cmsimages/adrules/csr/current/10csr/10c20-7a.pdf (accessed on 2 December 2021).
- Owen, M.R.; Mirza, B.S.; Pursley, T.J.; Pavlowsky, R.T. Bacteria Source Tracking Assessment of Sequiota Spring; Missouri State University: Springfield, MO, USA, 2021. [Google Scholar]
- Thomson, K.C. Geology of Greene County; Watershed Management Coordinating Committee: Springfield, MO, USA, 1986; p. 87. [Google Scholar]
- Vineyard, J.D.; Feder, G.L. Springs of Missouri. Missouri Department of Natural Resources, Division of Geology and Land Survey. Water Resources Report # 29. US Geological Survey. 1982. Available online: https://share.mo.gov/nr/mgs/MGSData/Books/Water%20Resources/Springs%20of%20Missouri/WR29revised.pdf (accessed on 3 November 2021).
- Mayhood, P.; Mirza, B.S. Soybean root nodule and rhizosphere microbiome: Distribution of rhizobial and nonrhizobial endophytes. Appl. Environ. Microbiol. 2021, 87, e02884-20. [Google Scholar] [CrossRef] [PubMed]
- Fish, J.A.; Chai, B.; Wang, Q.; Sun, Y.; Brown, C.T.; Tiedje, J.M.; Cole, J.R. FunGene: The functional gene pipeline and repository. Front. Microbiol. 2013, 4, 291. [Google Scholar] [CrossRef] [PubMed] [Green Version]
- Wang, Q.; Garrity, G.M.; Tiedje, J.M.; Cole, J.R. Naïve bayesian classifier for the rapid assignment of rRNA sequences into the new bacterial taxonomy. Appl. Environ. Microbiol. 2007, 73, 5261–5267. [Google Scholar] [CrossRef] [PubMed] [Green Version]
- Schloss, P.D.; Westcott, S.L.; Ryabin, T.; Hall, J.R.; Hartmann, M.; Hollister, E.B.; Lesniewski, R.A.; Oakley, B.B.; Parks, D.H.; Robinson, C.J.; et al. Introducing mothur: Open-source, platform-independent, community-supported software for describing and comparing microbial communities. Appl. Environ. Microbiol. 2009, 75, 7537–7541. [Google Scholar] [CrossRef] [Green Version]
- Kumar, S.; Stecher, G.; Li, M.; Knyaz, C.; Tamura, K. MEGA X: Molecular evolutionary genetics analysis across computing platforms. Mol. Biol. Evol. 2018, 35, 1547–1549. [Google Scholar] [CrossRef]
- R Core Team. R: A Language and Environment for Statistical Computing; R Foundation for Statistical Computing: Vienna, Austria, 2019. [Google Scholar]
- Legionella Control International. How Many Legionella Species Exist and Which Ones Cause Legionnaires’ Disease? Warren Bruce Court and Warren Bruce Road, Manchester M17 1LB United Kingdom. 2021. Available online: https://legionellacontrol.com/legionella/legionella-species (accessed on 7 September 2021).
- United States Environment Protection Agency. Technologies for Legionella Control in Premise Plumbing Systems: Scientific Literature Review. 2016. Available online: https://www.epa.gov/sites/production/files/2016-09/documents/legionella_document_master_september_2016_final.pdf (accessed on 13 September 2021).
- Muder, R.R.; Yu, V.L. Infection due to Legionella species other than L. pneumophila. Clin. Infect. Dis. 2002, 35, 990–998. [Google Scholar] [CrossRef] [Green Version]
- Ricketts, K.D.; Charlett, A.; Gelb, D.; Lane, C.; Lee, J.V.; Joseph, C.A. Weather patterns and Legionnaires’ disease: A meteorological study. Epidemiol. Infect. 2009, 137, 1003–1012. [Google Scholar] [CrossRef] [Green Version]
- Simmering, J.E.; Polgreen, L.A.; Hornick, D.B.; Sewell, D.K.; Polgreen, P.M. Weather-dependent risk for Legionnaires’ disease, United States. Emerg. Infect. Dis. 2017, 23, 1843–1851. [Google Scholar] [CrossRef] [PubMed]
- Centers for Disease Control and Prevention. National Notifiable Infectious Diseases and Conditions, United States: Annual Tables. 2016. Available online: https://wonder.cdc.gov/nndss/static/2016/annual/2016-table2h.html (accessed on 7 September 2021).
- Parthuisot, N.; West, N.J.; Lebaron, P.; Baudart, J. High diversity and abundance of Legionella spp. in a pristine river and impact of seasonal and anthropogenic effects. Appl. Environ. Microbiol. 2010, 76, 8201–8210. [Google Scholar] [CrossRef] [PubMed] [Green Version]
- Newton, H.J.; Ang, D.K.Y.; Driel, I.R.; Hartland, E.L. Molecular pathogenesis of infections caused by Legionella pneumophila. Clin. Microbiol. Rev. 2010, 23, 274–298. [Google Scholar] [CrossRef] [PubMed] [Green Version]
- Atlas, R.M. Legionella: From environmental habitats to disease pathology, detection and control. Environ. Microbiol. 1999, 1, 283–293. [Google Scholar] [CrossRef] [PubMed]
- Fields, B.S.; Benson, R.S.; Besser, R.E. Legionella and Legionnaires’s disease: 25 years of investigation. Clin. Microbiol. Rev. 2002, 15, 506–526. [Google Scholar] [CrossRef] [PubMed] [Green Version]
- Legionella (Legionnaires’ Disease and Pontiac Fever). Centers for Disease Control and Prevention. 2018. Available online: https://www.cdc.gov/legionella/fastfacts.html (accessed on 7 September 2021).
- Burstein, D.; Amaro, T.Z.; Lifshitz, Z.; Cohen, O.; Gilbert, J.A.; Pupko, T.; Shuman, H.A.; Segal, G. Genomic analysis of 38 Legionella species identifies large and diverse effector repertoires. Nat. Genet. 2006, 48, 167–175. [Google Scholar] [CrossRef] [PubMed] [Green Version]
- Kabwama, S.N.; Bulage, L.; Nsubuga, F.; Pande, G.; Oguttu, D.W.; Mafigiri, R.; Kihembo, C.; Kwesiga, B.; Masiira, B.; Okullo, A.E.; et al. A large and persistent outbreak of typhoid fever caused by consuming contaminated water and street-vended beverages: Kampala, Uganda, January–June 2015. BMC Public Health 2017, 17, 23. [Google Scholar] [CrossRef] [Green Version]
- Coburn, B.; Grassl, G.A.; Finlay, B.B. Salmonella, the host and disease: A brief review. Immunol. Cell Biol. 2007, 85, 112–118. [Google Scholar] [CrossRef]
- Ao, T.T.; Feasey, N.A.; Gordon, M.A.; Keddy, K.H.; Angulo, F.J.; Crump, J.A. Global Burden of invasive Nontyphoidal Salmonella Disease, 2010. Emerg. Infect. Dis. 2015, 21, 941–949. [Google Scholar] [CrossRef] [PubMed] [Green Version]
- Khalil, I.A.; Troeger, C.; Blacker, B.F.; Rao, P.C.; Brown, A.; Atherly, D.E.; Brewer, T.G.; Engmann, C.M.; Houpt, E.R.; Kang, G.; et al. Morbidity and mortality due to Shigella and enterotoxigenic Escherichia coli diarrhoea: The Global Burden of Disease Study 1990–2016. Lancet Infect. Dis. 2018, 18, 1229–1240. [Google Scholar] [CrossRef] [Green Version]
- Ragupathi, N.D.; Sethuvel, D.M.; Inbanathan, F.Y.; Veeraraghavan, B. Accurate differentiation of Escherichia coli and Shigella serogroups: Challenges and strategies. New Microbes New Infect. 2018, 21, 58–62. [Google Scholar] [CrossRef] [PubMed]
- Janda, J.M.; Abbott, S.L.; Mclver, C.J. Plesiomonas shigelloides Revisited. Clin. Microbiol. Rev. 2016, 29, 349–374. [Google Scholar] [CrossRef] [PubMed] [Green Version]
- Tacket, C.O.; Harris, N.; Allard, J.; Nolan, C.; Nissinen, A.; Quan, T.; Cohen, M.L. An outbreak of Yersinia enterocolitica infections caused by contaminated tofu (soybean curd). Am. J. Epidemiol. 1985, 121, 705–711. [Google Scholar] [CrossRef] [PubMed]
- Thompson, J.S.; Gravel, M.J. Family outbreak of gastroenteritis due to Yersinia enterocolitica serotype 0:3 from well water. Can. J. Microbiol. 1986, 32, 700–701. [Google Scholar] [CrossRef] [PubMed]
- Galindo, C.L.; Rosenweig, J.A.; Kirtley, M.L.; Chopra, A.K. Pathogenesis of Y. enterocolitica and Y. pseudotuberculosis in Human Yersiniosis. J. Pathog. 2011, 2011, 1–16. [Google Scholar] [CrossRef] [Green Version]
- Renter, D.G.; Gnad, D.P.; Sargeant, J.M.; Hygnstrom, S.E. Prevalence and Serovars of Salmonella in the feces of free-ranging white-tailed deer (Odocoileus virginianus) in Nebraska. J. Wildl. Dis. 2006, 42, 699–703. [Google Scholar] [CrossRef] [Green Version]
- Skov, M.N.; Madsen, J.J.; Rahbek, C.; Lodak, J.; Jespersen, J.B.; Jørgensen, J.C.; Dietz, H.H.; Chriél, M.; Baggesen, D.L. Transmission of Salmonella between wildlife and meat-production animals in Denmark. J. Appl. Microbiol. 2008, 105, 1558–1568. [Google Scholar] [CrossRef]
- Rouffaer, L.O.; Baert, K.; Van den Abeele, A.M.; Cox, I.; Vanantwerpen, G.; De Zutter, L.; Strubbe, D.; Vranckx, K.; Lens, L.; Haesebrouck, F.; et al. Low prevalence of human enteropathogenic Yersinia spp. in brown rats (Rattus norvegicus) in Flanders. PLoS ONE 2017, 12, e0175648. [Google Scholar] [CrossRef] [Green Version]
- Gaertner, J.P.; Hahn, D.; Jackson, J.; Forstner, M.R.J.; Rose, F.L. Detection of Salmonellae in Captive and Free-Ranging Turtles Using Enrichment Culture and Polymerase Chain Reaction. J. Herpetol. 2008, 42, 223–231. [Google Scholar] [CrossRef]
- Gaertner, J.; Wheeler, P.E.; Obafemi, S.; Valdez, J.; Forstner, M.R.J.; Bonner, T.H.; Hahn, D. Detection of Salmonellae from Fish in a Natural River System. J. Aquat. Anim. Health 2011, 20, 150–157. [Google Scholar] [CrossRef]
- Arnade, L.J. Seasonal correlation of well contamination and septic tank distance. Groundwater 1999, 37, 920–923. [Google Scholar] [CrossRef]
- Gallert, C.; Fund, K.; Winter, J. Antibiotic resistance of bacteria in raw and biologically treated sewage and in groundwater below leaking sewers. Appl. Microbiol. Biotechnol. 2005, 69, 106–112. [Google Scholar] [CrossRef] [PubMed]
- Buckalew, D.W.; Hartman, L.J.; Grimsley, G.A.; Martin, A.E.; Register, K.M. A long-term study comparing membrane filtration with Colilert® defined substrates in detecting fecal coliforms and Escherichia coli in natural waters. J. Environ. Manag. 2006, 80, 191–197. [Google Scholar] [CrossRef] [PubMed]
- Field, K.G.; Samadpour, M. Fecal source tracking, the indicator paradigm, and managing water quality. Water Res. 2007, 41, 3517–3538. [Google Scholar] [CrossRef] [PubMed]
- Qijia Cui, Q.; Huang, Y.; Wang, H.; Fang, T. Diversity and abundance of bacterial pathogens in urban rivers impacted by domestic sewage. Environ. Pollut. 2019, 249, 24–35. [Google Scholar] [CrossRef]
- Mirza, B.S.; Potisap, C.; Nüsslein, K.; Bohannan, B.J.M.; Rodrigues, J.L.M. Response of free-living nitrogen-fixing microorganisms to land use change in the Amazon rainforest. Appl. Environ. Microbiol. 2014, 80, 281–288. [Google Scholar] [CrossRef] [Green Version]
Figure 1.
Sampling sites demonstrating urbanization (indicated by the red color in the map). Five sampling sites in Little Sac watershed (golden circles), four site in Pearson Creek (yellow squares) and Sequiota Spring (aqua triangle) in the James River Basin were selected for Next-Gen DNA sequencing. The three sites (PR_102, PC_Cat and Seq spring) that displayed a high abundance of pathogen-related sequences are marked with black asterisk ( ![Diversity 14 00096 i001]() ). Blue arrows indicate the direction of water flow.
). Blue arrows indicate the direction of water flow.
 ). Blue arrows indicate the direction of water flow.
Figure 1.
Sampling sites demonstrating urbanization (indicated by the red color in the map). Five sampling sites in Little Sac watershed (golden circles), four site in Pearson Creek (yellow squares) and Sequiota Spring (aqua triangle) in the James River Basin were selected for Next-Gen DNA sequencing. The three sites (PR_102, PC_Cat and Seq spring) that displayed a high abundance of pathogen-related sequences are marked with black asterisk ( ![Diversity 14 00096 i001]() ). Blue arrows indicate the direction of water flow.
). Blue arrows indicate the direction of water flow.
). Blue arrows indicate the direction of water flow.
Figure 2.
Neighbor-joining phylogenetic tree of partial 16S rRNA gene sequences (370 bp) related to the Legionellaceae family from three impaired watersheds. Only OTUs (operational taxonomic units) containing ≥ 50 sequences were used in this analysis. The DNA sequences of some related pathogenic (*) and non-pathogenic species within the Legionellaceae family were also included in the analysis. The size (diameter) of the pie chart is proportional to the number of sequences within a cluster. The size of a pie chart can only demonstrate the variation in sequences within a given watershed, e.g., a pie chart for the LSW site cannot be compared with a pie chart from Pearson creek. Numbers at the node reflect the bootstrap values.

Figure 3.
Neighbor-joining phylogenetic tree of partial 16S rRNA gene sequences (370 bp) related to the Enterobacteriaceae family from three impaired watersheds. Only OTUs containing ≥50 sequences were used in this analysis. The DNA sequences of some related pathogenic species within the Enterobacteriaceae family were also included in the analysis. The size of the pie chart is proportional to the number of sequences within a cluster. The size of a pie chart can only demonstrate the variation in sequences within a given watershed, e.g., a pie chart from the LSW site cannot be compared with pie charts from Pearson creek. Numbers at the node reflect the bootstrap values.

Figure 4.
Neighbor-joining phylogenetic tree of partial 16S rRNA gene sequences (370 bp) related to the Bacteroidaceae family from three impaired watersheds. Only OTUs (operational taxonomic units) containing ≥50 sequences were used in this analysis. The DNA sequences of Bacteroides dorei that is used a marker organism for human fecal contamination in water was also included in the phylogenetic analysis. The size of the pie chart is proportional to the number of sequences within a cluster. The size of a pie chart can only demonstrate the variation in sequences within a given watershed, e.g., a pie chart from the LSW site cannot be compared with pie charts from Pearson creek due to the differences in the sampling time and number of DNA sequences retrieved across different watersheds. Numbers at the node reflect the bootstrap values.


Table 1.
The overall bacterial species richness and diversity across different sites within different sampling locations.
Table 1.
The overall bacterial species richness and diversity across different sites within different sampling locations.
| Watershed | Sample ID | Average Number of Sequences | Chao 1 Estimator | Shannon Diversity |
|---|---|---|---|---|
| Little Sac | ||||
| AC_560 | 18,288 ± 1138 | 31,629 ± 1791 | 6.96 ± 0.34 | |
| LS_068 | 15,848 ± 2293 | 27,577 ± 5377 | 6.81 ± 0.11 | |
| LS_129 | 14,996 ± 6796 | 30,231 ± 14,968 | 7.04 ± 0.24 | |
| LS_215 | 17,760 ± 3539 | 34,917 ± 7637 | 7.36 ± 0.15 | |
| PR_102 | 21,641 ± 2829 | 37,612 ± 3970 | 7.83 ± 0.17 | |
| Pearson Creek | ||||
| PC_148 | 51,910 ± 9567 | 73,365 ± 13,478 | 7.42 ± 0.20 | |
| PC_193 | 63,433 ± 11,591 | 87,424 ± 15,577 | 7.44 ± 0.20 | |
| PC_Cat | 42,314 ± 8075 | 64,108 ± 14,019 | 7.87 ± 0.22 | |
| PC_SHYY | 37,883 ± 5665 | 52,247 ± 6779 | 7.08 ± 0.21 | |
| Sequiota Spring | ||||
| Summer 2019 | 35,590 ± 1693 | 18,086 ± 2842 | 6.33 ± 0.12 | |
| Winter 2019 | 49,537 ± 4415 | 9623 ± 373 | 4.32 ± 0.17 | |
| Summer 2020 | 44,803 ± 3390 | 22,218 ± 2802 | 6.77 ± 0.18 |
Publisher’s Note: MDPI stays neutral with regard to jurisdictional claims in published maps and institutional affiliations. |
© 2022 by the authors. Licensee MDPI, Basel, Switzerland. This article is an open access article distributed under the terms and conditions of the Creative Commons Attribution (CC BY) license (https://creativecommons.org/licenses/by/4.0/).
Share and Cite
MDPI and ACS Style
Kincaid, J.C.; Owen, M.R.; Pavlowsky, R.T.; Mirza, B.S. Microbiome of Bacterially Impaired Watersheds: Distribution of Potential Bacterial Pathogens. Diversity 2022, 14, 96. https://0-doi-org.brum.beds.ac.uk/10.3390/d14020096
AMA Style
Kincaid JC, Owen MR, Pavlowsky RT, Mirza BS. Microbiome of Bacterially Impaired Watersheds: Distribution of Potential Bacterial Pathogens. Diversity. 2022; 14(2):96. https://0-doi-org.brum.beds.ac.uk/10.3390/d14020096
Chicago/Turabian StyleKincaid, John C., Marc R. Owen, Robert T. Pavlowsky, and Babur S. Mirza. 2022. "Microbiome of Bacterially Impaired Watersheds: Distribution of Potential Bacterial Pathogens" Diversity 14, no. 2: 96. https://0-doi-org.brum.beds.ac.uk/10.3390/d14020096
Note that from the first issue of 2016, this journal uses article numbers instead of page numbers. See further details here.