
New Comparative Data on the Long Bone Microstructure of Large Extant and Extinct Flightless Birds


1
Department of Biological Sciences, University of Cape Town, Private Bag X3, Rondebosch 7701, South Africa
2
Stiftung Schloss Friedenstein, Schloss Friedenstein, Schlossplatz 1, 99867 Gotha, Germany
*
Author to whom correspondence should be addressed.
Diversity 2022, 14(4), 298; https://0-doi-org.brum.beds.ac.uk/10.3390/d14040298
Submission received: 31 January 2022
/
Revised: 11 March 2022
/
Accepted: 19 March 2022
/
Published: 15 April 2022
(This article belongs to the Special Issue Evolution and Palaeobiology of Flightless Birds)
Abstract
:Here, we investigate whether bone microanatomy can be used to infer the locomotion mode (cursorial vs. graviportal) of large terrestrial birds. We also reexamine, or describe for the first time, the bone histology of several large extant and extinct flightless birds to (i) document the histovariability between skeletal elements of the hindlimb; (ii) improve our knowledge of the histological diversity of large flightless birds; (iii) and reassess previous hypotheses pertaining to the growth strategies of modern palaeognaths. Our results show that large extinct terrestrial birds, inferred as graviportal based on hindlimb proportions, also have thicker diaphyseal cortices and/or more bony trabeculae in the medullary region than cursorial birds. We also report for the first time the occurrence of growth marks (not associated with an outer circumferential layer-OCL) in the cortices of several extant ratites. These observations support earlier hypotheses that flexible growth patterns can be present in birds when selection pressures for rapid growth within a single year are absent. We also document the occurrence of an OCL in several skeletally mature ratites. Here, the high incidence of pathologies among the modern species is attributed to the fact that these individuals were probably long-lived zoo specimens.
1. Introduction
Large flightless birds are represented today by members of the palaeognaths, which include ostriches, emus, rheas, and cassowaries. Despite having different habitats, body sizes, and hindlimb proportions, all these birds are considered cursorial, although there is a continuum between their locomotor styles [1]. Cursoriality refers to the capability of a terrestrial animal to have sustained running [2,3,4]. Studies have shown that the degree of cursoriality is correlated to the relative proportions of the hindlimb elements [5,6,7,8], and, more specifically the length-width ratio (i.e., Lg/Dm) of the tarsometatarsus [9]. Thus, ostriches, with their long and slender hindlimbs, are the largest but also the fastest-running living ratites [1], while cassowaries (such as Casuarius casuarius) that are more heavily built with the shortest and widest tarsometatarsus among extant cursorial birds [9], are also the slowest runners among their relatives [1]. Birds having a slow-walking type of locomotion (also often referred to as having “graviportal” locomotion; [9,10]) are represented by large terrestrial extinct forms [9]. These birds are hypothesized to have been capable of running, but only at a slow pace and for short durations [11,12,13]. Among the extinct terrestrial birds, several groups inferred as “graviportal” (e.g., [9]) are known from the Cenozoic fossil record, such as the Gastornithidae and Dromornithidae (Neognathae; [9,14,15,16,17,18]), and two recently extinct ratite clades [19]: the New-Zealand moas (Dinornithiformes, Palaeognathae) and the Madagascan elephant birds (Aepyornithiformes, Palaeognathae).
However, it is often difficult to infer the locomotion mode of avian fossil specimens since, more often than not, the osteological material is fragmentary. For example, Storer’s [5] method to deduce the locomotory style of extinct birds ideally requires linear measurements of three complete elements of the same hindlimb for a single individual. The model proposed by Angst et al. [9] also relies on the measurement of complete and undistorted tarsometatarsi, i.e., the ratio Lg/Dm of the tarsometatarsus is <12 for birds inferred as “graviportal” and hence, slow walking. However, this element is often incomplete or even missing in the paleontological collections for many giant fossil terrestrial birds. Thus, it is often challenging to decipher the locomotion of extinct species using the current available methods. For example, in the case of Gargantuavis philoinos from the Late Cretaceous of Europe [10], only the femur is known from its hindlimb, and its locomotion has therefore been estimated based on the morphology of its synsacrum [10]. Inferences of the locomotor habits of Gargantuavis are therefore not directly comparable with the results drawn for other birds. Another example concerns Remiornis, a large terrestrial bird from the Upper Palaeocene of France [20], for which only a partial tarsometatarsus, a coracoid, and a thoracic vertebra are known. Thus, for these common cases of incomplete skeletal remains of large terrestrial birds, it would be useful to have a different estimation method of locomotory habits that does not require complete hindlimb elements.
In a comparative and standardized framework, the long limb bone mid-diaphyseal microanatomy and cross-sectional geometry are known to provide insights into the ecology and/or locomotor activity (and biomechanical loading) of tetrapods (e.g., [21]). Hence, several studies reported that cursorial terrestrial animals generally have tubular limb bones, with open medullary cavities and thicker bone walls than their flying relatives [21,22,23,24]. Moreover, a recent study by Houssaye et al. [25] showed that graviportal tetrapods generally exhibit thicker compact cortices and more trabeculae in the medullary region of the diaphysis than their cursorial counterparts. However, to date, no comparative study has been carried out to investigate the relationship between locomotion patterns and hindlimb bone microanatomy in large flightless birds.
Furthermore, although isolated studies of the limb bone microstructure of ratites and other Cenozoic terrestrial birds exist, their results have never been considered within a comparative framework. A notable exception is a study by Legendre et al. [26], where the authors sampled several large terrestrial birds, including all extant ratite genera, as well as Dinornithidae and Aepyornithidae. However, in the latter study, the researchers mostly focused on quantitative histological parameters related to the vascularization pattern and osteocyte lacunae size and density and did not discuss microanatomical differences between these animals.
Most Neornithes (modern birds including Palaeognathae and Neognathae), are considered to have a fast and uninterrupted growth strategy (with deposition of uninterrupted, well-vascularized fibrolamellar bone tissue (e.g., [27]). Among these birds, skeletal maturity is achieved in less than a year, as opposed to the discontinuous and prolonged growth of non-avian dinosaurs and most basal, non-ornithurine birds [27,28,29,30,31,32,33,34]. With the exception of a few modern species (such as the kiwi; see [35]), growth marks are thus usually lacking in the cortices of birds, although some closely spaced lines of arrested growth (LAGs) can sometimes be observed in the avian outer circumferential layer (abbreviated OCL [36,37]; and equivalent to the fundamental external system observed in tetrapods in general [30,38,39,40]). Thus, most extant palaeognaths (basal among modern birds), such as tinamous, cassowaries, emus, rheas, and ostriches, have been described as lacking growth marks in their limb bone cortices because they are considered to reach skeletal maturity within a single year (e.g., [26,28,30,35,41,42,43,44,45]). In addition, previous studies (e.g., [28,29,46]) pointed out that the OCL was poorly developed to absent in extant ratites, such as Struthio and Casuarius. It appears that kiwis (Apterygidae), the smallest extant ratites endemic to New Zealand, are the exception in presenting LAGs in their long bone cortices [35], which led to the deduction that these unique birds experience protracted growth and delayed sexual maturity. LAGs have also been observed in the cortex of extinct large ratites, such as some Dinornithidae [26,30,44,45], and Aepyornithidae [18,33,47]. Multiple growth marks have also been documented in large dromornithids such as Dromornis [15] and Genyornis [48], suggesting a similar protracted growth for all these giant extinct terrestrial birds. Finally, such growth marks have been reported in Gargantuavis [32], although its avian phylogenetic affinities are still debated (e.g., [49,50,51]).
Protracted growth strategies are also evident in the extinct solitaire of Rodrigues Pezophaps solitarius [52]. Such extended growth dynamics have been interpreted as a convergent adaptive strategy to unusual environmental factors and insular life where there are relaxed pressures for rapid growth [33,35,45,53,54]. Finally, in extant neognaths, a single LAG has been observed in the cortex of a parrot metatarsal [46] and in the limb bones of the king penguin Aptenodytes patagonicus [55]; the latter having a well-studied, discontinuous growth during the austral winter, with a fasting period associated with a pause of skeletal growth [56,57,58]). Finally, a LAG has also been observed in a tibia of the giant extinct Eocene bird Gastornis (Diatryma is now considered as synonymous of Gastornis [30,44]).
In this preliminary comparative study, we investigate whether bone microanatomy could be used to infer the locomotion mode (i.e., cursorial vs. “graviportal”) of large terrestrial birds as a complement or alternative to previously proposed methods (when the fossil material is fragmentary). We also describe the bone histology of some extant and extinct large terrestrial birds, in order to (i) understand the histovariability between the different skeletal elements of the hindlimb (femur, tibiotarsus, tarsometatarsus); (ii) improve our knowledge of terrestrial bird bone microstructural diversity; (iii) and reassess previous hypotheses pertaining to the growth strategies of some palaeognaths.
2. Materials and Methods
2.1. Biological Sample
To assess the inter-elements as well as inter-specific histovariability in large terrestrial birds, we sampled 47 hindlimb bones (femora, tibiotarsi and tarsometatarsi) of at least seven extant and extinct bird genera (Table 1).
Our sample encompassed the diversity of the largest extant terrestrial birds represented by the ratites (Palaeognathae) and included the common ostrich Struthio camelus, the greater rhea Rhea americana, the emu Dromaius novaehollandiae, and the Southern cassowary Casuarius casuarius (Table 1). Our (sub)fossil material comprised three different groups of Cenozoic giant terrestrial birds: (i) limb bones from the recently extinct elephant birds from Madagascar, Aepyornithidae (Palaeognathae); (ii) limb bones from the giant moas (Dinornithidae, Palaeognathae) from New Zealand; (iii) and bone fragments from Gastornis (Neognathae), a giant flightless bird from the Paleocene and Eocene of Europe, North Africa, and China [14,59].
All the bones sampled in this study were derived from specimens housed in the collections of paleontology and comparative anatomy of the Muséum National d’Histoire Naturelle (MNHN, Paris, France). The aepyornithid material was undiagnosed when we originally sampled it, however, Hansford and Turvey [60] subsequently undertook a comprehensive taxonomic assessment of all the aepyornithid specimens. In our earlier study of the aepyornithid bone histology [33], James Hansford assisted with the taxonomic identification of our aepyornithid material. Thus, our sampled aepyornithid material (Table 1) comprised of two femora (Ae-fm 2 & 3) that have been identified as belonging to Aepyornis maximus, while one femur (Ae-fm-1), four tibiotarsi (Ae-tb-1, Ae-tb-5, Ae-tb-6 and Ae-tb-8) and two tarsometatarsi (Ae-tm-1 & 2) are considered to belong to Vorombe titan. Four tarsometarsi remained undiagnosed because of insufficient data (see [33] for more details). For the (sub)fossil material of Dinornithidae, identification at the species level was not possible. Provenance of this material was also not recorded in the catalogues of the MNHN, and it is likely that some extant specimens were captive zoo individuals.
2.2. Thin-Section Preparation and Histological Descriptions
When possible, we sampled the mid-diaphyseal complete cross-sections of the main hindlimb bones involved in terrestrial locomotion: femur, tibiotarsus and tarsometatarsus (Table 1). In some cases, the (sub)fossil material was either too fragmentary or rare to acquire complete mid-diaphyseal cross-sections. We thus sampled bone cores at the mid-diaphyseal level using the technique described in Stein and Sander [61]. This sampling method leads to the least possible damage to the overall anatomy of skeletal elements and is frequently used in paleohistological studies (e.g., [62,63,64]).
Thin sections were prepared at the MNHN (Paris, France) and at the Biological Sciences Department of the University of Cape Town (Cape Town, South Africa) following standard procedures described in Chinsamy and Raath [65] and Padian and Lamm [39]. The histological descriptions follow the terminology used in Francillon-Vieillot et al. [66] and Chinsamy-Turan [31].
Note that since the histology of the aepyornithid material has already been comprehensively described by our team [33], we mostly report on its global compactness in this manuscript.
2.3. Simple Linear Measurements and Global Compactness
Each bone was measured and photographed before thin sectioning or core drilling. For each skeletal element, we measured, when possible, its maximal length (Lg) between the proximal and distal epiphyses. For comparison with the study of Angst et al. [9], we also calculated the ratio between the maximal length of the tarsometatarsus and the minimum shaft diameter (Dm) in dorsal or ventral view (Table 1).
Microanatomical investigations were carried out on a sub-sample of extant and extinct bird specimens (21 skeletal elements), when complete cross-sections were available (as shown in Figure 1, Figure 2, Figure 3, Figure 4, Figure 5, Figure 6, Figure 7, Figure 8, Figure 9 and Figure 10), and the skeletal elements did not show signs of bone pathology drastically affecting the overall cortical thickness (Table 2). The complete cross-sections were transformed into binary images to obtain their global compactness values (Comp.) using Bone Profiler [67]. In some cases (especially sub-fossil specimens), the obtained global compactness values are underestimated, since some fragile bone trabeculae occupying the medullary region broke during the sampling process. We also recorded the presence or absence of bone trabeculae in the mid-diaphyseal region of each sampled element, since this has been linked to a graviportal adaptation in some large amniotes [25].
3. Results
3.1. Tarsometatarsi Proportions and Type of Locomotion
As indicated in Table 1, both Aepyornithid tarsometatarsi have Lg/Dm ratios of 5.26 and 5.46, and the ratio for the Dinornis tarsometatarsus equals 5.60. All extant cursorial birds sampled have a Lg/Dm of the tarsometatarsus >12; with values ranging from 12.5 for Cc-tm-2 of Casuarius casuarius to 21.6 for the Dn-tm-1 of Dromaius novaehollandiae (Table 1). It is worth noting that both sampled tarsometatarsi of Casuarius casuarius have the lowest ratios among cursorial birds.
3.2. Microanatomical Observations
Our results show that the global compactness of a given long bone varies between individuals of the same species. In the rhea, when a given element was sampled from two different-sized individuals (when available, Lg was used as a proxy for size; Table 1), the largest (and also oldest, based on bone histology; see below) specimen shows thicker bone walls and thus higher compactness values than the smallest one (e.g., specimens Ra-tb-1 and Ra-tb-2; Figure 3; Table 2). The reverse pattern was observed for the tarsometatarsi of the emu and the femora of the ostrich (e.g., specimens Sc-fm-1 and Sc-fm-2; Table 1 and Table 2).
However, even though our sample size is small, our results suggest that there is a proximo-distal increase of bone compactness along the hindlimb of extant ratites (Table 2). Thus, when the average compactness values are considered, the femur is always less compact than the tibiotarsus, and the tibiotarsus less compact than the tarsometatarsus, in each extant ratite sampled (Table 2). This is not exactly the case in the sub-fossil material sampled. The average compactness of the femur (0.449) is lower than the compactness of the sampled tibiotarsus (0.785) and tarsometatarsus (0.706) in the Aepyornithidae, although the tibiotarsus has a slightly higher compactness value than the tarsometatarsus (Table 2). The same pattern is observed between the sampled femur (Comp. = 0.741) and tibiotarsus (Comp. = 0.733) of Dinornithidae. Overall, based on this preliminary study of the link between locomotion and bone microanatomy, it seems that graviportal birds (Aepyornithidae and Dinornithidae) have higher average compactness values than their extant cursorial relatives (Table 2). Finally, the compactness value of the femur (0.741) of the sampled Dinornithidae is higher than for any other individual considered in this study.
Regarding the presence of bone trabeculae in the mid-diaphyseal region, only the emu Dromaius novaehollandiae shows well-defined trabeculae in its femur and, to some extent, in its tarsometatarsus (Figure 3A,H). One femur of Struthio camelus presents structures in the perimedullary region that could correspond to small, non-pathological (probably broken) trabeculae (Figure 5A). In our sub-fossil sample, the femur of Dinornis (Di-fm-1) does not show any bone trabeculae in the medullary region (Figure 9A). Most sampled bones of Aepyornithidae show a network of thin bone trabeculae in the medullary region (Figure 7 and Figure 8; some sections show little or no trabeculae, but this is an artifact, i.e., trabeculae broke during the sampling process and where observed during sampling).
3.3. Histological Descriptions
3.3.1. Extant Ratites
Casuarius casuarius (Southern cassowary–Figure 1 and Figure 2)—Two femora of the Southern cassowary were sampled at the mid-diaphyseal level. Whereas femur Cc-fm-1 shows normal cortical tissues (Figure 1A), the contralateral element Cc-fm-2 presents unusual pathological tissues reminiscent of avian osteopetrosis [68] on both the endosteal margin and the periosteal surface (Figure 1B,F). The bone histology of Cc-fm-2 is thus abnormal, and this bone was not further considered for microanatomical comparisons.
The left femur Cc-fm-1 (Figure 1A) is 224 mm in length, and the maximal diameter of the mid-diaphyseal cross-section is 29 mm. A thin inner circumferential layer (ICL) of endosteally formed lamellar bone bordered the medullary cavity. The deep cortex is partly remodeled with several generations of longitudinal secondary osteons. However, most of the mid-cortex is formed of a primary laminar to the reticular fibrolamellar bone, with only sparse secondary osteons (Figure 1C,D), and there is a tendency towards a decrease in vascularization towards the periphery of the bone (Figure 1C,D), attesting of a reduction of depositional rate. From the mid-cortical region to the periosteal surface, four lines of arrested growth (LAGs) interrupt the well-vascularized fibrolamellar bone tissue (Figure 1C,D). The fourth LAG (closest to the periosteal surface) seems to mark the onset of the OCL (Figure 1D); a layer of avascular parallel fibered to lamellar bone interrupted by up to 6 closely spaced LAGs at the periphery of the bone (Figure 1D). Note that a region of the section is remodeled up to the periosteal surface, suggesting a zone of muscle or ligament insertion (Figure 1E). All these histological features suggest that this bone belonged to a somatically mature individual.
Two tibiotarsi (Cc-tb-1 and CC-tb-2) of relatively the same size and belonging to the same individual were sampled. Both skeletal elements present small amounts of endosteal and periosteal pathological tissues in parts of the sections (Figure 2A,B,D). In both elements, the cortex is mostly primary and composed of a well-vascularized laminar or reticular (depending on the region of the sections) fibro-lamellar bone (Figure 2B–D). In both elements, only a restricted region of the cortex is remodeled up to the surface, suggesting a zone of muscle insertion. Additionally, they both show several LAGs are visible in the fibro-lamellar cortex, attesting to an interrupted growth through ontogeny (Figure 2C,D). As in the femur Cc-fm-1, an OCL, with closely spaced LAGs (Figure 2C, arrowheads), is also visible in the outermost cortex of both elements.
Periosteally cc-tb-2 shows a distinctive change in the bone tissue just under the periosteal surface. The latter appears to be more richly vascularized than the tissue just preceding this deposition, and the vascular canals tend to be longitudinally organized, as opposed to the more laminar organization evident in the earlier-formed bone tissue (Figure 2B). These findings suggest that the most recently formed periosteal bone tissue and the endosteal tissue are pathological [68].
Two similar-sized tarsometatarsi belonging to different individuals were sampled (Table 1) and present similar histology. In both elements, the primary bone tissue shows extensive remodeling and in some parts, the cortex-dense Haversian bone tissue extends right up to the bone surface. In both elements, an unusual, thick layer of endosteal bone has been deposited along the perimedullary margin (Figure 2E,F).
Dromaius novaehollandiae (common emu–Figure 3)—Two different-sized femora that show similar bone histology (Dn-fm-1 and Dn-fm-2) were sampled for this species (Table 1). Remnants of slender bone trabeculae extend into the medullary cavity (Figure 3A), which is partially bordered by a thin layer of endosteal lamellar bone. In both elements, most of the cortex is composed of highly vascularized reticular fibrolamellar bone, with some patches of Haversian tissue. Both elements present a slow-down of the deposition rate towards the periphery, which signals the presence of an OCL composed of parallel-fibered to lamellar bone tissue interrupted by several and closely spaced LAGs (Figure 3B). In a localized region of the outermost cortex of Dn-fm-2, a band of vascularized and partly remodeled tissue is intercalated within the OCL, suggesting a localized increase in bone rate deposition when the animal had already reached skeletal maturity (Figure 3C). Numerous Sharpey’s fibers running obliquely to the bone surface are visible throughout the primary bone in both sections (Figure 3B).
Two similar-sized tibiotarsi (Table 1) belonging to different individuals were sampled and exhibited different histologies. Dn-tb-1 presents an unusual radially organized bone tissue on its endosteal margin (Figure 3C,D), an uneven periosteal surface, as well as resorption cavities throughout the cortex (Figure 3C,D). These features affect its overall cortical thickness and this skeletal element was therefore not considered for microanatomical comparisons. Dn-tb-2 shows a more homogeneous cortical thickness (Figure 3E) and overall cortical histology (Figure 3F,G). Its cross-section was taken close to the initial center of ossification and thus encloses the nutrient canal (Figure 3E). The medullary cavity, free of bone trabeculae, is bordered by an ICL consisting of endosteally formed lamellar bone (Figure 3G). Apart from one highly remodeled, but the restricted region, most of the cortex is composed of a highly vascularized laminar to reticular fibrolamellar bone tissue (Figure 3F,G). Around most of the periosteal surface, three LAGs intercepting a thin layer of poorly vascularized parallel-fibered bone mark the onset of an OCL (Figure 3F). Finally, as observed in the femur Dn-fm-2, an extra layer of vascularized and partly remodeled bone tissue is visible in localized regions of the periosteal surface. This histology of this bone layer contrasts with the underlying primary cortical tissue and is intercalated between the first LAG of the OCL and the outermost periosteal layer (Figure 3G).
Two similar-sized tarsometatarsi were sampled for this species (Table 1) and show slightly different cortical thicknesses (Figure 3H,I). With a relatively thicker bone wall, Dn-tm-1 (Figure 3H) presents a higher number of resorption spaces and bone trabeculae in the perimedullary region than Dn-tm-2 (Figure 3I). In both elements, a thin layer of endosteal lamellar bone tissue is visible along the medullary margin and most of the cortex consists of a dense Haversian tissue that extends right up to the periosteal surface; however, some regions are less remodeled and a decrease in vascularization is visible in the outer cortex (Figure 3J).
Rhea americana (greater rhea–Figure 4)—Two different-sized femora (Table 1) were sampled and present different bone microstructures. The larger femur, Ra-fm-1 (Figure 4A), presents a much thicker bone wall than the smaller one (Figure 4B). A narrow layer of lamellar bone forms the ICL lines most of the medullary cavity in both elements (Figure 4C insert, 4D). In Ra-fm-1, a decrease in bone vascular density is visible towards the bone periphery and a thin layer of poorly vascularized parallel-fibered bone marks the onset of an OCL at the periosteal surface (Figure 4C). These observations suggest that growth in diameter had slowed down already when this animal died. On the contrary, Ra-fm-2 exhibits a very thin layer of endosteally formed lamellar bone (initiation of the ICL, Figure 4D), attesting that the expansion of the medullary cavity had just ceased. Also, no clear decrease in vascular density (that would indicate a decrease in bone deposition rate) is observed close to the periphery of this bone (Figure 4D). In both femora, most of the cortical bone is primary (except a zone of muscle attachment with Haversian tissue in Ra-fm-1; Figure 4A) and formed of a highly vascularized fibrolamellar bone. The deep cortex of Ra-fm-1 is composed of a reticular to poorly organized laminar bone that turns into a well-defined laminar bone tissue towards the periosteal margin (Figure 4C). Numerous radial anastomoses are also visible throughout the section (Figure 4C). In Ra-fm-2, the cortex is mostly formed of a reticular to poorly characterized laminar bone tissue (Figure 4D). No LAGs are visible in the cortex of both elements.
Two different-sized tibiotarsi were sampled (Table 1). The larger tibiotarsus Ra-tb-2 belongs to the same individual as femur Ra-fm-1; the same applies to Ra-tb-1 and Ra-fm-2 (Table 1). As for the femora, the tibiotarsi histologies are congruent with different ontogenetic stages. The larger tibiotarsus Ra-tb-2 possesses a relatively thicker bone wall (Figure 4E) than the smallest tibiotarsus Ra-tb-1 (Figure 4F). Ra-tb-2 also shows a well-developed layer of endosteal bone (ICL) that appears anisotropic in polarized light and contrasts with the rest of the more isotropic cortical bone (Figure 4G). Interestingly, this ICL is well vascularized (Figure 4G). The rest of the cortex is mostly formed of a highly vascularized fibrolamellar bone (the organization of the vascular canals is variable within the section); with few patches of Haversian bone tissue, especially in one region of muscle insertion (Figure 4E). A faint annulus, but no clear LAG, was observed in the mid-cortex of this bone. Bone vascular density decreases towards the periphery of this femur, and a distinct annulus marks the transition from well-vascularized fibrolamellar bone tissue to a poorly vascularized parallel-fibered bone layer marking the onset of an OCL. Ra-tb-1 presents a thinner ICL than Ra-tb-2. There is also less Haversian substitution in this specimen as compared to Ra-tb-2, and when present, it tends to be limited to the perimedullary region. As for its associated femur Ra-fm-2, several resorption spaces are present in the perimedullary region of Ra-tb-1 (Figure 4F). Finally, at least one clear LAG is visible in the outer-third of the cortex (Figure 4H). However, the bone deposited after the LAG is a highly vascularized fibrolamellar bone and vascular canals are still piercing the bone surface (Figure 4H). These observations confirm that this individual was still growing at the time of death.
Two different-sized tarsometatarsi, belonging to the same above-mentioned individuals, were sampled. The histology of both tarsometatarsi is congruent with the histology of the other sampled limb bones; however, Haversian substitution is more advanced and makes up a significant portion of the cortex in both elements (Figure 4I,J). Again, the largest tarsometatarsus Ra-tm-1 presents a relatively thicker cortex (Figure 4I) than the smaller one (Figure 4J). As in the tibiotarsus Ra-tb-2, the ICL is well vascularized. The cortex is stratified and presents a first LAG that marks the transition from a well-vascularized (and partly remodeled) plexiform to a more reticular (depending on the part of the section) bone tissue (Figure 4I,K). A second LAG occurs much closer to the bone surface (Figure 4K). In the smaller tarsometatarsus Ra-tm-2, two-thirds of the cortex comprises compacted coarse cancellous bone with still numerous resorption cavities. A narrow ICL, made of a layer of lamellar bone tissue, lines the medullary cavity. Finally, there is no obvious decrease in vascular bone density towards the bone periphery and numerous vascular canals pierce the periosteal surface. Again, these features confirm that this skeletal element was still growing in diameter at the time of the individual’s death. Finally, it is important to note that the skeletal elements Ra-fm-1, Ra-tb-2 and Ra-tm-1 all belonged to the same individual (specimen 1920-116) and present congruent bone microstructures. The skeletal elements Ra-fm-2, Ra-tb-1 and Ra-tm-2 also present very similar bone microstructures (e.g., thinner bone walls than the larger specimen 1920-116, resorption cavities in the deep cortex, etc.) and belonged to a single individual.
Struthio camelus (common ostrich–Figure 5)—Two different-sized femora were sampled (Table 1) and present similar bone microstructure, although, the largest femur Sc-fm-2 (Figure 5A) has a thinner bone wall than the smaller femur Sc-fm-1, because of extensive resorption along the endosteal margin. While the smaller femur shows no bone trabeculae in the medullary region, the largest one has few short trabeculae (Figure 5A). Both elements show a discontinuous and thin ICL bordering the medullary cavity (Figure 5B). This endosteal bone layer is made of lamellar bone tissue that contains numerous osteocyte lacunae. Most of the cortex is primary and formed of a well-vascularized fibrolamellar bone with a reticular to laminar organization (depending on the region of the section), and few short radial anastomoses (Figure 5B). Aside from a narrow zone of Haversian tissue corresponding to an attachment site, only few isolated secondary osteons are visible in rest of the cortices. In both sections, there is a decrease in vascularization close to the bone surface, accompanied by a change in the refringence of the bone matrix which comprises one to two LAGs, which marks the onset of the OCL (Figure 5B).
Two tibiotarsi, belonging to 2 different individuals were sampled (Figure 5C,D). The smaller one, Sc-tb-2 (Figure 5D) is associated with the smaller femur Sc-fm-1. Both tibiotarsi have been sampled close to the neutral region of growth of the bone, as attests to the presence of the nutrient canal (Figure 5C–E). The larger tibiotarsus Sc-tb-1 presents unusual histological features. Its cortex is stratified (Figure 5E,F) into different types of bone tissue; i.e., from the medullary margin to the periosteal surface: (i) a thin lamellar bone tissue with some radially oriented vascular canals (ICL), (ii) a thick layer of compacted coarse cancellous bone with numerous small resorption cavities forming half to two-third of the cortex (depending on the region of the section); (iii) a layer of primary fibrolamellar bone with a reticular to laminar organization of the vascular canals; (iv) a clear LAG, close to the bone surface, marking a change in bone vascularization under the periosteal surface (Figure 5F). In some parts of the section, the outermost cortex consists of a thin layer reminiscent of pathological bone and shows numerous bundles of Sharpey’s fibers (Figure 5G). The smaller tibiotarsus Sc-tb-2 is less remodeled and is mostly composed of a well-vascularized fibrolamellar bone with a reticular to laminar organization (Figure 5D). At least one clear LAG is visible in the mid-cortex and thus attests that the growth in diameter of this bone has been discontinuous (Figure 5D).
Two different-sized tarsometatarsi were sampled (Table 1) and showed distinct bone microstructures. The larger one, Sc-tm-1 (Figure 5I), presents a very similar bone microstructure to the larger tibiotarsus Sc-tb-1 (see above; Figure 5C) and most probably belongs to the same individual. In the outermost cortex, a clear LAG marks the transition between a “normal” fibrolamellar bone tissue and an outermost region of predominantly plexiform bone tissue that is likely pathological (Figure 5I,J). The primary bone tissue in the cortex appears to be reticular fibrolamellar bone. The endosteal region is highly resorptive, and in the perimedullary region, large erosion cavities are present. The smaller tarsometatarsus, Sc-tm-2 (Figure 5H), presents a clear ICL made of a poorly vascularized lamellar bone tissue. Most of the cortex is formed of a dense Haversian bone. A narrow layer of lamellar bone is visible in some parts of the outermost cortex that have not been completely remodeled. The histological features of Sc-tm-2 show that this bone belonged to an adult individual.
3.3.2. Extinct Terrestrial Birds
Gastornis sp. (Figure 6)—Five different limb bones, representing femora and tibiotarsi, have been sampled for this genus (Table 1). We were unfortunately allowed to only sample superficial fragments of the bone walls or take bone cores. Moreover, the preservation of the bone microstructure was poor in most of the specimens. The information gathered on Gastornis bone histology is thus limited and incomplete. Most elements show that the cortex underwent secondary reconstruction, and that LAGs were deposited. In Ga-fm-1, most of the cortex appears to be remodeled. Several generations of secondary osteons are visible, although dense Haversian proportions are not attained. The secondary osteons exhibit different orientations and sizes, and several preserve large lumens (Figure 6A,B). The endosteal margin is resorptive, but in some places, a narrow band of lamellar tissue forms the ICL. The bone core sampled from Ga-fm-2 consists of the periosteal surface of bone, and part of the cortical bone, although the deepest part of the cortex and the endosteal region are missing (Figure 6C). However, this bone fragment reveals that the mid-cortex of Gastornis femur had well-vascularized fibrolamellar bone with a reticular organization (Figure 6D). Six closely spaced LAGs were identified in this bone fragment (relatively close to the bone surface); the deepest one marks the transition from a well vascularized fibromellar bone to a less vascularized lamellar bone tissue that forms the OCL in which numerous Sharpey’s fibres are visible (Figure 6D,E). Secondary osteons, as well as bundles of Sharpey’s fibers, are scattered throughout this cortical fragment (Figure 6E). The bone wall of Ga-Fm-3B is slightly fractured, and the periosteal surface of the bone is not well preserved. Here too, the primary cortical bone is interrupted by several LAGs. The periosteal and endosteal part of the Gastornis tibiotarsus (Ga-tb-2) are diagenetically altered, but it is evident that the cortex is comprised of fibrolamellar bone with predominantly longitudinally oriented vascular canals. Deeper in the cortex, many secondary osteons are visible. A few growth marks are visible in the mid-cortical regions. The bone tissue of tibiotarsus Ga-tb-1B is better preserved. However, in this bone overlying the OCL, which comprises four to five LAGs, a richly vascularized periosteal reactive bone tissue is present (Figure 6F).
Aepyornithidae (the elephant birds, Figure 7 and Figure 8)—Three femora, eight tibiotarsi and two tarsometatarsi were sampled from various Aepyornithidae specimens (Table 1). Since a comprehensive description of the bone tissues of these specimens is provided in Chinsamy et al. (2020), here, our focus is on the microanatomical structure of the bones.
Complete cross-sections from two different-sized femora (Ae-fm-2 and Ae-fm-3) belonging to two individuals of A. maximus (Figure 7) were obtained for histological analyses. Although the cortical thickness is variable within a section, the longer femur, Ae-fm-2 (Figure 7A) has a relatively thicker cortex and higher bone compactness than the smaller one (Figure 7B; Table 1 and Table 2). Both sections contain numerous and slender bone trabeculae occupying part of the medullary cavity (Figure 7A,B). The cores of these trabeculae result from the deep and prolonged erosion of the deep cortical bone during growth. Thus, they are either formed of well-vascularized fibrolamellar bone tissue (similar to the mid-cortex; Figure 7D) or Haversian bone tissue (resulting from the remodeling of the deep cortex before being eroded and transformed into trabecular bone; Figure 7E). In the deep cortex of Ae-fm-2, Haversian substitution is more extensive than in Ae-fm-3. Also, in Ae-fm-2, the large erosion spaces present in the perimedullary region, as well as the bony trabeculae have been lined with sequential layers of endosteal lamellar bone (Figure 7E). In Ae-fm-3, this deposition of endosteal lamellar bone is much more limited (Figure 7D). In both sections, most of the cortex is formed of a highly vascularized fibrolamellar bone with a preferential reticular or laminar organization and with numerous radial anostomoses (Figure 7C,D,F). In the largest femur Ae-fm-2, a clear transition between a well-vascularized fibrolamellar bone tissue and a less vascularized bone interrupted by several LAGs is visible in the outercortex and testify of a slowdown of the growth in this individual (Figure 7C). On the contrary, only a change in vascular orientation and density is observed at the periphery of Ae-fm-3 (Figure 7F). All these histological features indicate that the largest femur belonged to an older, more mature individual than the smaller one (that was probably juvenile or sub-adult).
Complete cross-sections were made from 3 different tibiotarsi referred respectively to Vorombe titan (Ae-tb-1; Figure 8A) and Aepyornithidae indet. (Ae-tb-2, and Ae-tb-3; Figure 8C,D). These sections were sampled at different levels along the shafts of these skeletal elements, which explains part of the differences observed in cross-sectional geometry and cortical thickness. All three sections are heavily remodeled and the cortex mostly formed of a dense Haversian bone tissue. The three sections present numerous and slender bone trabeculae, which occupy most of the medullary cavity. The small amount of bone trabeculae in the mid-diaphyseal cross-section of Ae-tb-1 is an artefact (Figure 8A) since numerous, fragile trabeculae were broken during the sampling of the specimen. The process underlying the formation of these bone trabeculae is the same as in the femur, i.e., during growth, there is an intense and prolonged resorption of the deep cortex. The remains of the un-resorbed deep cortical bone become integrated into the core of the trabeculae. Several events of resorption–redeposition occurred along the surface of the trabeculae, resulting in an accumulation of cross-cutting layers of endosteal lamellar bone (Figure 8E). The bone core of Ae-tb-5 (Figure 8D) reveals that Haversian substitution was also extensive in this bone. Although Haversian bone is present up to the bone surface (with secondary osteons that vary in size and orientation; Figure 8D), several LAGs (at least 3; Figure 8D,F) are still visible in the cortex, and suggest that the growth in diameter of this bone was discontinuous.
Two tarsometatarsi were sampled and presented completely remodeled cortices, with secondary osteons varying in size and orientation (Figure 8H). Again, the diaphyseal cross-section of Ae-tm-1 (Figure 8G) presents a thick compact cortex and slender bone trabeculae occupying the medullary cavity (although most of the trabeculae have been broken during the processing of the bone for thin sectioning).
Dinornithidae (the moas, Figure 9 and Figure 10)—One femur, three tibiotarsi and one tarsometatarsus were sampled for this clade (Table 1). Three elements were identified as belonging to the genus Dinornis.
The mid-diaphyseal cross-section of the Dinornis femur Di-fm-1, presents a thick bone wall and a medullary cavity free of bone trabeculae (Figure 9A). The endosteal margin is irregular because of extensive resorption of the deep cortex (Figure 9E). However, once the expansion of the medullary region was completed, a deposition of thin layers of endosteally formed lamellar bone occurred (Figure 9D). Most of the cortex consists of primary bone tissue, and a well-preserved growth record is visible throughout the cortex (Figure 9A–C). At least five narrow annuli coupled with LAGs (irregularly spaced) are visible from the deep cortex to two-thirds of the bone wall, and they alternate with a highly vascularized fibrolamellar bone tissue (Figure 9B). This fibrolamellar bone tissue has a reticular organization in the deepest part of the cortex, with primary osteons that preserve large lumens (Figure 9D), but becomes laminar in the mid-cortex. Numerous radial anastomoses are visible throughout the cortex (Figure 9B,E). In the external third of the cortex, a clear LAG marks the transition to a progressive decrease in bone vascularization. The external layer of the cortex is poorly vascularized (with longitudinal primary osteons) and contains four closely and regularly spaced LAGs. Although the appositionial growth of this bone drastically decreased, it was still growing slowly in diameter as attests the outermost layer of bone deposited, which is still vascularized (Figure 9C). Finally, numerous bundles of short Sharpey fibers are visible throughout the cortex (Figure 9F,G).
All three tibiotarsi exhibit different states of preservation. Trabeculae in the medullary cavity are present in a part of the sections (Di-tb-3 and Di-tb-4, respectively Figure 10C,D), but broke during bone sampling. All sections present thick and highly remodeled cortices (Figure 10B,E). However, despite the intense remodeling, some LAGs are still visible in most elements (e.g., Figure 10B), which indicate that growth in diameter of these bones was discontinuous.
The sampled tarsometatarsus Di-tm-2 shows numerous and small bone trabeculae in the medullary cavity (Figure 10F). Unlike the tibiotarsi, the trabecular network has been well preserved during sampling of this element, because the medullary cavity was filled with diagenetic minerals. The cortex is partly remodeled (Figure 10G,H) and at least one LAG is visible in the mid-cortex.
4. Discussion
4.1. Limb Bone Proportions
A previous study by Angst and colleagues [9] has shown that the locomotion type of large terrestrial birds can be deciphered from simple linear measurements of the tarsometatarsus. According to these researchers, all extant cursorial ratites (c.f. [1]) have a tarsometatarsal length-width ratio >12, while all extinct giant terrestrial birds sampled had a length-width ratio <12, which was thus interpreted as indicative of a graviportal–slow walking locomotion (an inference also based on morphological correlates; [9]). These results further show that large extant ratites have relatively long and slender tarsometatarsi, as expected for cursorial animals [1,6,7,8], whereas giant extinct terrestrial birds, such as Aepyornithidae, some members of the Dinornithidae and Gastornithidae, have relatively shorter, stouter tarsometatarsi, which is an adaptation for biomechanical loading. In our current study, we found that the Southern cassowary Casuarius casuarius, which is considered to be the slowest of all living ratites [1], had the lowest tarsometatarsal length-width ratio for the extant species, which agrees with the earlier findings reported by Angst et al. [9].
4.2. Long Bone Microanatomy and Locomotor Patterns in Large Terrestrial Birds
4.2.1. Interskeletal Element Variability
When a skeletal element was sampled from different-sized individuals of the same species (and thus, most likely, individuals at different ontogenetic stages), we observed variability in terms of the compactness of the mid-diaphysis, with larger specimens generally presenting thicker bone walls. This observation reflects the changes in bone microanatomy and global compactness that accompany bone growth through ontogeny (e.g., [8,43]). Furthermore, our preliminary results show that, in general, among extant terrestrial birds, there is a proximo-distal gradient of bone compactness in the hindlimb with a progressive increase in bone compactness from the femur to the tarsometatarsus. However, in the sampled graviportal extinct birds, this pattern was not necessarily observed, although the femur was still the least compact of the limb bones in Aepyornithidae.
4.2.2. Differences between Cursorial Ratites and Extinct Terrestrial Birds
Although our sample size is small and would need to be increased in future studies, extinct terrestrial birds, such as the Aepyornithidae and some Dinornithidae, inferred as graviportal by previous authors using limb bone proportions [9,13], have a tendency to show overall higher compactness values in their hindlimb bones than most extant ratites sampled in this study (see Table 2). These higher global compactness values are the result of relatively thicker compact cortices in the limb bones of the sampled sub-fossil birds (such as, the Dinornis sp. femur Di-fm-1; Figure 9A) and/or the presence of a well-developed network of bone trabeculae along the shaft, especially in the hindlimb bones of Aepyornithidae (e.g., [33]) that is usually poorly developed (such as Casuarius and Dromais, Figure 1, Figure 2 and Figure 3) or absent (such as in Rhea, Figure 4) in the mid-shaft of extant cursorial ratites (see also the ratite femoral cross-sections in Foote [41]: plate 5), and among modern birds in general (e.g., see bird femoral cross-sections in Foote [41]: plates 5–7). These microanatomical features are congruent with a graviportal mode of locomotion in the sampled Aepyornithidae and Dinornithidae [25]. A large body size correlates with a large body mass, which has consequences for the biomechanical adaptations of the hindlimb bones. Thus, our bone compactness results, together with the histological findings showing thick bone walls often with extensive development of bone trabeculae in the medullary cavity, concur with the expectations of a slow graviportal type of locomotion.
4.3. New Data on the Long Bone Histology of Extant Ratites
4.3.1. Interskeletal Element Variability
As previously documented in the hindlimb bones of the ostrich [28,46], but also in Aepyornithidae [33,47] and Dinornithidae [45], we found that Haversian substitution is limited in the femur but can be extensive in the tarsometatarsus of all extant ratites sampled (ostrich, emu, rhea and cassowary). The tibiotarsus presents an intermediate level of Haversian substitution. This pattern has also been described in Apteryx [35]. Table S1 (in Supplementary Materials) summarizes the bone histological observations made for all the taxa studied.
4.3.2. Growth Marks in the Cortex of Extant Ratites
Most modern birds (Neornithes) are considered to have a rapid, uninterrupted rate of bone deposition. They reach skeletal maturity in less than a year and, except for a few closely spaced LAGs that can be present in the OCL at the adult stage [36], they generally do not show any growth marks in the cortices of their limb bones [27,44,54,69]. A few exceptions to this pattern of rapid, uninterrupted growth among the Neornithes are known among island birds such as, Apteryx [35,70], and several large flightless extinct birds such as the New Zealand moa [45], the aepyornithids [33,47], as well as the dromornithids [15,48]. These findings are consistent with the hypothesis outlined by Starck and Chinsamy [54] and Chinsamy-Turan [31] that in the absence of selection pressures for rapid growth, birds will adopt a more flexible growth strategy of slower, episodic growth.
In the current study, we document that the limb bones of several large extant ratites present annuli or even LAGs that interrupt events of rapid bone deposition in their cortices. For example, the femur Cc-fm-1 and tibiotarsus Cc-tb-2 of Casuarius casuarius present several LAGs within the well-vascularized mid-cortex, i.e., clearly not part of the OCL (Figure 1D,G,H), and several skeletal elements of the greater rhea Rhea americana also exhibited growth marks in their cortices (Figure 3). Thus, growth marks appear to be more common than previously reported in ratites.
When Bourdon et al. [35] first observed the presence of discontinuous and periodic growth in the kiwi, they proposed that growth marks may have been absent in the last common ancestor of ratites and may therefore represent an apomorphy of the clade Apterygidae-Dinornithiformes; However, their hypothesis is poorly supported because the inter-relationships within Palaeognathae are still debated, and the clade Apterygidae-Dinornithiformes is not recognized in most recent ratite phylogenies [19,71,72]. Moreover, we also documented LAGs interrupting fibrolamellar bone in the cortices of the rhea and cassowary. We propose the alternative hypothesis that such flexible growth strategies may represent the plesiomorphic condition of Neornithes (and thus palaeognaths) and their extinct theropod ancestors [31,73].
Since growth marks have not been observed in modern ratites that were previously studied (e.g., a growth series of Struthio [28]), but appeared commonly in several of our birds, we further raise the possibility that perhaps living in France, outside of their natural environments, these birds would have been subjected to captivity, periodic cold spells and even snow, which may have resulted in physiological stress and the formation of LAGs. This would agree with our hypothesis that flexible growth strategies are inherent among the ratites.
4.3.3. Comments on OCL Formation and Ontogenetic Status in Birds
In the large comparative study of the OCL in extant birds, Ponton et al. [37] hypothesized that the poor development to complete absence of this structure in ratites noted by previous authors [28,29,46] might be related to the large size of these bird species. However, more recently Woodward et al. [74] reported the presence of an OCL in a specimen of Struthio camelus, and indeed we observed that several extant and extinct ratite specimens (rheas, cassowaries, ostriches, emus, and the giant moa) presented distinctive OCL, often accompanied by several closely spaced LAGs (e.g., Figure 1D, Figure 2C, and Figure 9C). In addition, Bourdon et al. [35] and Heck et al. [70] have described the presence of an OCL in Apteryx. Thus, it is apparent that OCLs are quite common in ratites, and we propose that perhaps the ratites examined in previous studies [28,29,46] were not from skeletally mature individuals.
Our observations suggest that all Casuarius skeletal elements studied were from somatically mature individuals since they show a distinctive OCL in the outermost cortex. Of the two Rhea femora studied, Ra-Fm-1 has an OCL indicating that it was from a fully-grown individual, whereas Ra-fm-2 appears to have been actively growing at the time of death and it was most likely a subadult or juvenile. The differences in bone microstructure observed between the two femora are congruent with the difference in the size of these elements (Table 1), which also suggests that they represent different ontogenetic stages.
4.4. New Data on the Long Bone Histology of Extinct Large Terrestrial Birds
4.4.1. Aepyornithidae
The hindlimb bone histology of Aepyornithidae has been previously described [26,33,47,53]. Of these, the Chinsamy et al. [33] study comprehensively sampled three aepyornitid taxa [60], i.e., Aepyornis maximus, Aepyornis hildebrandti and Vorombe titan, as well as some taxonomically unidentifiable juvenile Aepyornithiformes. All these studies showed that, like their small relative-the kiwi-these large ratites, also experienced protracted, episodic growth. Chinsamy et al. [33] proposed that the periodic interruptions in the bones of the aepyornithids were caused by seasonally variable growth rates mediated by environmental conditions.
4.4.2. Dinornithidae
The limb bone histology of the moas has been examined by previous researchers [26,30,44,45,75]. In agreement with these earlier studies, we found that the cortical bone of the moas, when not completely remodeled (as in most tibiotarsi sampled) is made of a highly vascularized, fibrolamellar bone, regularly interrupted by LAGs, suggesting a discontinuous and prolonged growth strategy for this family [45]. Up to seven widely spaced growth cycles were observed throughout the cortex of the Dinornis femur Di-fm-1 (Figure 9A), followed by a drastic slow-down in growth and the deposition of a poorly vascularized bone tissue (marking the onset of an OCL), interrupted by four closely-spaced LAGs (Figure 9C).
Considering that the innermost growth cycles may have been resorbed with the expansion of the medullary cavity, our observations suggest that it took at least seven years for this individual to reach skeletal maturity and that it was at least 11 years-old when it died. Our observations show again that in the sampled Dinornithidae, the femur is less affected by Haversian substitution than the other limb bone elements. Indeed, all three tibiotarsi and the tarsometatarsus sampled present some degree of Haversian bone tissue (Figure 10), whereas the adult femur (Di-fm-1) does not show any secondary osteons in its cortex (Figure 9). These findings concur with those reported for the aepyornithids [33,47]. This may reflect differential biomechanical loading between these skeletal elements [76].
4.4.3. Gastornis sp.
The histology of a single tibia of Diatryma (now recognized as synonymous with Gastornis; [57]) has been briefly described in Ricqlès et al. [30]. These authors observed the presence of one LAG, in the outer cortex of this individual, although not associated with the OCL. In the present study, we sampled cortical fragments and bone cores from 5 skeletal elements (femora and tibiotarsi) belonging to Gastornithidae. We observed that, contrary to most other extinct large terrestrial birds studied (e.g., [33,48]), all femora presented at least partially remodeled cortices, with extensive Haversian bone tissue. These findings suggest some biomechanical differences between gastornithids and other large flightless birds. Furthermore, we counted up to six closely spaced LAGs in the outer cortex of femur Ga-fm-2, suggesting that this animal’s growth already slowed down at the time of death and it was skeletally mature.
4.5. Pathologies Evident in Modern Samples
In the current study we observed several histological features that appeared to be the result of bone pathologies: (i) the avian osteopetrosis-like peripherally- and endosteally-formed tissues [66] in a femur of Casuarius (Figure 1B) and a tibiotarsus of Dromaius (Figure 3C,D); (ii) another tibiotarsus of Dromaius with periosteal deposits of a highly vascularized bone tissue that results in an uneven bone wall margin (Figure 3G); (iii) a tibiotarsus and a tarsometatarsus of Struthio (Figure 5E–G) with periosteal reactive tissues.
Except for the Casuarius and Dromaius, which have features reminiscent of osteopeterosis, we are uncertain about the etiology of the pathologies for the other bones. Unfortunately, the MNHN collection records do not give any provenance for the material, but it is more than likely that the modern birds were obtained from zoos. Most of the birds sampled in our study appear to be mature individuals, which agrees with the possibility that they were zoo animals (which generally tend to have long lives since they are in a protected environment without any threats, regular food, etc.), and perhaps they are therefore more prone to diseases of old age.
5. Conclusions
Our preliminary microanatomical observations tend to show that extinct terrestrial birds, inferred as graviportal based on limb proportions, have thicker cortices and/or more bony trabeculae in their hindlimb bone diaphyses, than extant cursorial groups. However, we note that our sample size is small and further investigations are warranted to ascertain the relationship between locomotion mode and the inner architecture of hindlimb bones in terrestrial birds.
In this study, we also documented for the first time the presence of growth marks (not associated with an OCL) in the cortices of several extant ratites. These observations support the hypotheses of Starck and Chinsamy [54] and Chinsamy-Turan [31] that episodic and therefore protracted growth can be present in birds living in an environments where the selection pressure for rapid growth within a single year is absent. Thus, although most modern birds grow rapidly and reach maturity within a few weeks to months, like Apteryx [35,70], several other extant ratites (current study), and several other large flightless birds [33,45,48] are also capable of growing in an interrupted manner and can take several years to reach skeletal maturity.
This study also documents for the first time, the presence of a distinctive OCL in several skeletally mature ratites, and raises the possibility that earlier studies may have examined immature individuals.
The high incidence of pathologies among the modern bird specimens studied here is attributed to the fact that these birds were probably long-lived, zoo specimens that may have been more susceptible to diseases.
Supplementary Materials
The following supporting information can be downloaded at: https://0-www-mdpi-com.brum.beds.ac.uk/article/10.3390/d14040298/s1, Table S1: Summary of histological features seen in different species studied. ICL, inner circumferential layer; OCL, outer circumferential layer; CCCB, compacted coarse cancellous bone; FLB, fibrolamellar bone; R-L = reticular to laminar FLB. Note that the absence of information in the table means that those features were not observed/not preserved.
Author Contributions
Conceptualization, A.C. (Aurore Canoville), A.C. (Anusuya Chinsamy) and D.A.; methodology, A.C. (Aurore Canoville) and D.A.; formal analysis, A.C. (Aurore Canoville), A.C. (Anusuya Chinsamy) and D.A.; resources, A.C. (Aurore Canoville), A.C. (Anusuya Chinsamy). and D.A.; writing—original draft preparation, A.C. (Aurore Canoville), A.C. (Anusuya Chinsamy) and D.A.; writing—review and editing, A.C. (Aurore Canoville), A.C. (Anusuya Chinsamy). and D.A. All authors have read and agreed to the published version of the manuscript.
Funding
This research was partly funded by The National Research Foundation (NRF, South Africa) grant number 466596.
Institutional Review Board Statement
Not applicable.
Data Availability Statement
All the data are provided within this manuscript.
Acknowledgments
We are grateful to Christine Lefèvre (The Comparative Anatomy Collections, Museum National d’Histoire Naturelle, Paris, France) and Ronan Allain (The Paleontological Collections, Museum National d’Histoire Naturelle, Paris, France) who facilitated our access to specimens used in this study. We would also like to acknowledge Eric Buffetaut (Centre National de la Recherche Scientifique, Ecole Normale Supérieure, Paris, France) for assistance during the sampling process. Vivian de Buffrénil and Vincent Rommevaux (Museum National d’Histoire Naturelle, Paris, France) are thanked for granting us access to the equipment necessary to treat, sample some of the skeletal elements and process some thin sections. We are also grateful to Silvia Kolomaznik for formatting the references.
Conflicts of Interest
The authors declare no conflict of interest.
References
- Abourachid, A.; Renous, S. Bipedal locomotion in ratites (Paleognatiform): Examples of cursorial birds. Ibis 2000, 142, 538–549. [Google Scholar] [CrossRef]
- Coombs, W.P. Theoretical aspects of cursorial adaptations in dinosaurs. Q. Rev. Biol. 1978, 53, 393–418. [Google Scholar] [CrossRef]
- Stein, B.R.; Casinos, A. What is a cursorial mammal? J. Zool. 1997, 242, 185–192. [Google Scholar] [CrossRef]
- Carrano, M.T. What, if anything, is a cursor? Categories versus continua for determining locomotor habit in mammals and dinosaurs. J. Zool. 1999, 247, 29–42. [Google Scholar] [CrossRef]
- Storer, R. Adaptive radiation in birds. In Biology and Comparative Physiology of Birds; Academic Press: New York, NY, USA, 1960; Volume 1, pp. 15–55. [Google Scholar]
- Alexander, R.; Maloiy, G.M.O.; Njau, R.; Jayes, A.S. Mechanics of running of the ostrich (Struthio camelus). J. Zool. 1979, 187, 169–178. [Google Scholar] [CrossRef]
- Picasso, M.B.J. Postnatal ontogeny of the locomotor skeleton of a cursorial bird: Greater rhea. J. Zool. 2012, 286, 303–311. [Google Scholar] [CrossRef]
- Gilbert, M.M.; Snively, E.; Cotton, J. The tarsometatarsus of the ostrich Struthio camelus: Anatomy, bone densities, and structural mechanics. PLoS ONE 2016, 11, e0149708. [Google Scholar] [CrossRef] [Green Version]
- Angst, D.; Buffetaut, E.; Lecuyer, C.; Amiot, R. A new method for estimating locomotion type in large ground birds. Palaeontology 2015, 59, 217–223. [Google Scholar] [CrossRef]
- Buffetaut, E.; Angst, D. The giant flightless bird Gargantuavis philoinos from the Late Cretaceous of southwestern Europe: A review. In Cretaceous Period: Biotic Diversity and Biogeography; Khosla, A., Lucas, S.G., Eds.; NMMNH&S Bulletin: Albuquerque, NM, USA, 2016; Volume 71, pp. 45–50. [Google Scholar]
- Gregory, W.K. Notes on the principles of quadrupedal locomotion and on the mechanism of the limbs in hoofed animals. Ann. N. Y. Acad. Sci. 1912, 22, 267–294. [Google Scholar] [CrossRef]
- Smith, J.M.; Savage, R.J.G. Some locomotory adaptations in mammals. Zool. J. Linn. Soc. 1956, 42, 603–622. [Google Scholar] [CrossRef]
- Murray, P.F.; Vickers-Rich, P. Magnificent Mihirungs: The Colossal Flightless Birds of the Australian Dreamtime (Life of the Past); Indiana University Press: Bloomington, IN, USA, 2004; 416p. [Google Scholar]
- Buffetaut, E.; Angst, D. Stratigraphic distribution of large flightless birds in the Palaeogene of Europe and its palaeobiological and palaeogeographical implications. Earth Sci. Rev. 2014, 138, 394–408. [Google Scholar] [CrossRef]
- Handley, W.D.; Chinsamy, A.; Yates, A.M.; Worthy, T.H. Sexual dimorphism in the late Miocene mihirung Dromornis stirtoni (Aves: Dromornithidae) from the Alcoota Local Fauna of central Australia. J. Vertebr. Paleontol. 2016, 36, e1180298. [Google Scholar] [CrossRef]
- Worthy, T.H.; Handley, W.D.; Archer, M.; Hand, S.J. The extinct flightless mihirungs (Aves, Dromornithidae): Cranial anatomy, a new species, and assessment of Oligo-Miocene lineage diversity. J. Vertebr. Paleontol. 2016, 36, e1031345. [Google Scholar] [CrossRef]
- Worthy, T.H.; Degrange, F.J.; Handley, W.D.; Lee, M.S. The evolution of giant flightless birds and novel phylogenetic relationships for extinct fowl (Aves, Galloanseres). R. Soc. Open Sci. 2017, 4, 170975. [Google Scholar] [CrossRef] [Green Version]
- Chinsamy-Turan, A.; Worthy, T.H.; Handley, W. Growth strategies linked to prevailing environmental conditions in Australian giant flightless mihirung birds (Aves: Dromornithidae). J. Vertebr. Palaeontol. 2019, 79. [Google Scholar]
- Mitchell, K.J.; Llamas, B.; Soubrier, J.; Rawlence, N.J.; Worthy, T.H.; Wood, J.; Lee, M.S.Y.; Cooper, A. Ancient DNA reveals elephant birds and kiwi are sister taxa and clarifies ratite bird evolution. Science 2014, 344, 898–900. [Google Scholar] [CrossRef] [Green Version]
- Martin, L.D. The status of the late Paleocene birds Gastornis and Remiornis. Nat. Hist. Mus. Los Angeles Cty. Sci. Ser. 1992, 36, 97–108. [Google Scholar]
- Canoville, A.; De Buffrénil, V.; Laurin, M. Bone Microanatomy and Lifestyle in Tetrapods. In Vertebrate Skeletal Histology and Paleohistology; De Buffrénil, V., De Ricqlès, A.J., Zylberberg, L., Padian, K., Eds.; CRC Press: Boca Raton, FL, USA, 2021; pp. 724–743. [Google Scholar]
- Currey, J.D.; Alexander, R. The thickness of the walls of tubular bones. J. Zool. 1985, 206, 453–468. [Google Scholar] [CrossRef]
- Canoville, A.; Laurin, M. Evolution of humeral microanatomy and lifestyle in amniotes, and some comments on palaeobiological inferences. Biol. J. Linn. Soc. 2010, 100, 384–406. [Google Scholar] [CrossRef]
- Quemeneur, S.; De Buffrénil, V.; Laurin, M. Microanatomy of the amniote femur and inference of lifestyle in limbed vertebrates. Biol. J. Linn. Soc. 2013, 109, 644–655. [Google Scholar] [CrossRef] [Green Version]
- Houssaye, A.; Waskow, K.; Hayashi, S.; Cornette, R.; Lee, A.H.; Hutchinson, J.R. Biomechanical evolution of solid bones in large animals: A microanatomical investigation. Biol. J. Linn. Soc. 2016, 117, 350–371. [Google Scholar] [CrossRef] [Green Version]
- Legendre, L.J.; Bourdon, E.; Scofield, R.P.; Tennyson, A.J.; Lamrous, H.; Ricqlès, A.; Cubo, J. Bone histology, phylogeny, and palaeognathous birds (Aves: Palaeognathae). Biol. J. Linn. Soc. 2014, 112, 688–700. [Google Scholar] [CrossRef] [Green Version]
- Chinsamy, A.; Elzanowski, A. Bone histology: Evolution of growth pattern in birds. Nature 2001, 412, 402–403. [Google Scholar] [CrossRef] [PubMed]
- Chinsamy, A. Histological perspectives on growth in the birds Struthio camelius and Sagittarius serpentarius. Cour. Forsch.-Inst. Senckenberg 1995, 181, 317–323. [Google Scholar]
- Chinsamy, A.; Chiappe, L.M.; Dodson, P. Mesozoic avian bone microstructure: Physiological implications. Paleobiology 1995, 21, 561–574. [Google Scholar] [CrossRef]
- De Ricqlès, A.; Padian, K.; Horner, J.R. The bone histology of basal birds in phylogenetic and ontogenetic perspectives. In New Perspective on the Origin and Evolution of Birds, Proceedings of the International Symposium in Honor of John, H. Ostrom, New Haven, USA, 13–14 February 1999; Gauthier, J., Gall, L.F., Eds.; Yale University Press: New Haven, CT, USA, 2001; pp. 411–426. [Google Scholar]
- Chinsamy-Turan, A. The Microstructure of Dinosaur Bone: Deciphering Biology with Fine-Scale Techniques; Johns Hopkins University Press: Baltimore, MD, USA, 2005; 216p. [Google Scholar]
- Chinsamy, A.; Buffetaut, E.; Canoville, A.; Angst, D. Insight into the growth dynamics and systematic affinities of the Late Cretaceous Gargantuavis from bone microstructure. Naturwissenschaften 2014, 101, 447–452. [Google Scholar] [CrossRef]
- Chinsamy, A.; Angst, D.; Canoville, A.; Göhlich, U.B. Bone histology yields insights into the biology of the extinct elephant birds (Aepyornithidae) from Madagascar. Biol. J. Linn. Soc. 2020, 130, 268–295. [Google Scholar] [CrossRef]
- Atterholt, J.; Poust, A.W.; Erickson, G.M.; O’Connor, J.K. Intraskeletal osteohistovariability reveals complex growth strategies in a Late Cretaceous enantiornithine. Front. Earth Sci. 2021, 9, 118. [Google Scholar] [CrossRef]
- Bourdon, E.; Castanet, J.; De Ricqlès, A.; Scofield, P.; Tennyson, A.; Lamrous, H.; Cubo, J. Bone growth marks reveal protracted growth in New Zealand kiwi (Aves, Apterygidae). Biol. Lett. 2009, 5, 639–642. [Google Scholar] [CrossRef]
- Van Soest, R.W.M.; Van Utrecht, W.L. The layered structure of bones of birds as a possible indication of age. Bijdr Dierkd. 1971, 41, 61–66. [Google Scholar] [CrossRef] [Green Version]
- Ponton, F.; Elżanowski, A.; Castanet, J.; Chinsamy, A.; De Margerie, E.; De Ricqlès, A.; Cubo, J. Variation of the outer circumferential layer in the limb bones of birds. Acta Ornithol. 2004, 39, 137–140. [Google Scholar] [CrossRef] [Green Version]
- Horner, J.R.; De Ricqlès, A.; Padian, K. Long bone histology of the hadrosaurid dinosaur Maiasaura peeblesorum: Growth dynamics and physiology based on an ontogenetic series of skeletal elements. J. Vertebr. Paleontol. 2000, 20, 115–129. [Google Scholar] [CrossRef]
- Padian, K.; Lamm, E.T. Bone Histology of Fossil Tetrapods: Advancing Methods, Analysis, and Interpretation; University of California Press: Oakland, CA, USA, 2013; 298p. [Google Scholar]
- Angst, D.; Chinsamy, A.; Steel, L.; Hume, J.P. Bone histology sheds new light on the ecology of the dodo (Raphus cucullatus, Aves, Columbiformes). Sci. Rep. 2017, 7, 1–10. [Google Scholar] [CrossRef] [PubMed] [Green Version]
- Foote, J.S. A Contribution to the Comparative Histology of the Femur; Smithsonian Contributions to Knowledge: Washington, DC, USA, 1916; 242p. [Google Scholar]
- Houde, P. Histological evidence for the systematic position of Hesperornis (Odontornithes: Hesperornithiformes). Auk 1987, 104, 125–129. [Google Scholar] [CrossRef]
- Castanet, J.; Rogers, K.C.; Cubo, J.; Jacques-Boisard, J. Periosteal bone growth rates in extant ratites (ostriche and emu). Implications for assessing growth in dinosaurs. Comptes Rendus de l’Académie des Sciences-Series III-Sci. de la Vie 2000, 323, 543–550. [Google Scholar] [CrossRef]
- Padian, K.; De Ricqlès, A.; Horner, J.R. Dinosaurian growth rates and bird origins. Nature 2001, 412, 405–408. [Google Scholar] [CrossRef]
- Turvey, S.T.; Green, O.R.; Holdaway, R.N. Cortical growth marks reveal extended juvenile development in New Zealand moa. Nature 2005, 435, 940–943. [Google Scholar] [CrossRef]
- Amprino, R.; Godina, G. La struttura delle ossa nei vertebrati: Ricerche comparative negli anfibi e negli amnioti. Comment. Pont. Acad. Sei. 1947, 11, 329–464. [Google Scholar]
- De Ricqlès, A.; Bourdon, E.; Legendre, L.J.; Cubo, J. Preliminary assessment of bone histology in the extinct elephant bird Aepyornis (Aves, Palaeognathae) from Madagascar. Comptes Rendus Palevol 2016, 15, 205–216. [Google Scholar] [CrossRef]
- Chinsamy, A.; Angst, D.; Canoville, A.; Göhlich, U. Bone histology and biology of the giant insular extinct bird, Aepyornis maximus. In Abstract Book of the 9th International Meeting of the Society of Avian Paleontology and Evolution; Palaeontological Association: Diamante, Argentina, 2016. [Google Scholar]
- Chinsamy, A.; Worthy, T.H. Histovariability and Palaeobiological Implications of the Bone Histology of the Dromornithid, Genyornis newtoni. Diversity 2021, 13, 219. [Google Scholar] [CrossRef]
- Buffetaut, E.; Angst, D. A femur of the Late Cretaceous giant bird Gargantuavis from Cruzy (southern France) and its systematic implications. Palaeovertebrata 2019, 42, e3. [Google Scholar] [CrossRef]
- Buffetaut, E.; Angst, D. Gargantuavis is an insular basal ornithurine: A comment on Mayr et al., 2020, ‘A well-preserved pelvis from the Maastrichtian of Romania suggests that the enigmatic Gargantuavis is neither an ornithurine bird nor an insular endemic’. Cretac. Res. 2020, 112, 104438. [Google Scholar] [CrossRef]
- Mayr, G.; Codrea, V.; Solomon, A.; Bordeianu, M.; Smith, T. A well-preserved pelvis from the Maastrichtian of Romania suggests that the enigmatic Gargantuavis is neither an ornithurine bird nor an insular endemic. Cretac. Res. 2020, 106, 104271. [Google Scholar] [CrossRef]
- Steel, L. Bone histology and skeletal pathology of two recently-extinct flightless pigeons: Raphus cucullatus and Pezophaps solitarius. J. Vertebr. Paleontol. 2009, 29, 185. [Google Scholar]
- Starck, J.M.; Chinsamy, A. Bone microstructure and developmental plasticity in birds and other dinosaurs. J. Morphol. 2002, 254, 232–246. [Google Scholar] [CrossRef]
- Buffetaut, E. The giant bird Gastornis in Asia: A revision of Zhongyuanus xichuanensis Hou, 1980, from the Early Eocene of China. Paleontol. J. 2013, 47, 1302–1307. [Google Scholar] [CrossRef]
- Canoville, A.; de Buffrénil, V. Ontogenetic development and intraspecific variability of bone microstructure in the king penguin Aptenodytes patagonicus: Considerations for paleoecological inferences in Sphenisciformes. Anat. Rec. 2016, 299, 270. [Google Scholar]
- Barrat, A. Quelques aspects de la biologie et de l’écologie du manchot royal (Aptenodytes patagonicus) des îles Crozet. CNFRA 1976, 40, 9–52. [Google Scholar]
- Cherel, Y.; Le Maho, Y. Five months of fasting in king penguin chicks: Body mass loss and fuel metabolism. Am. J. Physiol. Regul. Integr. Comp. Physiol. 1985, 249, 387–392. [Google Scholar] [CrossRef]
- Buffetaut, E. New remains of the giant bird Gastornis from the Upper Paleocene of the eastern Paris Basin and the relationships between Gastornis and Diatryma. Neues Jahrbuch für Geologie und Paläontologie-Monatshefte 1997, 3, 179–190. [Google Scholar] [CrossRef]
- Hansford, J.P.; Turvey, S.T. Unexpected diversity within the extinct elephant birds (Aves: Aepyornithidae) and a new identity for the world’s largest bird. R. Soc. Open Sci. 2018, 5, 181295. [Google Scholar] [CrossRef] [PubMed] [Green Version]
- Stein, K.; Sander, M. Histological core drilling: A less destructive method for studying bone histology. In Methods in Fossil Preparation: Proceedings of the First Annual Fossil Preparation and Collections Symposium; Brown, M.A., Kane, J.F., Parker, W.G., Eds.; Petrified Forest: Petrified Forest National Park, AZ, USA, 2009; pp. 69–80. [Google Scholar]
- Redelstorff, R.; Sander, P.M. Long and girdle bone histology of Stegosaurus: Implications for growth and life history. J. Vertebr. Paleontol. 2009, 4, 1087–1099. [Google Scholar] [CrossRef]
- Redelstorff, R.; Hübner, T.R.; Chinsamy, A.; Sander, P.M. Bone histology of the stegosaur Kentrosaurus aethiopicus (Ornithischia: Thyreophora) from the Upper Jurassic of Tanzania. Anat. Rec. 2013, 296, 933–952. [Google Scholar] [CrossRef] [PubMed]
- Canoville, A.; Chinsamy, A. Bone microstructure of pareiasaurs (Parareptilia) from the Karoo Basin, South Africa: Implications for growth strategies and lifestyle habits. Anat. Rec. 2017, 300, 1039–1066. [Google Scholar] [CrossRef] [PubMed] [Green Version]
- Chinsamy, A.; Raath, M.A. Preparation of fossil bone for histological examination. Palaeont. Afr. 1992, 29, 39–44. [Google Scholar]
- Francillon-Vieillot, H.; De Buffrénil, V.; Castanet, J.; Géraudie, J.; Meunier, F.J.; Sire, J.Y.; Zylberberg, L.; De Ricqlés, A. Skeletal biomineralization: Patterns, processes and evolutionary trends. In Microstructure and Mineralization of Vertebrate Skeletal Tissues; Van Nostrand Reinhold: New York, NY, USA, 1990; pp. 471–548. [Google Scholar]
- Girondot, M.; Laurin, M. Bone profiler: A tool to quantify, model, and statistically compare bone-section compactness profiles. J. Vertebr. Paleontol. 2003, 23, 458–461. [Google Scholar] [CrossRef]
- Chinsamy, A.; Tumarkin-Deratzian, A. Pathologic bone tissues in a turkey vulture and a nonavian dinosaur: Implications for interpreting endosteal bone and radial fibrolamellar bone in fossil dinosaurs. Anat. Rec. 2009, 292, 1478–1484. [Google Scholar] [CrossRef]
- Watanabe, J. Ontogeny of surface texture of limb bones in modern aquatic birds and applicability of textural ageing. Anat. Rec. 2018, 301, 1026–1045. [Google Scholar] [CrossRef] [Green Version]
- Heck, C.T.; Woodward, H.N. Intraskeletal bone growth patterns in the North Island Brown Kiwi (Apteryx mantelli): Growth mark discrepancy and implications for extinct taxa. J. Anat. 2021, 239, 1075–1095. [Google Scholar] [CrossRef]
- Phillips, M.J.; Gibb, G.C.; Crimp, E.A.; Penny, D. Tinamous and moa flock together: Mitochondrial genome sequence analysis reveals independent losses of flight among ratites. Syst. Biol. 2010, 59, 90–107. [Google Scholar] [CrossRef] [Green Version]
- Baker, A.J.; Haddrath, O.; McPherson, J.D.; Cloutier, A. Genomic support for a moa–tinamou clade and adaptive morphological convergence in flightless ratites. Mol. Biol. Evol. 2014, 31, 1686–1696. [Google Scholar] [CrossRef] [PubMed] [Green Version]
- Chinsamy, A.; Marugán-Lobón, J.; Serrano, F.J.; Chiappe, L.M. Life history traits and biology of the basal pygostylian, Confuciusornis sanctus. Anat. Rec. 2020, 303, 949–962. [Google Scholar] [CrossRef] [PubMed]
- Woodward, H.N.; Tremaine, K.; Williams, S.A.; Zanno, L.E.; Horner, J.R.; Myhrvold, N. Growing up Tyrannosaurus rex: Osteohistology refutes the pygmy “Nanotyrannus” and supports ontogenetic niche partitioning in juvenile Tyrannosaurus. Sci. Adv. 2020, 6, eaax6250. [Google Scholar] [CrossRef] [PubMed] [Green Version]
- Enlow, D.H.; Brown, S.O. A comparative histological study of fossil and recent bone tissues. Part II. Tex. J. Sci. 1957, 9, 186–204. [Google Scholar]
- McFarlin, S.C.; Terranova, C.J.; Zihlman, A.L.; Enlow, D.H.; Bromage, T.G. Regional variability in secondary remodeling within long bone cortices of catarrhine primates: The influence of bone growth history. J. Anat. 2008, 213, 308–324. [Google Scholar] [CrossRef] [PubMed]
Figure 1.
Long bone histology of the Southern cassowary Casuarius casuarius. (A) Mid-diaphyseal cross-section of the femur Cc-fm-1. (B) Mid-diaphyseal cross-section of the femur Cc-fm-2. Note the presence of pathological bone tissues on the endosteal and periosteal (red box) margins. (C,D) Close-ups of the cortex of Cc-fm-1. Most of the cortex is formed of laminar or reticular fibrolamellar bone tissue. Three to four growth marks are visible in the cortex (arrows). An outer circumferential layer (OCL) with several closely spaced LAGs (arrowheads) is present in the outermost cortex. (E) Close-up of the cortex of Cc-fm-1, showing a highly remodeled zone of the cortex, with numerous secondary osteons. (F) Close-up of the periosteal surface of Cc-fm-2 showing a layer of periosteal pathological bone tissue (per. PB) overlaying the laminar cortical tissue.

Figure 2.
Long bone histology of the Southern cassowary Casuarius casuarius (continued). (A) Mid-diaphyseal cross-section of the tibiotarsus Cc-tb-2. (B) Close-up of a region of the cortex of Cc-tb-2, showing pathological bone tissues on both the periosteal (per. PB) and endosteal (end. PB) margins. Note that LAGs (arrows) are visible throughout the cortical thickness. (C) Close-up of a region of the cortex of Cc-tb-2 showing that the primary cortex is composed of a well-vascularized laminar to reticular fibro-lamellar bone (in polarized light). Three LAGs (arrows) are visible in the outer-third of the cortex, attesting of an interrupted growth. An OCL containing four closely spaced LAGs (arrowheads) is visible in the outermost cortex. (D) Close-up of a region of the cortex of Cc-tb-1, showing endosteal pathological bone tissue (end. PB), as well as at least four LAGs (arrows) interrupting the reticular fibrolamellar bone tissue of the cortex. (E) Mid-diaphyseal cross-section of the tarsometatarsus Cc-tm-1. (F) close-up of the framed region in (E), showing endosteal pathological bone tissue.

Figure 3.
Long bone histology of the common emu Dromaius novaehollandiae. (A) Mid-diaphyseal cross-section of the femur Dn-fm-2. (B) Close-up of the cortex of Dn-fm-2. Note the numerous closely spaced LAGs forming an OCL in the outermost cortex. A layer of vascularized and partly remodeled pathological tissue (per. PB) is also intercalated between some of the LAGs of the OCL in some parts of the cross-section. (C) Mid-diaphyseal cross-section of the tibiotarsus Dn-tb-1. (D) Close-up of the cortex of Dn-tb-1 showing the radially organized endosteal pathological bone (end. PB), as well as its uneven periosteal surface. (E) Mid-diaphyseal cross-section of the tibiotarsus Dn-tb-2 with the nutrient canal (nc) visible. (F) Close-up of the cortex of Dn-tb-2. Most of the cortex is composed of a highly vascularized reticular fibrolamellar bone tissue. An OCL with several closely spaced LAGs (arrows) is visible in the outermost cortex. (G) Close-up of the cortex of Dn-tb-2 with a layer of vascularized and remodeled pathological tissue (per. PB) intercalated within the OCL. (H) Mid-diaphyseal cross-section of the tarsometatarsus Dn-tm-1. (I) Mid-diaphyseal cross-section of the tarsometatarsus Dn-tm-2. (J) Close-up of the framed region of the cortex of the tarsometatarsus Dn-tm-2 in (I) that consists mostly of dense Haversian bone (HB).

Figure 4.
Long bone histology of the greater rhea Rhea americana. (A) Mid-diaphyseal cross-section of the femur Ra-fm-1. (B) Mid-diaphyseal cross-section of the femur Ra-fm-2. (C) Close-up of the framed region of the cortex of Ra-fm-1 in (A). Most of the cortex is formed of a well-vascularized reticular to laminar fibrolamellar bone tissue with radial anastomoses (RC). Insert showing the thin birefringent ICL. (D) Close-up of the cortex of Ra-fm-2. The cortex is mostly formed of a reticular to poorly characterized laminar bone tissue with cyclical modulations in the bone vascularization pattern. No decrease in vascular density is observed in the outer cortex of this element. Note the presence of a thin ICL along the medullary margin. (E) Mid-diaphyseal cross-section of the tibiotarsus Ra-tb-2. Note that the nutrient canal (nc) is visible. (F) Mid-diaphyseal cross-section of the tibiotarsus Ra-tb-1. (G) Close-up of the deep cortex and the well-vascularized layer of endosteal bone (ICL) lining the medullary region in Ra-tb-2. (H) Close-up of outer cortex in Ra-tb-1. A faint LAG (arrow) interrupts the well-vascularized fibrolamellar bone tissue close to the periosteal surface. Vascular canals are visible at the bone surface and no clear decrease in bone vascularization is observed in the outer cortex of this element. (I) Mid-diaphyseal cross-section of the tarsometatarsus Ra-tm-1. (J) Mid-diaphyseal cross-section of the tarsometatarsus Ra-tm-2. (K) Close-up of the cortex of Ra-tm-1. The cortex is stratified and presents a first LAG (arrow) marking the transition from a partly remodeled plexifom tissue to a more reticular fibrolamellar bone. A second LAG (arrow) under the periosteal surface.

Figure 5.
Long bone histology of the common ostrich Struthio camelus. (A) Mid-diaphyseal cross-section of the femur Sc-fm-2. (B) Close-up of the cortex of Sc-fm-2. A thin and discontinuous layer of endosteal lamellar bone forming the onset of the ICL lines the medullary cavity. Most of the cortex is formed of a well-vascularized fibrolamellar bone with reticular to laminar organization. Few radial anastomoses are visible throughout the cortex. Two LAGs (arrows) and a decrease in bone vascularization towards the periosteal surface mark the onset of the OCL. (C) Mid-diaphyseal cross-section of the tibiotarsus Sc-tb-1. Note the presence of the nutrient canal (nc) in the section. (D) Mid-diaphyseal cross-section of the tibiotarsus Sc-tb-2. Note the presence of the nutrient canal (nc) in the section. (E,F) Close-ups of the bone wall of Sc-tb-1, with a thick layer of remodeled coarse cancellous bone forming half to two-thirds of the cortex and a layer of non-remodeled fibrolamellar bone with a reticular to laminar organization. A LAG (arrow), close to the bone surface, marks a change in bone vascularization. (G) Close-up of the cortex of Sc-tb-1. In some parts of the section, the outermost cortex consists of a thin bone layer reminiscent of pathological bone (per. PB) containing numerous bundles of Sharpey’s fibers (Sf). (H) Mid-diaphyseal cross-section of the tarsometatarsus Sc-tm-2. (I) Mid-diaphyseal cross-section of the tarsometatarsus Sc-tm-1. (J) Close-up of the outer cortex of Sc-tm-1. A LAG marks the transition between a “normal” fibrolamellar bone tissue and a well-vascularized bone layer that is most likely pathological (per. PB).

Figure 6.
Femoral histology of the extinct terrestrial bird Gastornis. All pictures but D (polarized light) were taken in direct light. (A,B) Close-ups of the cortex in the femur Ga-fm-1. Haversian bone constitutes most of the cortex. The secondary osteons exhibit different orientations and sizes. (C) Part of cortical bone of the diaphysis of femur Ga-fm-2. The deepest cortex and the periosteal surface are missing. (D–F) Close-ups of the bone cortex of Ga-fm-2, primarily formed of a well-vascularized fibrolamellar bone tissue with a reticular to pseudo-laminar organization. At least six LAGs (arrows) were identified in this fragment. Secondary osteons (II Os.), as well as bundles of Sharpey’s fibers (Sf) are scattered throughout the cortical bone fragment.

Figure 7.
Femoral histology of Aepyornithidae. (A) Mid-diaphyseal cross-section of the femur Ae-fm-2. (B) Mid-diaphyseal cross-section of the femur Ae-fm-3. (C) Close-up of the cortex of Ae-fm-2 (left: in polarized light; right: in direct light). Most of the cortex is formed of a highly vascularized fibrolamellar bone tissue with a reticular or a laminar organization. Towards the periphery, a clear transition between the well-vascularized fibrolamellar bone tissue and a less vascularized bone interrupted by several LAGs is visible. (D) Close-up of the cortex of Ae-fm-3. Numerous bone trabeculae occupy part of the medullary cavity. They result from the deep and prolonged erosion of the deep cortical bone during growth. Most of the cortex is formed of a highly vascularized fibrolamellar bone tissue with a reticular or a laminar organization. Numerous radial anastomoses are also present. (E) Close-up of the perimedullary region in the cortex of Ae-fm-2. Haversian substitution is extensive in the deep cortex. Large erosion spaces, as well as the bone trabeculae, have been lined by sequential layers of endosteal lamellar bone. (F) Close-up of the outer cortex in Ae-fm-3, where a change in vascular orientation and density is observed.

Figure 8.
Long bone histology of Aepyornithidae. (A) Mid-diaphyseal cross-section of the tibiotarsus Ae-tb-1. (B) Proximal cross-section of the tibiotarsus Ae-tb-2. (C) Proximal cross-section of the tibiotarsus Ae-tb-3. (D) Close-up of the cortex of the tibiotarsus Ae-tb-5. Although Haversian bone is extensive, at least three LAGs (arrows) are visible in the cortex. (E) Close-up of the perimedullary region and the bone trabeculae in Ae-tb-5. Several events of desorption–redeposition at the surface of the bone trabeculae, resulted into an accumulation of crosscutting layers of endosteal lamellar bone. (F) Close-up of the cortex of the tibiotarsus Ae-tb-5 (direct light to the left; polarized light to the right). (G) Mid-diaphyseal cross-section of the tarsometatarsus Ae-tm-1. (H) Close-up of the heavily remodeled cortex of Ae-tm-1. Secondary osteons vary in size and orientation.

Figure 9.
Femoral histology of the giant moa Dinornis. (A) Mid-diaphyseal cross-section of the femur Di-fm-1. At low magnification, at least seven growth marks (arrows) are visible throughout the cortical thickness. (B) Close-up of the cortex of Di-fm-1 [in direct (left) and polarized (right) light]. Most of the cortex consists of fibrolamellar bone tissue (mostly reticular in the deep cortex and more laminar in the mid-cortex; with numerous radial anastomoses). A very well preserved growth record is visible throughout the cortex. Here, five annuli associated to LAGs are visible from the deep cortex to two-third of the bone wall. (C) Close-up of the outer cortex of Di-fm-1. A LAG marks the transition to a progressive decrease in bone vascularization and a change in bone matrix (with mostly longitudinal primary osteons in the outermost cortex) and is followed by four closely and regularly spaced LAGs marking the onset of an OCL. (D,E) Close-ups of the deep cortex in Di-fm-1. The fibrolamellar bone tissue has a preferential reticular organization in the deepest cortex, with primary osteons that preserve large lumens (D). The endosteal margin is irregular because deep resorption lacunae (see arrows) have been formed in the deep cortex (E). In some parts, a thin layer of avascular endosteal lamellar bone marking the ICL borders the medullary cavity (D). (F,G) Close-ups of the cortex of Di-fm-1, showing the numerous bundles of short Sharpey’s fibers (Sf).

Figure 10.
Long bone histology of Dinornithidae. (A) Mid-diaphyseal cross-section of the tibiotarsus Di-tb-1. (B) Close-up of the highly remodeled cortex of Di-tb-1 (normal light to the left; polarized light to the right). The fracture observed in the outer-third of the cortex follows a LAG (white arrow). At least 3 closely spaced LAGs are also visible in the outermost cortex, marking the onset of an OCL (white arrowheads). (C) Mid-diaphyseal cross-section of the tibiotarsus Di-tb-3. (D) Mid-diaphyseal cross-section of the tibiotarsus Di-tb-4. (E) Close-up of the cortex of Di-tb-3. Most of the cortex is formed of dense Haversian bone tissue. In the deep cortex, resorption cavities are lined up with endosteal lamellar bone (insert). (F) Mid-diaphyseal cross-section of the tarsometatarsus Di-tm-2. (G,H) Close-ups of the partly remodeled cortice of Di-tm-2 (normal light to the left; polarized light to the right). LAGs are visible in the cortex.


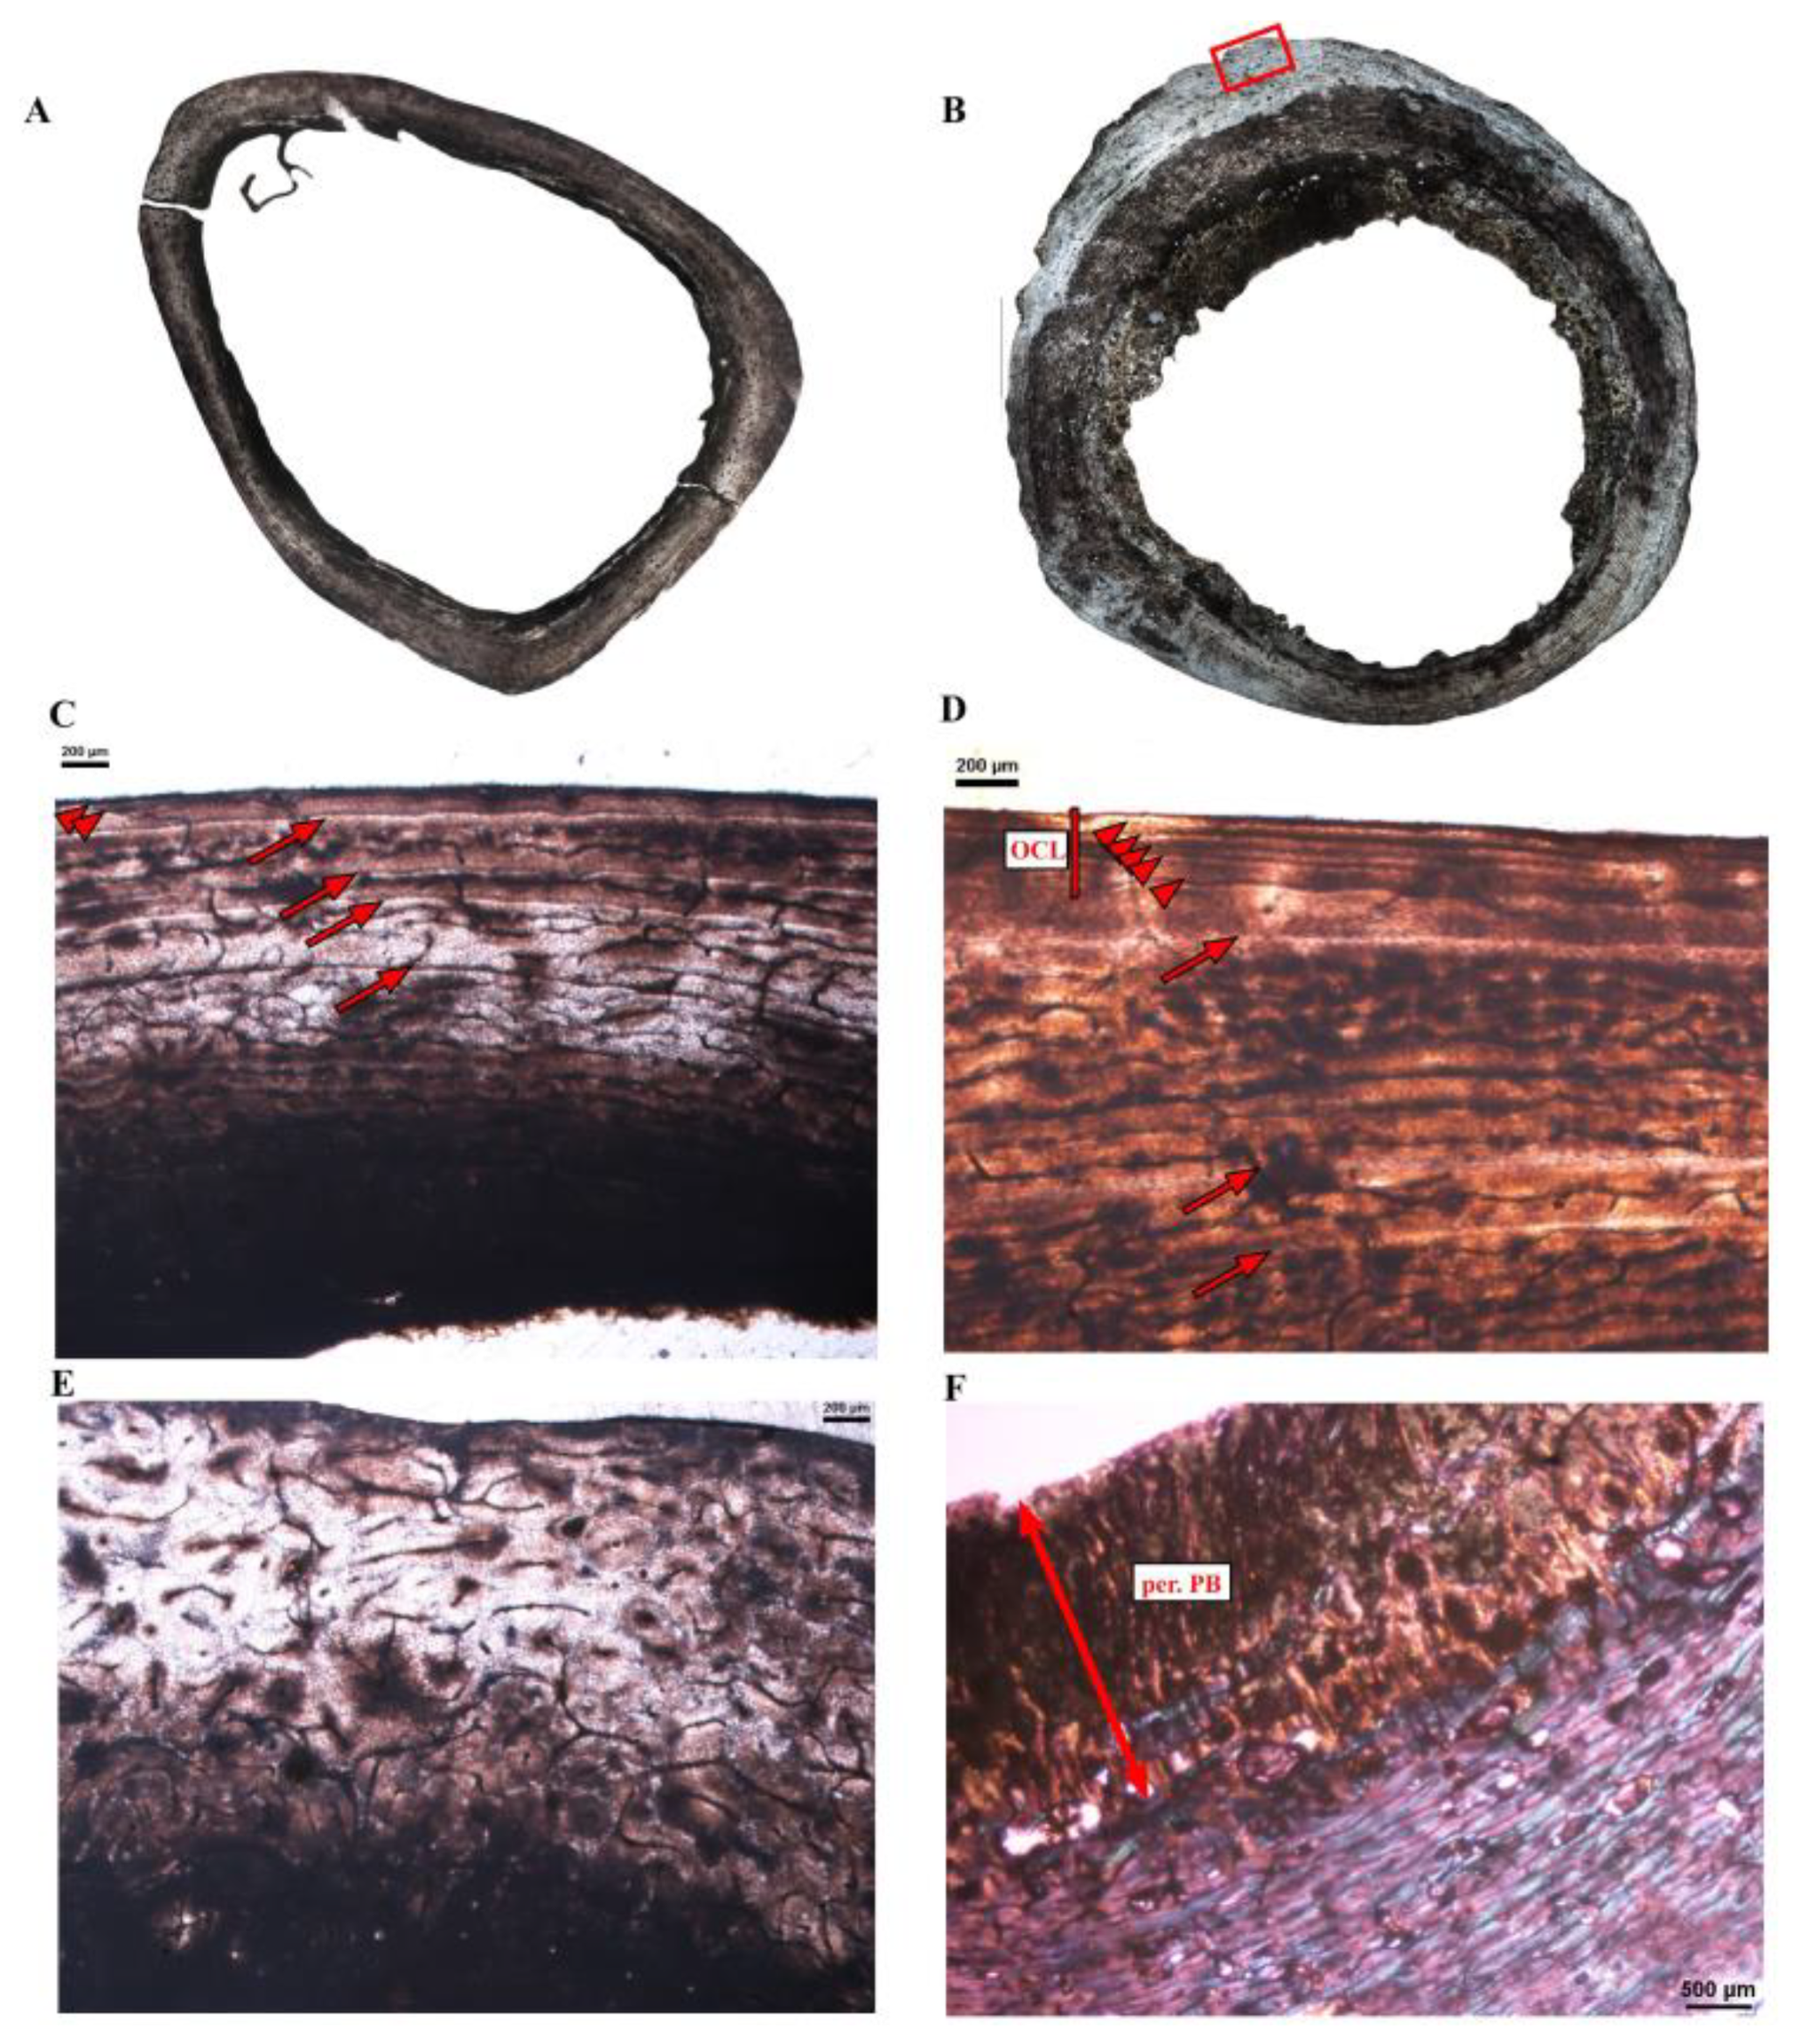
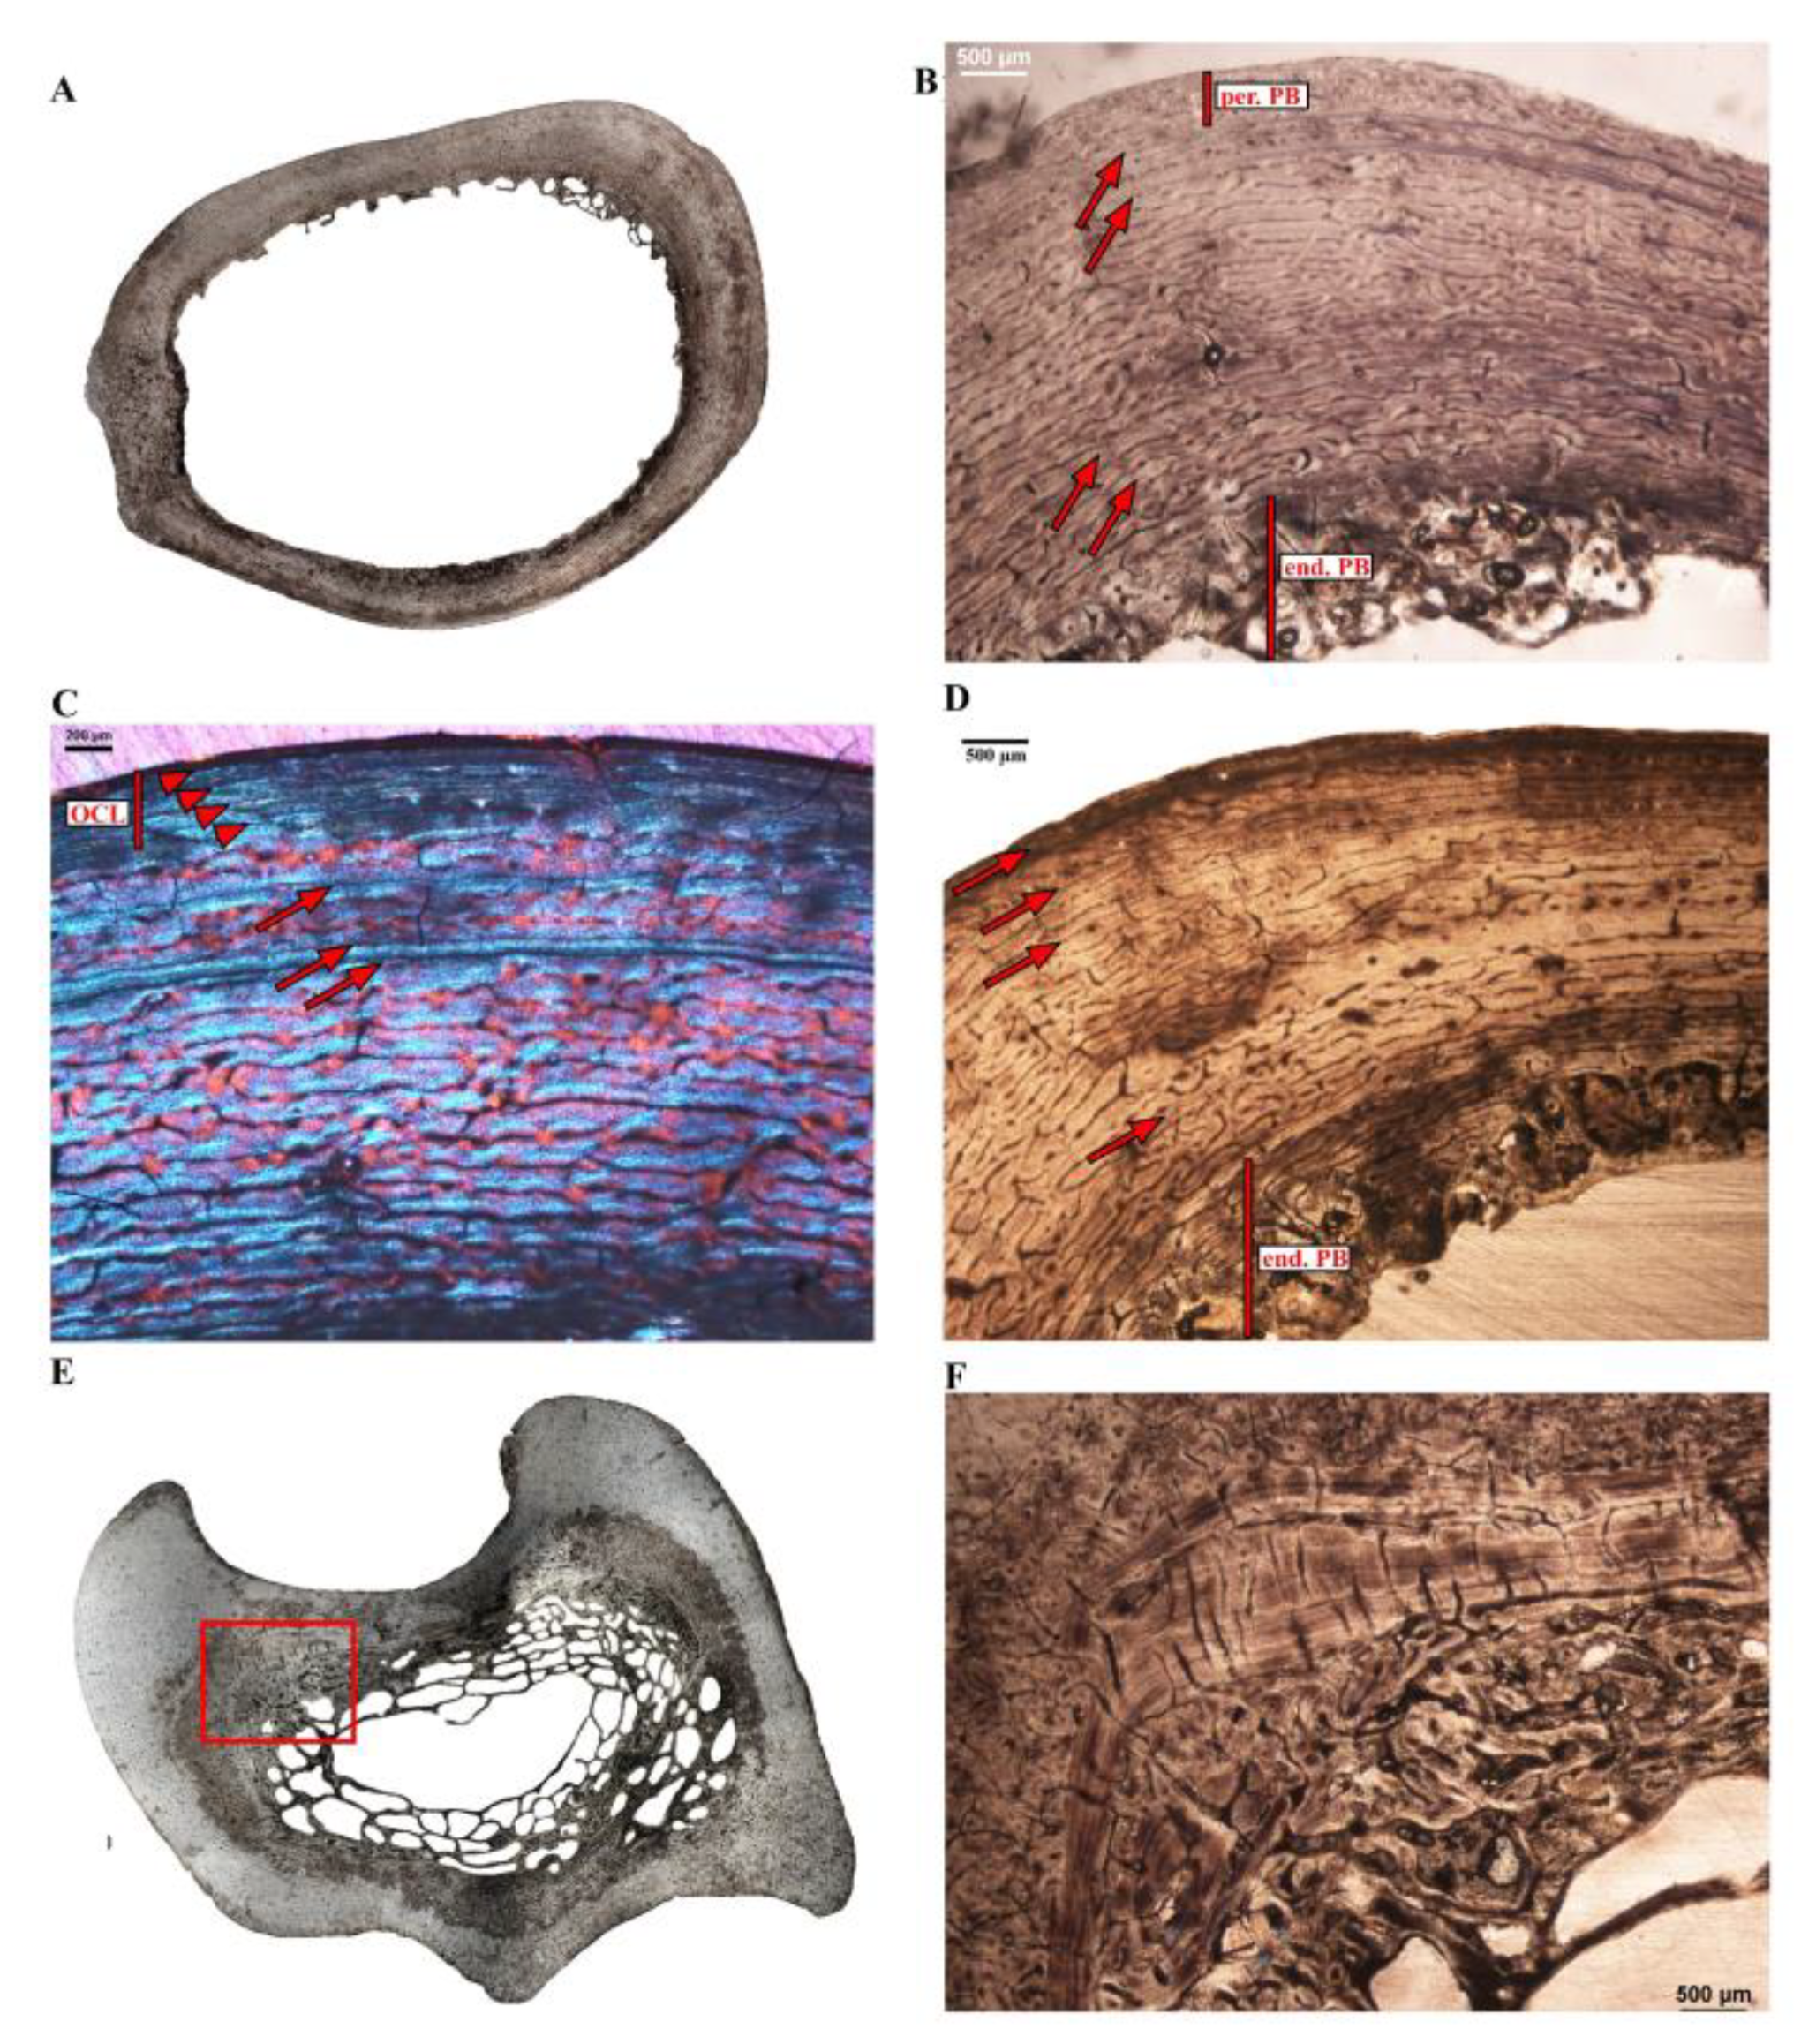
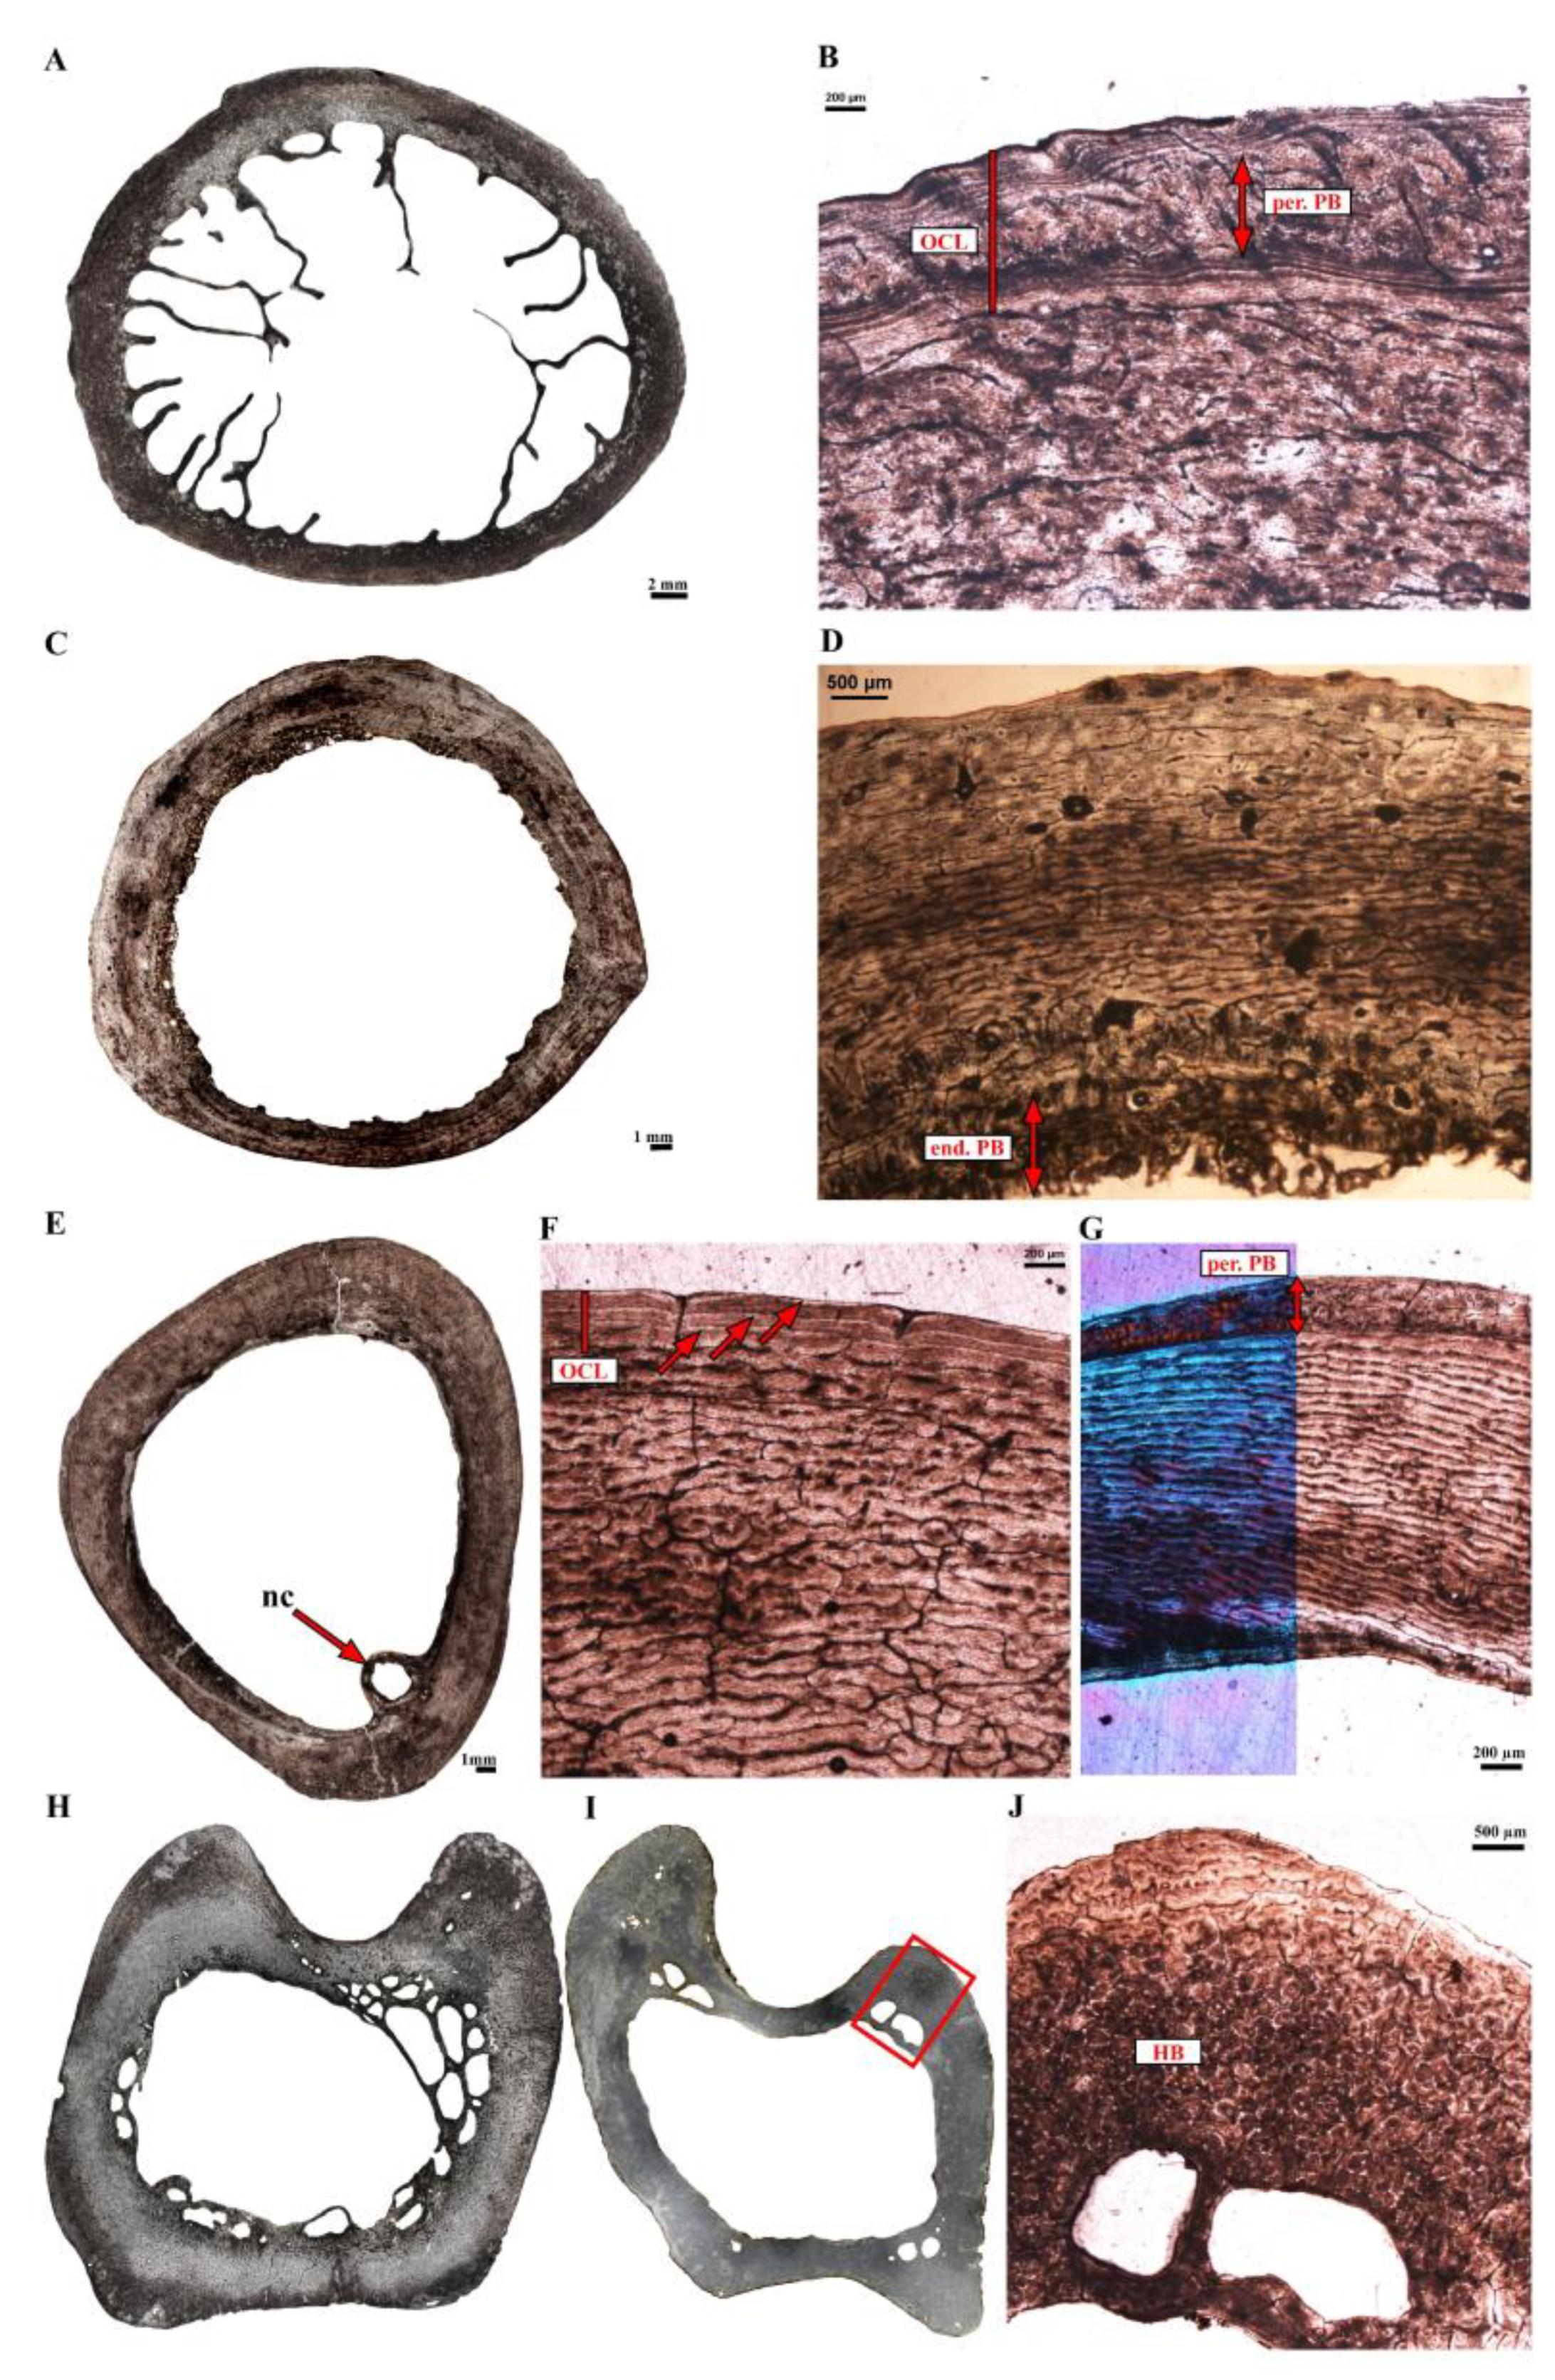
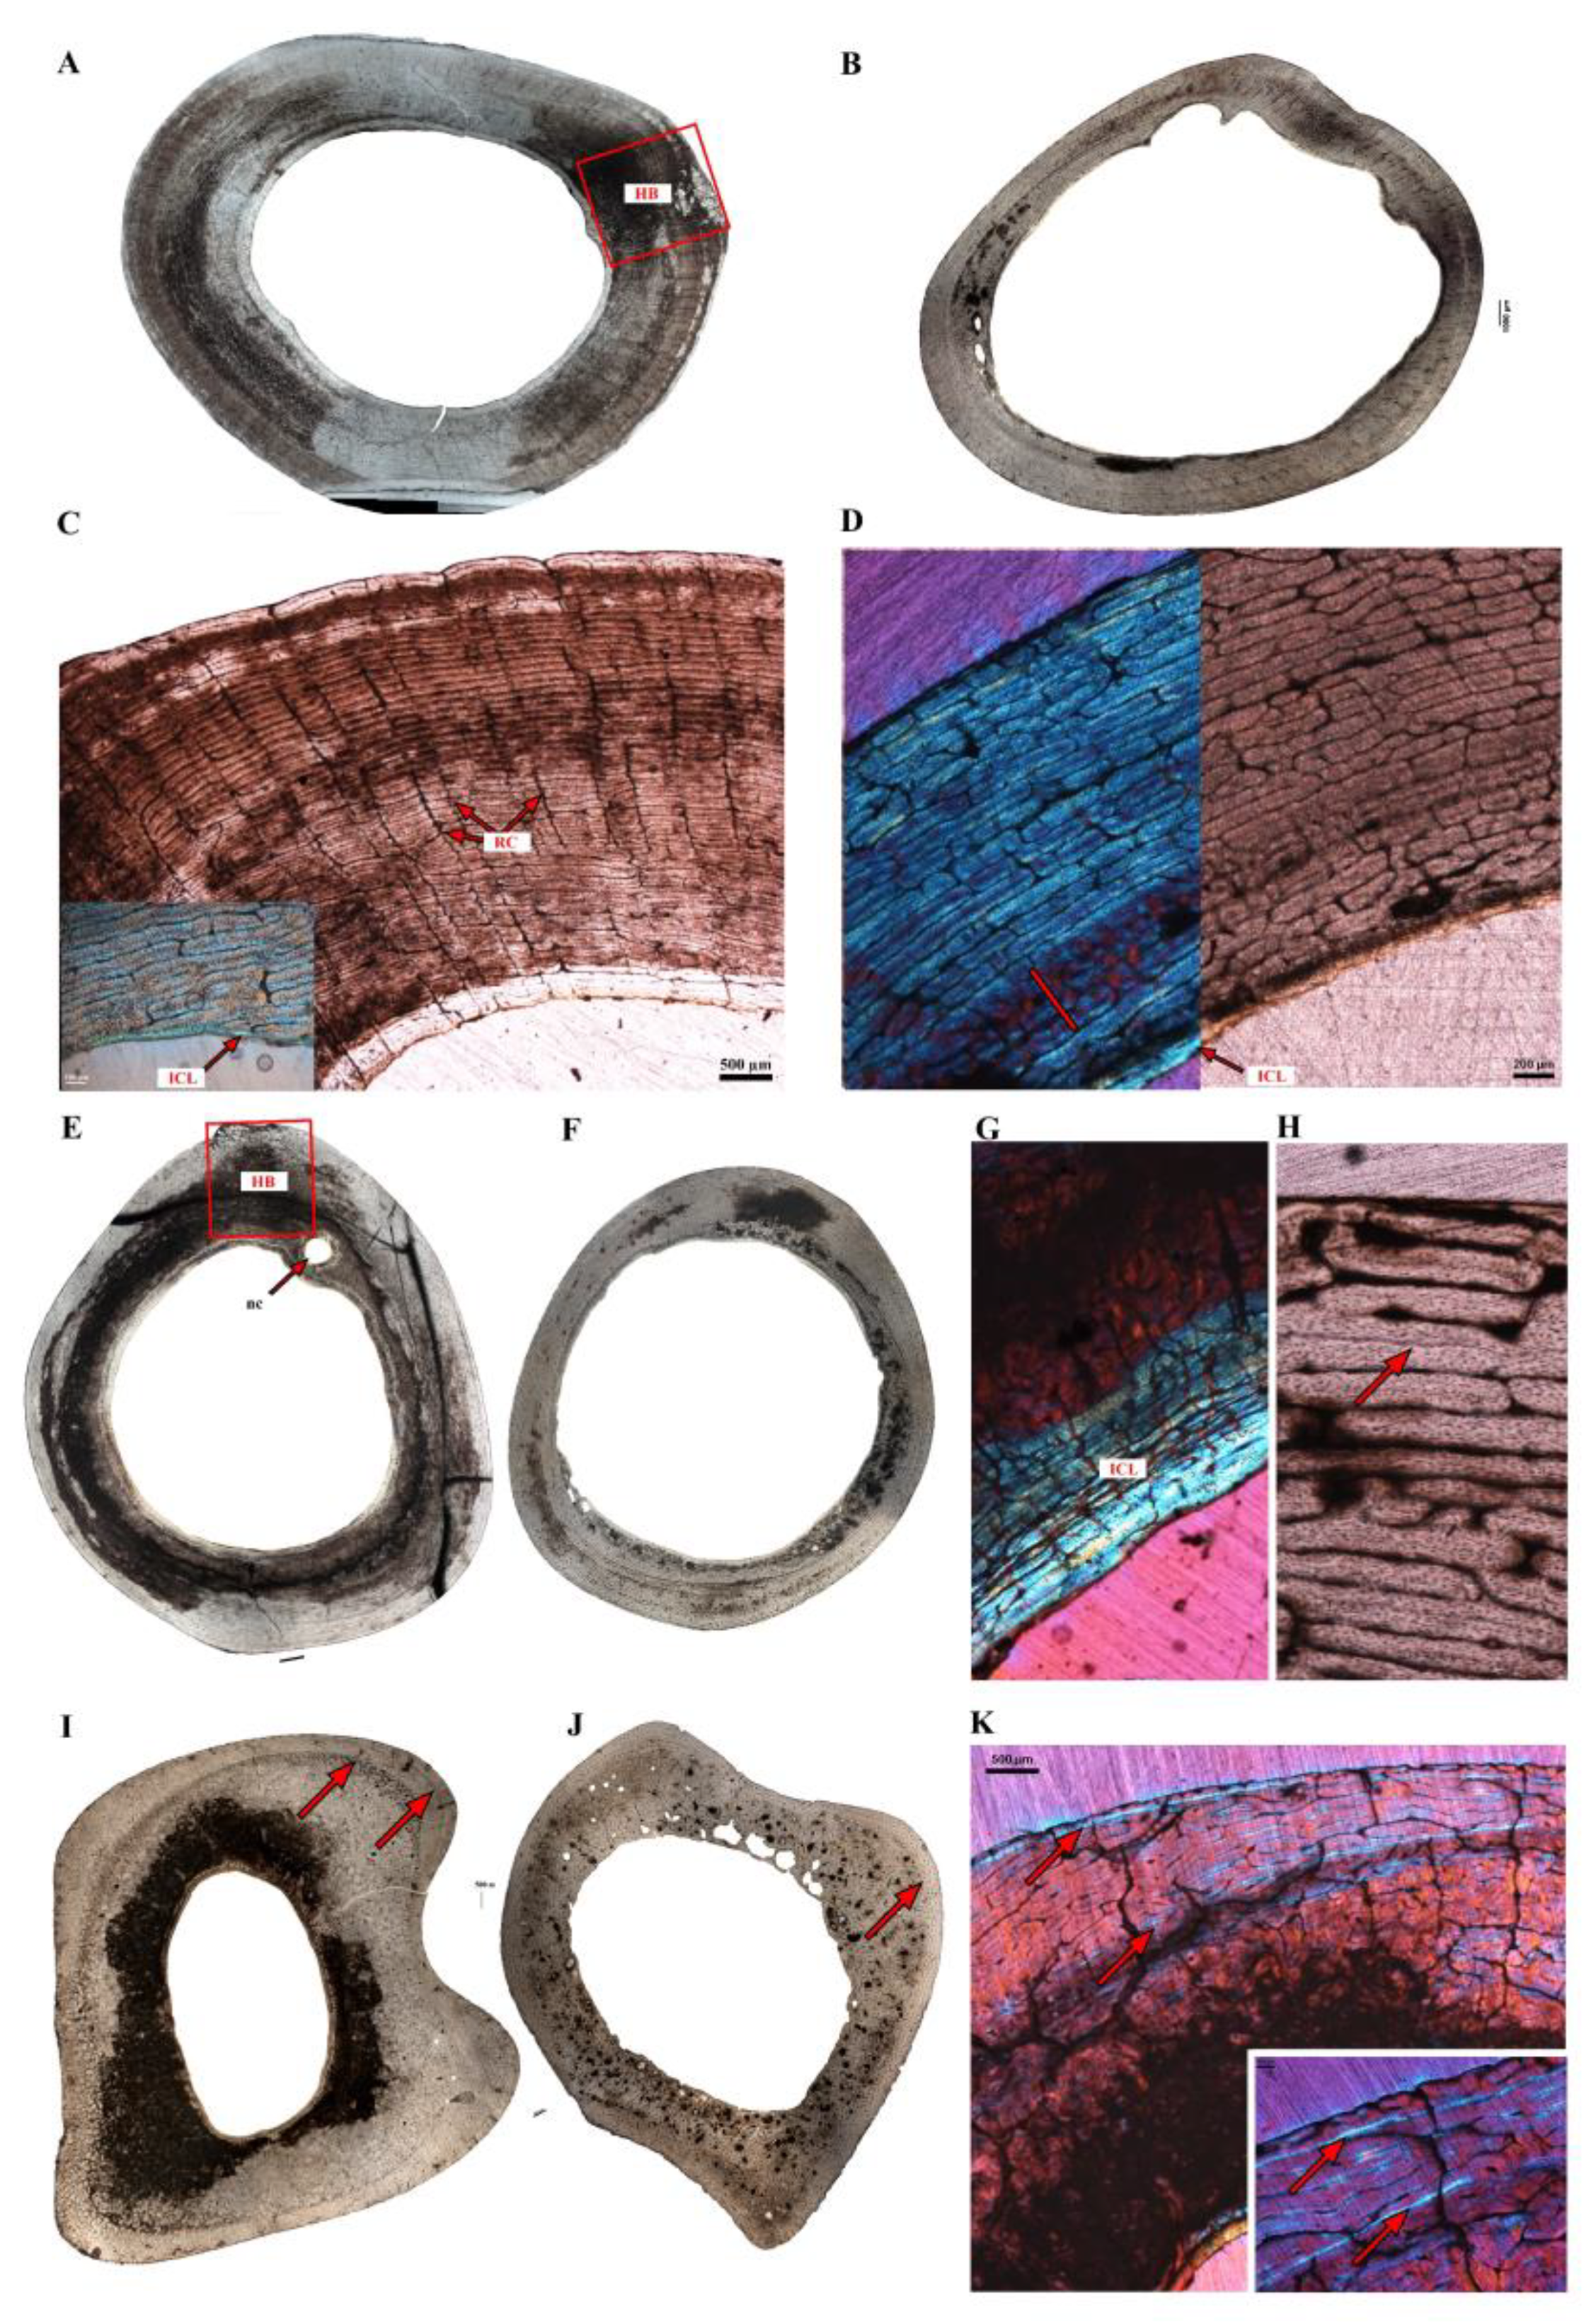
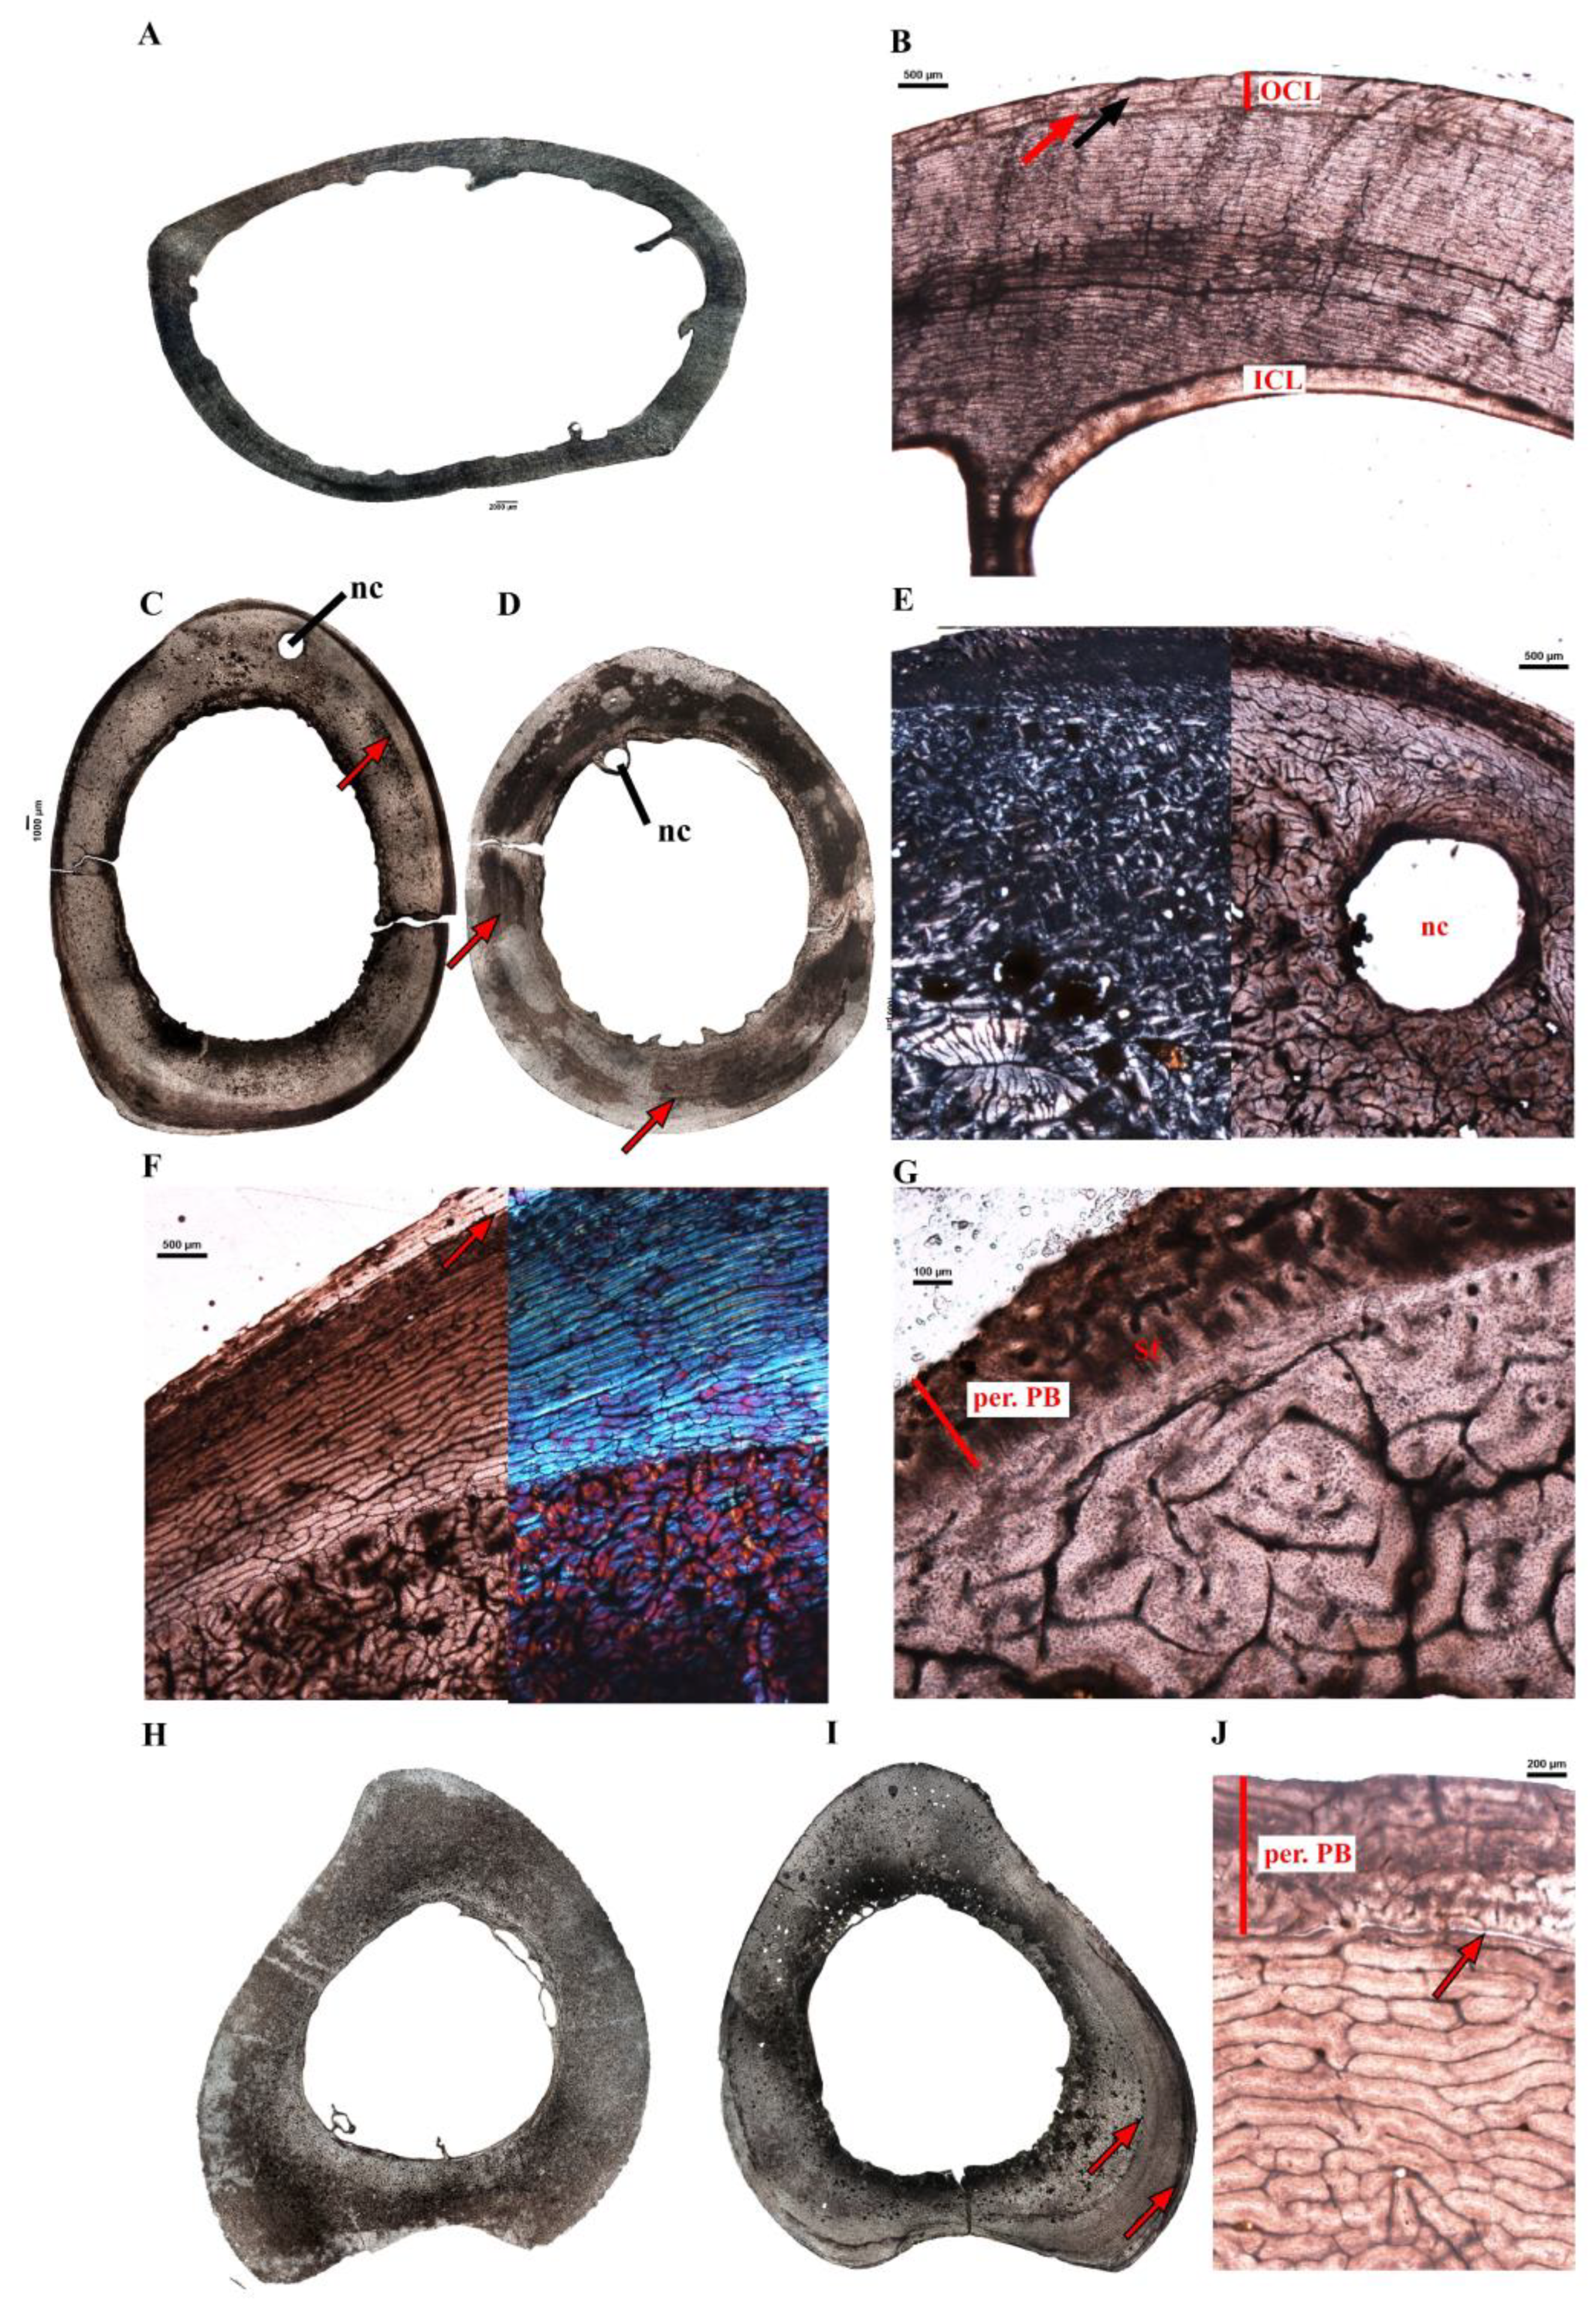
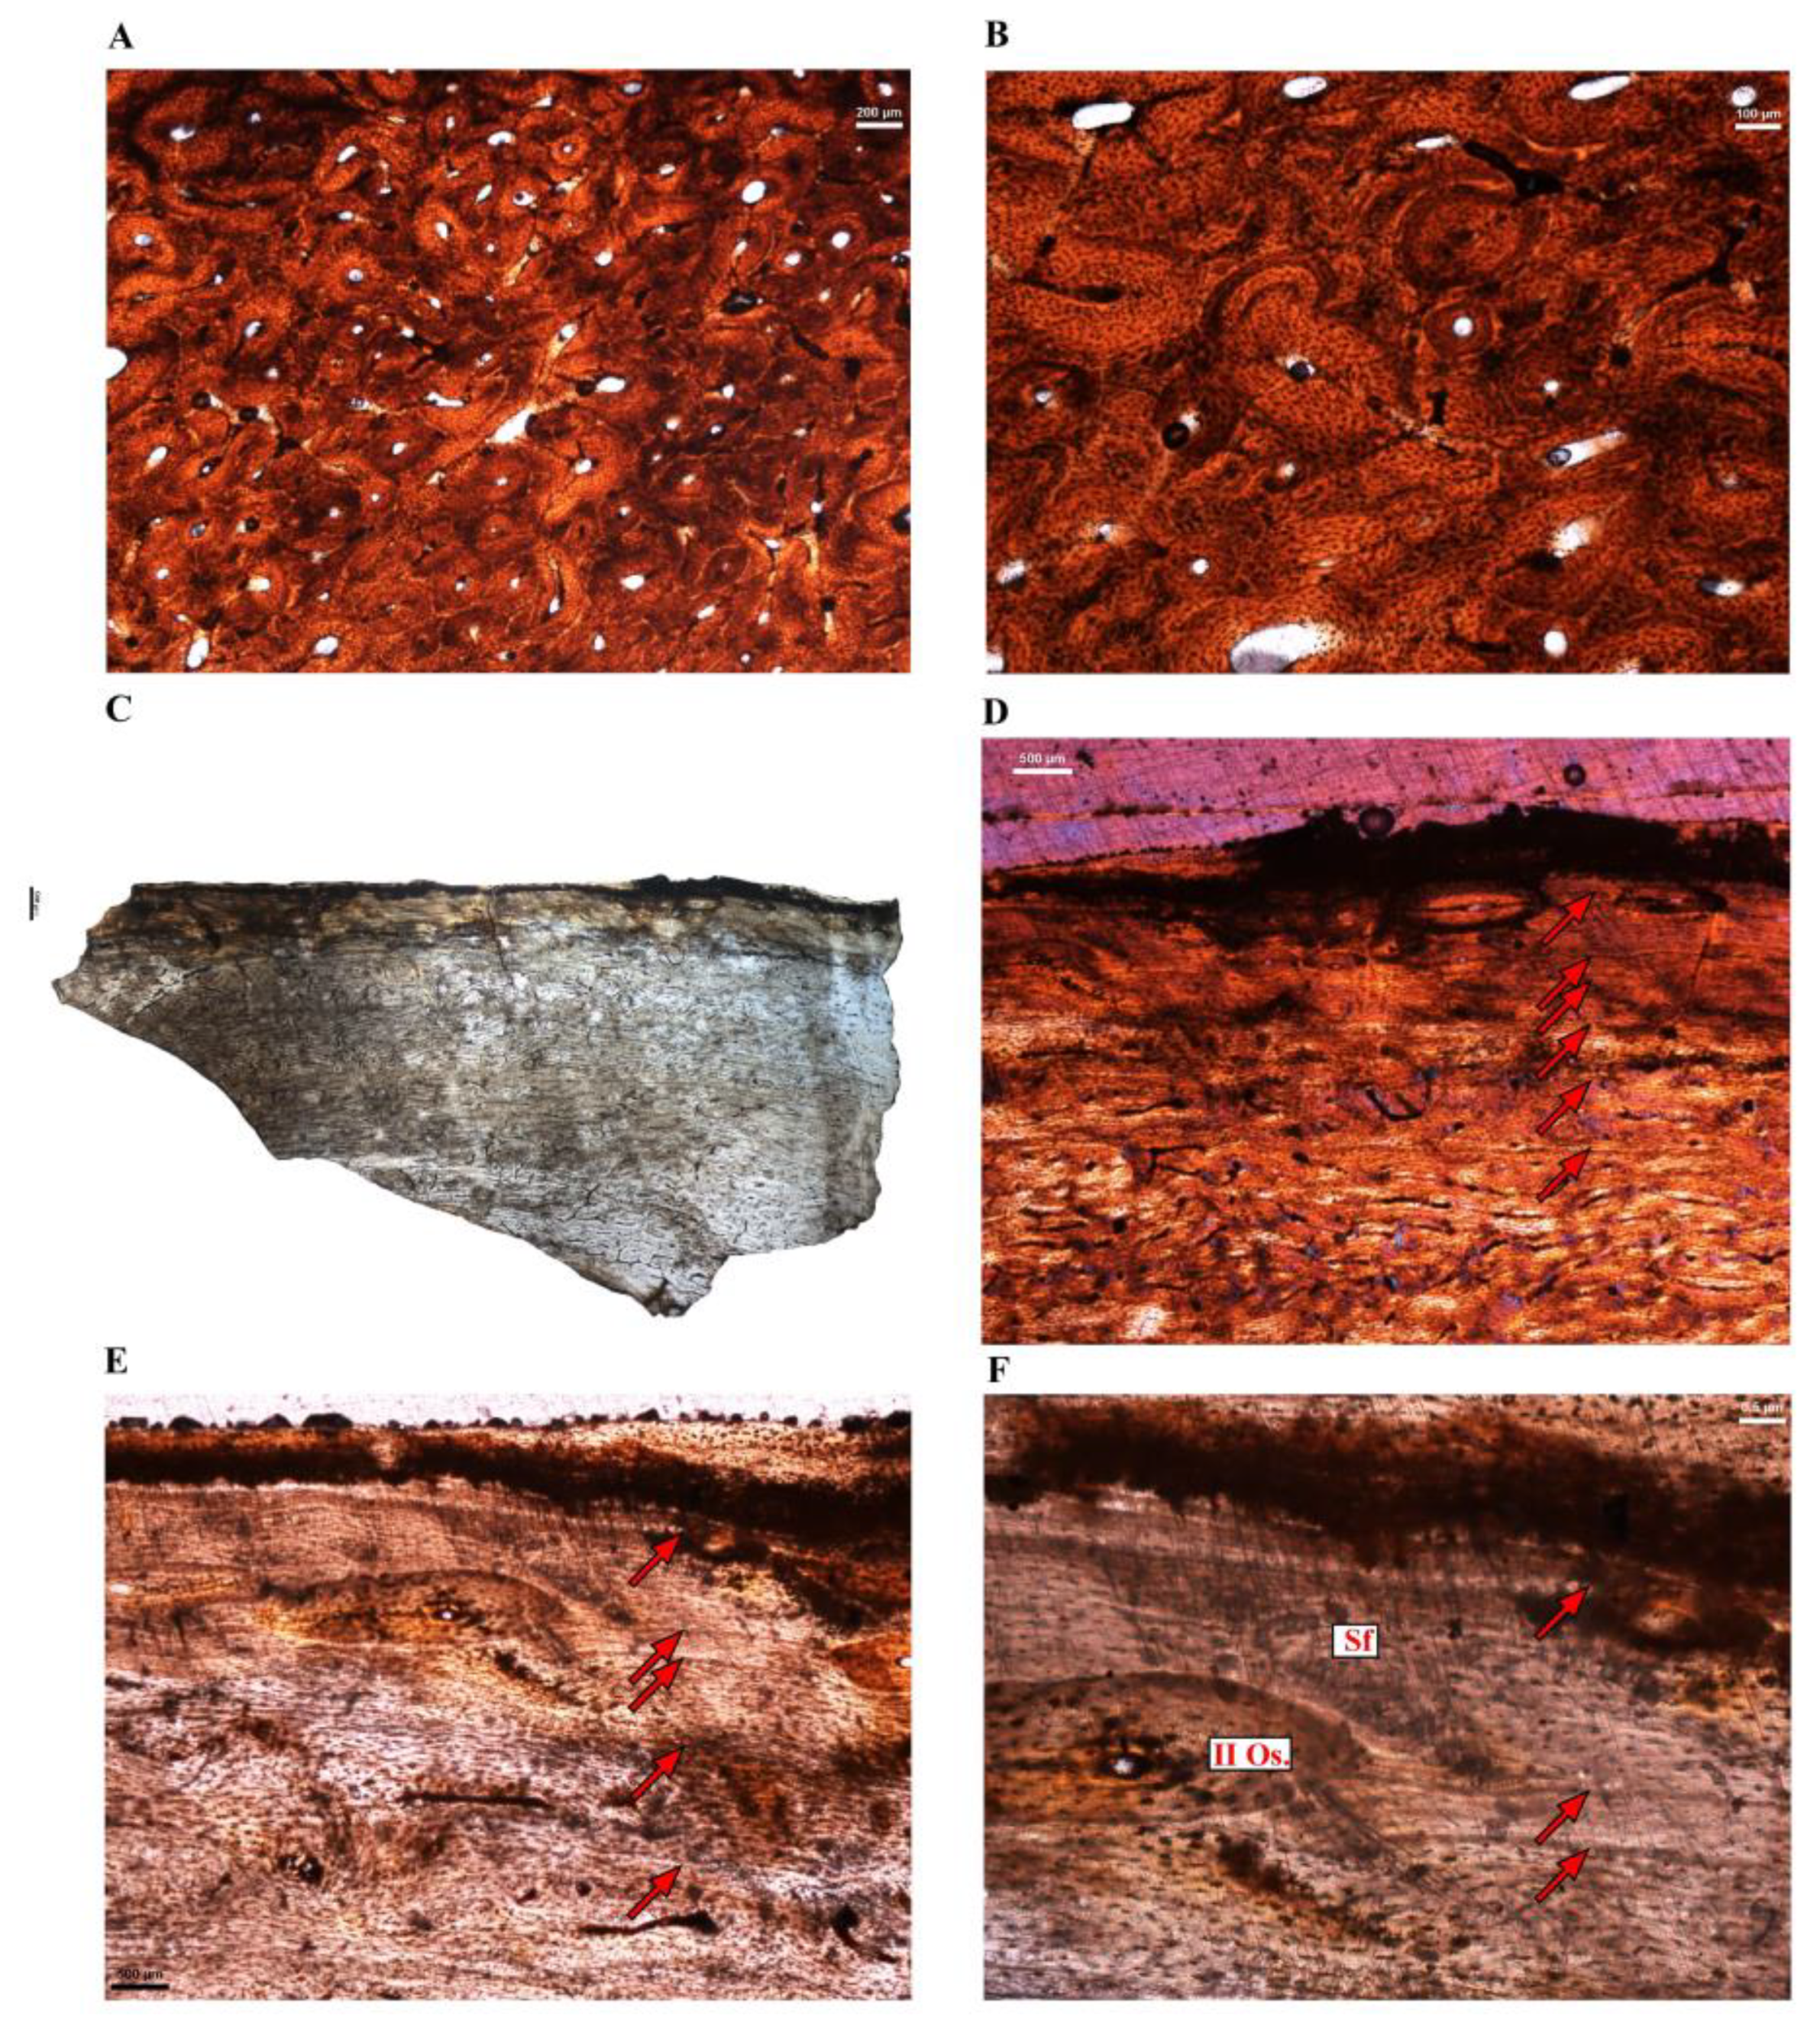
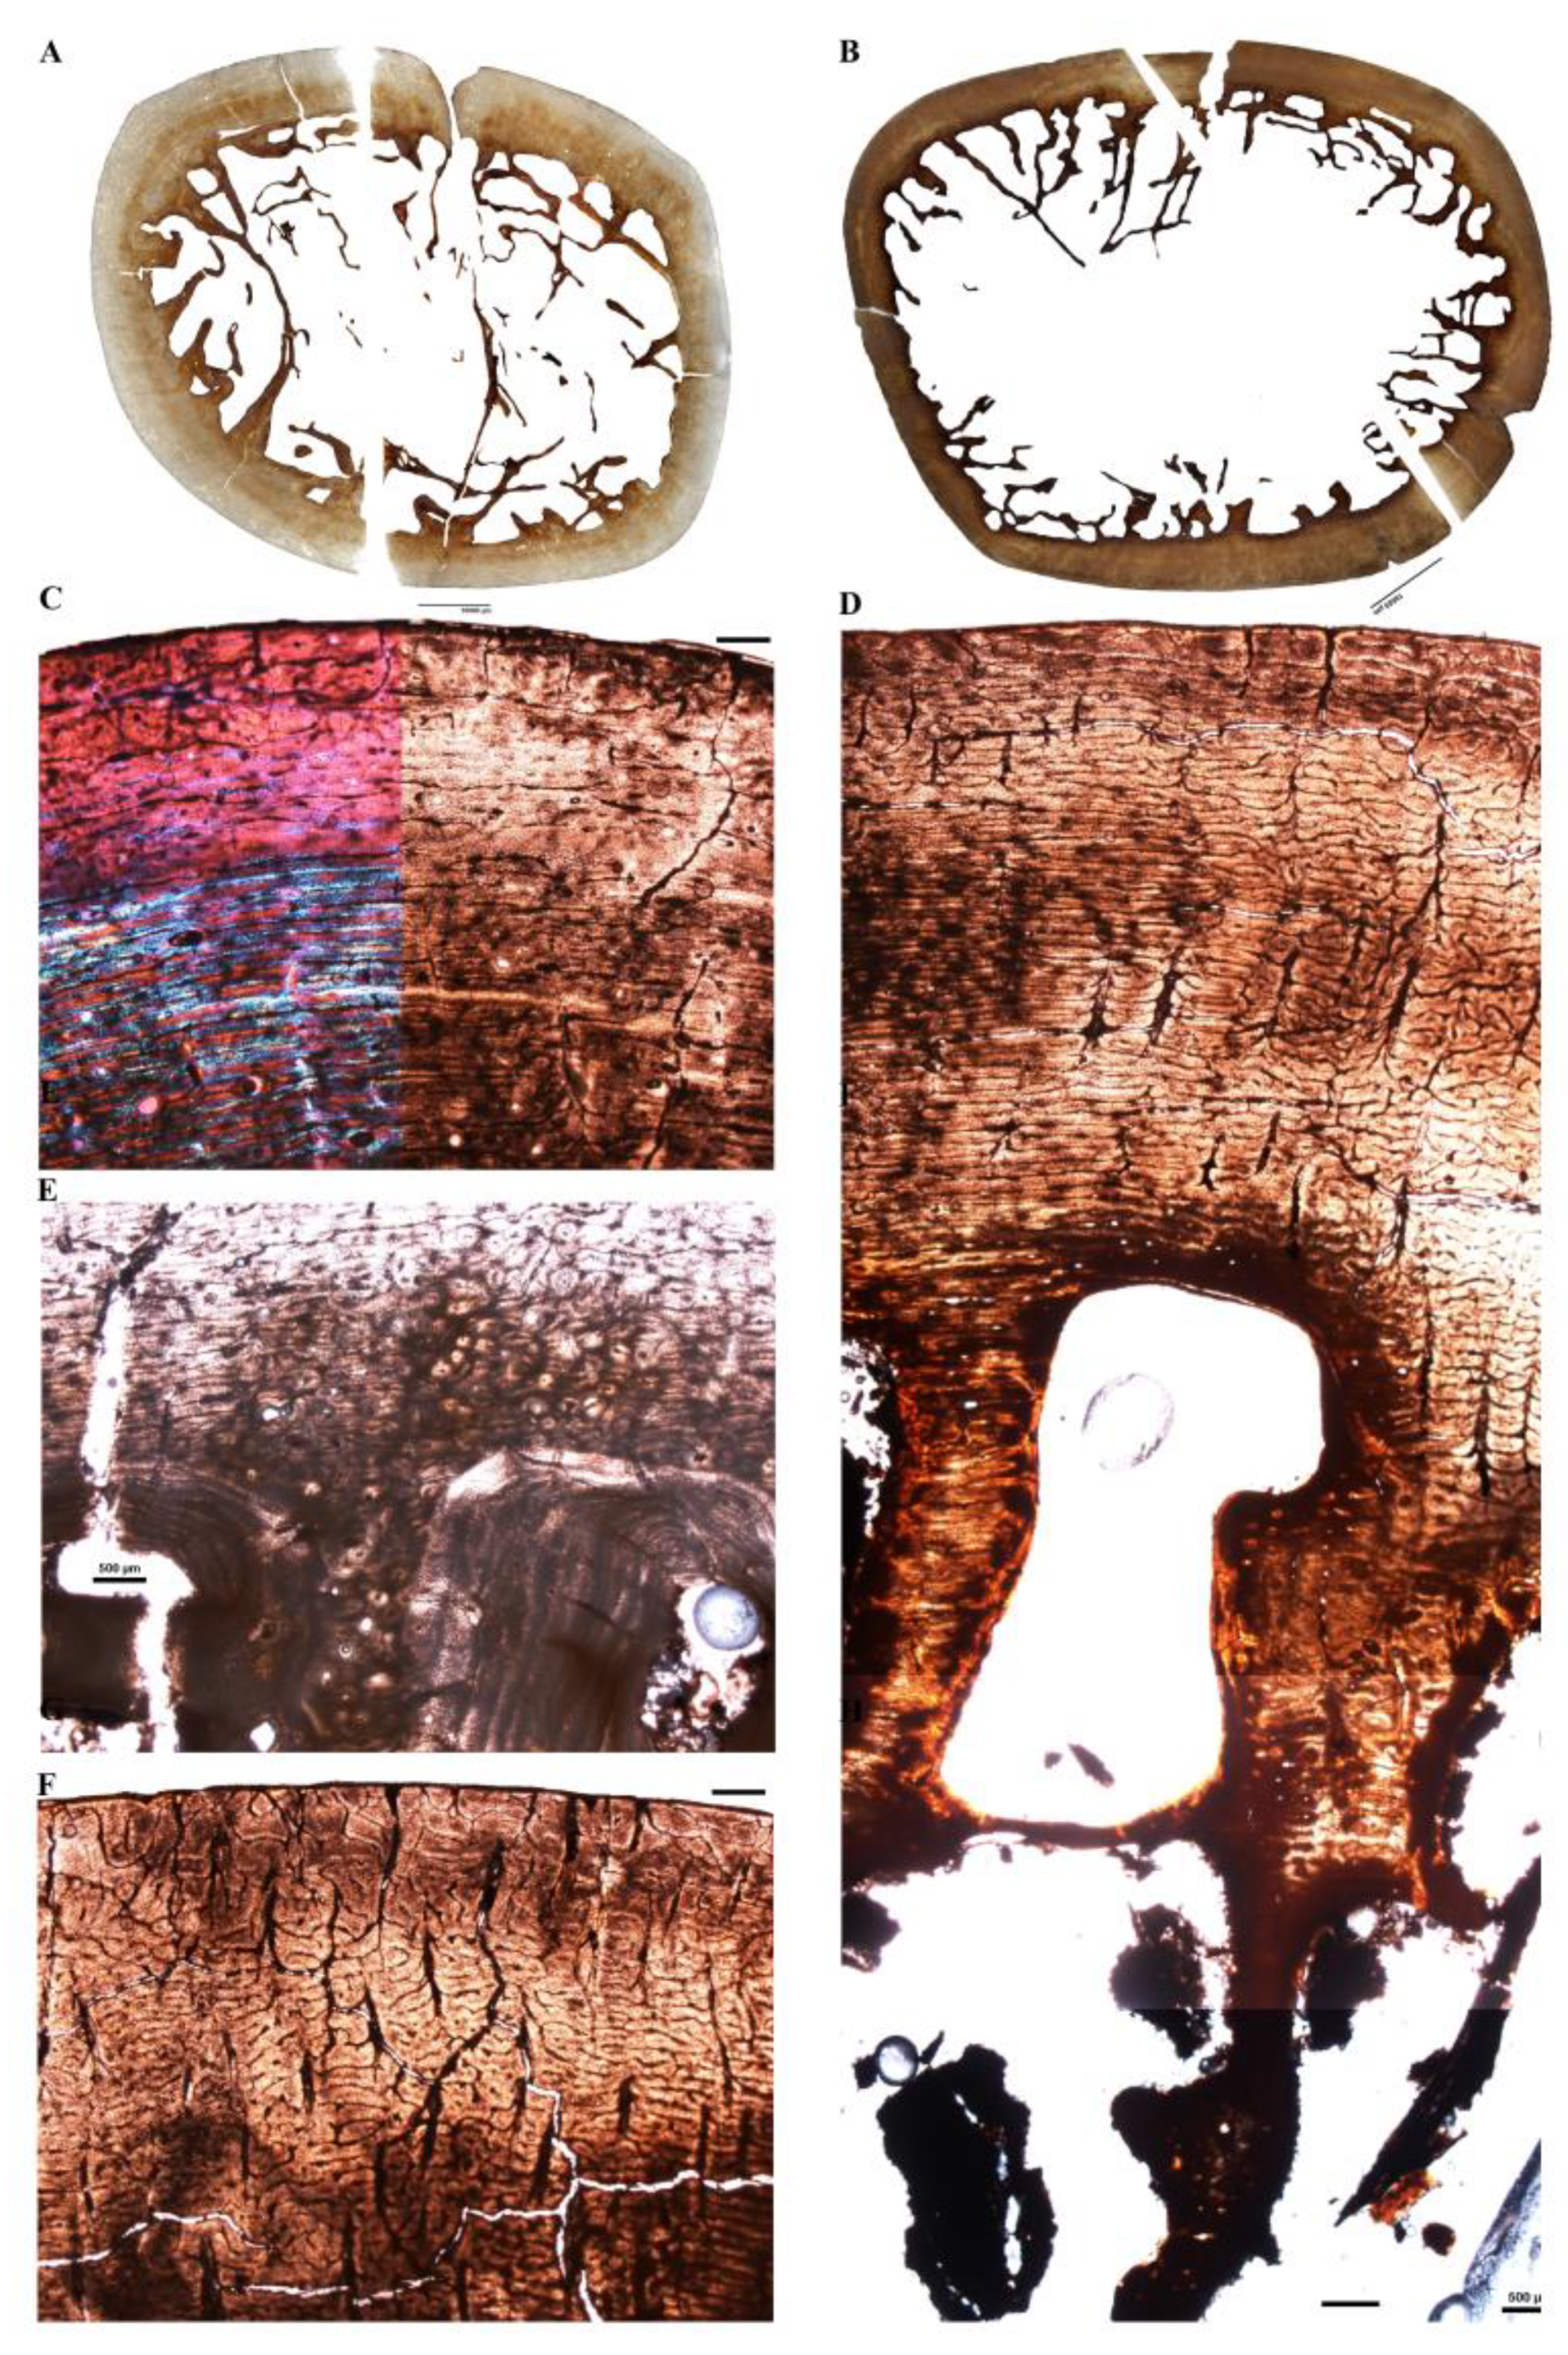
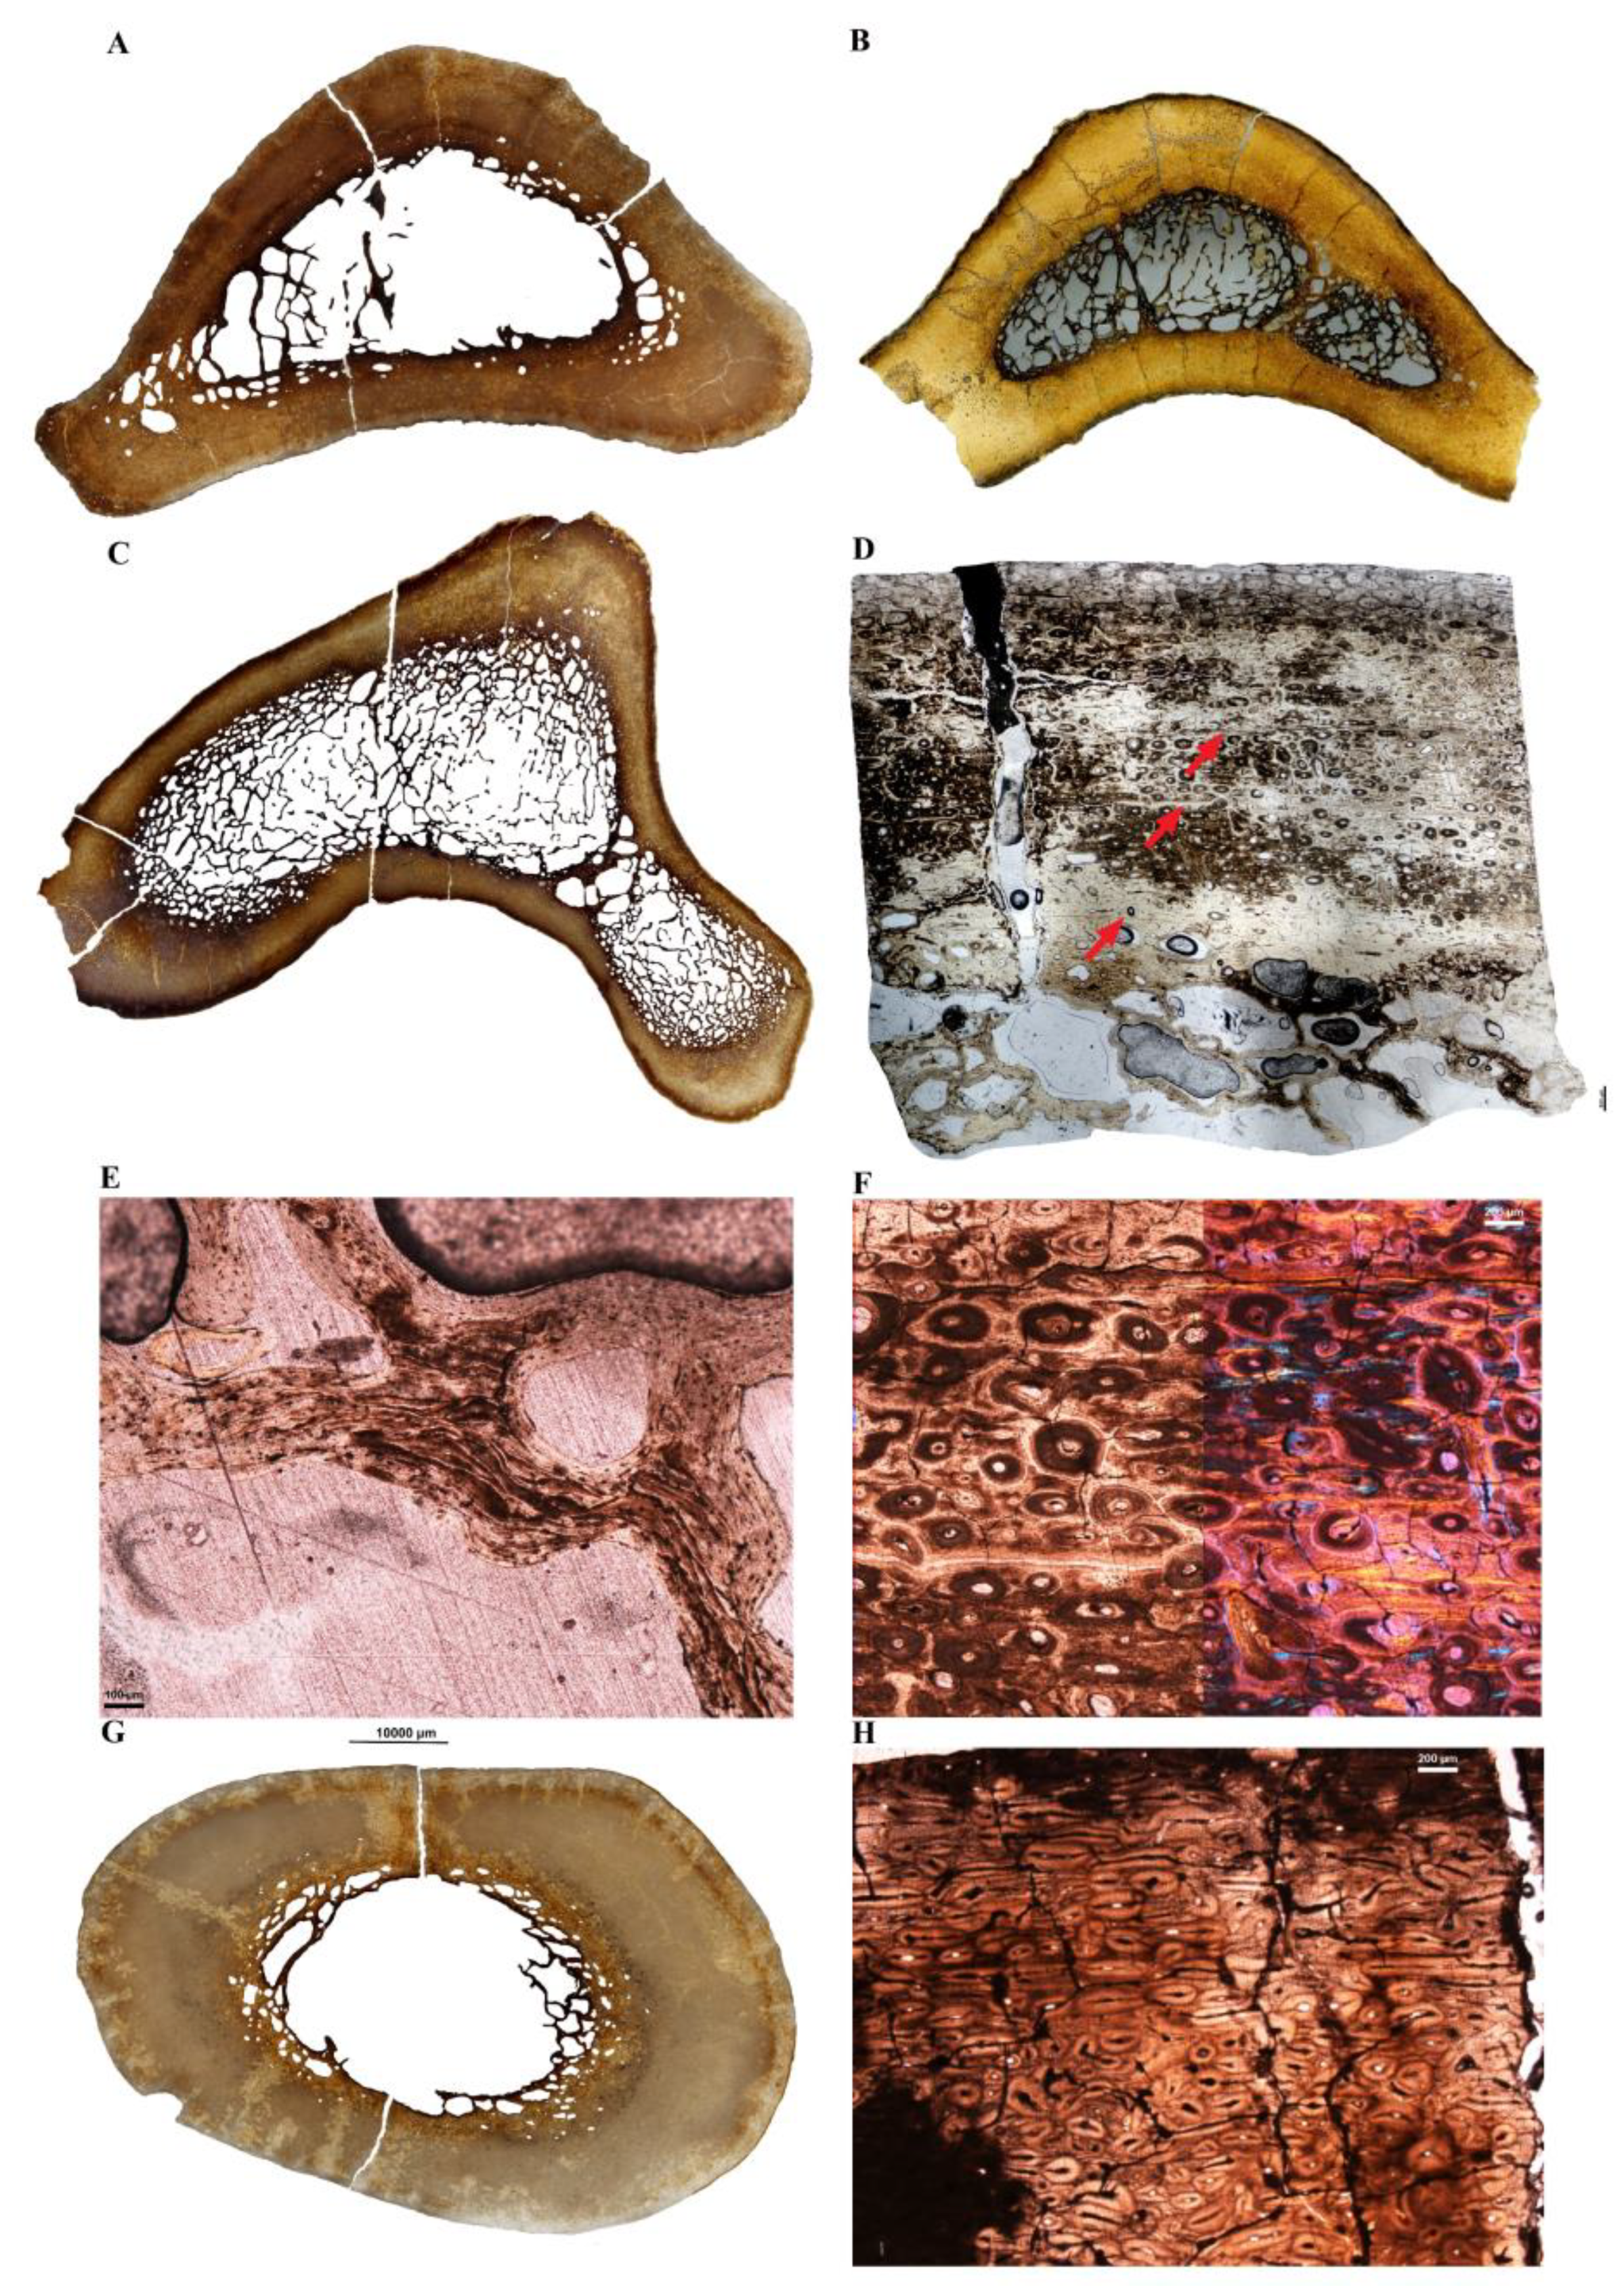
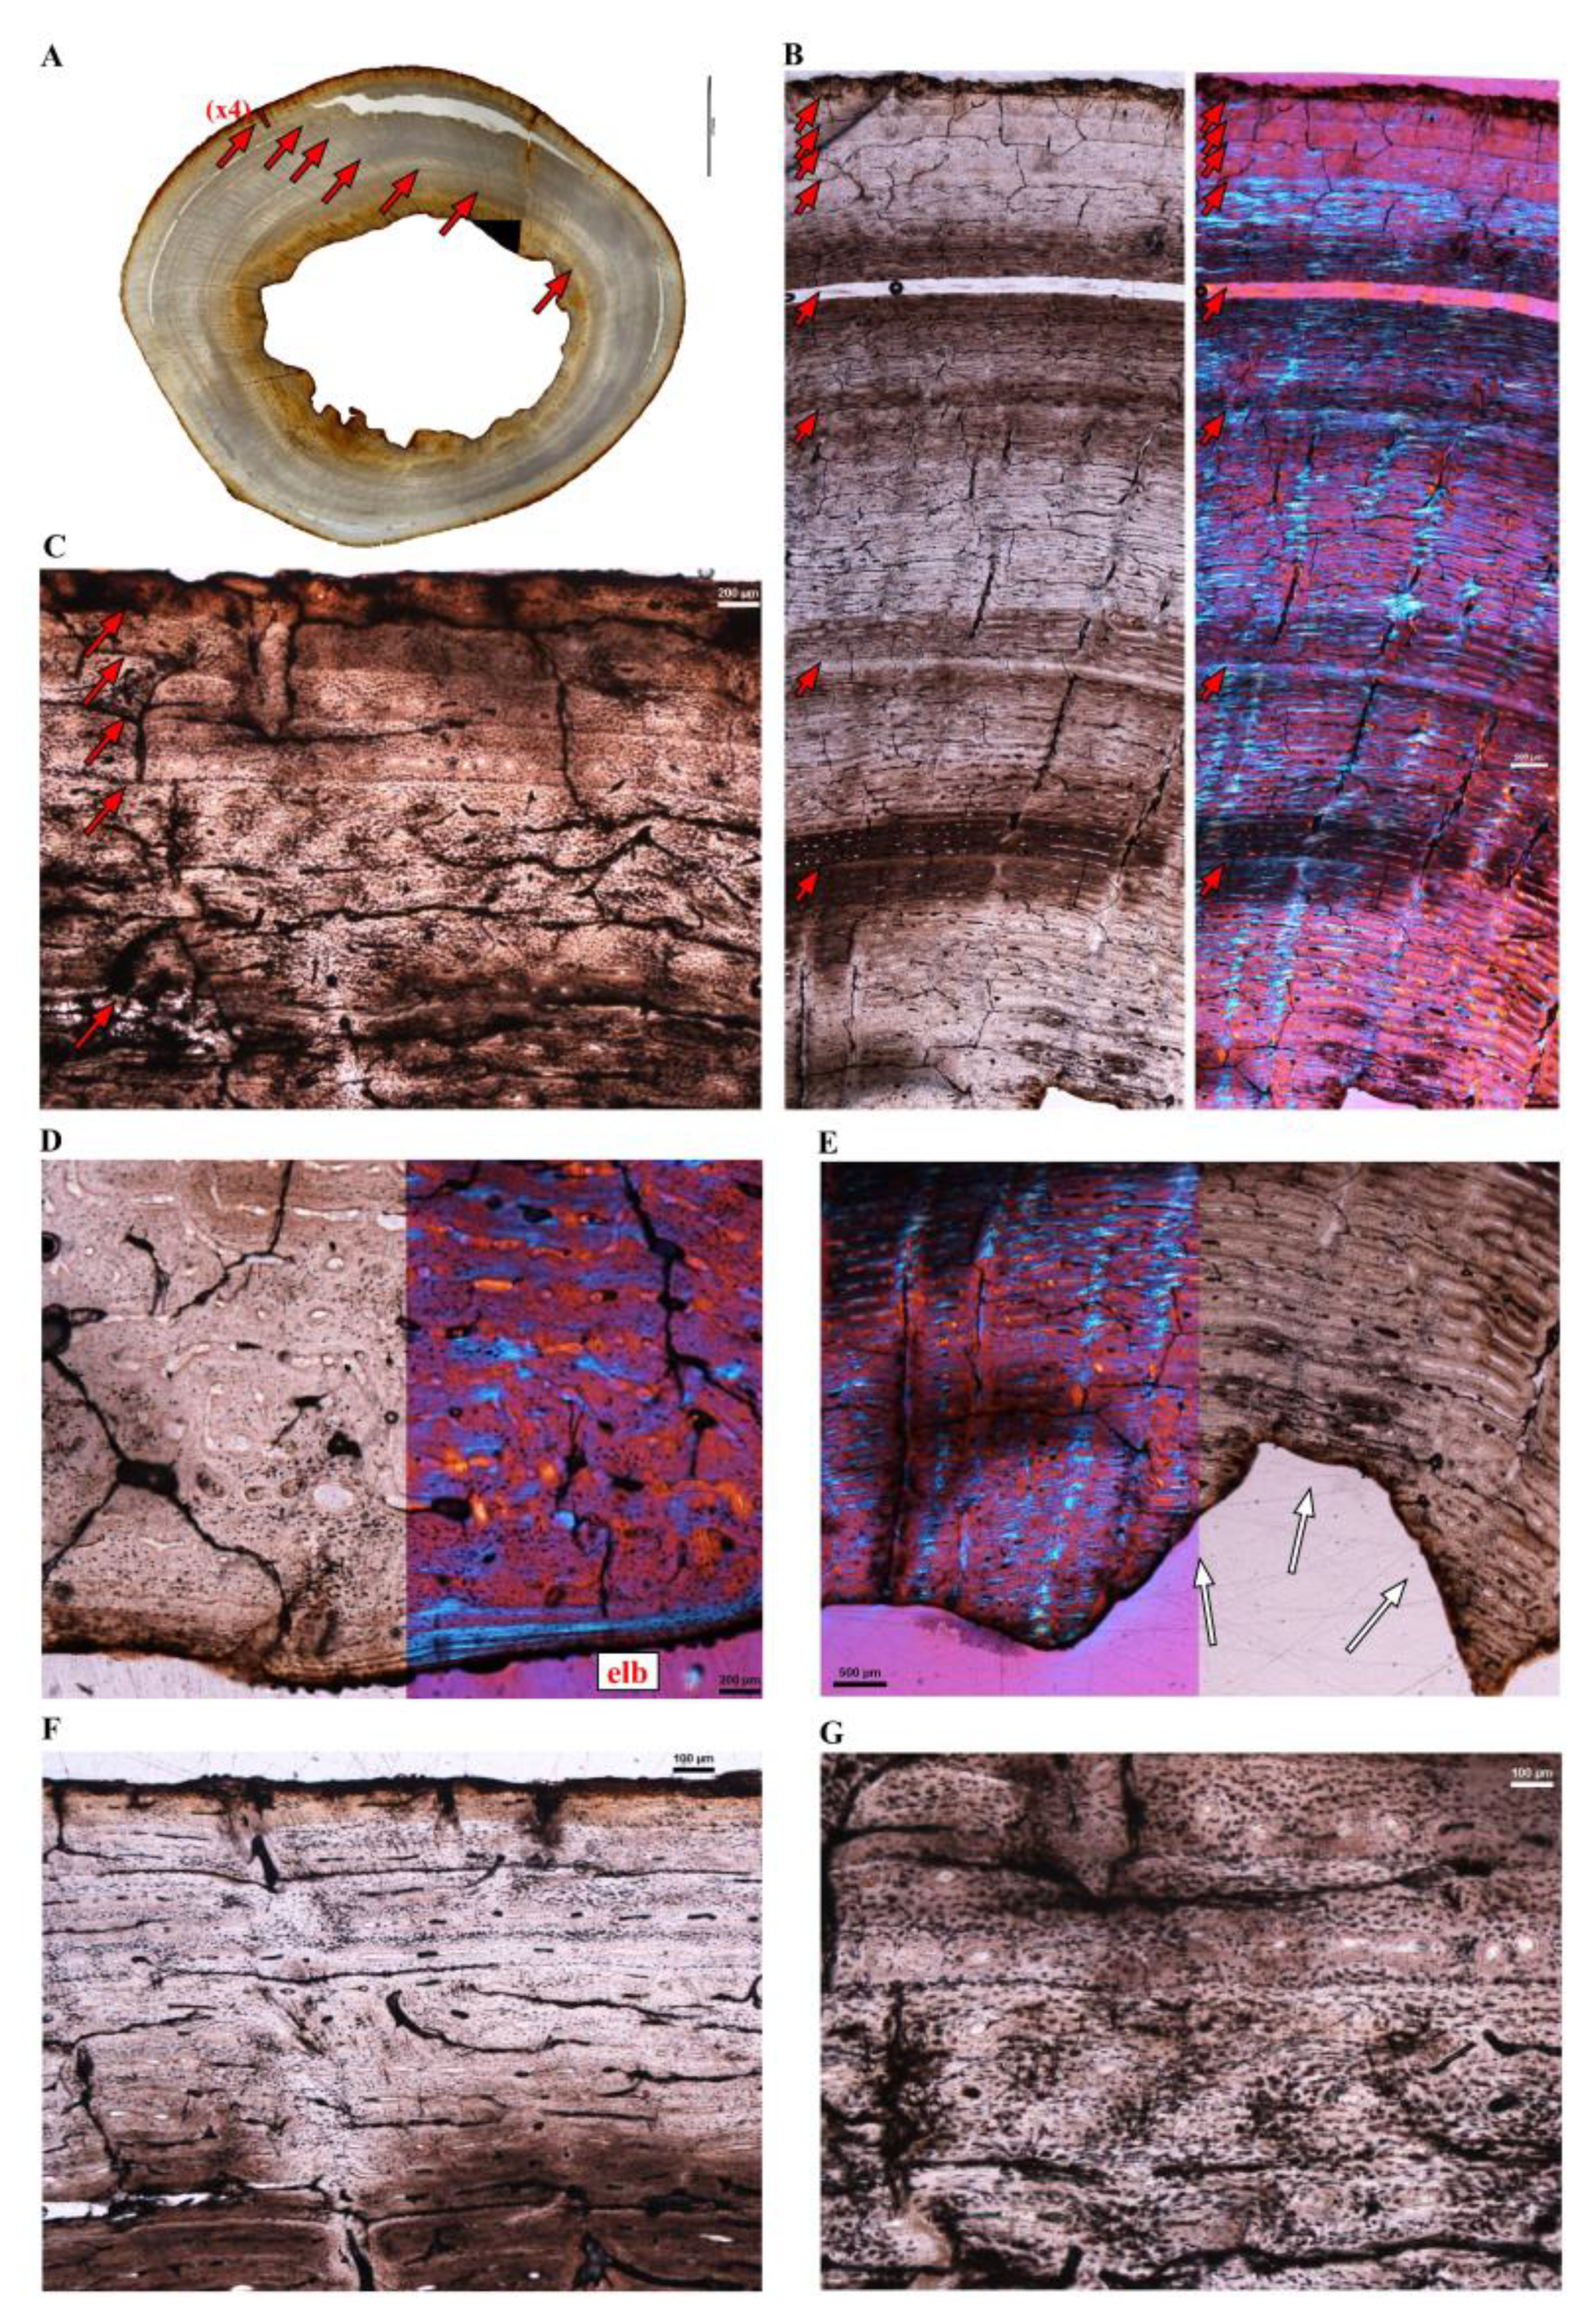
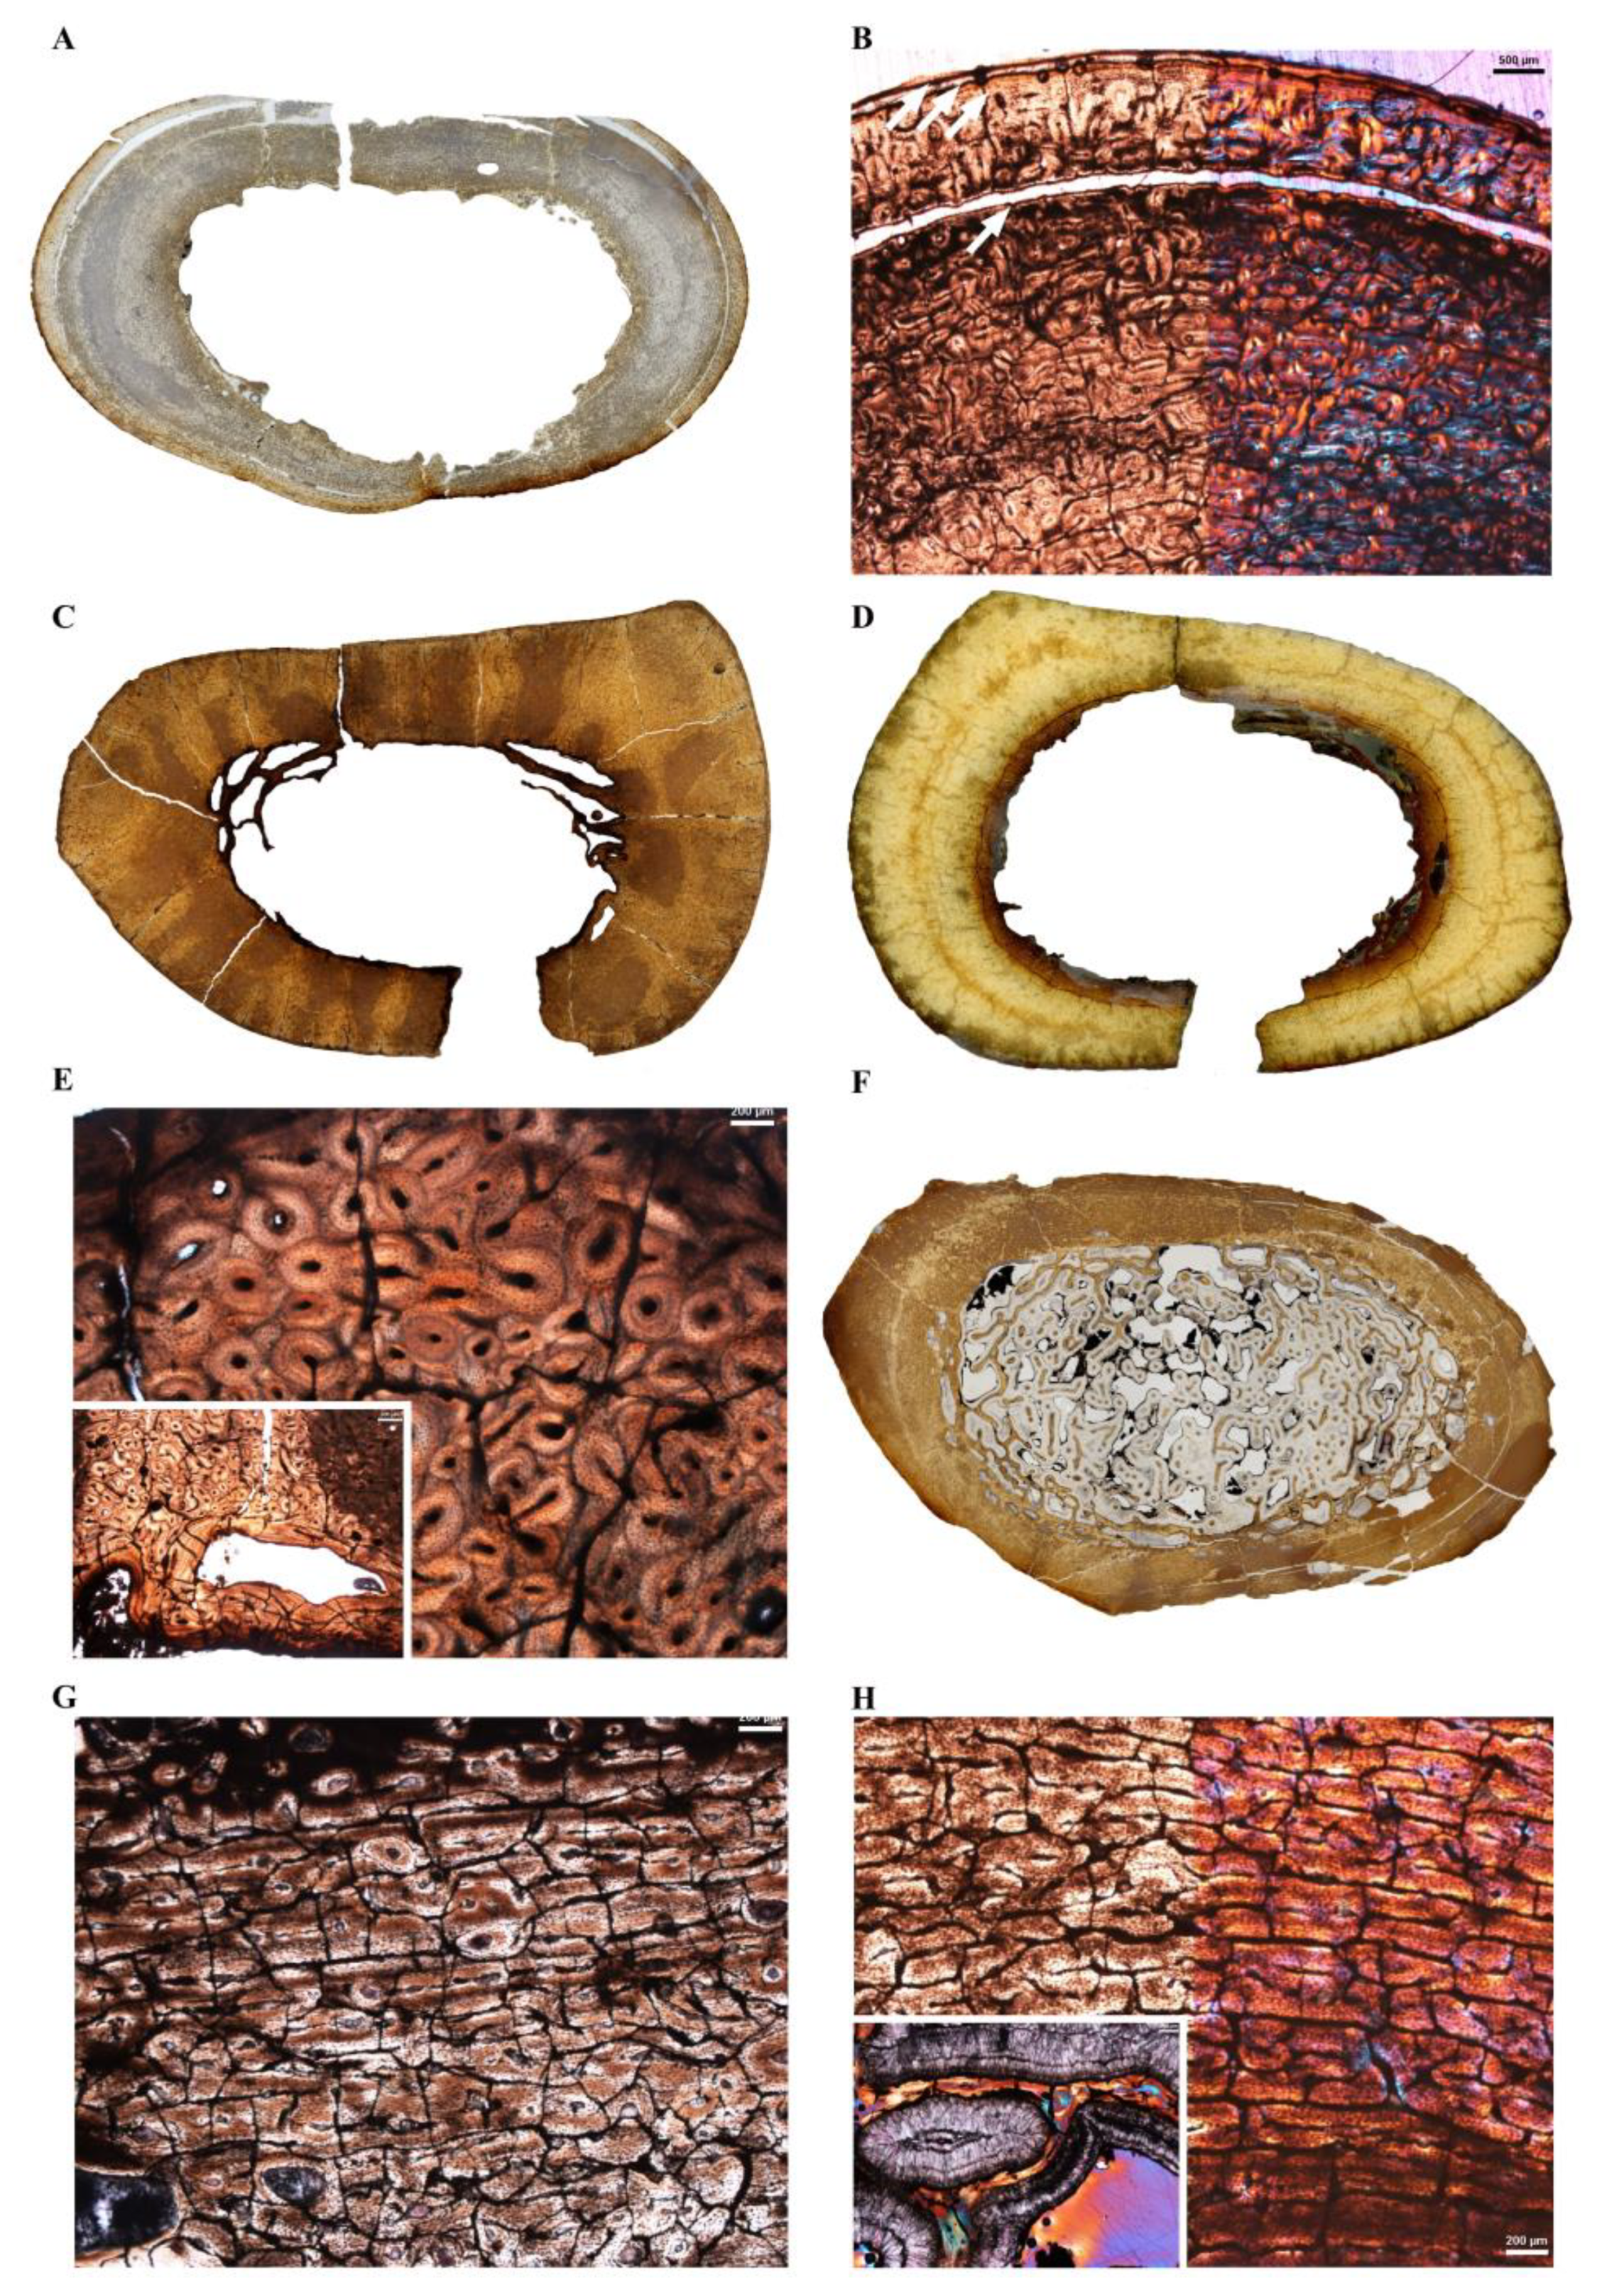
Table 1.
Large terrestrial bird material sampled in this study for histological analysis and simple linear measurements recorded from the limb bones. Abbreviations: BC, bone core taken at mid-diaphysis; Cm, circumference at a minimal diameter of the shaft (which could be used to estimate the body mass of birds, see [9]); CT, complete cross-section taken at mid-diaphysis; Dm, minimal diameter of the shaft measured in dorsal or ventral view; l, left; Lg., maximal length of the limb bone; pe, proximal extremity; r, right.
| Taxon | Sample Number | Bone | MNHN Collection Number | Sample Type | Lg (mm) | Dm (mm) | Lg/Dm | Cm (mm) |
|---|---|---|---|---|---|---|---|---|
| Extant palaeognaths | ||||||||
| Casuarius casuarius | Cc-fm-1 | Femur (l) | 1923-879 SS-S.B.S2.M1.C1 | CT | 224 | - | - | 87 |
| Casuarius casuarius | Cc-fm-2 | Femur (r) | 1923-879 SS-S.B.S2.M1.C1 | CT | - | - | - | - |
| Casuarius casuarius | Cc-tb-1 | Tibiotarsus (r) | 1923-877 SS-S.B.S2.M1.C1 | CT | 389 | - | - | 78 |
| Casuarius casuarius | Cc-tb-2 | Tibiotarsus (l) | 1923-877 SS-S.B.S2.M1.C1 | CT | 386 | - | - | 78 |
| Casuarius casuarius | Cc-tm-1 | Tarsometatarsus (l) | 1923-878 SS-S.B.S2.M1.C1 | CT | 295 | 22.8 | 12.94 | 76 |
| Casuarius casuarius | Cc-tm-2 | Tarsometatarsus (l) | 1923-878 | CT | 290 | 23.2 | 12.5 | 74 |
| Dromaius novaehollandiae | Dn-fm-1 | Femur (r) | 1923-900 SS-S.B.S2.M1.C23 | CT | 221 * | - | - | 95 * |
| Dromaius novaehollandiae | Dn-fm-2 | Femur (l) | 1923-897 SS-S.B.S2.M1.C23 | CT | 234 | - | - | 99 |
| Dromaius novaehollandiae | Dn-tb-1 | Tibiotarsus (l) | 1923-899 SS-S.B.S2.M1.C23 | CT | 456 | - | - | 91 |
| Dromaius novaehollandiae | Dn-tb-2 | Tibiotarsus (l) | 1923-899 SS-S.B.S2.M1.C23 | CT | 454 | - | - | 87 |
| Dromaius novaehollandiae | Dn-tm-1 | Tarsometatarsus (l) | 1923-898 SS-S.B.S2.M1.C23 | CT | 387 | 17.92 | 21.60 | 76 |
| Dromaius novaehollandiae | Dn-tm-2 | Tarsometatarsus (r) | 1923-898 SS-S.B.S2.M1.C23 | CT | 400 | 19.28 | 20.75 | 84 |
| Rhea americana | Ra-fm-1 | Femur (l) | 1920-116 | CT | - | - | - | - |
| Rhea americana | Ra-fm-2 | Femur (l) | - | CT | 186 | - | - | 60 |
| Rhea americana | Ra-tb-1 | Tibiotarsus (r) | - | CT | 286 | - | - | 55 |
| Rhea americana | Ra-tb-2 | Tibiotarsus (l) | 1920-116 | CT | 354 | - | - | 73 |
| Rhea americana | Ra-tm-1 | Tarsometatarsus (l) | 1920-116 | CT | 316 | 15.64 | 20.20 | 58 |
| Rhea americana | Ra-tm-2 | Tarsometatarsus (l) | - | CT | 272 | 13.15 | 20.68 | 48 |
| Struthio camelus | Sc-fm-1 | Femur (l) | A4751 SS-S.B.S2.M1.C21 | CT | 301 * | - | - | 140 * |
| Struthio camelus | Sc-fm-2 | Femur (l) | - | CT | 327 | - | - | 140.5 |
| Struthio camelus | Sc-tb-1 | Tibiotarsus (l) | - | CT | 597 | - | - | 109 |
| Struthio camelus | Sc-tb-2 | Tibiotarsus (r) | A-5-100 SS-S.B.S2.M1.C21 | CT | 470 | - | - | 97 |
| Struthio camelus | Sc-tm-1 | Tarsometatarsus (r) | - | CT | 514 | 32.95 | 15.60 | 97 |
| Struthio camelus | Sc-tm-2 | Tarsometatarsus (l) | - | CT | 460 | 28.90 | 15.92 | 85 |
| Extinct palaeognaths | - | |||||||
| Vorombe titan | Ae-fm-1 | Femur (r) | 1937-62 | BC | 360 | - | - | - |
| Aepyornis maximus | Ae-fm-2 | Femur (l) | MAD367 1906-17 | CT | 380 | - | - | 244 |
| Aepyornis maximus | Ae-fm-3 | Femur (r) | MAD 365 | CT | 350 | - | - | 244 |
| Vorombe titan | Ae-tb-1 | Tibiotarsus | 1910-12 | CT | - | - | - | 190 |
| Aepyornithidae indet. | Ae-tb-2 | Tibiotarsus pe (l) | - | CT | - | - | - | - |
| Aepyornithidae indet. | Ae-tb-3 | Tibiotarsus pe (r) | - | CT | - | - | - | - |
| Aepyornithidae indet. | Ae-tb-4 | Tibiotarsus (l) | 1937-62 | BC | 612 | - | - | - |
| Vorombe titan | Ae-tb-5 | Tibiotarsus (r) | 1937-62 | BC | 645 | - | - | - |
| Vorombe titan | Ae-tb-6 | Tibiotarsus (l) | 1937-62 | BC | 670 | - | - | - |
| Aepyornithidae indet. | Ae-tb-7 | Tibiotarsus (r) | 1937-62 | BC | 615 | - | - | - |
| Vorombe titan | Ae-tb-8 | Tibiotarsus (l) | 1937-62 | BC | 760 | - | - | - |
| Aepyornithidae indet. | Ae-tm-1 | Tarsometatarsus (l) | 1906-16 Mr Belo | CT | 430 | 81.8 | 5.26 | 190 |
| Aepyornithidae indet. | Ae-tm-2 | Tarsometatarsus (l) | 1937-62 | BC | 481 | 88.03 | 5.46 | - |
| Dinornis sp. | Di-fm-1 | Femur (l) | - | CT | 315 | - | - | 182 |
| Dinornis sp. | Di-tb-1 | Tibiotarsus (l) | - | CT | - | - | - | 160 ** |
| Dinornithidae indet. | Di-tb-3 | Tibiotarsus (l) | - | CT | - | - | - | - |
| Dinornithidae indet. | Di-tb-4 | Tibiotarsus (?) | - | CT | - | - | - | - |
| Dinornis sp. | Di-tm-1 | Tarsometatarsus (l) | - | CT | 235 | 42 | 5.60 | 107 |
| Extinct neognaths | ||||||||
| Gastornis sp. | Ga-fm-1 | Fem/tibiotarus (?) | Mu12734 | Frag. | - | - | - | - |
| Gastornis sp. | Ga-fm-2 | Femur (r) | BR12419 | BC | - | - | - | - |
| Gastornis sp. | Ga-fm-3 | Femur (r) | BR12420 | Frag. | - | - | - | - |
| Gastornis sp. | Ga-tb-1 | Tibiotarsus (?) | - | Frag. | - | - | - | - |
| Gastornis sp. | Ga-tb-2 | Tibiotarsus (?) | CRL2457 | BC | - | - | - | - |
* Estimated lengths from the counterpart element. ** Not at the diaphyseal level. (?) side of skeletal element unknown.
Table 2.
Bone microanatomical data (on a subsample). The global compactness values were obtained in Bone Profiler [67]. Abbreviations: Comp., global compactness of the mid-diaphyseal cross-section; fm, femur; Lg, maximal length of the limb bone; MD, maximal diameter of the section; tb, tibiotarsus; tm, tarsometatarsus.
| Species | Locomotion Type | Sampling Number | MD (mm) | Comp. | Bone Trabeculae |
|---|---|---|---|---|---|
| Casuarius casuarius | Cursorial 1 | Cc-fm-1 | 29.0 | 0.395 | NO |
| Dromaius novaehollandiae | Cursorial 1 | Dn-fm-2 | 32.7 | 0.389 | YES |
| Dn-tb-2 | 28.5 | 0.500 | NO | ||
| Dn-tm-1 | - | 0.655 | YES | ||
| Dn-tm-2 | - | 0.560 | NO | ||
| Rhea americana | Cursorial 1 | Ra-fm-1 | - | 0.656 | NO |
| Ra-fm-2 | 22.6 | 0.404 | NO | ||
| Ra-tb-1 | 17.0 | 0.459 | NO | ||
| Ra-tb-2 | 21.6 | 0.644 | NO | ||
| Ra-tm-1 | 20.3 | 0.826 | NO | ||
| Ra-tm-2 | 16.5 | 0.618 | NO | ||
| Struthio camelus | Cursorial 1 | Sc-fm-1 | 46.3 | 0.392 | NO |
| Sc-fm-2 | 55.1 | 0.289 | YES (broken) | ||
| Sc-tb-1 | 37.2 | 0.593 | NO | ||
| Sc-tm-2 | 28.6 | 0.702 | NO | ||
| Aepyornithidae | Graviportal 2,3 | Ae-fm-2 | 96.5 | 0.512 | YES |
| Ae-fm-3 | 82.4 | 0.386 | YES | ||
| Ae-tb-1 | 71.6 | 0.706 | YES (broken) | ||
| Ae-tm-1 | 76.7 | 0.785 | YES (broken) | ||
| Dinornithidae | Graviportal 2 | Di-fm-1 | 55.8 | 0.741 | NO |
| Di-tb-3 | 68.5 | 0.733 | YES (broken) |
Publisher’s Note: MDPI stays neutral with regard to jurisdictional claims in published maps and institutional affiliations. |
© 2022 by the authors. Licensee MDPI, Basel, Switzerland. This article is an open access article distributed under the terms and conditions of the Creative Commons Attribution (CC BY) license (https://creativecommons.org/licenses/by/4.0/).
Share and Cite
MDPI and ACS Style
Canoville, A.; Chinsamy, A.; Angst, D. New Comparative Data on the Long Bone Microstructure of Large Extant and Extinct Flightless Birds. Diversity 2022, 14, 298. https://0-doi-org.brum.beds.ac.uk/10.3390/d14040298
AMA Style
Canoville A, Chinsamy A, Angst D. New Comparative Data on the Long Bone Microstructure of Large Extant and Extinct Flightless Birds. Diversity. 2022; 14(4):298. https://0-doi-org.brum.beds.ac.uk/10.3390/d14040298
Chicago/Turabian StyleCanoville, Aurore, Anusuya Chinsamy, and Delphine Angst. 2022. "New Comparative Data on the Long Bone Microstructure of Large Extant and Extinct Flightless Birds" Diversity 14, no. 4: 298. https://0-doi-org.brum.beds.ac.uk/10.3390/d14040298
Note that from the first issue of 2016, this journal uses article numbers instead of page numbers. See further details here.