Article

The Association of Waminoa with Reef Corals in Singapore and Its Impact on Putative Immune- and Stress-Response Genes

by
Giorgia Maggioni
1,2,3,
Danwei Huang
3,4,
Davide Maggioni
1,2,
Sudhanshi S. Jain
3,
Randolph Z. B. Quek
3,4,
Rosa Celia Poquita-Du
3,
Simone Montano
1,2,
Enrico Montalbetti
1,2 and
Davide Seveso
1,2,*
1
Department of Environmental and Earth Sciences (DISAT), University of Milano—Bicocca, Piazza della Scienza 1, 20126 Milano, Italy
2
MaRHE Center (Marine Research and High Education Centre), Magoodhoo Island, Faafu Atoll 12030, Maldives
3
Department of Biological Sciences, National University of Singapore, Singapore 117558, Singapore
4
Tropical Marine Science Institute, National University of Singapore, Singapore 119223, Singapore
*
Author to whom correspondence should be addressed.
Submission received: 2 March 2022 / Revised: 11 April 2022 / Accepted: 12 April 2022 / Published: 15 April 2022
(This article belongs to the Special Issue Diversity of Coral-Associated Fauna II)

Abstract

:
Waminoa spp. are acoel flatworms mainly found as ectosymbionts on scleractinian corals. Although Waminoa could potentially represent a threat to their hosts, not enough information is available yet regarding their ecology and effect on the coral. Here, the Waminoa sp.–coral association was analyzed in Singapore reefs to determine the prevalence, host range, and preference, as well as the flatworm abundance on the coral surface. Moreover, the impact of Waminoa sp. on the expression of putative immune- and stress-response genes (C-type lectin, C3, Hsp70 and Actin) was examined in the coral Lobophyllia radians. The association prevalence was high (10.4%), especially in sites with lower sedimentation and turbidity. Waminoa sp. showed a wide host range, being found on 17 coral genera, many of which are new association records. However, only few coral genera, mostly characterized by massive or laminar morphologies appeared to be preferred hosts. Waminoa sp. individuals displayed variable patterns of coral surface coverage and an unequal distribution among different host taxa, possibly related to the different coral growth forms. A down-regulation of the expression of all the analyzed genes was recorded in L. radians portions colonized by Waminoa individuals compared to those without. This indicated that Waminoa sp. could affect components of the immune system and the cellular homeostasis of the coral, also inhibiting its growth. Therefore, Waminoa sp. could represent a potential further threat for coral communities already subjected to multiple stressors.

1. Introduction

Scleractinian corals are known to host a variety of organisms belonging to different phyla [1,2,3,4,5,6]. Among coral ectosymbionts, the acoel flatworms of the genus Waminoa (Order Acoela, Family Convolutidae) have been studied only recently. Formerly included in the Platyhelminthes and now placed within the Acoelomorpha [7], Waminoa is considered an enigmatic group since much about its ecology and diversity remains unknown [8]. Waminoa spp. are found mainly on scleractinian corals, but also on octocorals, sea anemones, corallimorpharians, zoantharians, and echinoderms [8,9,10,11,12,13,14,15], and they show a circumtropical distribution, with the exception of the Caribbean [16]. Waminoa flatworms are characterized by the presence of intracellular dinoflagellate symbionts, which have also been found in the worm oocytes, suggesting that these symbionts are inherited via a vertical transmission and not obtained from the host coral [8,9,10].
These flatworms subsist via different ways, by ingesting the host coral mucus [11,17] and/or by “standing” on the polyps of host anthozoans to obtain floating zooplankton [18]. For these reasons, Waminoa spp. could represent a threat to corals, although the worms do not appear to consume coral tissue directly [9]. In fact, acoelomorph flatworms may limit the host feeding on zooplankton by competing for the prey and by physically blocking the coral oral disc, possibly resulting in kleptoparasitism [18]. In this regard, Galaxea fascicularis polyps infested by worms showed a significant decrease of prey ingestion rates compared to polyps without worms and between 5 to 50% of total prey captured by the polyps was stolen by Waminoa individuals [18]. Since the coral mucus layer aids in heterotrophic feeding and represents a protective physiochemical barrier [19], the removal of the mucus by Waminoa spp. may reduce the coral’s resistance to pathogens and environmental stressors [11,17]. In addition, being able to reach high densities and cover a significant portion of the coral [20], Waminoa spp. may also cause light shading affecting the coral’s photophysiology, reducing the productivity of the coral holobiont [11,13]. Despite the possible negative effects of Waminoa worms on their hosts, specific studies to diagnose the health of the infested corals have never been performed so far.
As sessile organisms, corals rely on the modulation of their cellular and molecular mechanisms as the first defensive line against environmental stresses and invading pathogens, and these mechanisms represent useful biomarkers of corals’ health status [21,22,23,24]. In this context, corals possess an innate immune system consisting of different self/non-self-recognition receptors, which activate specialized cellular and humoral signaling pathways leading to diverse downstream effector responses [25,26]. Among the complex network of immune processes, the complement pathway is a proteolytic cascade, by which pattern recognition receptors (PPRs), such as lectins, initiate intracellular signaling to enact complement component factors, such as C3-like proteins [27]. Lectins are recognition receptors that bind to glycans and play a role in non-self-recognition, cell-cell adhesion, bacterial cell wall recognition, and phagocytosis [28]. In particular, C-type lectins are a superfamily of Ca2+-dependent carbohydrate-recognition proteins involved in the activation of several innate immune responses [29,30,31]. Complement C3-like proteins, whose activation relies on lectins, are important in allorecognition and involved in the opsonization of the pathogens, chemotaxis, and activation of leukocytes [25,27]. Although complement-encoding genes, such as those of C-type lectins and C3, have been identified and characterized in corals [32,33,34,35,36], their involvement and modulation in response to biotic stressors remain poorly tested.
In addition to the immune response components, other diagnostic tools in corals able to reflect changes in cellular integrity and functionality caused by stress exposure are cellular proteins, such as Actin and Heat shock proteins. Indeed, Actin, which is a major cytoskeletal protein involved in cell motility, growth, and division, is thought to be a proxy of the growth rate in corals [37,38]. Heat shock proteins (Hsps) are molecular chaperones involved in cytoprotection and maintenance of protein homeostasis, and their expression is usually up-regulated when organisms face conditions that may affect their cellular protein structure [39]. For this reason, Hsps have been frequently adopted as cellular stress biomarkers in corals subjected to different environmental stressors [40,41,42,43,44,45]. In addition, Hsps may play a role in the coral immune system, since they can be activated in response to epizootic diseases or other biotic stresses [46,47,48,49].
The coral reefs of Singapore, an island megacity that has been experiencing intense urban development over the past 60 years, represent highly disturbed and urbanized coastal environments [50,51]. Coral communities here have been affected for decades by multiple chronic anthropogenic pressures, resulting in high levels of sedimentation and turbidity [52,53,54,55], and multiple bleaching events caused by climate change [56,57,58]. However, no work has examined the presence and the impact of Waminoa worms on Singapore’s coral communities.
In this study, the association between Waminoa and scleractinian hosts was studied for the first time in Singapore reefs through an ecological survey and a molecular analysis. In particular, we determined the prevalence of the association, the host range, the host preference of Waminoa, and the flatworm abundance on the coral surface. In addition, we tested a possible effect of Waminoa on components of the coral immune system and cellular stress response. For this purpose, the coral Lobophyllia radians was selected being a species highly colonized by the Waminoa in Singapore, and the gene expression of C-type lectin, C3, Hsp70 and Actin were examined and used as biomarkers to provide new insights on the nature of the association.

2. Materials and Methods

2.1. Ecological Analysis

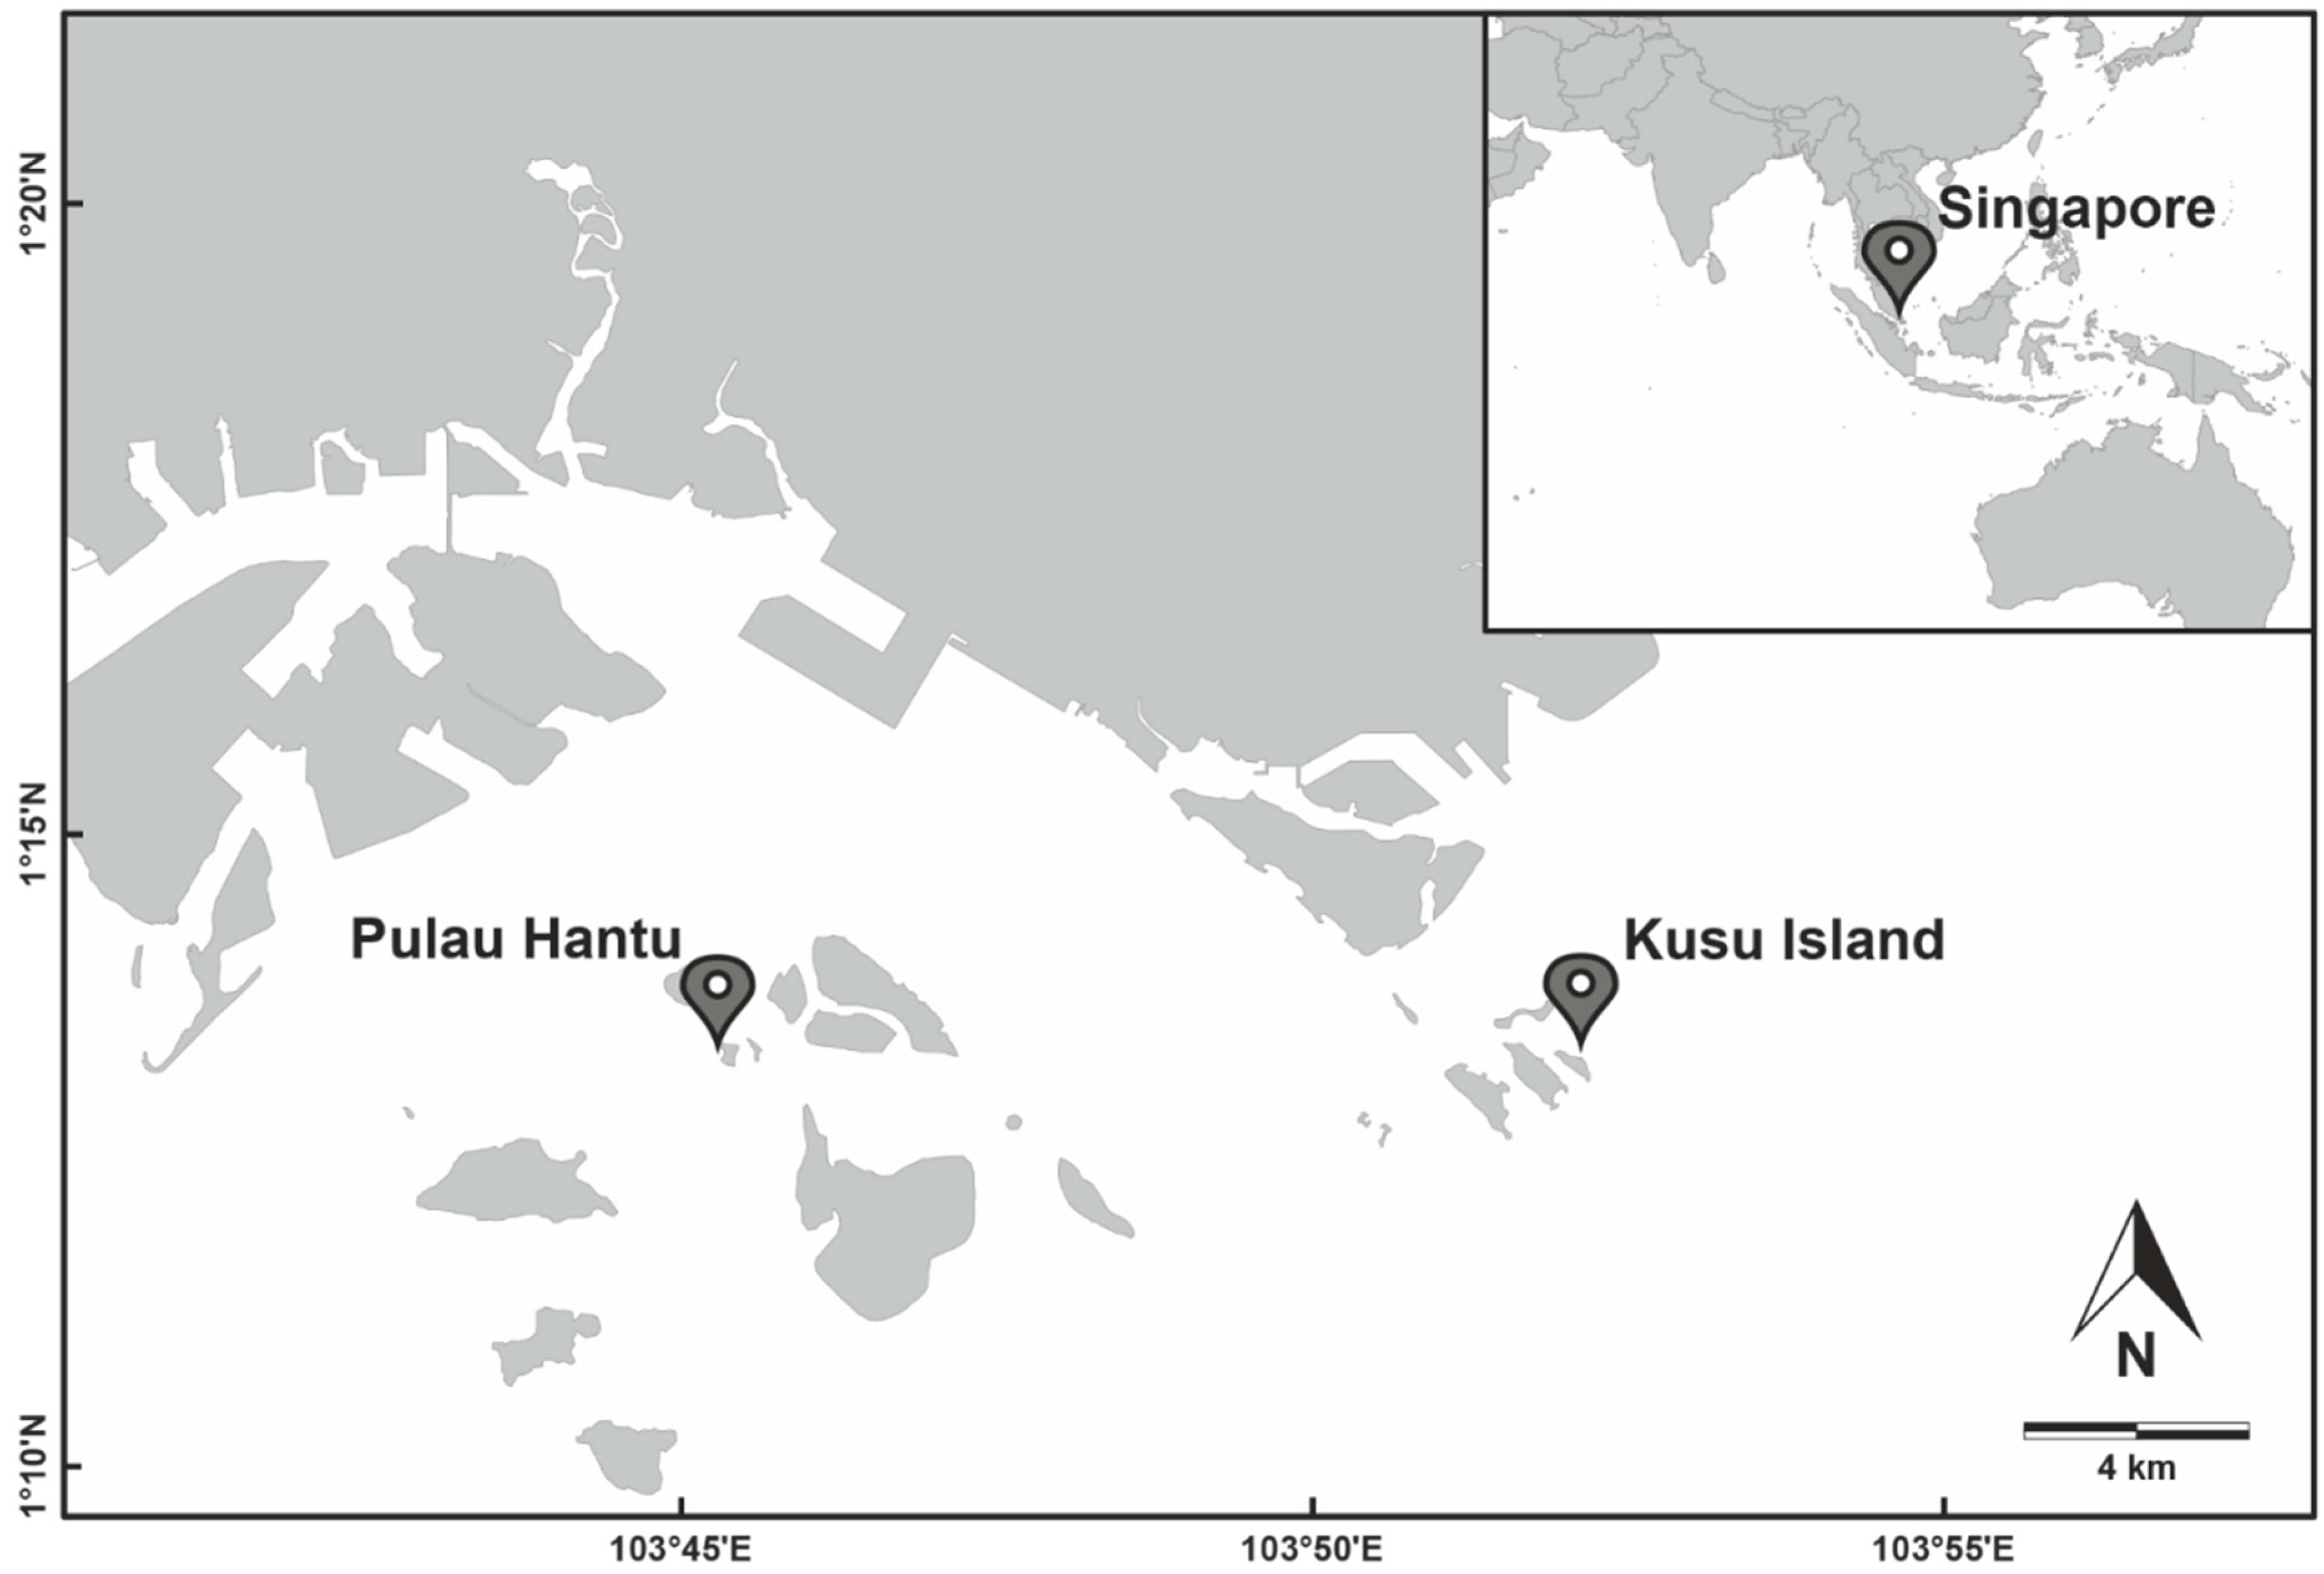
2.1.1. Study Area and Sampling Design

Fringing reefs of two islands south of mainland Singapore, Pulau Hantu (1°22′74″ N, 103°74′65″ E) and Kusu Island (1°22′55″ N, 103°85′85″ E), were selected as study sites (Figure 1). Both reefs are characterized by a shore-adjacent reef flat leading seaward to the reef crest and down the reef slope to ~8–10 m maximum depth because of high levels of suspended sediments that cause extreme light attenuation [55,59].
In both sites, extensive surveys were conducted by SCUBA diving between August and October 2019 to detect the occurrence of Waminoa individuals on different coral genera (Figure 2). Images of Waminoa specimens were taken by a digital camera and analyzed. We distinguished a single morphotype of Waminoa in the surveyed area (as described in [8,15], Figure 2) and we treated it as Waminoa sp.
Six 50 × 2 m belt transects (100 m2 each), spaced 10 to 20 m apart and placed parallel to the coast at a constant depth between 5 and 8 m (depending on the tides) along the reef slope, were randomly laid at each site. Within belt transects all the coral colonies were identified to genus level, according to Huang et al. [60] and Wong et al. [61], and the number of colonies of each genus found colonized by Waminoa sp. was recorded. Moreover, in coral colonies hosting Waminoa individuals, their abundance was estimated by determining the percentage of coral surface covered by flatworms and was indicated with four coverage categories, as suggested in [62]: low (coral surface covered 1–10% by worms), moderate (11–25%), severe (26–50%), and extreme (>50%).
In each belt transect, the point intercept transect (PIT) method was also performed (by recording data every 10 cm [63]) to determine the composition and structure of the benthic community, as well as the cover percentage of each coral genus. Data were collected using the following benthic categories: algae, dead coral, coral, coral rubble, rock, sand, and other (sponges, soft corals, tunicates, zoantharians, and unknown). Furthermore, for the macro-category “coral”, the genus was also recorded.

2.1.2. Data Analysis

For each transect, the prevalence of the association was calculated as the ratio between the number of corals colonized by Waminoa sp. and the total number of colonies. By averaging the corresponding prevalence values measured on the six random belt transects for each site, both an overall and a series of taxon (coral genus)-specific prevalence values were determined. Data normality was verified using the Shapiro–Wilk test. A one-way ANOVA was used to test significant differences in the overall association prevalence between the two sites analyzed. The same analysis, followed by Tukey’s honestly significant difference (HSD) post hoc tests for multiple pairwise comparisons of means, was performed to assess significant differences in the prevalence of the Waminoa sp.–coral association among the different host genera. Coral genera showing a prevalence < 5% were not included in the analysis.
The host preference of Waminoa sp. in terms of coral genus was tested through the Van der Ploeg and Scavia Selectivity coefficient (Ei), following [64]. This coefficient is defined for a group i as:
Ei = [ W i ( 1 n ) ] [ W i + ( 1 n ) ]
where Wi represents the value of Chesson’s α and n represents the number of habitat types [63], here represented by the coral genera found in the study area. Chesson’s α value (Wi) is defined as:
W i = r i P i / i r i / P i
where ri represents the frequency of a habitat category (coral genus) in the environment, and Pi represents the frequency of the same habitat category in which the organism of interest (Waminoa sp.) is found [65]. Values of selectivity coefficient range between −1 and 1, with −1 meaning complete avoidance of a host coral genus, and 1 meaning exclusive preference for a specific coral genus [66].
A one-way ANOVA followed by a Tukey’s HSD post hoc test was performed to assess differences in the coverage percentages of the flatworms on the surface of the host corals, between the four coverage categories.

2.2. Molecular Analysis

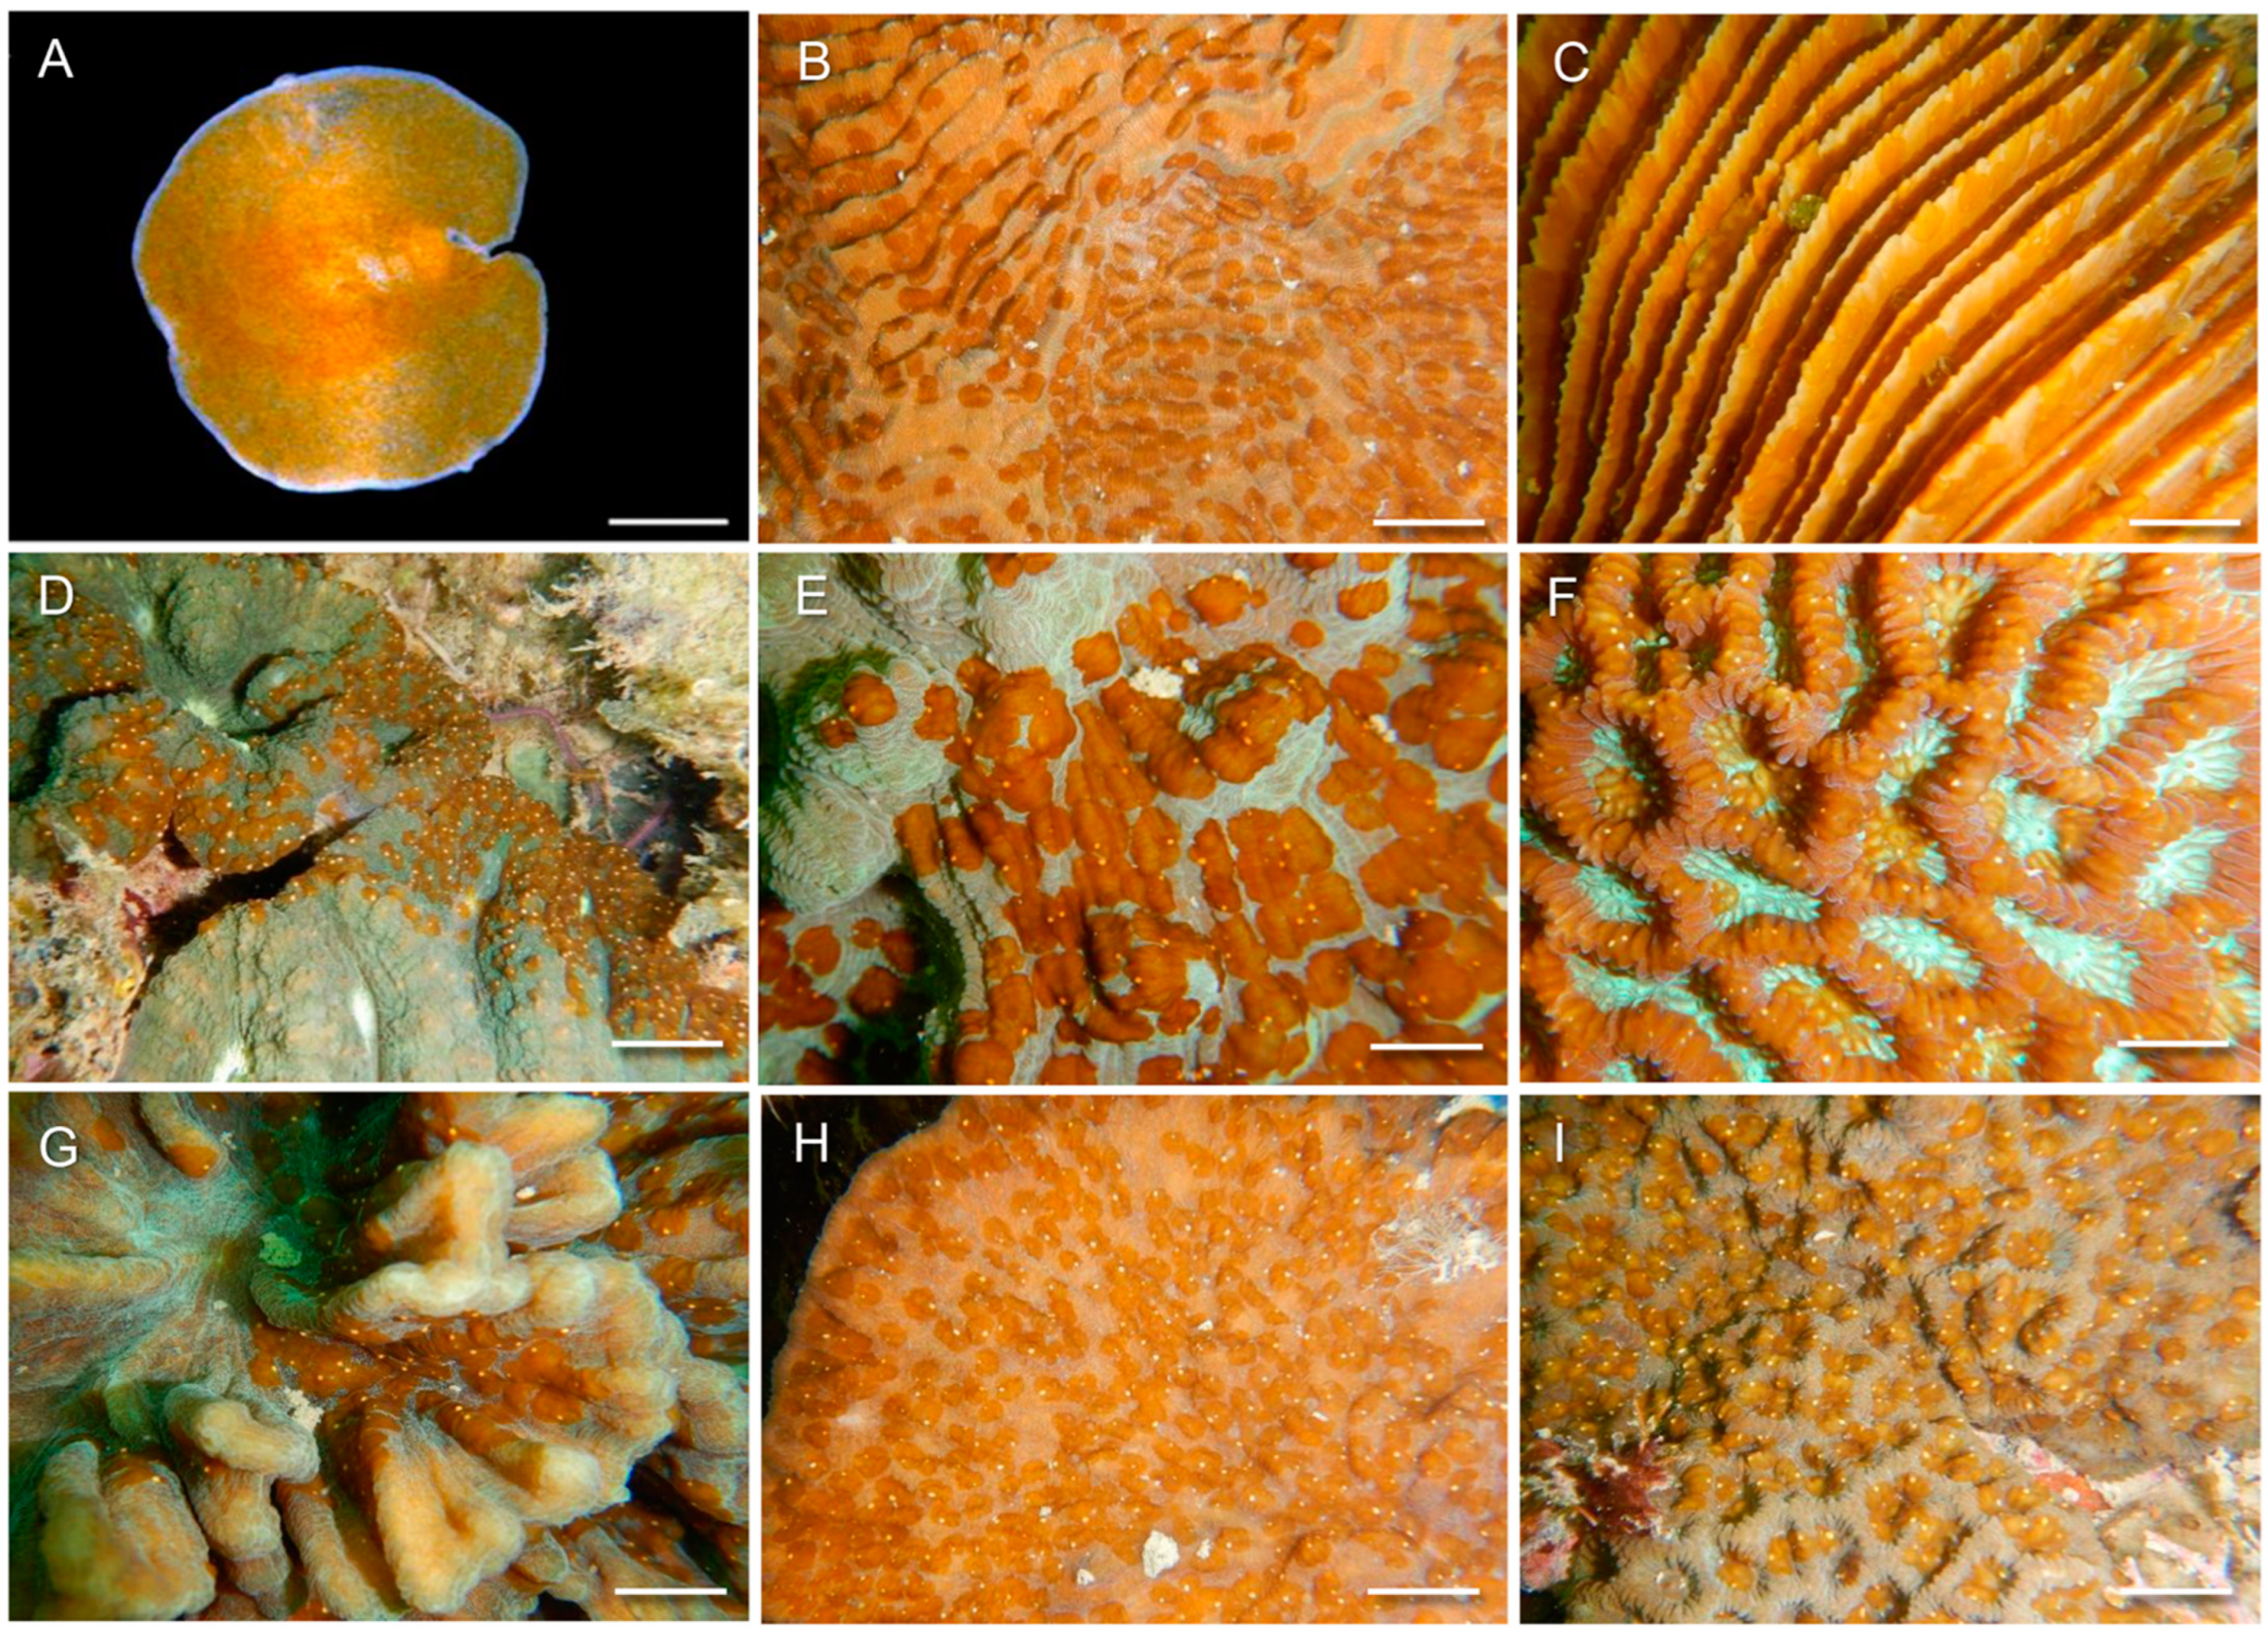
2.2.1. Coral Collection

To assess the effect of Waminoa sp. on coral’s gene expression, five colonies of Lobophyllia radians showing patches of Waminoa sp. individuals in a fixed position on their surface were selected, monitored for several days and sampled on Kusu Island. All five colonies were moderately (11–25%) covered by the worms. For each colony, fragments of approximately 2 cm2 were collected using a hollow-point stainless steel spike [67]. Two coral fragments were sampled from each colony: one fragment located just underneath a patch of Waminoa sp. individuals (marked as “W”), and the other from a colony portion without worms, at least 5 cm away from the Waminoa individuals (marked as “W/0”). In addition, three healthy colonies of L. radians not colonized by the flatworms were randomly sampled as controls to test primer efficiencies.
All coral samples were taken at the same hour (around 9:00 a.m.), at the same shallow depth, and during high tide, to minimize any possible effects of abiotic variables, such as water temperature and light intensity, on the gene expression. During the sampling period, the sea surface temperature was continuously logged and its mean was 30.36 ± 0.39 °C, with very slight oscillation between 29.66 and 30.42 °C. In “W” fragments, Waminoa individuals were removed from their hosts by using the pipettes as previously described [8] and the morphological condition of the coral tissues, as well as the presence of any physical damages or lesions, were evaluated. All the coral portions were immediately placed in pre-labeled tubes and, at the end of the underwater sampling, the seawater was decanted and replaced with RNAlater (Thermo Fisher Scientific, Singapore) with a tissue:RNAlater ratio of 1:10. The maximum time between collection and placement in RNAlater was about 30 min. The sample tubes were inverted to mix for 30 s and kept at 4 °C overnight to allow complete penetration of RNAlater into the coral tissues. The tubes were subsequently stored at −80 °C until RNA extraction.

2.2.2. RNA Extraction and REVERSE Transcription (RT)

Total RNA was extracted from all the coral samples without homogenization to reduce RNA fragmentation using TRIzol Reagent (Life Technologies, Sigma-Aldrich, Singapore) following the manufacturer’s protocol. RNA quality was checked by examining with gel electrophoresis for presence of clear bands of ribosomal RNAs and RNA concentration was estimated using Qubit (RNA Broad Range Assay Kit, Thermo Fisher Scientific). Complementary DNA (cDNA) was immediately prepared from 1 µg of total RNA for each sample, using a one-tube format of iScript RT Supermix (Bio-Rad, Hercules, CA, USA) for a reverse transcription quantitative polymerase chain reaction (RT-qPCR). Reaction setup was composed of iScript RT Supermix (4 µL), RNA template (varied depending on RNA sample concentration; 14.6–200 ng/µL), and nuclease-free water (variable), with a final volume of 20 µL as previously described [68]. Incubation of the reaction mix was performed in a Labcycler (Sensoquest, Göttingen, Germany) following the manufacturer’s protocol: priming for 5 min at 25 °C, RT for 20 min at 45 °C, and RT inactivation for 1 min at 95 °C.

2.2.3. Primer Design and Validation

A local search in the L. radians transcriptome previously sequenced (raw sequencing data available at NCBI Sequence Read Archive under accession number PRJNA512601) and assembled by [69] using BLASTn against the GenBank database was performed. Coral transcripts matching genes from the genomes of Acropora digitifera, Orbicella faveolata, or Stylophora pistillata were identified and orthologous genes on the L. radians transcriptome selected. The accuracy of the sequence of each gene of interest (GOI) was checked using the NCBI Nucleotide BLAST tool (https://blast.ncbi.nlm.nih.gov/Blast.cgi, accessed on 15 November 2019). A megablast search was performed to ensure that the sequences producing significant alignments with the query sequence were corresponding to the GOIs. A BLASTn search was performed in an open-access coral genomic database at http://reefgenomics.org/blast/ [70,71] with Goniastrea aspera genome as subject and the sequence of each GOI as query. A suitable region within exons was selected and the query corresponding to the longer hit with the highest identities value was selected to design primers. Primers for each gene were designed using the online tool by NCBI that incorporated Primer3 and BLAST (https://0-www-ncbi-nlm-nih-gov.brum.beds.ac.uk/tools/primer-blast). The set of primers given as output by the NCBI tool were analyzed and used in http://reefgenomics.org/blast/to perform a BLASTn search against Symbiodiniaceae nucleotide databases (Supplementary materials Table S1) to verify primer specificity for coral DNA. The selected set of primer was then used for a megablast search using the NCBI Nucleotide BLAST tool to verify the absence of significant alignment with marine species found in the same environment as L. radians. The designed primers are shown in Table 1. The specificity of the selected primers for L. radians was tested by performing PCR using the GoTaq Green Master Mix in a LifeECO Thermal Cycler (Bioer Technology, Hangzhou, China). PCR reaction steps were (1) denaturation: 95 °C for 45 s, (2) annealing: 50–55 °C for 45 s, and (3) extension: 72 °C for 3 min, repeated for 35 cycles.
To test primer efficiencies, a series of twofold dilutions of L. radians cDNA starting from 5 ng/μL were performed for the samples collected from the control colonies [38]. Each dilution was used in triplicate for each primer to assess the primer efficiency through an RT-qPCR using the CFX96 Real-Time PCR System (Bio-Rad). Calculations of efficiencies (E, the amplification factor per PCR cycle) needed to correct for amplification efficiencies per primer were undertaken using an MCMC.qpcr package in R developed by Matz et al. [72]. The function, PrimEff( ), calculates E and plots the regression slopes and E based on dilution series. GOIs with E values outside the 1.85–2.16 range had primers redesigned and re-validated. GOIs that failed amplification were excluded from downstream analyses [68].

2.2.4. Gene Expression Quantification

RT-qPCRs were performed in a CFX96TM Real-Time PCR System (Bio-Rad) using SsoAdvanced inhibitor-tolerant SYBR Green Supermix following the manufacturer’s protocol (polymerase activation and DNA denaturation: 3 min at 98 °C, denaturation: 15 s at 95 °C, and annealing/extension: 30 s at 60 °C) repeated for 40 cycles. The reaction mix was prepared as in Table S2. Each sample was tested in duplicates for each of the four genes. To control for variations in expressions of genes caused by differences in RNA concentration of each sample, the amount of cDNA template was standardized to ~10 ng of cDNA for every reaction mix.

2.2.5. Data Analysis

Data obtained from RT-qPCRs expressed as “cycle of quantification values” (i.e., Cq values) were collated and sorted for subsequent analysis. RT-qPCR data were analyzed using generalized linear mixed models based on lognormal-Poisson error distribution, fitted using the MCMC.qpcr package Version 1.2.3 in R Studio Version 1.1.463 as previously reported [72]. Molecule count data with corrections for primer efficiencies were derived with amplification efficiencies (E) per gene and Cq for a single target molecule using the formula: Count = E(Cq1 − Cq). The Cq-to-counts conversion is the key transformation in this method, in which higher variation at the low gene expression values is properly accounted for by the relative quantification model. The transformation makes it possible to fit the resulting data to generalized linear mixed models to account for Poisson-distributed fluctuations when the number of the molecule count is low. Similar Bayesian approaches for analyzing qPCR data have been used in several other reports [68]. Results of the mcmc.qpcr() function were then plotted with HPDsummary() to visualize fold changes in gene expression in response to the presence of Waminoa worms. HPDsummary() also calculates all the pairwise differences between treatments and their statistical significance for each gene. Each gene profile was examined to determine the differential expression level between coral samples underneath the surface of the coral colonized by Waminoa sp. and samples of the same colonies at least 5 cm apart from the flatworms.
A multivariate analysis was performed using the statistical package PRIMER-E v.7 with the PERMANOVA+ add on [73,74] to investigate together the modulation of all biomarkers in response to Waminoa sp. colonization. In particular, data related to the levels of all the biomarkers were square root transformed to calculate a matrix based on the Bray–Curtis similarity. To test for differences in biomarker levels between corals with and without worms, a non-parametric permutational multivariate analysis of variance (PERMANOVA) was performed using 999 permutations with partial sum of squares and unrestricted permutation of raw data. Values were considered statistically significant at p < 0.05.

3. Results

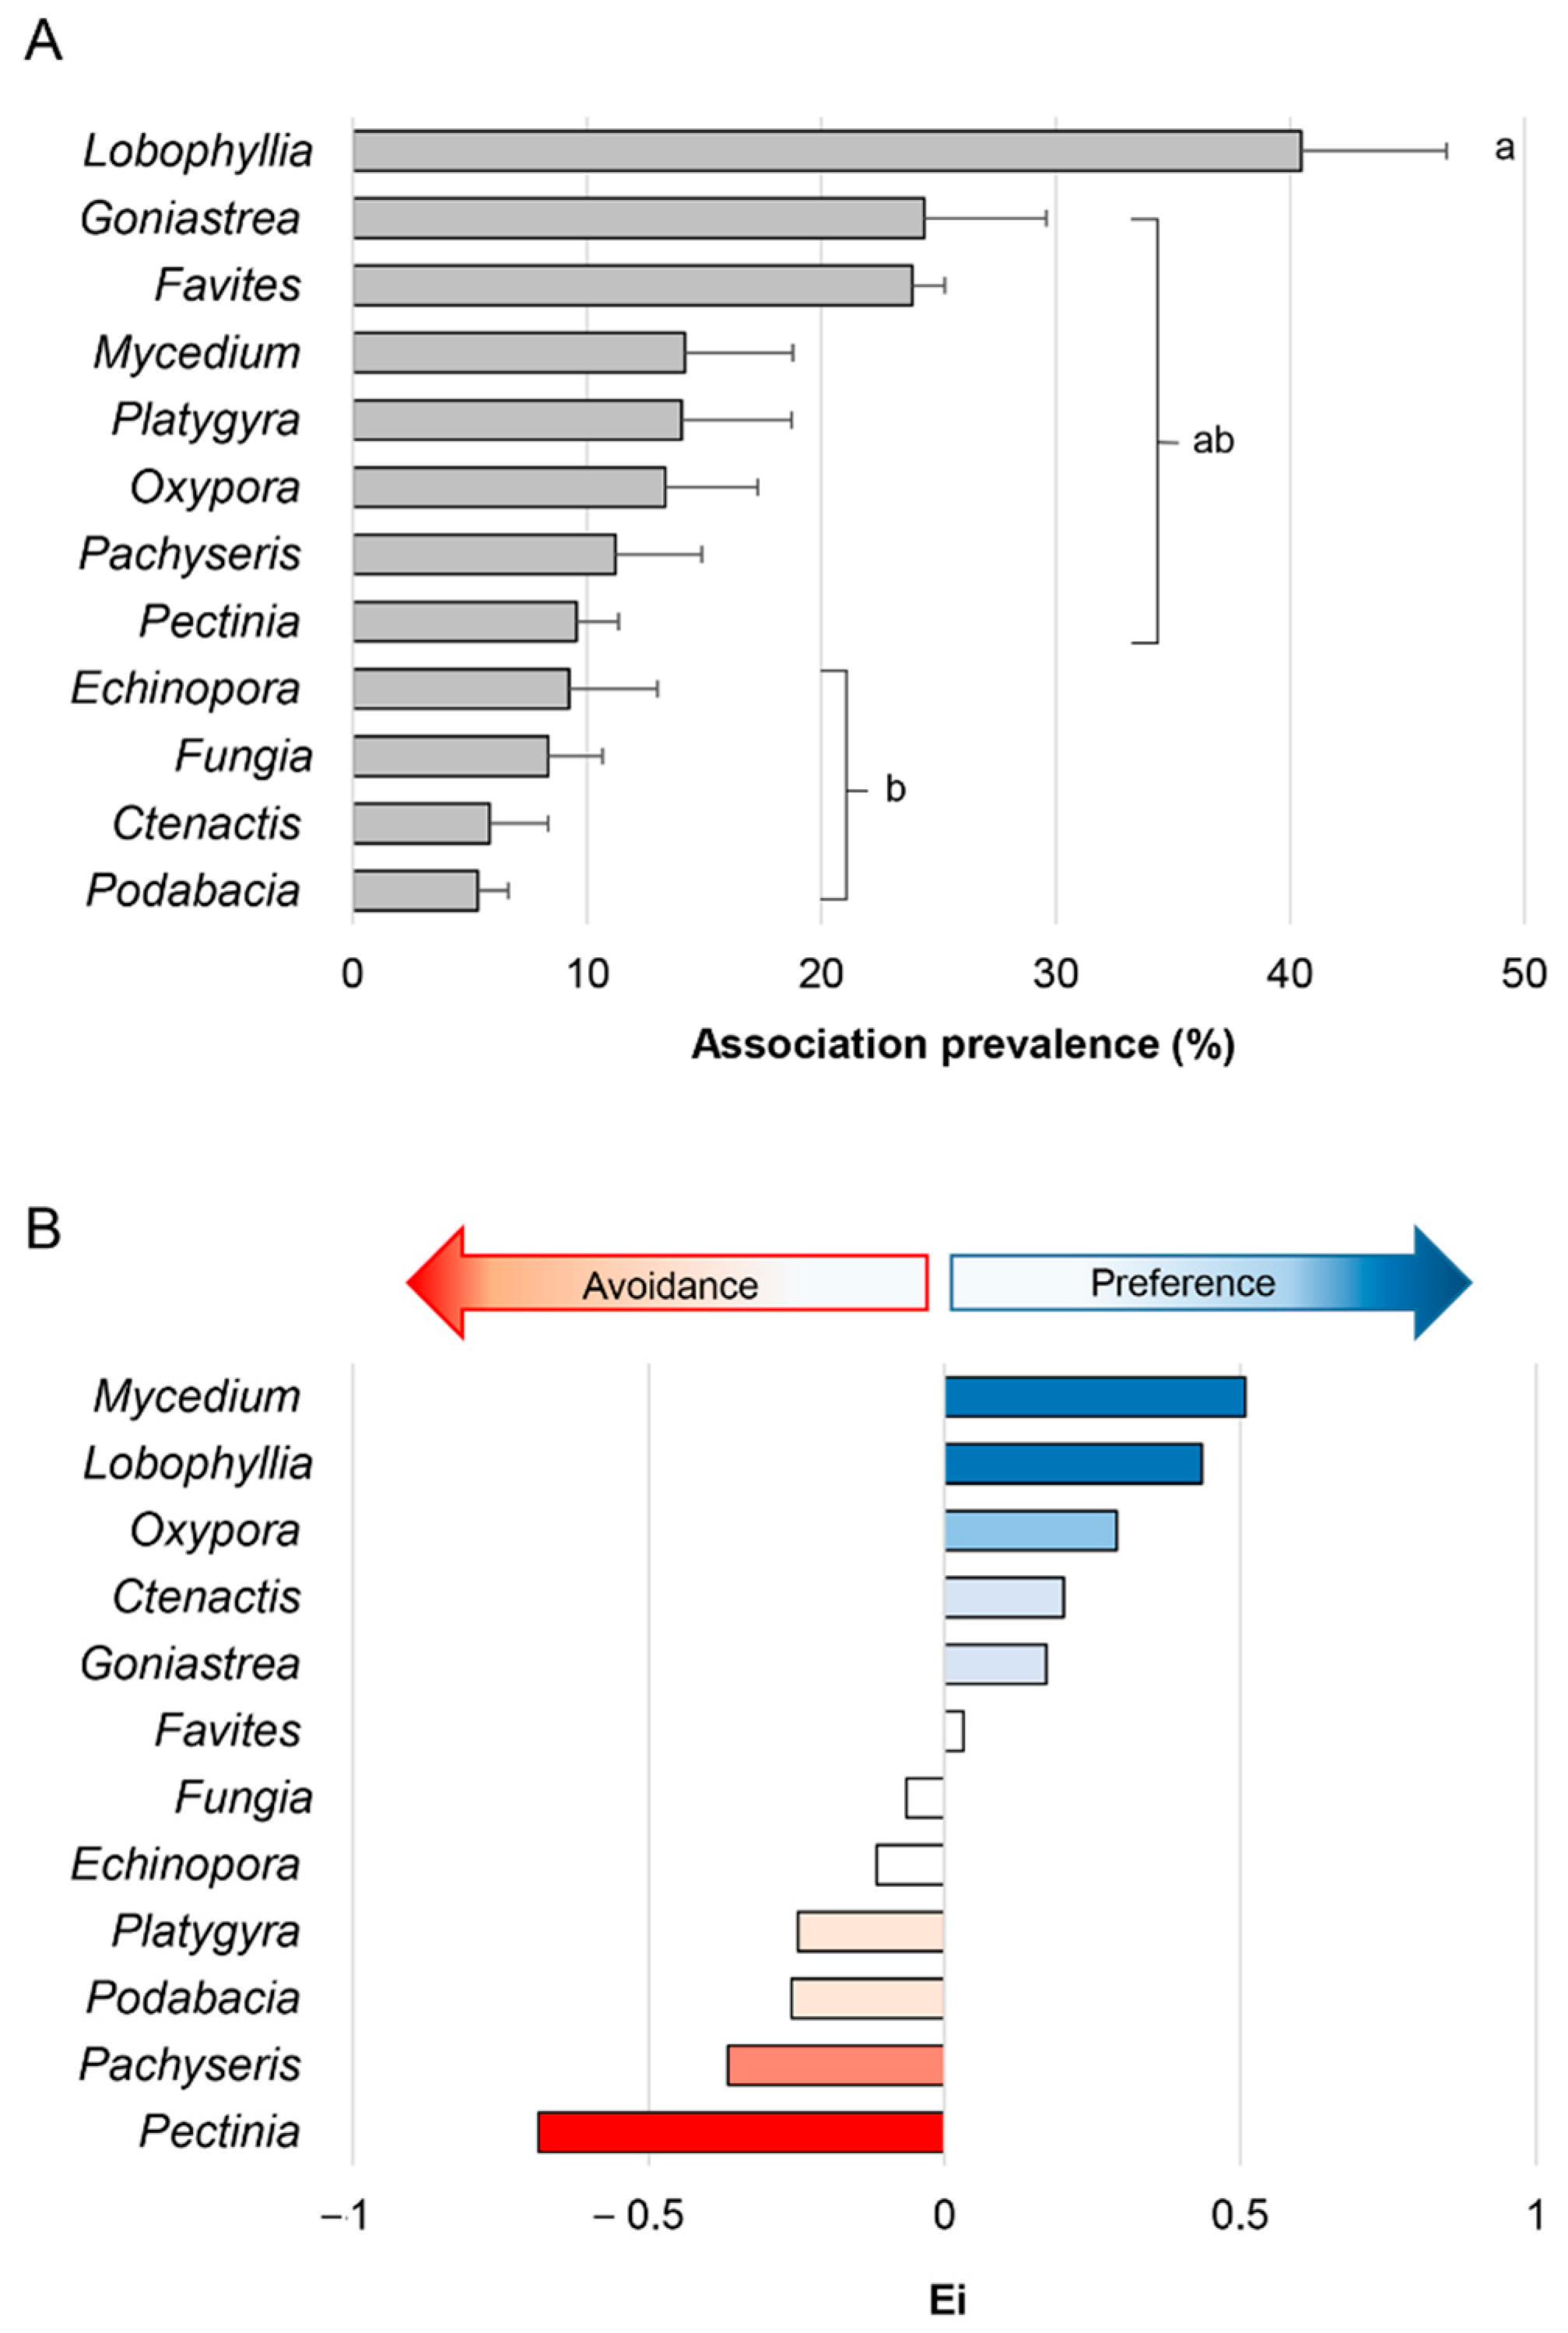
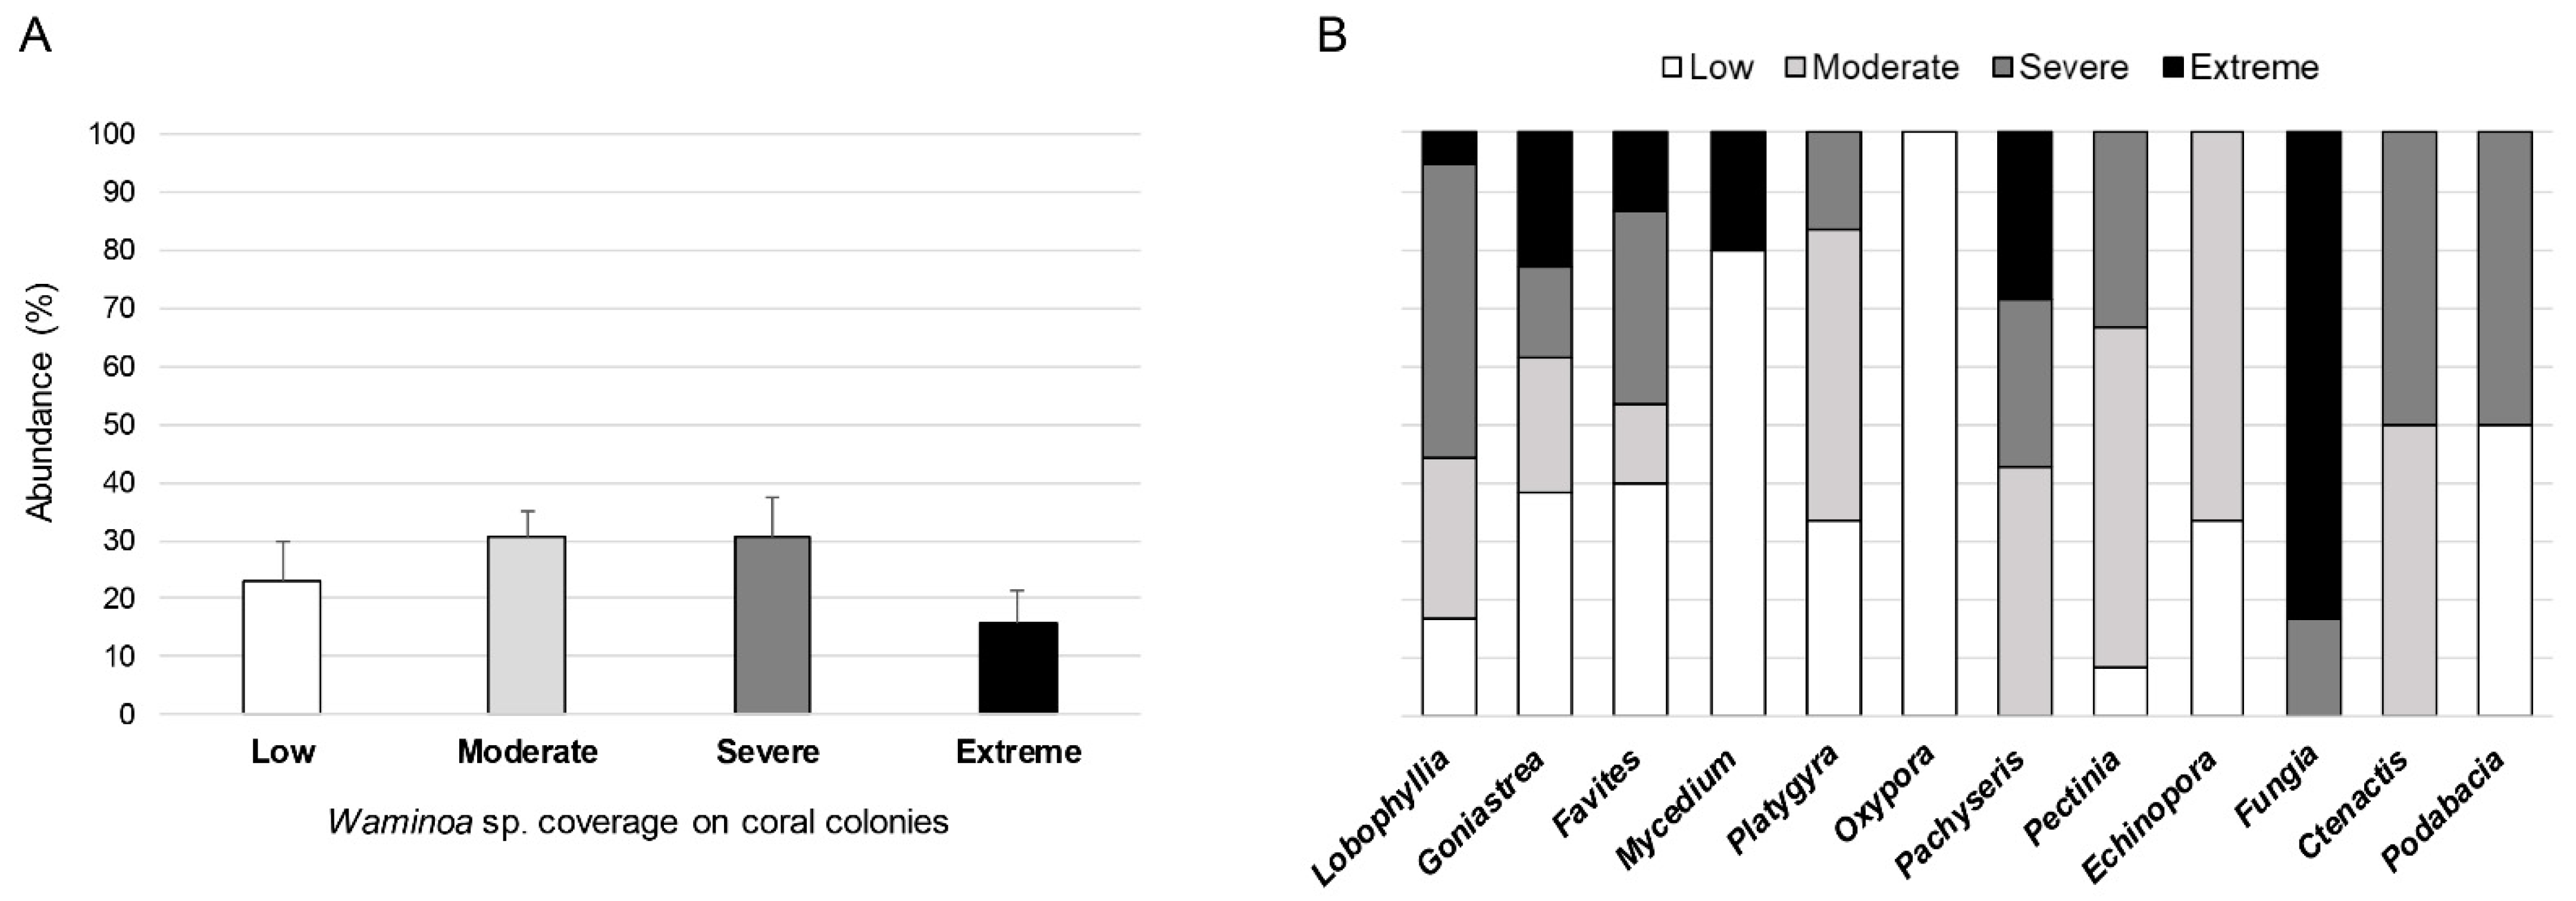
3.1. Ecological Analysis

On the surveyed reefs, benthic coverage was dominated by hard corals (36 ± 8.6%), followed by dead corals (23.3 ± 16.1%) and coral rubble (20 ± 6.4%), and the same trend was observed in both sites (Figure S1). A total of 39 scleractinian genera were recorded (Table S3) and among them the genus Pectinia showed the highest cover percentage (~11%), followed by Dipsastraea and Merulina (~9% and 8%, respectively). All the other coral genera displayed a cover percentage close to or less than 5% (Table S3). However, the two sites at Pulau Hantu and Kusu Island showed a distinct abundance and diversity of the various coral genera (Table S3). Indeed, in Pulau Hantu 33 genera were observed, while Kusu Island showed a higher coral diversity with 38 genera recorded (Table S3). In addition, Pulau Hantu reef was dominated by corals belonging to the genera Pectinia (~13%), Merulina (~10%), Goniopora, and Dipsastraea (both ~8%), while Kusu Island displayed a greater heterogeneity in terms of coral genera coverage, with Dipsastraea (~10%), Heliopora and Pectinia (all ~8%), Favites (~7%), and Pachyseris, Montipora and Platygyra (all ~6%) showing the highest abundance (Table S3).
Overall, 1044 coral colonies were observed, and the overall prevalence of the coral–Waminoa sp. association was 10.4 ± 2.3%, with the site on Kusu Island showing a significantly higher prevalence compared to Pulau Hantu (ANOVA, F(1,34) = 3.1, p = 0.012; Figure 3). In total, 17 out of the 39 scleractinian genera recorded in the study area were found in association with Waminoa sp. and significant differences in the association prevalence were detected among the host coral genera (ANOVA, F(12,143) = 2.39, p = 0.008; Figure 4A). In particular, Lobophyllia clearly displayed the highest prevalence, followed by Goniastrea and Favites, and later by Mycedium, Platygyra, Oxypora, and Pachyseris, while for the five other host genera the prevalence recorded was lower than 10% but higher than 5% (Pectinia, Echinopora, Fungia, Ctenactis, and Podabacia, Figure 4A). However, significant differences in the association prevalence were observed only between Lobophyllia and Echinopora, and Fungia, Ctenactis and Podabacia (Figure 4A). In addition, the five other scleractinian genera, namely Merulina, Porites, Dipsastraea, Hydnophora, and Montipora, were found associated with Waminoa sp. but with prevalence < 5% (4.2, 3.7, 3.5, 2.5, and 1.9%, respectively). The prevalence patterns recorded in both sites were not uniform and did not fully reflect those recorded in the whole study, with Goniastrea, Pachyseris and Lobophyllia showing the higher prevalence in Pulau Hantu, and Lobophyllia, Favites, Mycedium, and Oxypora in Kusu Island (Figure S2). The selectivity coefficient Ei allowed the comparison of the relative abundance of coral genera colonized by Waminoa sp. with the relative abundance of the same coral genera recorded in the whole study area (Figure 4B). The analysis was performed only for coral genera showing an association prevalence > 5%. It revealed that Mycedium was the preferred host for Waminoa sp., followed by Lobophyllia, Oxypora, and, surprisingly, Ctenactis, which was among the coral genera that showed the lowest prevalence of the association (Figure 4B). Moreover, Waminoa sp. showed a marked avoidance for high/medium-prevalence genera, such as Platygyra, Pachyseris and Pectinia (Figure 4B).
Most of the coral colonies were moderately (from 11 to 25% of the coral surface) or severely (26–50%) covered by Waminoa sp., while a few colonies showed an extreme colonization of worms (>50%) on their surface (Figure 5A). However, no significant differences in the abundance percentages were recorded among the Waminoa sp. coverage categories (ANOVA, F(3, 44) = 1.83, p = 0.158, Figure 5A). Therefore, the distribution of the flatworms on the coral colonies was heterogeneous, although Waminoa sp. mostly occupied less than 50% of the coral’s surface (Figure 5A). This pattern was also found in the coral genera showing the highest prevalence of the association, such as Lobophyllia, Goniastrea, and Favites, as well as in the preferred genus Mycedium (Figure 5B). In particular, in Lobophyllia corals the flatworms mostly colonized from 26 to 50% of the colony surface, while in both Goniastrea and Favites about 40% of the colonies had less than 10% of their area occupied by Waminoa sp. individuals. Almost all the colonies of Mycedium hosting the worms had less than 10% of their surface covered, while the Waminoa sp. infestation on the coral surface was mostly severe in Pachyseris and extreme in Fungia (Figure 5B).

3.2. Molecular Analysis

All the sampled coral portions occupied by worms showed no visible surface damage or lesions. All the candidate genes showed reliable amplification, since the efficiency of amplification was within the range of acceptable values of 1.49–2.2 (Table S4, [38]).
Significant differences in biomarker levels among portions of coral tissue colonized or not by Waminoa sp. were recorded (PERMANOVA: df = 1, F = 3.372, p = 0.007). All the genes showed a lower expression level in samples collected underneath Waminoa sp. compared to samples of the same coral colony taken at least 5 cm apart from the flatworms (Figure 6A). Therefore, the presence of Waminoa sp. on coral caused a down-regulation of the expression of all the investigated genes in the portion of coral tissue directly in contact with the flatworms. The effect of the presence of Waminoa sp. on the gene expression was significant for C3 (pMCMC = 0.03), Hsp70 (pMCMC = 0.01), and Actin (pMCMC = 0.005), but not for C-type lectin (pMCMC = 0.13), (Figure 6A). The highest fold change in expression levels was observed for Actin, followed by Hsp70, while the lowest change was observed for C-type lectin, which showed a non-significant down-regulation (Figure 6B).

4. Discussion

4.1. Ecology of the Waminoa-Coral Association in Singapore Reef

Our data contributed to extend the geographic distribution of the Waminoa–coral association. In fact, to date it has been recorded only in the reefs of the Red Sea [9,11,12,17], Indonesia [13,20,75], Micronesia [76], Australia [77,78], Japan [8,14], and Taiwan [79]. In addition, our results indicate that the association appeared to be abundant in the study area, with a prevalence greater than 10%. In areas close to Singapore, such as Taiwan, less than 1% of the corals analyzed were found colonized by Waminoa sp. [79], while in Wakatobi (Sulawesi, Indonesia) a total of 4.8% of all observed hard corals were associated with the acoel worm in 2006 and 2.6% of hard and soft corals in 2007 [13]. However, a comparison between the prevalence obtained in these studies may not be completely reliable, since the investigated geographic areas were characterized by diverse habitat structure and ecological traits, and the survey methods and approaches used were not entirely the same.
Although the presence of the flatworms was reported in both the investigated sites, a significantly higher prevalence of the association was observed on Kusu Island compared to Pulau Hantu. This difference could be explained by the greater diversity of coral genera, rugosity, and reef complexity on Kusu Island [59], which may have contributed to available niches for Waminoa sp., as well as by the different environmental and physical characteristics of the sites. Pulau Hantu is sheltered by adjacent and heavily developed islands in an area of intense industrialization and ship traffic, while Kusu Island experiences comparatively lower anthropogenic impacts and higher exposure to wave action [80,81]. This generates a significantly higher average turbidity, sedimentation, and light attenuation rate in Palau Hantu, resulting in an overall lower light intensity and shallower euphotic depth than Kusu Island [81]. These conditions potentially affect the presence of photosynthetic dinoflagellate-hosting organisms such as Waminoa flatworms, which may also have more difficulty in colonizing sediment-covered surfaces and may themselves be vulnerable to environmental disturbances.
The Waminoa sp. host range was updated with additional scleractinian genera, many of which are new records. Indeed, in Singapore, Waminoa sp. was in association with 17 coral genera belonging to six families, namely Lobophylliidae, Merulinidae, Agariciidae, Poritidae, Fungiidae, and Acroporidae. Among them, the family Merulinidae was largely the most represented, as also recorded in Taiwan, despite only six coral genera in total being found infested by Waminoa sp. [79]. In Sulawesi (Indonesia), the association with Waminoa was confirmed for 21 coral taxa (Wakatobi [13]), but in Bangka Island it was recorded for only 4 coral genera (Gardineroseris, Platygyra, Porites, Turbinaria [75]). In the Red Sea, 13 coral genera were found infected [11]. In Japan, Waminoa individuals were found on 4 coral genera only, namely Cycloseris, Echinomorpha, Echinophyllia, and Pachyseris [14], and 13 scleractinian hosts all belonging to Lobophylliidae [8]. Therefore, Waminoa sp. in Singapore coral reefs showed a wide host range. However, only few coral genera such as Lobophyllia, Mycedium, Oxypora, and to a lesser extent Goniastrea and Ctenactis, appeared to be preferred hosts. These coral genera are characterized mainly by massive/submassive or laminar/encrusting colony morphologies, while corals without Waminoa sp. are typically branching or columnar. On the contrary, in previous studies Waminoa sp. was predominantly observed on branching Acropora and Stylophora corals, as well as in the columnar Tubastrea [11,13]. The question of why Waminoa sp. colonizes and/or prefers only specific coral taxa remains largely unanswered. We hypothesize that the coral skeleton morphology could represent a factor driving the choice of the flatworms, given that some structures could favor protection from predators, allowing the worm to hide. Since coral mucus represents a possible food source for Waminoa spp. [17], the different mucus production among different coral taxa could also represent an additional host selection factor. This is even more relevant in Singapore’s turbid reefs, as some corals can increase or decrease mucus production as a defense mechanism in response to persistent sediment stress [82,83,84,85]. In this regard, it would be interesting to analyze the mucus production and composition of the different coral taxa to explore possible correlations with the Waminoa presence. Finally, since Waminoa also feed on zooplankton caught by corals [18], the ability of a coral species to capture zooplankton, which is determined by its morphology, coral polyp size, and the type of tentacles and nematocysts (reviewed in [86]), may play an important role in the Waminoa host selection. However, in addition to these hypotheses, we cannot exclude that the Waminoa individuals analyzed here, albeit being of a single morphotype, did not belong to a single species but represented a complex of cryptic species, each of which specialized in a different host.
Corals of Singapore showed variable patterns of flatworm density, ranging from colonies that were densely and extremely infested to others that were only moderately and sparsely populated, as previously observed [11]. However, as also occurred in Okinawa [14], Waminoa sp. individuals were not equally distributed among different host taxa. In particular, in Singapore we detected that different Waminoa infestation rates could be related to the coral growth form. Indeed, in corals with massive growth forms (such as Lobophyllia, Goniastrea, Favites, and Platygyra), Waminoa sp. showed a heterogeneous pattern of distribution (but in general < 50% of the coral surface was occupied). Corals with a foliose and/or encrusting growth form (Mycedium, Podabacia, Oxypora, and Echinopora) were sparsely or moderately covered by flatworms, while Fungidae corals (Ctenactis and Fungia) appeared extremely colonized by Waminoa sp., as also previously observed [20].

4.2. Effect of Waminoa sp. on Coral Putative Immune- and Stress-Response Genes

Waminoa spp. can cause physiological damage to corals by inhibiting photosynthesis, reducing the coral tolerance to environmental stress, and impairing coral respiration and feeding [11,17,20]. Our analysis on coral gene expression produced a detailed description of the early response to stress at cell/tissue level, since changes at the molecular level occur before morphological and physiological impairment appear evident [87,88].
Our results show that Waminoa sp. affected the analyzed host molecular pathways associated with the coral’s stress tolerance and immunity response, causing a uniform down-regulation of the expression of all the investigated genes. Moreover, this modulation was only observed in the physically undamaged coral tissue portions colonized by Waminoa individuals and not in those free from flatworms. This might suggest that, as previously observed in corals infected by bacteria or protozoans [24,46,67], the stress response was confined in a restricted area just below the flatworm, even though polyps are linked together by common tissue in the coral colony.
The complement pathway of the immune system is triggered by lectins binding a pathogen-associated molecule and results in the activation of the complement component factor C3 and C4 [89]. Indeed, in corals, C-type lectin and C3 protein were usually up-regulated and activated in response to epizootic diseases [47,48,90,91]. However, their down-regulation may reflect suppression of host immunity, as previously observed for the association between corals and the microalga Chromera [92]. Mohamed et al. [92] also suggested that the down-regulation of some PRRs could reflect the host attempting to limit interactions with non-beneficial organisms, since both complement C3 and the C-type lectin have been implicated in symbiont recognition and in host-symbiont communication [34]. In addition, the down-regulation of C-type lectin and C3 has been observed in corals subjected to temperature/light stress, suggesting that these stresses might compromise the coral’s immune defenses and therefore increase the coral’s susceptibility to diseases [38,93,94,95]. Likewise, the decreased expression of the C-type lectin and C3 here suggests that the presence of Waminoa sp. individuals on coral tissue might interfere with the ability of the whole host coral to respond to the attack of various pathogens and at the same time could make it more vulnerable to environmental stressors. However, while the C3 appeared to be significantly down-regulated by the flatworm presence, the decrease in expression of the lectin was not significant. Considering that C-type lectins have been shown to respond immediately following an immune challenge [34,90] but may not show any significant response at later times [47], we hypothesize that the observed modulation could be influenced by the sampling times.
The cytoplasmic chaperonin Hsp70 is involved in assembly of newly synthesized proteins and in the refolding of misfolded or aggregated proteins, contributing to the protein transfer to different cellular compartments or to the proteolytic machinery and acting as cellular defensive mechanism [96]. Up-regulation of the Hsp70 has been proposed as an activator of other components of the coral effector immune systems, such as the prophenoloxidase cascade, in corals infected by pathogens [47]. On the contrary, the down-regulation of Hsp70 in corals reflected the impairment of the cellular defense mechanisms that is due to severe and intolerable stress [97,98,99], and may indicate a reduced activity of the immune system because of diseases [24]. In addition, since Hsps are ATP-dependent chaperones, the decrease of Hsp70 expression may be related to the high-energy expenditure necessary to reduce the deleterious effects of Waminoa sp. and restore cellular damage. However, it is important to underline that, since the roles of Hsp70 in organismal function are broad, changes in expression of this gene could also reflect changes in other physiological processes.
Actin was the most responsive gene, showing the greatest down-regulation. In addition to being fundamental for cell motility, contractibility, mitosis, and intracellular transport, Actin is also an important part of the nuclear complex, being required for the transcription of RNA polymerases and in the export of RNAs and proteins from the nucleus [100]. Down-regulation of Actin has previously been observed in corals subjected to thermal stress and acidification [38,68,101,102]. Since Actin is a major cytoskeletal component involved in growth, down-regulation of this gene could be indicative of growth inhibition caused by the presence of Waminoa sp. Moreover, the reduced expression of Actin may reflect a change in the regulation of gene transcription of proteins involved in cytoskeletal interactions and may imply changes in intracellular transport and cell shape/integrity, as previously suggested [102]. The overall down-regulation of all the analyzed genes may reflect a negative effect of the acoelomate ectosymbiont Waminoa sp. on the host coral L. radians. However, alternative scenarios should also be considered. For example, it could be possible that Waminoa did not cause detectable cellular stress to hosts, preferentially colonizing polyps with reduced defense responses, or interfering with polyp feeding and causing the observed gene down-regulation, as reduced resources would lead to reduced investment in defense.
In conclusion, our study demonstrated that Waminoa sp. showed a high prevalence and wide host range in Singapore coral reefs and its distribution patterns were specific to certain scleractinian host genera. Moreover, Waminoa sp. could impair both the cellular homeostasis and components of the immune system of the host, thus representing a potential further threat for coral communities living in an area already subjected to multiple stresses, such as sedimentation and light limitation. However, further studies analyzing more genes and biomarkers in different hosts are necessary to have a more complete picture of the association.

Supplementary Materials

The following supporting information can be downloaded at: https://0-www-mdpi-com.brum.beds.ac.uk/article/10.3390/d14040300/s1, Figure S1: Coverage percentage of the different benthic categories in the two sites analyzed and in the whole study area. Data are expressed as the mean ± SEM; Figure S2: Prevalence (%) of Waminoa sp.-corals association by coral genus in the two sites. Data are expressed as the mean ± SEM; Table S1: Symbiodiniaceae nucleotide databases; Table S2: RT-qPCR Mastermix used for determining gene expression and efficiency; Table S3: Coverage percentage of each coral genus in the two sites and in the whole study area; Table S4: Gene efficiency (E) for each analyzed gene (SD: standard deviation)

Author Contributions

G.M. and D.S. wrote the manuscript (original draft preparation); D.H., D.M., S.M. and E.M. reviewed and edited the manuscript; D.M., S.M., E.M. and D.S. analyzed the results; D.H., G.M. and D.S. conceived and designed the research and experiments; D.H., S.S.J. and R.Z.B.Q. secured funding for this research and for all reagents and materials; G.M., S.S.J., R.Z.B.Q. and R.C.P.-D. performed and supervised the lab activities. G.M. and S.S.J. conducted the field activities. All authors have read and agreed to the published version of the manuscript.

Funding

This research is supported by the Temasek Foundation under its Singapore Millennium Foundation Research Grant Programme.

Institutional Review Board Statement

All applicable permits and institutional guidelines required to perform the work were followed. Collections were made under permit NP/RP16–156.

Informed Consent Statement

Not applicable.

Data Availability Statement

The datasets generated during and/or analyzed during the current study are available from the corresponding authors on reasonable request.

Acknowledgments

We are grateful to members of the Reef Ecology Lab, National University of Singapore, for their support throughout this project, both in the field and in the laboratory. Special thanks to Nicholas Yap for his support throughout the project. Thanks to Daisuke Taira, Andrea Leong, and Ng Zhi Sheng for their support during diving activities.

Conflicts of Interest

The authors have no relevant financial or non-financial interest to disclose.

References

  1. Bos, A.R. Fishes (Gobiidae and Labridae) associated with the mushroom coral Heliofungia actiniformis (Scleractinia: Fungiidae) in the Philippines. Coral Reefs 2012, 31, 133. [Google Scholar] [CrossRef] [Green Version]
  2. Hoeksema, B.W.; Van der Meij, S.E.T.; Fransen, C.H. The mushroom coral as a habitat. J. Mar. Biol. Assoc. 2012, 92, 647–663. [Google Scholar] [CrossRef] [Green Version]
  3. Bos, A.R.; Hoeksema, B.W. Cryptobenthic fishes and co-inhabiting shrimps associated with the mushroom coral Heliofungia actiniformis (Fungiidae) in the Davao Gulf, Philippines. Environ. Biol. Fish 2015, 98, 1479–1489. [Google Scholar] [CrossRef]
  4. Montano, S.; Seveso, D.; Galli, P.; Puce, S.; Hoeksema, B.W. Mushroom corals as newly recorded hosts of the hydrozoan symbiont Zanclea sp. Mar. Biol. Res. 2015, 11, 773–779. [Google Scholar] [CrossRef]
  5. Montano, S.; Fattorini, S.; Parravicini, V.; Berumen, M.L.; Galli, P.; Maggioni, D.; Arrigoni, R.; Seveso, D.; Strona, G. Corals hosting symbiotic hydrozoans are less susceptible to predation and disease. Proc. R. Soc. B Biol. Sci. 2017, 284, 20172405. [Google Scholar] [CrossRef] [Green Version]
  6. Maggioni., D.; Arrigoni, R.; Seveso, D.; Galli, P.; Berumen, M.L.; Denis, V.; Hoeksema, B.W.; Huang, D.; Manca, F.; Pica, D.; et al. Evolution and biogeography of the Zanclea-Scleractinia symbiosis. Coral Reefs 2020, 1–17. [Google Scholar] [CrossRef]
  7. Baguñà, J.; Riutort, M. Molecular phylogeny of the Platyhelminthes. Can. J. Zool. 2014, 82, 168–193. [Google Scholar] [CrossRef]
  8. Kunihiro, S.; Reimer, J.D. Phylogenetic analyses of Symbiodinium isolated from Waminoa and their anthozoan hosts in the Ryukyus Archipelago, southern Japan. Symbiosis 2018, 76, 253–264. [Google Scholar] [CrossRef]
  9. Ogunlana, M.V.; Hooge, M.D.; Tekle, Y.I.; Benayahu, Y.; Barneah, O.; Tyler, S. Waminoa brickneri n. sp. (Acoela: Acoelomorpha) associated with corals in the Red Sea. Zootaxa 2005, 14, 1–14. [Google Scholar] [CrossRef] [Green Version]
  10. Hikosaka-Katayama, T.; Koike, K.; Yamashita, H.; Hikosaka, A.; Koike, K. Mechanisms of maternal inheritance of dinoflagellate symbionts in the acoelomorph worm Waminoa litus. Zool. Sci. 2012, 29, 559–567. [Google Scholar] [CrossRef] [Green Version]
  11. Barneah, O.; Brickner, I.; Hooge, M.; Weis, V.M.; Benayahu, Y. First evidence of maternal transmission of algal endosymbionts at an oocyte stage in a triploblastic host, with observations on reproduction in Waminoa brickneri (Acoelomorpha). Invert. Biol. 2007, 126, 113–119. [Google Scholar] [CrossRef]
  12. Barneah, O.; Ben-Dov, E.; Benayahu, Y.; Brickner, I.; Kushmaro, A. Molecular diversity and specificity of acoel worms associated with corals in the Gulf of Eilat (Red Sea). Aquat. Biol. 2012, 14, 277–281. [Google Scholar] [CrossRef]
  13. Haapkylä, J.; Seymour, A.S.; Barneah, O.; Brickner, I.; Hennige, S.; Suggett, D.; Smith, D. Association of Waminoa sp. (Acoela) with corals in the Wakatobi Marine Park, South-East Sulawesi, Indonesia. Mar. Biol. 2009, 156, 1021–1027. [Google Scholar] [CrossRef]
  14. Biondi, P.; Masucci, G.D.; Kunihiro, S.; Reimer, J.D. The distribution of reef-dwelling Waminoa flatworms in bays and on capes of Okinawa Island. Mar. Biodiv. 2019, 49, 405–413. [Google Scholar] [CrossRef]
  15. Kunihiro, S.; Farenzena, Z.; Hoeksema, B.W.; Groenenberg, D.S.; Hermanto, B.; Reimer, J.D. Morphological and phylogenetic diversity of Waminoa and similar flatworms (Acoelomorpha) in the western Pacific Ocean. Zoology 2019, 136, 125692. [Google Scholar] [CrossRef] [PubMed]
  16. Barton, J.A.; Bourne, D.G.; Humphrey, C.; Hutson, K.S. Parasites and coral-associated invertebrates that impact coral health. Rev. Aquacul. 2020, 12, 2284–2303. [Google Scholar] [CrossRef]
  17. Naumann, M.S.; Mayr, C.; Struck, U.; Wild, C. Coral mucus stable isotope composition and labeling: Experimental evidence for mucus uptake by epizoic acoelomorph worms. Mar. Biol. 2010, 157, 2521–2531. [Google Scholar] [CrossRef]
  18. Wijgerde, T.; Schots, P.; Van Onselen, E.; Janse, M.; Karruppannan, E.; Verreth, J.A.; Osinga, R. Epizoic acoelomorph flatworms impair zooplankton feeding by the scleractinian coral Galaxea fascicularis. Biol. Open 2012, 2, 10–17. [Google Scholar] [CrossRef] [Green Version]
  19. Brown, B.E.; Bythell, J.C. Perspectives on mucus secretion in reef corals. Mar. Ecol. Prog. Ser. 2005, 296, 291–309. [Google Scholar] [CrossRef] [Green Version]
  20. Hoeksema, B.W.; Farenzena, Z.T. Tissue loss in corals infested by acoelomorph flatworms (Waminoa sp.). Coral Reefs 2012, 31, 869. [Google Scholar] [CrossRef] [Green Version]
  21. Downs, C.A. Cellular diagnostics and its application to aquatic and marine toxicology. In Techniques in Aquatic Toxicology; Ostrander, G.K., Ed.; CRC Press: Boca Raton, FL, USA, 2005; Volume 2, pp. 181–208. [Google Scholar]
  22. Mydlarz, L.D.; McGinty, E.S.; Harvell, C.D. What are the physiological and immunological responses of coral to climate warming and disease? J. Exp. Biol. 2010, 213, 934–945. [Google Scholar] [CrossRef] [PubMed] [Green Version]
  23. Rosic, N.; Kaniewska, P.; Chan, C.K.K.; Ling, E.Y.S.; Edwards, D.; Dove, S.; Hoegh-Guldberg, O. Early transcriptional changes in the reef-building coral Acropora aspera in response to thermal and nutrient stress. BMC Genom. 2014, 15, 1052. [Google Scholar] [CrossRef] [PubMed] [Green Version]
  24. Seveso, D.; Montano, S.; Reggente, M.A.L.; Maggioni, D.; Orlandi, I.; Galli, P.; Vai, M. The cellular stress response of the scleractinian coral Goniopora columna during the progression of the black band disease. Cell Stress Chap. 2017, 22, 225–236. [Google Scholar] [CrossRef] [PubMed] [Green Version]
  25. Palmer, C.V.; Traylor-Knowles, N. Towards an integrated network of coral immune mechanisms. Proc. R. Soc. B Biol. Sci. 2012, 279, 4106–4114. [Google Scholar] [CrossRef] [Green Version]
  26. Traylor-Knowles, N.; Connelly, M.T. What is currently known about the effects of climate change on the coral immune response. Cur. Clim. Change Rep. 2017, 3, 252–260. [Google Scholar] [CrossRef]
  27. Carroll, M.C. The role of complement and complement receptors in induction and regulation of immunity. Annu. Rev. Immun. 1998, 16, 545–568. [Google Scholar] [CrossRef]
  28. Fujita, T. Evolution of the lectin–complement pathway and its role in innate immunity. Nat. Rev. Immun. 2002, 2, 346–353. [Google Scholar] [CrossRef]
  29. Christophides, G.K.; Zdobnov, E.; Barillas-Mury, C.; Birney, E.; Blandin, S.; Blass, C.; Brey, P.T.; Collins, F.H.; Danielli, A.; Dimopoulos, G.; et al. Immunity-related genes and gene families in Anopheles gambiae. Science 2002, 298, 159–165. [Google Scholar] [CrossRef] [Green Version]
  30. Ling, E.; Yu, X.Q. Cellular encapsulation and melanization are enhanced by immulectins, pattern recognition receptors from the tobacco hornworm Manduca sexta. Dev. Compar. Immun. 2006, 30, 289–299. [Google Scholar] [CrossRef]
  31. Endo, Y.; Nakazawa, N.; Iwaki, D.; Takahashi, M.; Matsushita, M.; Fujita, T. Interactions of ficolin and mannose-binding lectin with fibrinogen/fibrin augment the lectin complement pathway. J. Innate Immun. 2010, 2, 33–42. [Google Scholar] [CrossRef]
  32. Dishaw, L.J.; Smith, S.L.; Bigger, C.H. Characterization of a C3-like cDNA in a coral: Phylogenetic implications. Immunogenetics 2005, 57, 535–548. [Google Scholar] [CrossRef] [PubMed]
  33. Miller, D.J.; Hemmrich, G.; Ball, E.E.; Hayward, D.C.; Khalturin, K.; Funayama, N.; Agata, K.; Bosch, T.C. The innate immune repertoire in Cnidaria-ancestral complexity and stochastic gene loss. Genome Biol. 2007, 8, R59. [Google Scholar] [CrossRef] [PubMed] [Green Version]
  34. Kvennefors, E.C.E.; Leggat, W.; Kerr, C.C.; Ainsworth, T.D.; Hoegh-Guldberg, O.; Barnes, A.C. Analysis of evolutionarily conserved innate immune components in coral links immunity and symbiosis. Dev. Comp. Immun. 2010, 34, 1219–1229. [Google Scholar] [CrossRef] [PubMed]
  35. Shinzato, C.; Shoguchi, E.; Kawashima, T.; Hamada, M.; Hisata, K.; Tanaka, M.; Fujie, M.; Fujiwara, M.; Koyanagi, R.; Ikuta, T.; et al. Using the Acropora digitifera genome to understand coral responses to environmental change. Nature 2011, 476, 320–323. [Google Scholar] [CrossRef]
  36. Ocampo, I.D.; Zárate-Potes, A.; Pizarro, V.; Rojas, C.A.; Vera, N.E.; Cadavid, L.F. The immunotranscriptome of the Caribbean reef-building coral Pseudodiploria strigosa. Immunogenetics 2015, 67, 515–530. [Google Scholar] [CrossRef]
  37. Perrin, B.J.; Ervasti, J.M. The actin gene family: Function follows isoform. Cytoskeleton 2010, 67, 630–634. [Google Scholar] [CrossRef]
  38. Kenkel, C.D.; Aglyamova, G.; Alamaru, A.; Bhagooli, R.; Capper, R.; Cunning, R.; deVillers, A.; Haslun, J.A.; Hédouin, L.; Keshavmurthy, S.; et al. Development of gene expression markers of acute heat-light stress in reef-building corals of the genus Porites. PLoS ONE 2011, 6, e26914. [Google Scholar] [CrossRef] [Green Version]
  39. Balchin, D.; Hayer-Hartl, M.; Hartl, F.U. In vivo aspects of protein folding and quality control. Science 2016, 353, aac4354. [Google Scholar] [CrossRef]
  40. Downs, C.A.; Fauth, J.E.; Halas, J.C.; Dustan, P.; Bemiss, J.; Woodley, C.M. Oxidative stress and seasonal coral bleaching. Free Rad. Biol. Med. 2002, 33, 533–543. [Google Scholar] [CrossRef]
  41. Downs, C.A.; Woodley, C.M.; Fauth, J.E.; Knutson, S.; Burtscher, M.M.; May, L.A.; Ostrander, G.K. A survey of environmental pollutants and cellular-stress markers of Porites astreoides at six sites in St. John, US Virgin Islands. Ecotoxicology 2011, 20, 1914–1931. [Google Scholar]
  42. Louis, Y.D.; Bhagooli, R.; Seveso, D.; Maggioni, D.; Galli, P.; Vai, M.; Dyall, S.D. Local acclimatisation-driven differential gene and protein expression patterns of Hsp70 in Acropora muricata: Implications for coral tolerance to bleaching. Mol. Ecol. 2020, 29, 4382–4394. [Google Scholar] [CrossRef] [PubMed]
  43. Seveso, D.; Montano, S.; Strona, G.; Orlandi, I.; Galli, P.; Vai, M. Exploring the effect of salinity changes on the levels of Hsp60 in the tropical coral Seriatopora caliendrum. Mar. Environ. Res. 2013, 90, 96–103. [Google Scholar] [CrossRef] [PubMed]
  44. Seveso, D.; Montano, S.; Strona, G.; Orlandi, I.; Galli, P.; Vai, M. Hsp60 expression profiles in the reef-building coral Seriatopora caliendrum subjected to heat and cold shock regimes. Mar. Environ. Res. 2016, 119, 1–11. [Google Scholar] [CrossRef] [PubMed]
  45. Montalbetti, E.; Biscéré, T.; Ferrier-Pagès, C.; Houlbrèque, F.; Orlandi, I.; Forcella, M.; Galli, P.; Vai, M.; Seveso, D. Manganese benefits heat-stressed corals at the cellular level. Front. Mar. Sci. 2021, 8, 803. [Google Scholar] [CrossRef]
  46. Seveso, D.; Montano, S.; Strona, G.; Orlandi, I.; Vai, M.; Galli, P. Up-regulation of Hsp60 in response to skeleton eroding band disease but not by algal overgrowth in the scleractinian coral Acropora muricata. Mar. Environ. Res. 2012, 78, 34–39. [Google Scholar] [CrossRef] [PubMed]
  47. Brown, T.; Bourne, D.; Rodriguez-Lanetty, M. Transcriptional activation of c3 and hsp70 as part of the immune response of Acropora millepora to bacterial challenges. PLoS ONE 2013, 8, e67246. [Google Scholar] [CrossRef]
  48. Libro, S.; Kaluziak, S.T.; Vollmer, S.V. RNA-seq profiles of immune related genes in the staghorn coral Acropora cervicornis infected with white band disease. PLoS ONE 2013, 8, e81821. [Google Scholar] [CrossRef] [Green Version]
  49. Fuess, L.E.; Weil, E.; Mydlarz, L.D. Associations between transcriptional changes and protein phenotypes provide insights into immune regulation in corals. Dev. Compar. Immun. 2016, 62, 17–28. [Google Scholar] [CrossRef] [Green Version]
  50. Guest, J.R.; Tun, K.; Low, J.; Vergés, A.; Marzinelli, E.M.; Campbell, A.H.; Bauman, A.G.; Feary, D.A.; Chou, L.M.; Steinberg, P.D. 27 years of benthic and coral community dynamics on turbid, highly urbanised reefs off Singapore. Sci. Rep. 2016, 6, 36260. [Google Scholar] [CrossRef] [Green Version]
  51. Chou, L.M.; Huang, D.; Tan, K.S.; Toh, T.C.; Goh, B.P.L.; Tun, K. World Seas: An Environmental Evaluation. In The Indian Ocean to the Pacific. World Seas: An Environmental Evaluation; Sheppard, C.R.C., Ed.; Academic Press: London, UK, 2019; Volume 2, pp. 539–558. [Google Scholar]
  52. Todd, P.A.; Ong, X.; Chou, L.M. Impacts of pollution on marine life in Southeast Asia. Biodiv. Conserv. 2010, 19, 1063–1082. [Google Scholar] [CrossRef]
  53. Browne, N.K.; Tay, J.K.; Low, J.; Larson, O.; Todd, P.A. Fluctuations in coral health of four common inshore reef corals in response to seasonal and anthropogenic changes in water quality. Mar. Environ. Res. 2015, 105, 39–52. [Google Scholar] [CrossRef] [PubMed] [Green Version]
  54. Heery, E.C.; Hoeksema, B.W.; Browne, N.K.; Reimer, J.D.; Ang, P.O.; Huang, D.; Friess, D.A.; Chou, L.M.; Loke, L.; Saksena-Taylor, P.; et al. Urban coral reefs: Degradation and resilience of hard coral assemblages in coastal cities of East and Southeast Asia. Mar. Poll. Bull. 2018, 135, 654–681. [Google Scholar] [CrossRef] [PubMed]
  55. Chow, G.S.E.; Chan, Y.K.S.; Jain, S.S.; Huang, D. Light limitation selects for depth generalists in urbanised reef coral communities. Mar. Environ. Res. 2019, 147, 101–112. [Google Scholar] [CrossRef] [PubMed]
  56. Guest, J.R.; Baird, A.H.; Maynard, J.A.; Muttaqin, E.; Edwards, A.J.; Campbell, S.J.; Chou, L.M. Contrasting patterns of coral bleaching susceptibility in 2010 suggest an adaptive response to thermal stress. PLoS ONE 2012, 7, e33353. [Google Scholar] [CrossRef] [PubMed]
  57. Chou, L.M.; Toh, T.C.; Toh, K.B.; Ng, C.S.L.; Cabaitan, P.; Tun, K.; Goh, E.; Afiq-Rosli, L.; Taira, D.; Du, R.C.; et al. Differential response of coral assemblages to thermal stress underscores the complexity in predicting bleaching susceptibility. PLoS ONE 2016, 11, e0159755. [Google Scholar] [CrossRef] [PubMed] [Green Version]
  58. Ng, C.S.L.; Huang, D.; Toh, K.B.; Sam, S.Q.; Kikuzawa, Y.P.; Toh, T.C.; Taira, D.; Chan, Y.K.S.; Hung, L.Z.T.; Sim, W.T.; et al. Responses of urban reef corals during the 2016 mass bleaching event. Mar. Poll. Bull. 2020, 154, 111111. [Google Scholar] [CrossRef] [PubMed]
  59. Januchowski-Hartley, F.A.; Bauman, A.G.; Morgan, K.M.; Seah, J.C.; Huang, D.; Todd, P.A. Accreting coral reefs in a highly urbanized environment. Coral Reefs 2020, 39, 717–731. [Google Scholar] [CrossRef]
  60. Huang, D.; Benzoni, F.; Arrigoni, R.; Baird, A.H.; Berumen, M.L.; Bouwmeester, J.; Chou, L.M.; Fukami, H.; Licuanan, W.Y.; Lovell, E.R.; et al. Towards a phylogenetic classification of reef corals: The Indo-Pacific genera Merulina, Goniastrea and Scapophyllia (Scleractinia, Merulinidae). Zool. Scrip. 2014, 43, 531–548. [Google Scholar] [CrossRef]
  61. Wong, J.S.Y.; Chan, Y.K.S.; Ng, C.S.L.; Tun, K.P.P.; Darling, E.S.; Huang, D. Comparing patterns of taxonomic, functional and phylogenetic diversity in reef coral communities. Coral Reefs 2018, 37, 737–750. [Google Scholar] [CrossRef]
  62. Raymundo, L.J.; Bruckner, A.W.; Work, T.M.; Willis, B. Coral Disease Handbook Guidelines For Assessment, Monitoring and Management; Couch, C.A., Harvell, C.D., Raymundo, L., Eds.; Coral Reef Targeted Research and Capacity Building for Management Program: St. Lucia, QLD, Australia; Coral Gables, FL, USA, 2008. [Google Scholar]
  63. Hill, J.; Wilkinson, C. Methods for Ecological Monitoring of Coral Reefs; Australian Institute of Marine Science: Townsville, Australia, 2004. [Google Scholar]
  64. Lechowicz, M.J. The sampling characteristics of electivity indices. Oecologia 1982, 52, 22–30. [Google Scholar] [CrossRef]
  65. Chesson, J. Measuring preference in selective predation. Ecology 1978, 59, 211–215. [Google Scholar] [CrossRef]
  66. Van der Ploeg, H.A.; Scavia, D. Calculation and use of selectivity coefficients of feeding: Zooplankton grazing. Ecol. Model. 1979, 7, 135–149. [Google Scholar] [CrossRef]
  67. Seveso, D.; Montano, S.; Reggente, M.A.L.; Orlandi, I.; Galli, P.; Vai, M. Modulation of Hsp60 in response to coral brown band disease. Dis. Aquat. Org. 2015, 115, 15–23. [Google Scholar] [CrossRef] [PubMed] [Green Version]
  68. Poquita-Du, R.C.; Goh, Y.L.; Huang, D.; Chou, L.M.; Todd, P.A. Gene expression and photophysiological changes in Pocillopora acuta coral holobiont following heat stress and recovery. Microorganisms 2020, 8, 1227. [Google Scholar] [CrossRef] [PubMed]
  69. Quek, Z.B.R.; Huang, D. Effects of missing data and data type on phylotranscriptomic analysis of stony corals (Cnidaria: Anthozoa: Scleractinia). Mol. Phylogen. Evol. 2019, 134, 12–23. [Google Scholar] [CrossRef] [PubMed]
  70. Voolstra, C.R.; Miller, D.J.; Ragan, M.A.; Hoffmann, A.; Hoegh-Guldberg, O.; Bourne, D.; Ball, E.E.; Ying, H.; Foret, S.; Takahashi, S.; et al. The ReFuGe 2020 Consortium—Using “omics” approaches to explore the adaptability and resilience of coral holobionts to environmental change. Front. Mar. Sci. 2015, 2, 68. [Google Scholar]
  71. Liew, Y.J.; Aranda, M.; Voolstra, C.R. Reefgenomics.Org–a repository for marine genomics data. Database 2016, 2016, baw152. [Google Scholar] [CrossRef]
  72. Matz, M.V.; Wright, R.M.; Scott, J.G. No control genes required: Bayesian analysis of qRT-PCR data. PLoS ONE 2013, 8, e71448. [Google Scholar] [CrossRef]
  73. Clarke, K.R.; Gorley, R.N. Getting Started with PRIMER v7; PRIMER-E Ltd.: Plymouth, UK, 2015. [Google Scholar]
  74. Anderson, M.; Gorley, R.; Clarke, K. PERMANOVA+ for PRIMER: Guide to Software and Statistical Methods; PRIMER-E Ltd: Plymouth, UK, 2008. [Google Scholar]
  75. Ponti, M.; Fratangeli, F.; Dondi, N.; Reinach, M.S.; Serra, C.; Sweet, M.J. Baseline reef health surveys at Bangka Island (North Sulawesi, Indonesia) reveal new threats. Peer J. 2016, 4, e2614. [Google Scholar] [CrossRef] [Green Version]
  76. Trench, R.K.; Winsor, H. Symbiosis with Dinoflagellates in Two Pelagic Flatworms, Amphiscolops sp. and Haplodiscus sp.; Balaban Publishers: Philadelphia, PA, USA, 1987. [Google Scholar]
  77. Winsor, L. Marine Turbellaria (Acoela) from North Queensland. Mem. Queensl. Mus. 1990, 28, 785–800. [Google Scholar]
  78. Cooper, C.; Clode, P.L.; Thomson, D.P.; Stat, M. A flatworm from the genus Waminoa (Acoela: Convolutidae) associated with bleached corals in Western Australia. Zool. Sci. 2015, 32, 465–473. [Google Scholar] [CrossRef] [PubMed]
  79. Huang, C.Y.; Hwang, J.S.; Yamashiro, H.; Tang, S.L. Spatial and cross-seasonal patterns of coral diseases in reefs of Taiwan: High prevalence and regional variation. Dis. Aquat. Organ. 2021, 146, 145–156. [Google Scholar] [CrossRef] [PubMed]
  80. Chen, P.Y.; Chen, C.C.; Chu, L.; McCarl, B. Evaluating the economic damage of climate change on global coral reefs. Glob. Environ. Change 2015, 30, 12–20. [Google Scholar] [CrossRef]
  81. Morgan, K.M.; Moynihan, M.A.; Sanwlani, N.; Switzer, A.D. Light limitation and depth-variable sedimentation drives vertical reef compression on turbid coral reefs. Front. Mar. Sci. 2020, 7, 931. [Google Scholar] [CrossRef]
  82. Stafford-Smith, M.G.; Ormond, R.F.G. Sediment-rejection mechanisms of 42 species of Australian scleractinian corals. Mar. Fresh Res. 1992, 43, 683–705. [Google Scholar] [CrossRef]
  83. Erftemeijer, P.L.; Riegl, B.; Hoeksema, B.W.; Todd, P.A. Environmental impacts of dredging and other sediment disturbances on corals: A review. Mar. Poll. Bull. 2012, 64, 1737–1765. [Google Scholar] [CrossRef]
  84. Bessell-Browne, P.; Negri, A.P.; Fisher, R.; Clode, P.L.; Duckworth, A.; Jones, R. Impacts of turbidity on corals: The relative importance of light limitation and suspended sediments. Mar. Poll. Bull. 2017, 117, 161–170. [Google Scholar] [CrossRef]
  85. Browne, N.; Braoun, C.; McIlwain, J.; Nagarajan, R.; Zinke, J. Borneo coral reefs subject to high sediment loads show evidence of resilience to various environmental stressors. Peer J. 2019, 7, e7382. [Google Scholar] [CrossRef] [Green Version]
  86. Houlbrèque, F.; Ferrier-Pagès, C. Heterotrophy in tropical scleractinian corals. Biol. Rev. 2009, 84, 1–17. [Google Scholar] [CrossRef]
  87. Louis, Y.D.; Bhagooli, R.; Kenkel, C.D.; Baker, A.C.; Dyall, S.D. Gene expression biomarkers of heat stress in scleractinian corals: Promises and limitations. Compar. Biochem. Physiol. Toxic Pharmacol. 2017, 191, 63–77. [Google Scholar] [CrossRef] [Green Version]
  88. Cziesielski, M.J.; Schmidt-Roach, S.; Aranda, M. The past, present, and future of coral heat stress studies. Ecol. Evol. 2019, 9, 10055–10066. [Google Scholar] [CrossRef] [PubMed]
  89. Mydlarz, L.D.; Fuess, L.; Mann, W.; Pinzón, J.H.; Gochfeld, D.J. Cnidarian immunity: From genomes to phenomes. In The Cnidaria, Past, Present and Future; Springer: Cham, Switzerland, 2016; pp. 441–446. [Google Scholar]
  90. Wright, R.M.; Aglyamova, G.V.; Meyer, E.; Matz, M.V. Gene expression associated with white syndromes in a reef building coral Acropora hyacinthus. BMC Genom. 2015, 16, 371. [Google Scholar] [CrossRef] [PubMed] [Green Version]
  91. Seneca, F.O.; Davtian, D.; Boyer, L.; Czerucka, D. Gene expression kinetics of Exaiptasia pallida innate immune response to Vibrio parahaemolyticus infection. BMC Genom. 2020, 21, 768. [Google Scholar] [CrossRef] [PubMed]
  92. Mohamed, A.R.; Cumbo, V.R.; Harii, S.; Shinzato, C.; Chan, C.X.; Ragan, M.A.; Satoh, N.; Ball, E.E.; Miller, D.J. Deciphering the nature of the coral–Chromera association. ISME J. 2018, 12, 776–790. [Google Scholar] [CrossRef]
  93. Rodriguez-Lanetty, M.; Harii, S.; Hoegh-Guldberg, O. Early molecular responses of coral larvae to hyperthermal stress. Mol. Ecol. 2009, 18, 5101–5114. [Google Scholar] [CrossRef]
  94. Vidal-Dupiol, J.; Adjeroud, M.; Roger, E.; Foure, L.; Duval, D.; Mone, Y.; Mitta, G. Coral bleaching under thermal stress: Putative involvement of host/symbiont recognition mechanisms. BMC Physiol. 2009, 9, 14. [Google Scholar] [CrossRef] [Green Version]
  95. Pinzón, J.H.; Kamel, B.; Burge, C.A.; Harvell, C.D.; Medina, M.; Weil, E.; Mydlarz, L.D. Whole transcriptome analysis reveals changes in expression of immune-related genes during and after bleaching in a reef-building coral. R. Soc. Open Sci. 2015, 2, 140214. [Google Scholar] [CrossRef] [Green Version]
  96. Rosenzweig, R.; Nillegoda, N.B.; Mayer, M.P.; Bukau, B. The Hsp70 chaperone network. Nat. Rev. Mol. Cell. Biol. 2019, 20, 665–680. [Google Scholar] [CrossRef]
  97. Rosic, N.N.; Pernice, M.; Dove, S.; Dunn, S.; Hoegh-Guldberg, O. Gene expression profiles of cytosolic heat shock proteins Hsp70 and Hsp90 from symbiotic dinoflagellates in response to thermal stress: Possible implications for coral bleaching. Cell Stress Chap. 2011, 16, 69–80. [Google Scholar] [CrossRef] [Green Version]
  98. Seveso, D.; Montano, S.; Strona, G.; Orlandi, I.; Galli, P.; Vai, M. The susceptibility of corals to thermal stress by analyzing Hsp60 expression. Mar. Environ. Res. 2014, 99, 69–75. [Google Scholar] [CrossRef]
  99. Seveso, D.; Arrigoni, R.; Montano, S.; Maggioni, D.; Orlandi, I.; Berumen, M.L.; Galli, P.; Vai, M. Investigating the heat shock protein response involved in coral bleaching across scleractinian species in the central Red Sea. Coral Reefs 2020, 39, 85–98. [Google Scholar] [CrossRef]
  100. Zheng, B.; Han, M.; Bernier, M.; Wen, J.K. Nuclear actin and actin-binding proteins in the regulation of transcription and gene expression. FEBS J. 2009, 276, 2669–2685. [Google Scholar] [CrossRef] [PubMed]
  101. DeSalvo, M.K.; Voolstra, C.R.; Sunagawa, S.; Schwarz, J.A.; Stillman, J.H.; Coffroth, M.A.; Szmant, A.M.; Medina, M. Differential gene expression during thermal stress and bleaching in the Caribbean coral Montastraea faveolata. Mol. Ecol. 2008, 17, 3952–3971. [Google Scholar] [CrossRef] [PubMed]
  102. Kaniewska, P.; Campbell, P.R.; Kline, D.I.; Rodriguez-Lanetty, M.; Miller, D.J.; Dove, S.; Hoegh-Guldberg, O. Major cellular and physiological impacts of ocean acidification on a reef building coral. PLoS ONE 2012, 7, e34659. [Google Scholar] [CrossRef] [Green Version]
Figure 1. Map of the study area showing the two investigated sites. Pulau Hantu is a sheltered site situated 8 km south of mainland Singapore, while Kusu Island is located 6.4 km south of Singapore’s city center and 13.4 km east of Pulau Hantu.
Diversity 14 00300 g001
Figure 2. Waminoa sp. individuals in association with different coral genera in Singapore reefs. (A) Close up of a single Waminoa sp. individual characterized by an obcordate general shape, body with brown coloration, white peripheral outer edge, white random dots, and white comparatively larger one white internal spot. Flatworms colonizing corals belonging to the genera Pachyseris (B), Fungia (C), Lobophyllia (D,E), Goniastrea (F), Pectinia (G), Merulina (H), and Favites (I). Scale bars: 1 mm for (A) ~1 cm for (C,E,F,G) ~2 cm for (B,D,H,I).
Diversity 14 00300 g002
Figure 3. Prevalence (%) of Waminoa sp.–corals associations in Pulau Hantu and Kusu Island. Numbers above each bar indicate the total number of coral colonies (both with and without Waminoa) analyzed per site. Data are expressed as the mean ± SEM. One-way ANOVA was performed between sites. Letters on the bars denote significant difference among sites. Different letters indicate significant difference (p < 0.05), while same letter indicates no significant difference (p ≥ 0.05).
Diversity 14 00300 g003
Figure 4. (A) Prevalence (%) of Waminoa sp.–corals associations by genus in the whole study area. Data are expressed as mean ± SEM. Letters denote Tukey’s significant differences among the different groups (p < 0.05); the same letter indicates no significant difference (p ≥ 0.05). (B) Host preferences of Waminoa sp. according to the Van der Ploeg and Scavia selectivity coefficient Ei (−1 = complete avoidance; 0 = random choice; +1 = exclusive preference) for each coral genus. In both graphs, only the coral genera with an association prevalence > 5% are reported.
Diversity 14 00300 g004
Figure 5. (A) Abundance (%; mean ± SE) of the coral colonies in association with Waminoa individuals based on the surface coverage (categories are explained in the Materials and Method section) by the flatworms. (B) Relative abundance (%) of coral colonies per genus showing a low, moderate, severe, or extreme distribution of Waminoa sp. individuals on their surface.
Diversity 14 00300 g005
Figure 6. (A) Changes in expression levels of the analyzed genes (log2-transformed) between coral fragments not infested (W/0) and infested with Waminoa sp. (W). Significant differences in the gene expression abundance are indicated with asterisks. (B) Modulation of each gene as fold change. Fold changes were calculated with respect to levels detected in “W” fragments and were log2-transformed. In both graphs, data are expressed as means (n = 5).
Diversity 14 00300 g006
Table 1. List of genes of interest (GOIs) with primer designs. The melting temperature (Tm), the % of guanine and cytosine (GC), and the length of PCR product (bp) are also reported for each gene. Additional information of these sequences can be found in Supplementary Materials.
GeneSequence Tm (°C)GC %PCR Product
C- type lectinF: 5′–GTT CTA CTG GGT AGA CGA CA–3′53.250.00155 bp
R: 5′–GAA CAT CAT TCC ATG GTC CC–3′53.450.00
C3F: 5′–GTT GAG TTC CCT GAT GCA AT–3′50.940.00159 bp
R: 5′–CAA CAG GTA AAC GCT TTG G–3′52.047.37
Hsp70F: 5′–ACA ACT CCC AGC TAT GTC GC–3′57.355.00226 bp
R: 5′–TCC ACT CTC CCT TGG TCT GT–3′57.655.00
ActinF: 5′–ATG GTT GGT ATG GGT CAG AAA G–3′54.845.45219 bp
R: 5′–TCT GTT AGC TTT TGG GTT GAG T–3′54.340.91
Publisher’s Note: MDPI stays neutral with regard to jurisdictional claims in published maps and institutional affiliations.

