Article

Climatic and Topographical Effects on the Spatiotemporal Variations of Vegetation in Hexi Corridor, Northwestern China

1
Qilian Shan Station of Glaciology and Eco-Environment, State Key Laboratory of Cryospheric Science, Northwest Institute of Eco-Environment and Resources, Chinese Academy of Sciences (CAS), Lanzhou 730000, China
2
Lanzhou Regional Climate Center, Lanzhou 730000, China
3
University of Chinese Academy of Sciences, Beijing 100049, China
4
Chengdu Institute of Biology, Chinese Academy of Sciences, Chengdu 610041, China
5
School of Foreign Languages and Literatures, Lanzhou University, Lanzhou 730000, China
6
National Climate Center, Beijing 100081, China
7
Zhangye Meteorological Bureau, Zhangye 734000, China
*
Author to whom correspondence should be addressed.
Submission received: 18 April 2022 / Revised: 5 May 2022 / Accepted: 5 May 2022 / Published: 6 May 2022
(This article belongs to the Special Issue Mountain Biodiversity, Ecosystem Functioning and Services)

Abstract

:
Oases, as complex geographical landscapes, are strongly influenced by both natural variation and human activities. However, they have degenerated because of unplanned land use and water resource development. The research of oasis changes has mostly discussed single components, but multiple components, especially spatial changes to oasis vegetation, need further strengthening. Land use and NDVI were extracted based on Landsat 5/8 and Mod13A3, respectively, and a transfer matrix was constructed to analyze changes of land use in the Hexi Corridor during 2000–2020. The significant changes in the area of each land use were also quantified. Combined with regional temperature and precipitation, interpolated from meteorological data, the correlations between regional temperature, precipitation, and vegetation coverage were calculated, especially in the quantized areas with significant associations. The results showed that the area of bare land or desert decreased, while the areas of agricultural and residential land increased. The normalized difference NDVI of the studied oases increased at the rate of 0.021 per decade, which was positively related to precipitation (p < 0.05), rather than temperature; of which, farmland and planted grass land were 55.65% and 33.79% in the significantly increased area. In the area of significant positive relation between NDVI and precipitation, the ratio of grassland, farmland, and forest was 79.21%, 12.82%, and 4.06%, respectively. Additionally, changes in oasis vegetation were determined primarily by agricultural activities, which reflected a combination of natural and anthropic influences.

1. Introduction

An oasis is a small-to-medium-scale landscape maintained by a water supply in an arid or semi-arid desert area [1]. It is also an unstable ecosystem, with the characteristic of high habitat fragmentation. In China, oases are mainly distributed in arid and semi-arid regions to the west of the Helan Mountians, whose area is only 5% of the total. They support the survival of 90% of people and the economic development of 95% [2]. Therefore, changes in the ecosystem of oases can have a considerable influence on both ecological security and sustainable socioeconomic development [3].
The Hexi Corridor in northwestern China, which is a region affected by human activities, climate change, and tectonic activities [4], is one of the most important, but vulnerable, oasis ecosystems in the arid and semi-arid regions of China [5] It has been reported that the dynamic changing of the oasis area in the Hexi Corridor is closely related to agricultural industry [6]. Moreover, combining vegetation and soil-related endmembers time series data can enhance conventional LUCC analysis, to help fully capture land degradation processes [7]. There is strong negative correlation between the water resource reserves and the NDVI of the area [8]. In particular, the evolution of an artificial oasis is closely correlated with human economic activities and the environmental carrying capacity of oases [9]. Natural factors and human activity controlled the desertification process, but the reversal of desertification mainly resulted from human activities [10]. In respect to oases, the socioeconomic development and ecological/environmental coordination among the different administrative regions within the Hexi Corridor vary greatly [11]. The expansion of cultivated land and unreasonable utilization of groundwater are the main factors associated with the climatic and environmental degradation of the Hexi Corridor [12]. The rapid process of urbanization and coordinated urban–rural development have reduced the ecosystem services of the Hexi Corridor [13]. Remote sensing is an effective way to extract spatial information, to monitor spatiotemporal variation at a regional scale. Of which, land-use maps can describe information about land surface coverage. Thus, this has been mostly used to analyze vegetation change. However, there is still a need for further investigation of both natural and human influences, especially in relation to long-term input data. In addition, the more detailed changes at local level need to be strengthened [14]. Investigation of the ecologic and environmental problems in the Hexi Corridor, which highlight the importance of natural and human activities as the driving forces of oasis change, could help boost the sustainable socioeconomic development of the region.
In this study, Landsat5/TM, Landsat8/OLI, MOD13A3, and PANDA data were used in combination with regional meteorological observations, to discuss the influence of climate change and human activities on oasis vegetation in the Hexi Corridor. The changes in the vegetation of the Hexi Corridor and areas of land use in the fluctuating regions were quantitated. In addition, DEM, population number, livestock number, settlement number, and GDP were collected to analyze their influence on oasis change. The findings of this work improve the understanding of the change mechanisms affecting oasis landscapes and provide a scientific basis to support policy makers.

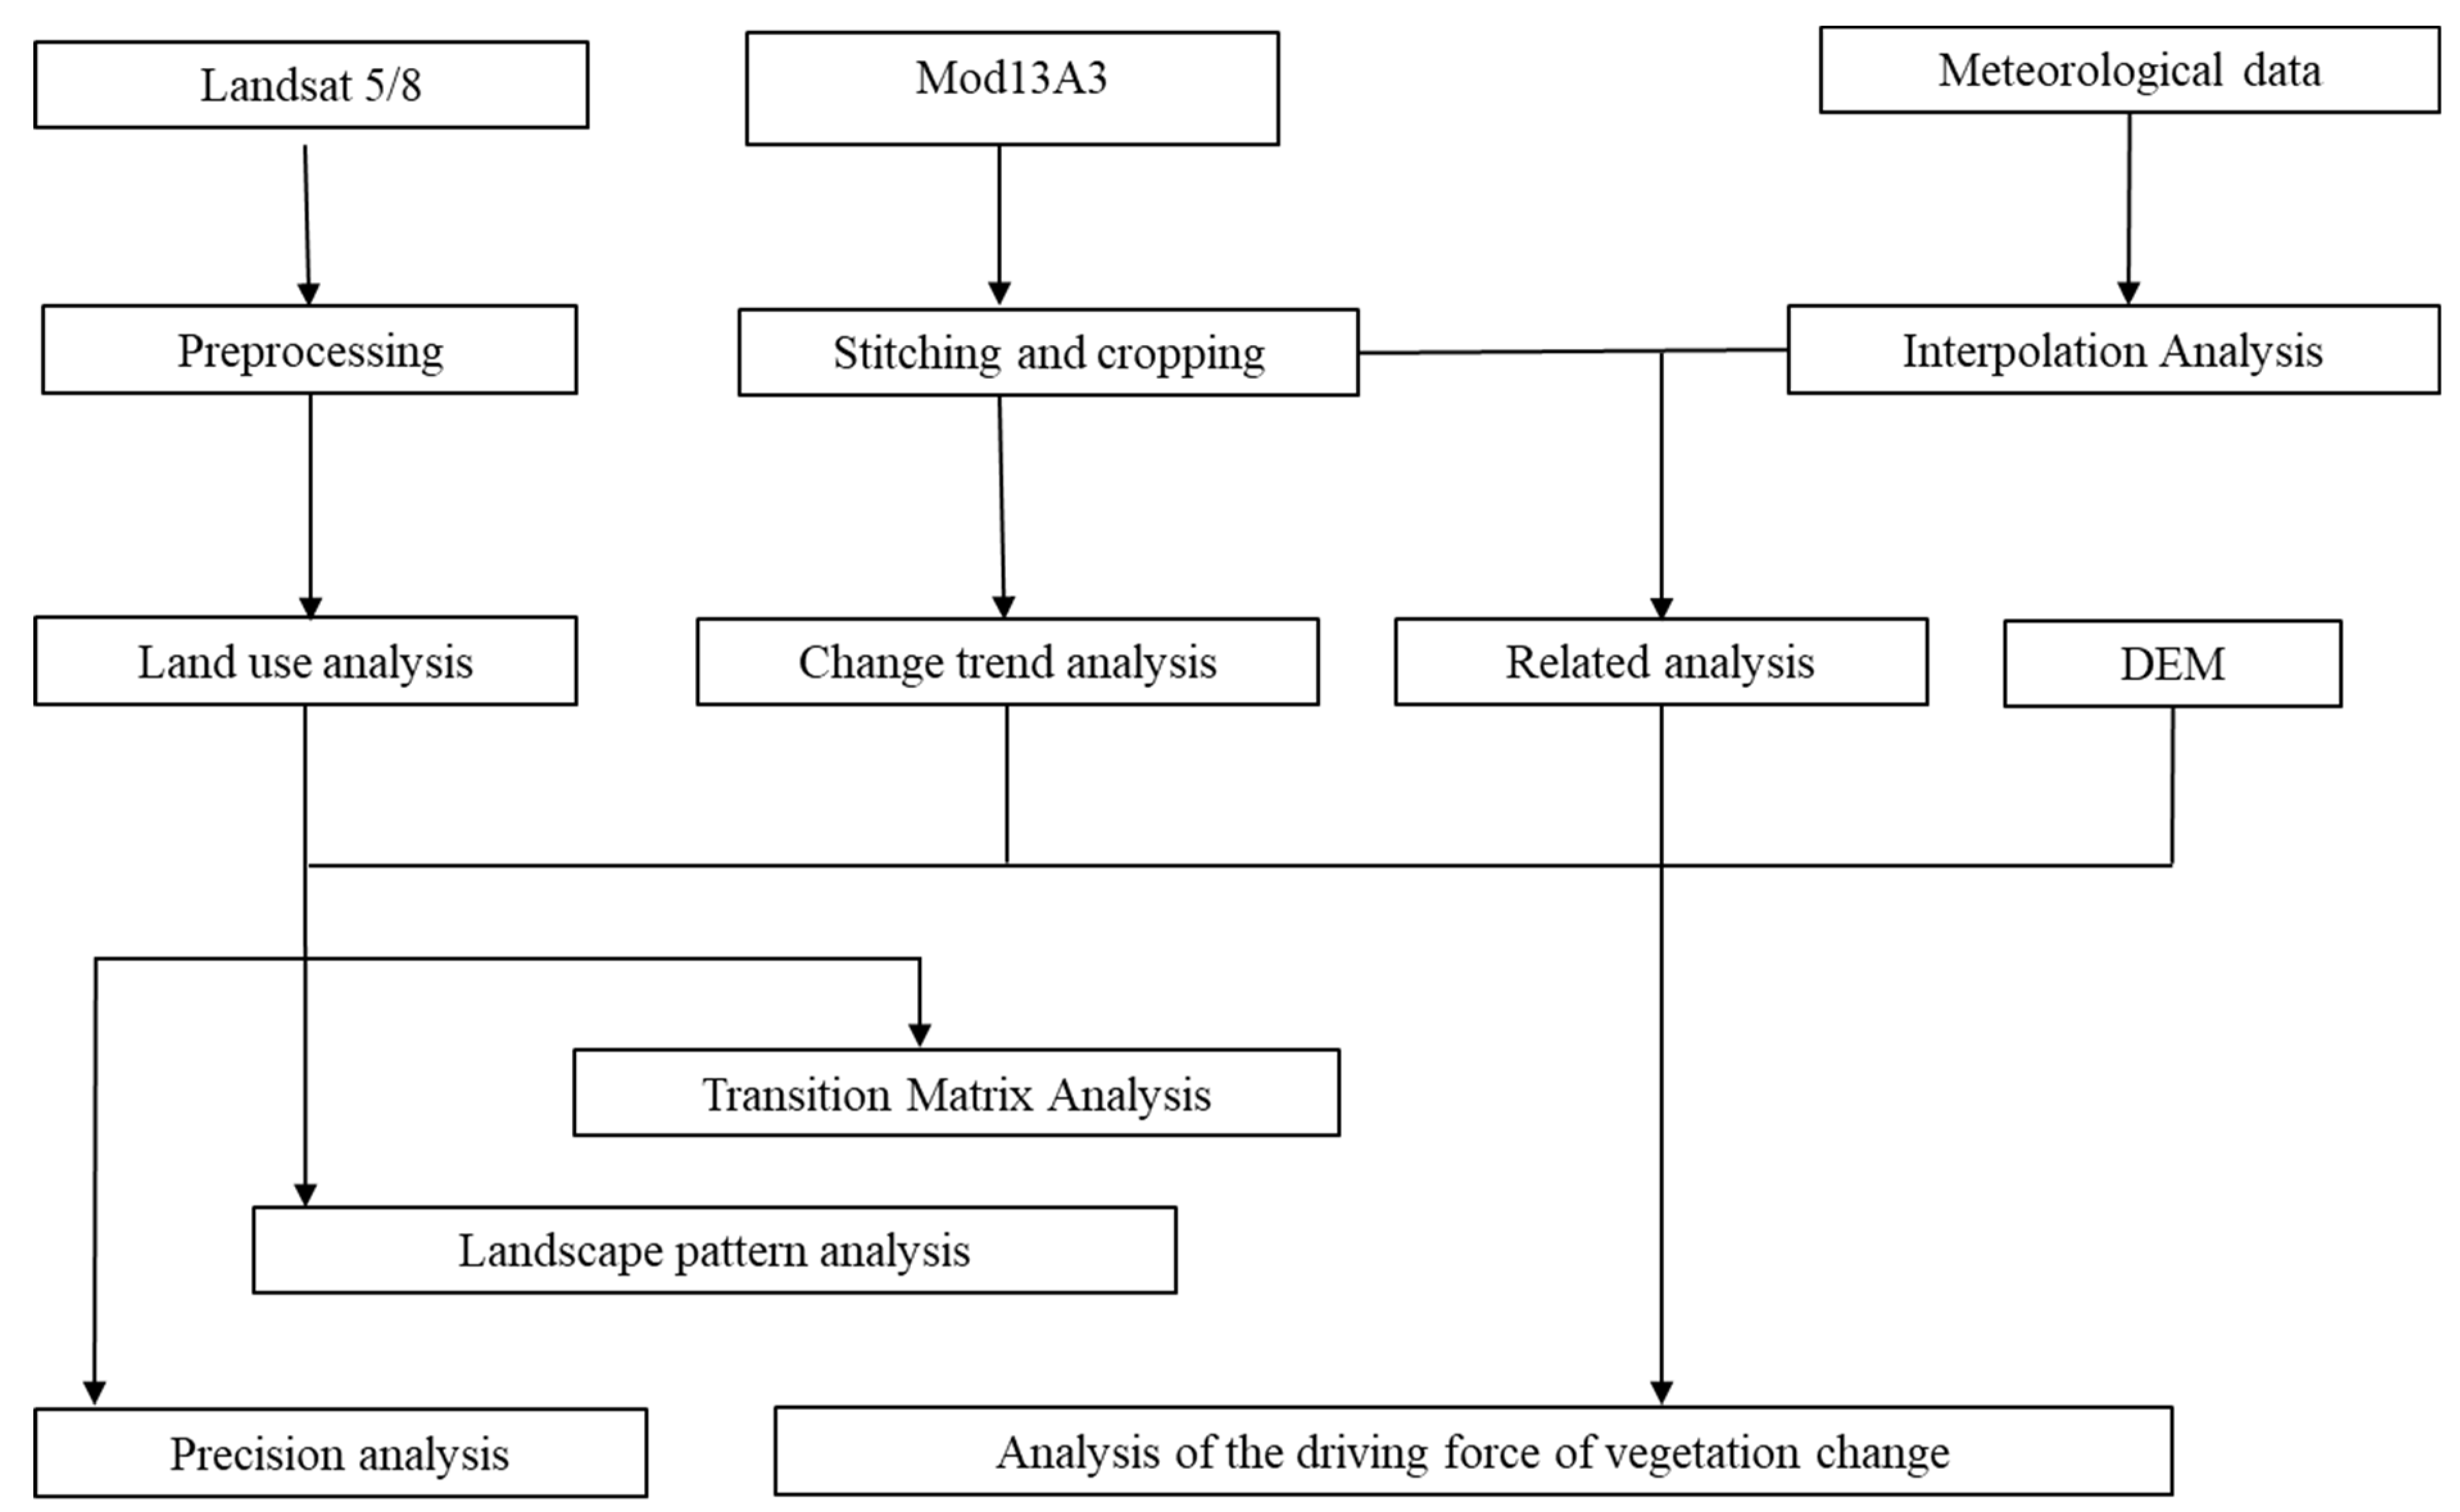
2. Materials and Methods

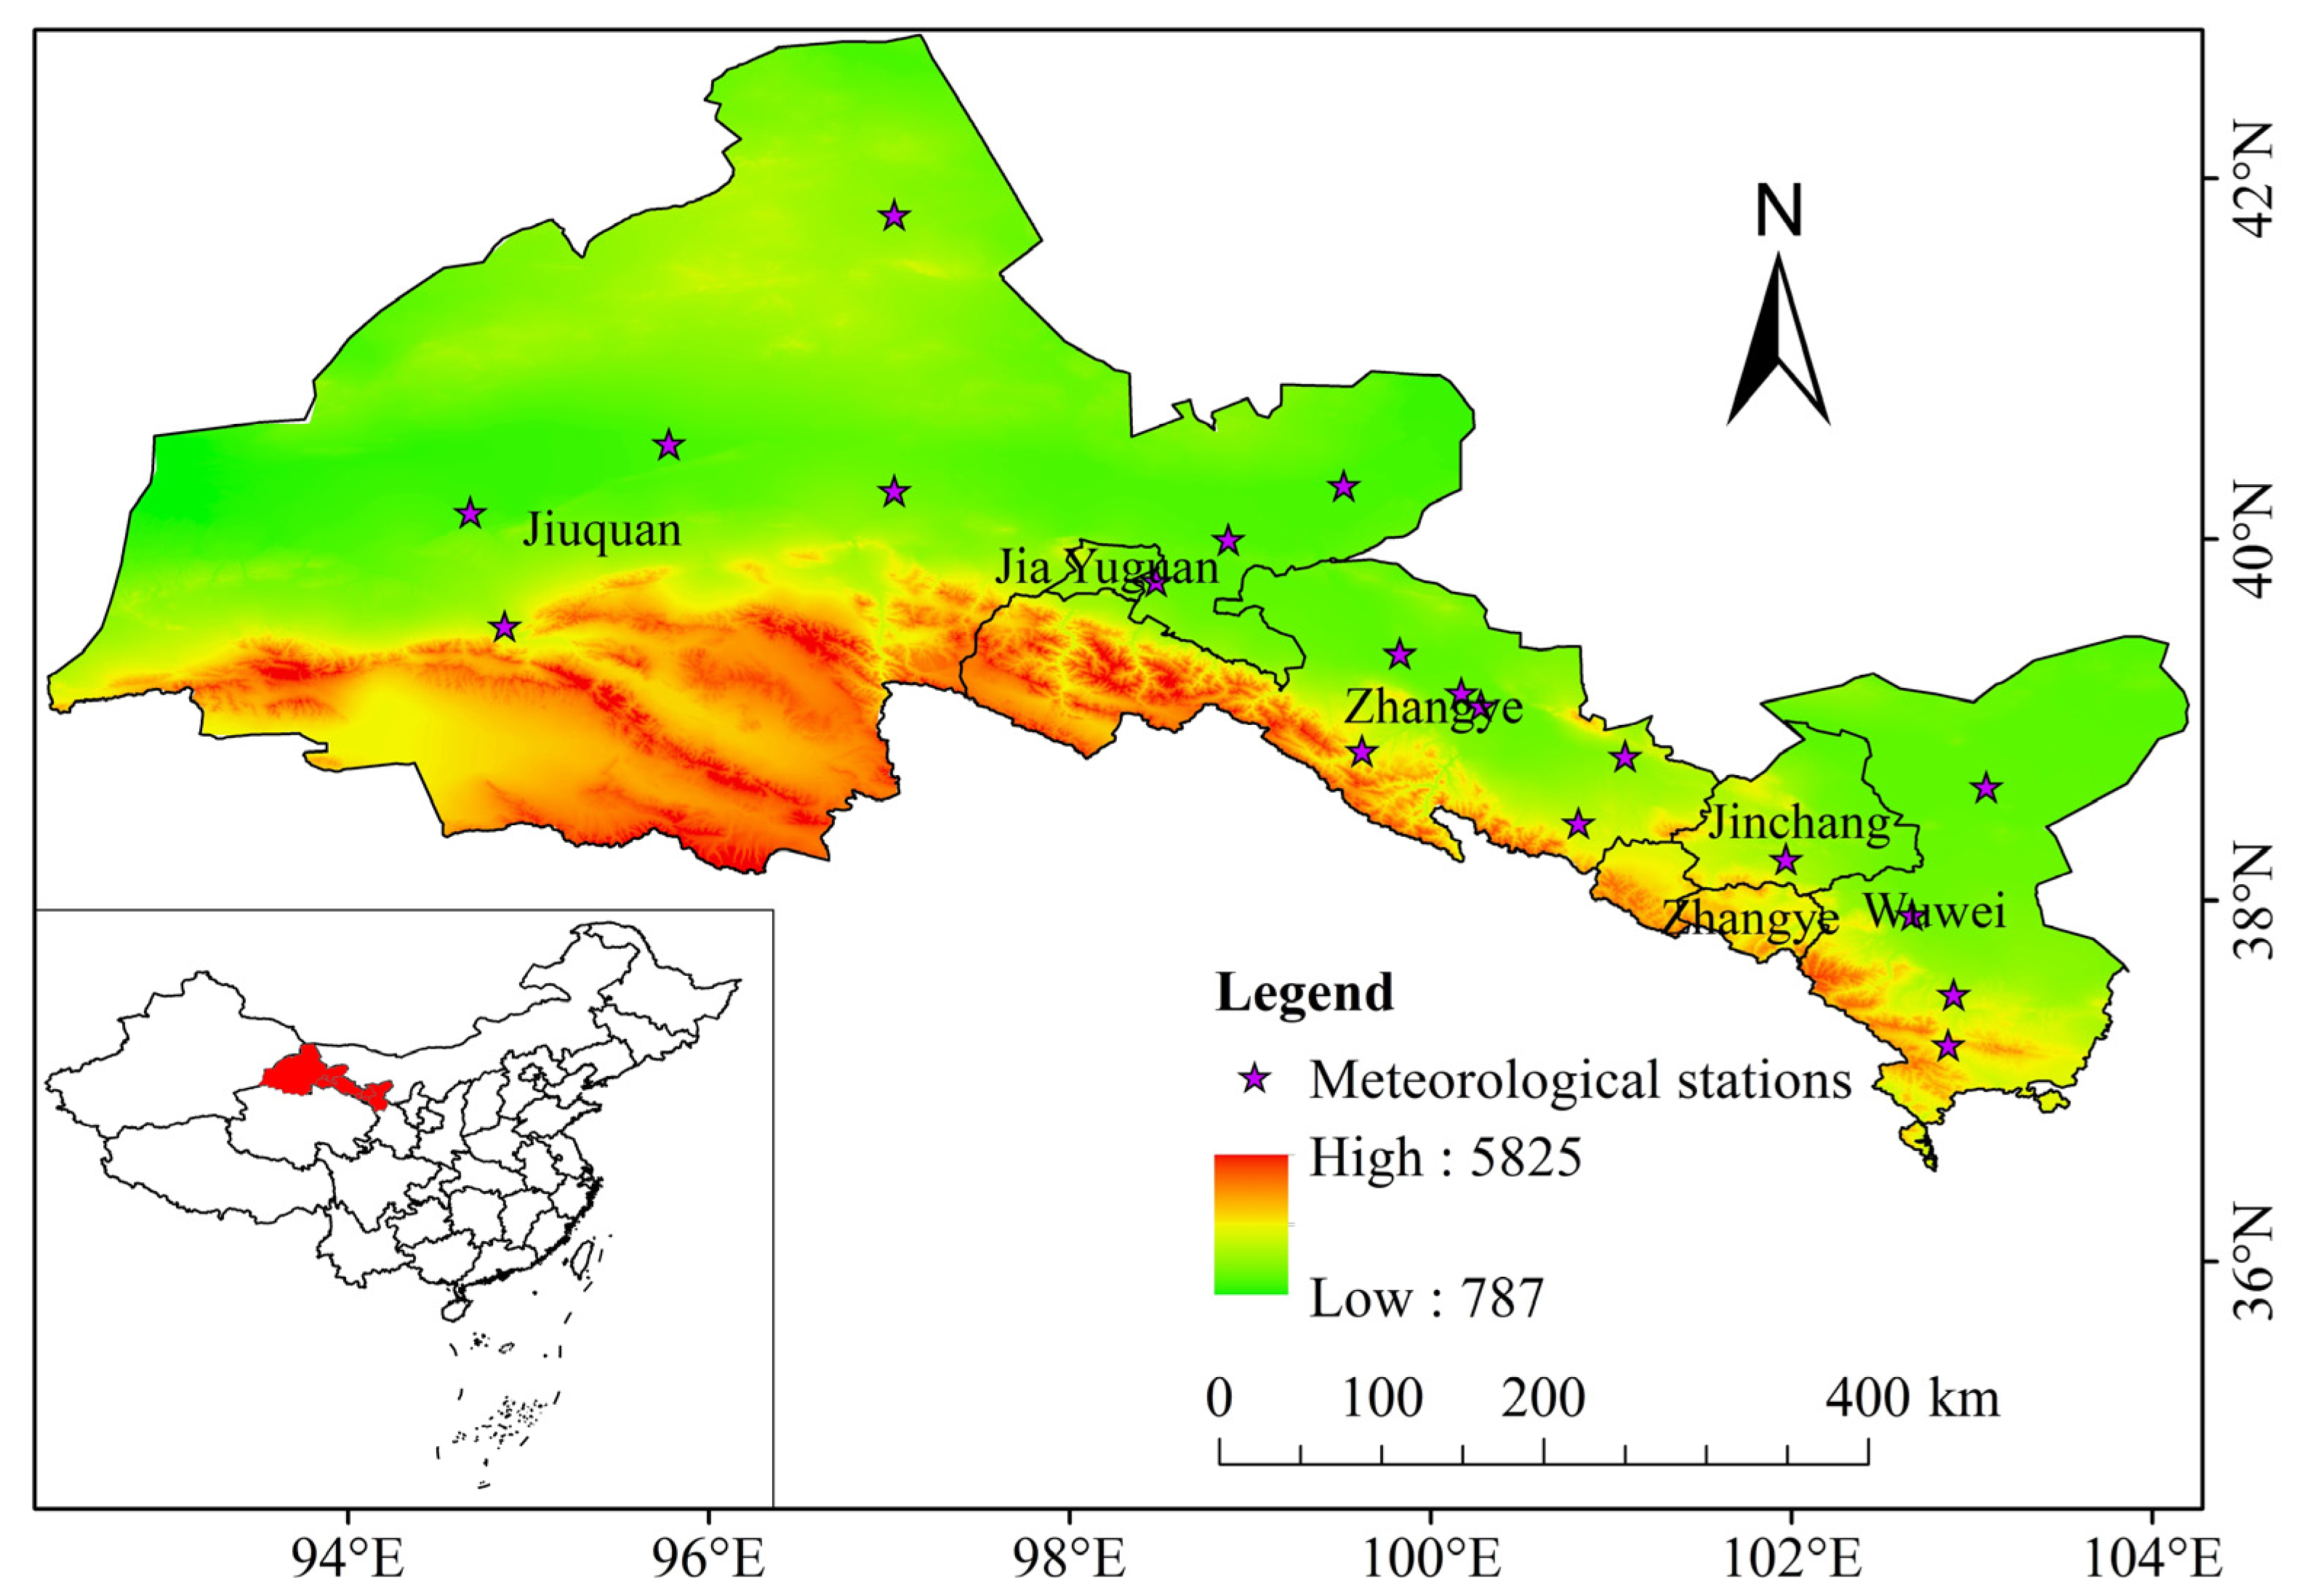
2.1. Overview of the Study Area

The Hexi Corridor, which has a length of 900 km and width of 100 km (Figure 1), is located in the arid region of northwestern China. It is bordered by Wushaoling to the east, the Jade Gate to the west, the Qilian and Altun mountains to the south, and the Mazongshan, Heli, and Longshou mountains to the north. Owing to its temperate continental climate, annual precipitation is in the range of 40–300 mm, and annual temperature is in the range of 6.2–9.0 °C. It should be noted that annual evaporation exceeds 1500 mm in most areas. The land use types in this region include farmland, forest, grassland, desert, water bodies, snow or glaciers, and residential land.

2.2. Data Sources

This study used 30-m spatial resolution Landsat5/TM data acquired in 2000, Landsat8/OLI data acquired in 2020, and MOD13A3 data acquired during 2000–2020, which were sourced from both the Aerospace Information Research Institute of the Chinese Academy of Sciences (www.aircas.cas.cn, accessed on 1 February 2021) and the National Aeronautics and Space Administration (www.nasa.gov, accessed on 1 February 2021). Additionally, 1-km spatial resolution PANDA data acquired during 2000–2020 were provided by the National Tibetan Plateau Data Center (http://data.tpdc.ac.cn, accessed on 1 May 2021).
To analyze the regional climate change, daily temperature and precipitation data recorded during 2000–2020, at 19 meteorological stations in the Hexi Corridor, were obtained from the Gansu Meteorological Bureau (http://cdc.cma.gov.cn/, accessed on 1 February 2021).
Digital elevation model data with a 30-m spatial resolution (ASTER GDEM V3) were sourced from the Geospatial Data Cloud (http://www.gscloud.cn/, accessed on 1 May 2021), which is a product of jointly developed by Japan’s METI and US NASA.

2.3. Research Methods

The data processing and analysis flow are displayed in Figure 2.

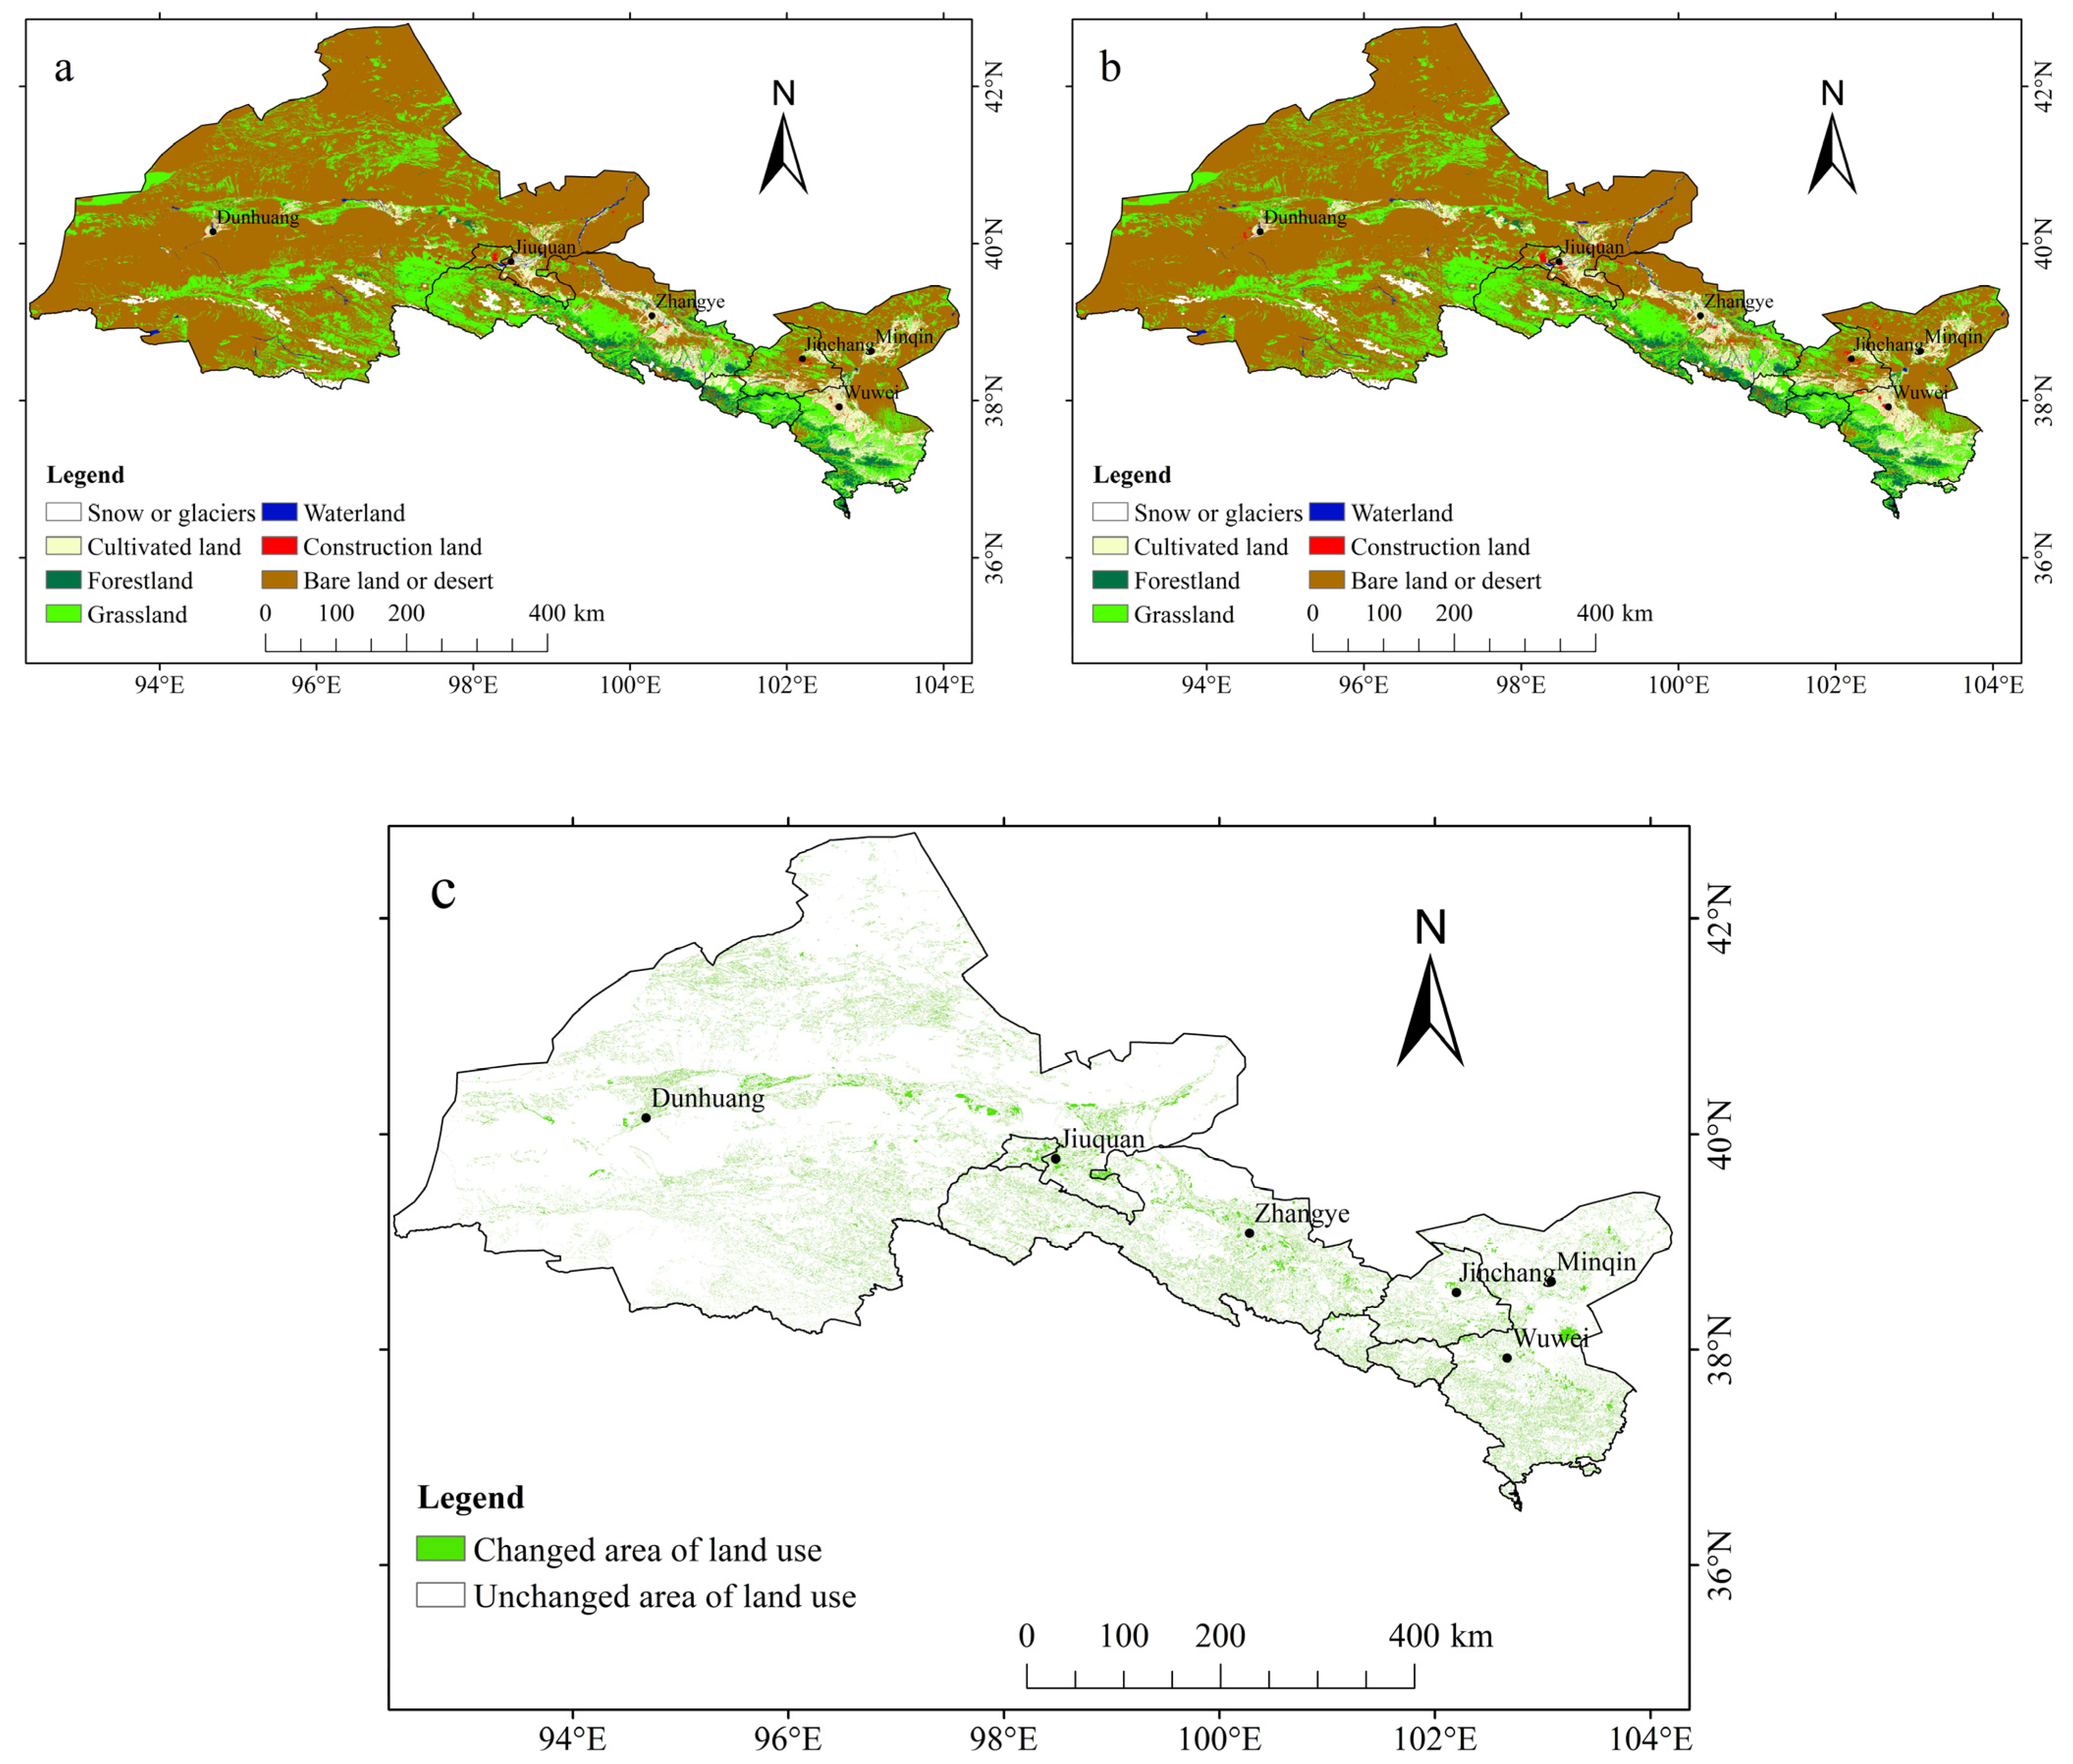
2.3.1. Analysis of Land Use Types

Classification of the land use in the Hexi Corridor was performed on the basis of the Landsat5/TM, Landsat8/OLI, and digital elevation model data. The original images were first preprocessed, by means of orthophoto correction, geometric correction, radiometric calibration, atmospheric correction, mosaic and clipping, cloud removal, and shadow processing. Generally, machine-learning approaches, hybrid methods, fuzzy theory, and other methods were the means of obtaining land use information. On the basis of the landscape classification system, supervised classification and manual correction were used to categorize the land use in the Hexi Corridor during 2000–2020 into the following types: farmland, forest, grassland, residential land, bare land or desert, water bodies, and snow or glaciers. Three hundred random samples were extracted to validate the classification of two different images, whose interpretation matched reality, with total accuracies and Kappa coefficients of 87.67% and 0.857 in 2000, and 89.33% and 0.872 in 2020.
A transition matrix can depict in detail the spatial structure and transformation direction of different land use types for different time sequences. This facilitates an accurate understanding of the direction of change of the type, structure, and distribution ratio of land use [15]. The land use classification of the Hexi Corridor during 2000–2020 underwent data fusion, and then an intersection analysis was performed to obtain the transition data for each land use type, to create a land type transition matrix of the overlapping areas.

2.3.2. Index of Landscape Pattern Indexes

To investigate the changes of landscape pattern over the past 21 years, number of patches (NP), mean patch area (AREA), landscape shape index (LSI), aggregation index (AI), Shannon’s diversity index (SHDI), and contagion index (CONTAG) were calculated [16].

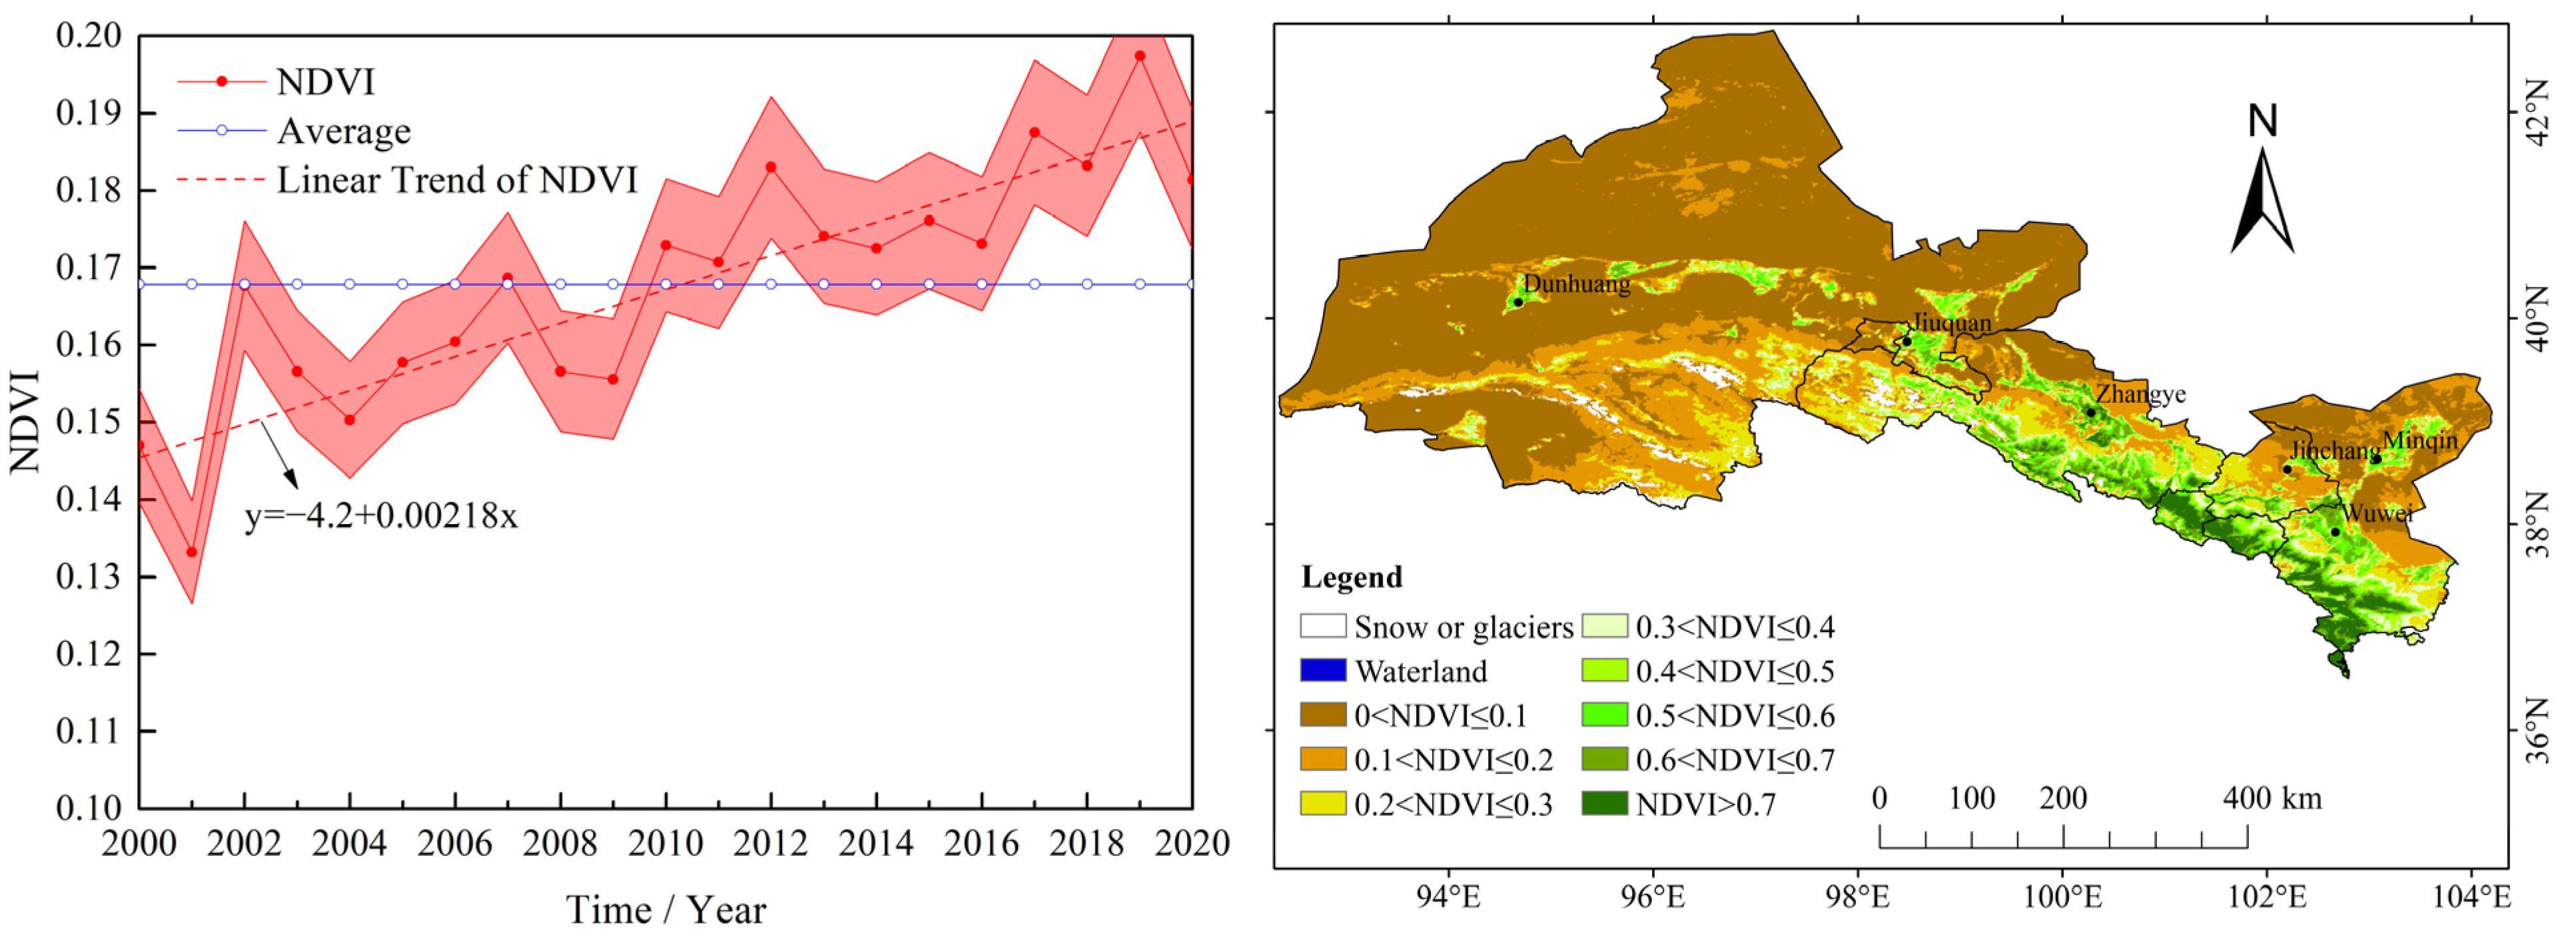
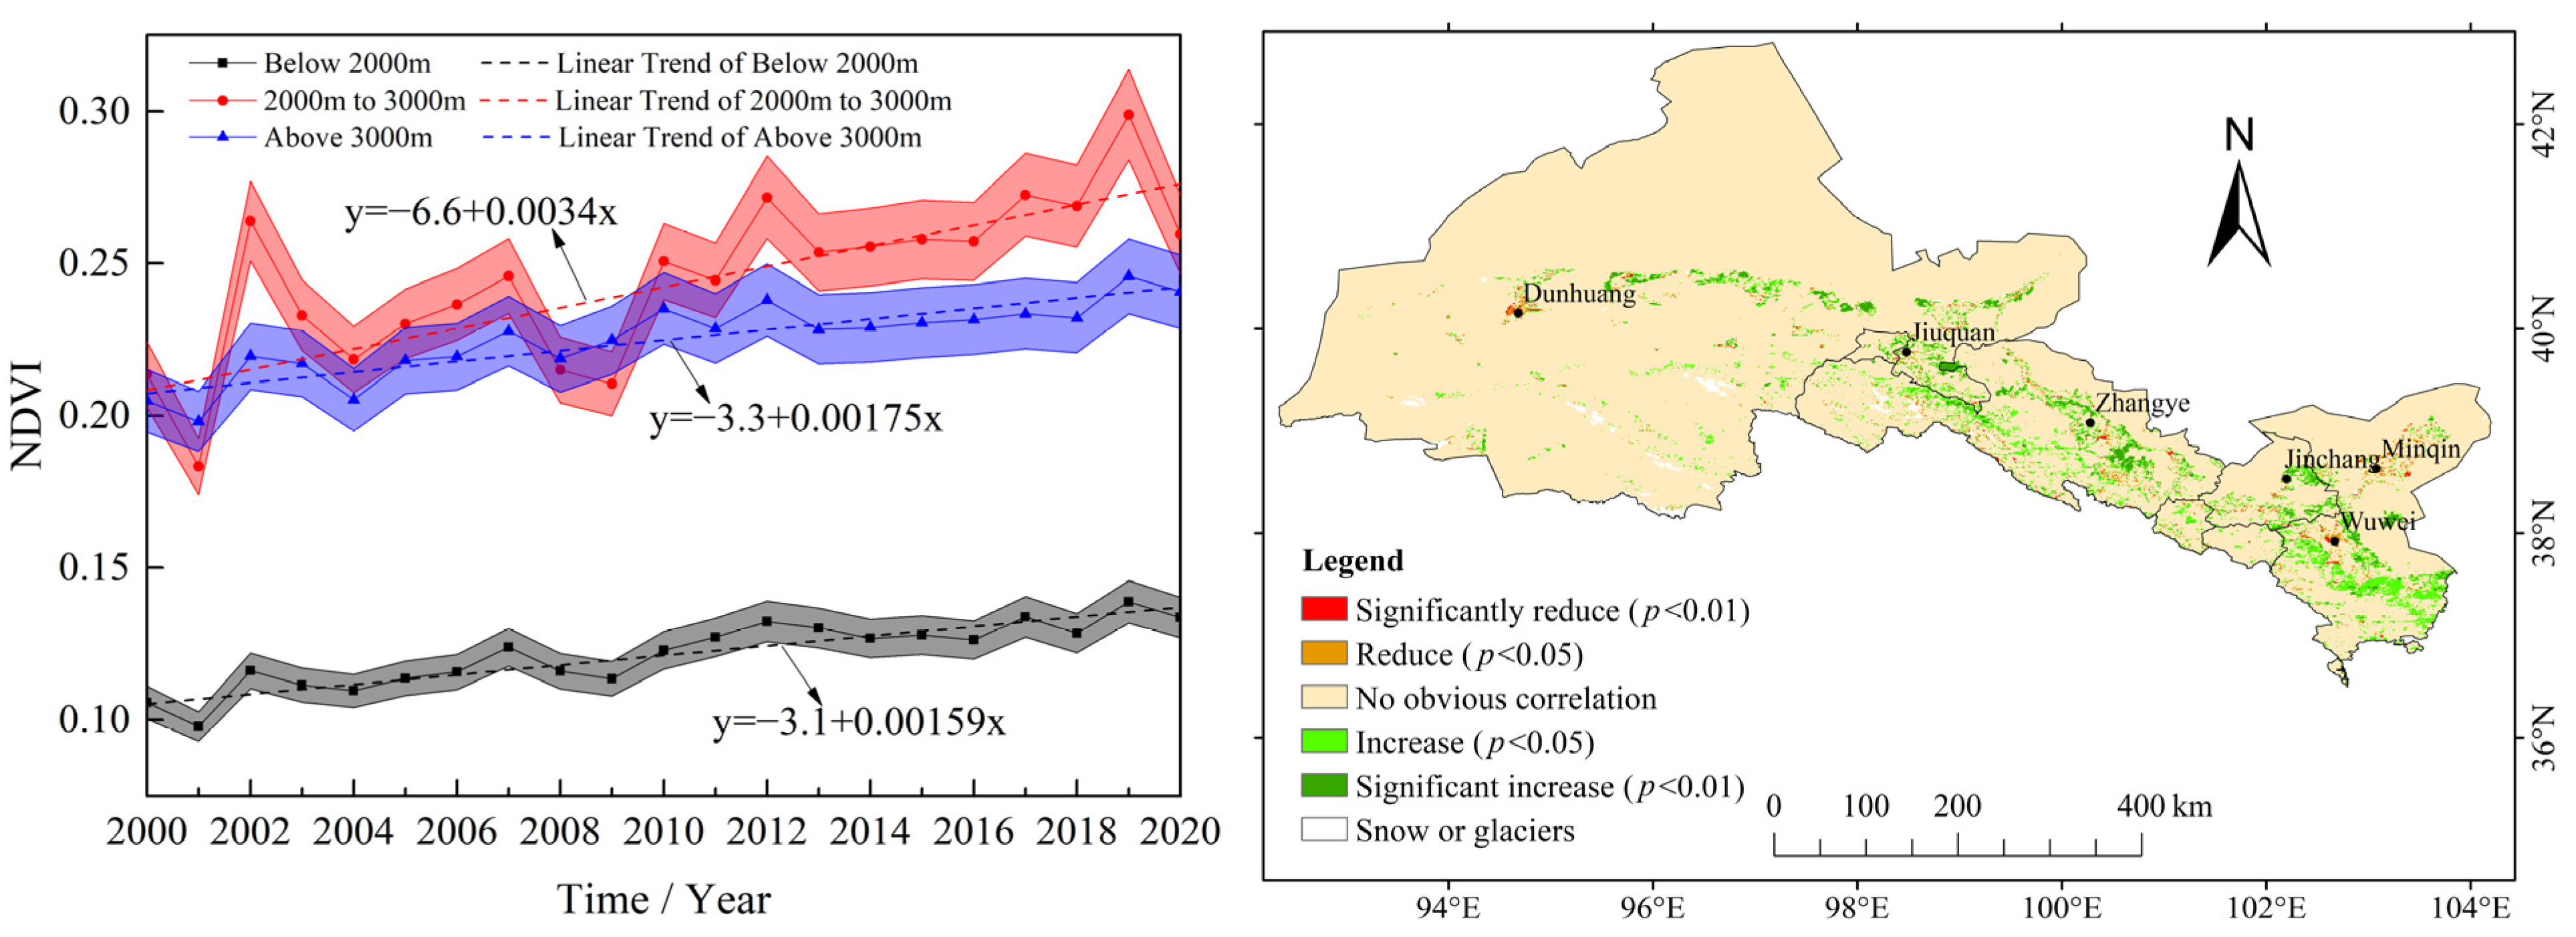
2.3.3. NDVI Change Trend Analysis

The maximum value composite method was used to maximize the bimonthly synthetic standard vegetation index, and to obtain annual normalized difference vegetation indexes (NDVIs). Then, following removal of zero and negative values, the annual NDVIs for different vegetation types were obtained by overlaying vegetation maps.
A linear regression analysis was conducted, to simulate the spatial variation of the annual NDVIs for the different vegetation types in the target area [17,18]. The calculation formula can be expressed as follows:
θ s l o p e = n × j = 1 n j × N D V I j j = 1 n j j = 1 n N D V I n × j = 1 n j 2 ( j = 1 n j ) 2
where n refers to the cumulative number of monitored years, NDVIj is the NDVI per year in year j, and θslope signifies the slope of the trend line. A value of θslope > 0 (θslope < 0) indicates that the trend of the NDVI change over n years is increasing (decreasing).
The Theil–Sen Median and Mann–Kendall test were combined to perform a long-term sequence analysis of vegetation change [19,20,21]. The Mann–Kendall test has been effectively applied in temporal sequence analyses in the fields of hydrology and meteorology. The Theil–Sen median can be used to assess whether temporal sequence data show an upward or downward trend [22,23]. The median of the slope in n (n − 1)/2 data combinations was calculated in the trend analysis. The calculation formula can be expressed as follows:
S N D V I = M e d i a n     N D V I j   N D V I i j i   ,
where 2000 ≤ i < j ≤ 2020. A value of SNDVI > 0 (SNDVI < 0) indicates that the NDVI is increasing (decreasing).
When an NDVI is tested using the Mann–Kendall test, the NDVI of a certain temporal sequence is regarded as a set of independently distributed sample data, and parameter Z serves as the attenuation index of the NDVI pixel. The calculation formula can be expressed as follows:
Z = { S 1 s ( S ) ,   S > 0   0 ,   S = 0 S + 1 s ( S ) ,   S < 0 ,
S = j = 1 n 1 i = j + 1 n S g n ( N D V I j N D V I i ) ,
S g n ( N D V I j N D V I i ) = {   1 ,     N D V I j N D V I i > 0   0 ,     N D V I j N D V I i = 0 ,   1 ,   N D V I j N D V I i < 0
S ( s ) = n ( n 1 ) ( 2 n + 5 ) 18 .
In Equations (3)–(6), NDVIi and NDVIj represent the NDVI for years i and j, respectively, n represents the length of the time sequence, and Sgn is a symbolic function. The value range of statistic Z is [−∞, ∞]. At a given significance level α, values of |Z| > u1−α/2 indicate significant change in the studied sequence at the α level. u is a statistic. Here, Z = ±2.58 is the significance level of α = 0.01, Z = ±0.96 is the significance level of α = 0.05, and Z = ±1.65 is the significance level of α = 0.10. In this study, a significance level of α = 0.05 was taken to assess the significance of the transformation trend of the NDVI time sequence.

2.3.4. Correlation Analysis

The correlation coefficient between the NDVIs and the climate factors based on a pixel was calculated, as follows:
R x y = i = 1 n ( x i x ¯ ) ( y i y ¯ ) i = 1 n ( x i x ¯ ) 2 · i = 1 n ( y i y ) 2 ,
where variable i represents the annual serial number, n is assigned the value of 21, xi represents NDVI data for the i-th year, yi is the climate factor for the i-th year, x ¯ and y ¯ are the mean values of variables x and y, respectively, and Rxy is the correlation coefficient between the NDVI and the climate factors. The Mann–Kendall test was used to assess the significance of Rxy and to determine its positive and negative correlation thresholds. The analysis was based on the correlation between the annual NDVI, precipitation, and temperature of each pixel.

3. Results and Analysis

3.1. Land Use and Land Cover Change Analysis

As shown in Figure 3, during the study period, snow cover and glaciers were primarily concentrated in high-elevation regions (>3500 m) in the Qilian Mountains. Water bodies included three inland rivers and a number of reservoirs. Forest mainly occupied areas at elevations of 2300–3300 m in the Qilian Mountains. Farmland was mainly distributed in the surroundings of the middle and lower reaches of the rivers. Grassland was divided into natural grassland and artificially planted grassland; the former was located primarily in upstream regions, while the latter was located in middle and lower parts of the river basins. Bare land or desert land covered the largest area in the Hexi Corridor. From 2000 to 2020, the area of land use change was 6.87% of total area.
Table 1 presents a transformation matrix of land use change in the Hexi Corridor from 2000 to 2020, showing the percentage of the area occupied by each land use type. In 2000, the areas of bare land or desert, grassland, farmland, and forest accounted for 68.08%, 21.60%, 5.75%, and 3.05% of the total area, respectively, whereas the area of water bodies, residential land, and snow or glaciers accounted for 0.59%, 0.47%, and 0.46% of the total area, respectively (Table 1). In comparison with 2000, the areas of bare land or desert, grassland, forest, and snow or glaciers in 2020 had decreased to 67.28%, 21.50%, 3.04%, and 0.45% of the total area, respectively; whereas the areas of farmland, residential land, and water bodies had increased to 6.40%, 0.68%, and 0.64% of the total area, respectively. The increases in the area of farmland and residential land represent changes of 0.65% and 0.21%, respectively, whereas the decrease in the area of bare land or desert represents a change of 0.8%. Over the past 21 years, 1.73% of the total area of the Hexi Corridor has been converted from bare land or desert to grassland, while 1.69% of the total area has been converted from grassland to bare land or desert, 0.64% of the total area has been converted from bare land or desert to farmland, and 0.17% of the total area has been converted from farmland to bare land or desert. The interconversion between bare land or desert and forest was equivalent.
As shown in Table 2, the total NP increased by 15.86, but AREA decreased by 13.69%. Taken together, considering the increase of LSI and SHDI, and the decrease of AI and CONTAG, it can be concluded that the connectivity of different landscape patches decreased, indicating an obvious landscape fragmentation.

3.2. Characteristics of Vegetation Patterns and Analysis of Vegetation Dynamics in the Hexi Corridor

Given that the NDVI can reflect the overall condition of regional vegetation, the spatiotemporal distributions of annual maximum NDVIs during 2000–2020 were analyzed (Figure 4). The results ranged from 0 to 0.859, and the average value over the 21-year study period was 0.168. Overall, the annual maximum NDVIs increased with time, and the minimum and maximum values appeared in 2001 and 2019, respectively. In 2010, the annual NDVI increased to the mean state during 2000–2020, indicating improved conditions for vegetation growth in the Hexi Corridor. However, clear regional differences were evident. The highest NDVI values were distributed in the southeast, and the lowest values were found in the northwest. The highest annual average and maximum NDVI values were found in the Qilian Mountains in the southeast of the Hexi Corridor, while the lowest annual average and maximum NDVI values were found in the desert of Jiuquan, which might reflect climatic influences, especially that of precipitation.
The land use of regions with higher annual average and maximum NDVI values mainly comprised forest, grassland, and farmland, whereas that of the areas with lower NDVI values was mainly desert vegetation. Over the 21-year study period, the average NDVI of forest, grassland, farmland, bare land, and desert was 0.618, 0.486, 0.515, and 0.112, respectively, indicating that the environment for vegetation growth was better in forest, farmland, and grassland areas than in desert areas.

3.3. Quantitative Analysis of Driving Factors of Interannual Variation of NDVI in the Hexi Corridor

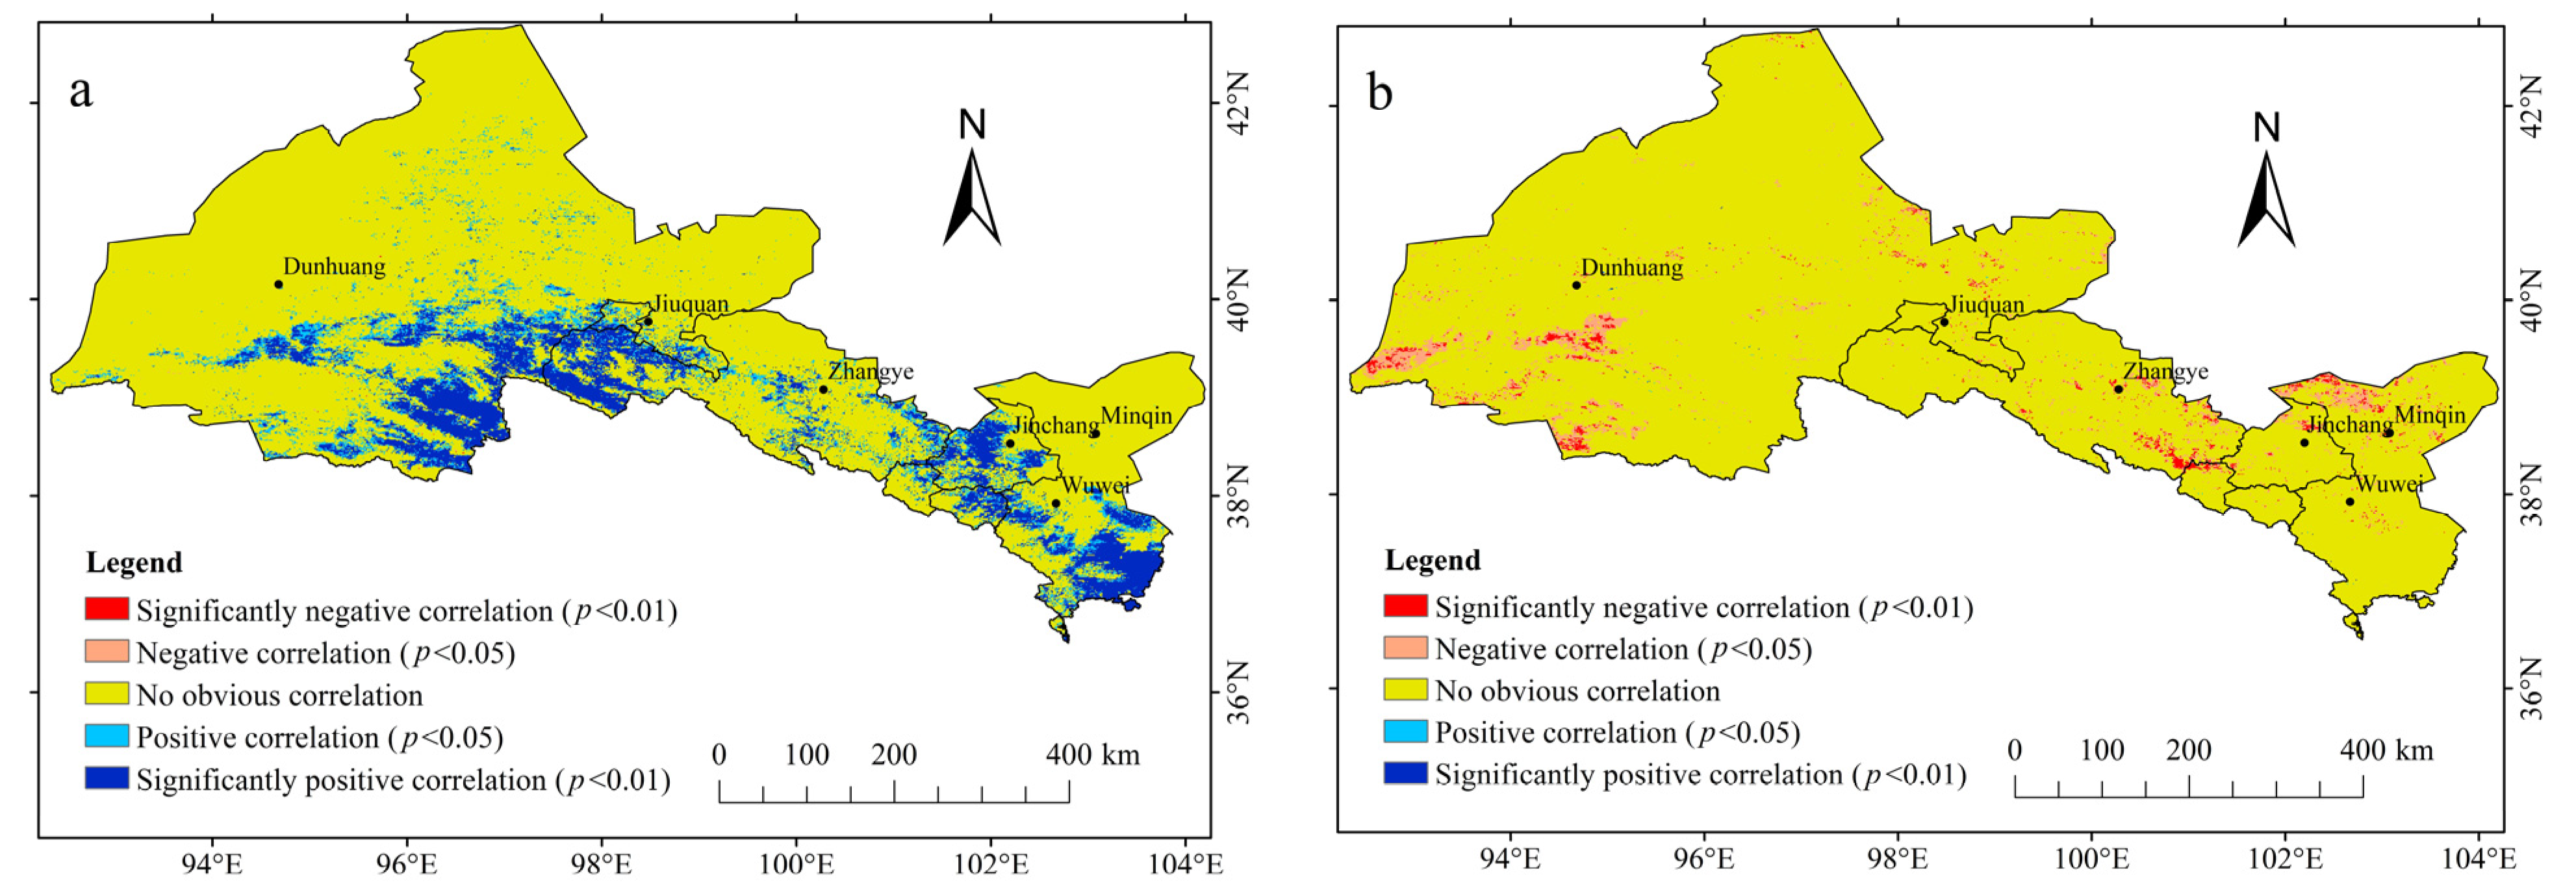
3.3.1. Spatial Patterns of Climatic Effects on Vegetation Changes

The meteorological data were gridded using multivariate regression analysis and Kriging interpolation [24], then used to calculate the correlation with NDVI.
As shown in Figure 5a, except for bare land or desert areas, there was positive correlation between the NDVI and precipitation. Specifically, 41.36% of oasis vegetation areas were correlated positively (p < 0.05), of which 13.02% was significant at the 0.01 level. The areas of positive correlation included grassland (79.21%), farmland (12.82%), and forest (4.06%), distributed mainly in the south of Wuwei and Jiuquan counties, to the west of Jinchang, and in the Qilian Mountains. A potential reason for this is that the increasing growth of farmland and grassland vegetation in this area, together with the amount of precipitation, had a substantial impact on the regional NDVI. Only 0.03% of areas had a negative correlation.
In terms of the temperature effect (Figure 5b), 5.38% of oasis vegetation areas were correlated negatively (p < 0.05), of which 1.65% was significant at the 0.01 level. The areas of negative correlation were bare land and desert (53.23%), grassland (29.2%), and farmland (16.76%); mainly distributed in the northwest of Minqin, the southeast of Zhangye, and the southwest of Jiuquan. This demonstrated that the vegetation change over the entire region was affected more by precipitation than by temperature.

3.3.2. Effects of Topographic Factors on Spatial Patterns of Vegetation Changes

The changes of vegetation at the different elevations during 2000–2020 were discussed based on DEM data. Overall, the NDVI presented an upward trend, but with obvious spatial heterogeneity (Figure 6). For 5.66% of the total area, the NDVI increased significantly (p < 0.05), of which 1.85% was significant at the 0.01 level. For 1.1% of the total area, the NDVI decreased significantly (p < 0.05), of which 0.21% was significant at the 0.01 level. Generally, the NDVI increased at the edges of the Hexi Corridor oases, while it decreased in southern parts of the city of Dunhuang, central parts of the city of Zhangye, and central parts of Wuwei and Minqin counties. As for the analysis of land use type, 55.65% and 33.79% of the increasing NDVI areas were farmland and planted grassland, while 73.05% and 13.84% of the decreasing NDVI areas were farmland and building land. The changes to NDVI were in flat areas with >3000 m and <2000 m, but fluctuated greatly in the anthropic area from 2000 to 3000 m. Overall, this was mainly influenced by human activities.

4. Discussion

4.1. Effects of Climatic Factors on Vegetation Growth

Vegetation growth was found to be strongly correlated with climatic factors, and their interaction was the main focus, regarding global climate change [25,26,27]. A normalized difference vegetation index (NDVI) could be used to monitor and estimate vegetation activities over different spatiotemporal scales, without damaging or altering vegetation [28]. Considering the differences in the responses of vegetation to climate variability under various eco-environmental conditions [29], in the Hexi Corridor, the response of the NDVI to climate change exhibited a large disparity spatially, especially for different vegetation types. In this study, grassland and farmland showed a more obvious response than other vegetation types to changes in precipitation, consistent with the results of other studies in this area [30,31]. A negative impact of temperature on vegetation growth mainly occurred in relation to bare land and desert, as well as marginal artificial grassland, attributable to the increasing evaporation associated with warming [32].

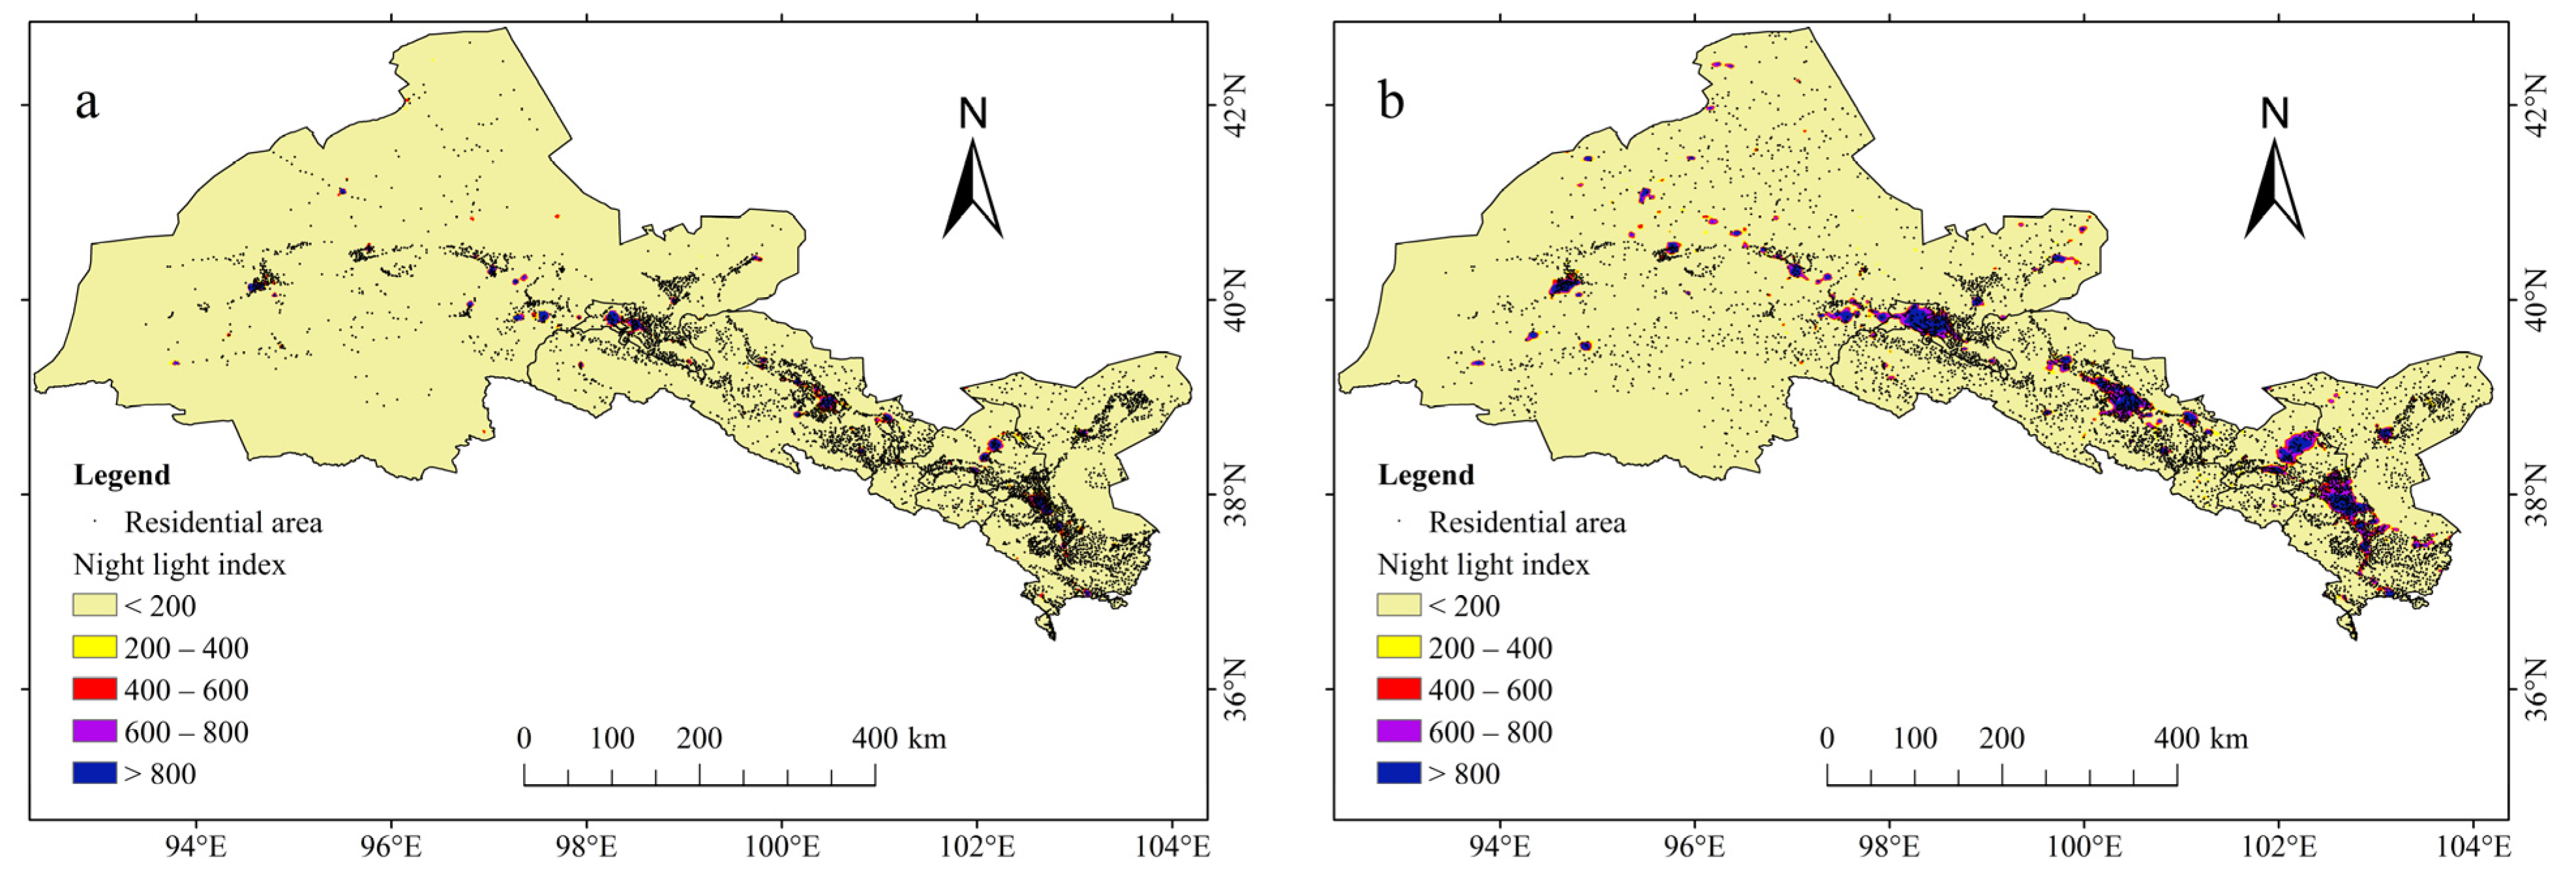
4.2. Effects of Human Activates on Vegetation Growth

The spatiotemporal change of land use in the Hexi Corridor was found to be closely related to local population growth and economic development. The area of artificial oases was shown to be positively correlated with population number in [33]. According to the data of the Gansu Statistical Yearbook, the figures for the permanent population and settlement changed from 4.66 million with a settlement of 5641 in 2000, to 4.91 million with settlement of 6864 in 2020; while the GDP changed from 25.68 billion to 217.91 billion in the oases of the Hexi Corridor. Meanwhile, the night light index was also increased from 12.62 to 49.5 (Figure 7). However, human factors, such as population changes and increased cultivation of land, appear to have been stronger driving forces, which were directly responsible for the changes in desertification [10]. For example, areas of forest and grassland surrounding farmland were converted to farmland, to meet increasing demand, resulting in serious destruction of the ecological environment, such as soil loosening and increased wind erosion. One mitigation measure adopted to improve the ecological environment was the step-by-step return of farmland to forest, whilst maintaining forest–grassland conservation [34]. The change in forest area was affected by both human and natural factors, of which logging for new housing and overexploitation of groundwater resources were the main factors responsible for the 0.01% reduction in forest area [35]. Meanwhile, the 0.1% decrease in grassland area was primarily ascribed to overgrazing, owing to the annual increase of livestock supporting capacity and economic development needs (according to the Statistical Yearbook of Gansu Province, the livestock numbers in the Hexi Corridor increased from 9.29 million in 2000 to 14.65 million in 2020) [36]. This caused a series of environmental problems and destroyed regional biodiversity. Overgrazing has extensively degraded Chinese grasslands. A reduction in the stocking rate, of 30–50% below the district averages, is required to increase the profitability of livestock production and protect vital ecosystem services. Additionally, short-time exclusions from grazing in a degraded desert have great potential to restore vegetation and soil properties [37].
Further analysis of the spatial distribution of NDVI change associated with the different vegetation types indicated that vegetation (or crop) growth increased in grassland and farmland areas, was relatively stable in forest areas, but decreased slightly in bare land and desert areas. In other regions, vegetation growth exhibited no obvious changes. Under the background of global warming, the vegetation growth in the Hexi Corridor has increased, while the area of farmland, especially that involved in crop growth, has increased since 2007, because the high consumption of water for agricultural production in the middle and lower areas of the river basins has been effectively constrained by governmental control of water resources. Correspondingly, the downstream bare land and desert vegetation presented a slight increase during the study period.
Human activities have had a positive impact on vegetation productivity in the Hexi Corridor, mainly in the oasis areas, which primarily reflects artificial irrigation, fertilization, and other management measures [38]. Irrigation water productivity and food production should be improved through promoting water-saving irrigation technology, maintaining the current use of fertilization, agricultural films and agricultural pesticides, and improving the use efficiencies of agronomic inputs, instead of increasing their amount [39]. On the basis of vegetation change, PANDA night light data, and land use type, the relationship between the changes in oasis vegetation and human activities has been discussed. The results showed that the dynamic changes of oases in the Hexi Corridor were influenced mainly by agricultural activities, supplemented by the effects of natural factors, which is in accord with other similar regions [40,41,42,43].

5. Conclusions

Changes in land use and vegetation are the direct outcome of interactions between human activities and the natural environment. The spatial pattern of land use change represents the intensity and mode of the human–land relationships at different region scales. On the basis of the analysis of land use types in the Hexi Corridor, this study found that the area of certain land use types (i.e., bare land or desert, grassland, forest, and snow or glaciers) decreased from 2000 to 2020, while the areas of farmland, residential land, and water bodies increased.
Generally, vegetation growth improved continuously during 2000–2020; however, there were obvious regional differences, i.e., the highest (lowest) values of growth were found in the southeast (northwest) of the region. In the area of marked increasing NDVI, farm land and planted grass land were 55.65% and 33.79%, respectively. In the area of marked increasing NDVI, farm land and construction land were 73.05% and 13.84%, respectively. Vegetation changes at different elevations fluctuated more in the areas with frequent human activities.
Changes in vegetation were more affected by precipitation than by temperature; 41.36% of oasis change had a marked positive correlated with precipitation, while 5.38% of oasis change was negatively correlated with temperature. Based on the analysis of the statistics of the Gansu Statistical Yearbook, settlement numbers, and night light index, it was determined that human activities have gradually come to dominate the NDVI changes in farmland, residential land, and artificial grassland areas.
In China, a number of policies were implemented to improve the ecological environment in oases, whose effect was evaluated by means of remote sensing. The findings of this study highlight the great importance of enhancing the protection and management of existing areas of grassland and forest around bare land or desert areas, by means of both rational use of water resources, and strengthening awareness of ecological protection.

Author Contributions

W.D. and Y.J. conceived the idea and designed the research framework. Y.J. and J.W. discussed the content of the analysis part. J.C., Z.X. and W.S. carried out data collection and preprocessing. Y.J., W.S., C.W. and J.W. undertook data analysis and manuscript preparation. W.D., W.S., L.M. and X.C. contributed to manuscript refinement. All authors have read and agreed to the published version of the manuscript.

Funding

This work was jointly supported by the following research projects: supported by National Natural Science Foundation of China (42071018, 42101139); State Key Laboratory of Cryosphere Science, Northwest Institute of Eco-Environment and Resources, Chinese Academy Sciences (Grant Number: SKLCS-ZZ-2022); Innovation and Development Project of China Meteorological Administration (CXFZ2022J039); Natural Science Foundation of Gansu Province (20JR10RA453); State Key Laboratory of Frozen Soil Engineering (State Key Laboratory of Frozen Soil Engineering, SKLFSE202006), and Opening Foundation of Key Laboratory of Desert and Desertification (KLDD-2020-010).

Institutional Review Board Statement

Not applicable.

Informed Consent Statement

Informed consent was obtained from all subjects involved in the study.

Data Availability Statement

The data that support the findings of this study are available from the corresponding author upon reasonable request.

Conflicts of Interest

The authors declare no conflict of interest.

References

  1. Chen, X.; Luo, G.P. Researches and progress of oasis ecology in arid areas. Arid. Land Geogr. 2008, 31, 487–495. [Google Scholar]
  2. Li, W.D.; Li, Z.Z.; Wang, J.Q. Evaluation of oasis ecosystem risk by reliability theory in an arid area: A case study in the Shiyang River Basin, China. J. Environ. Sci. 2007, 19, 508–512. [Google Scholar] [CrossRef]
  3. Guo, N.; Wang, X.P.; Cai, D.H.; Qing, J.Z. Analyses on the vegetation index variation and its formation causes in the oases in northwest China recent 22 years. Arid. Zone Res. 2010, 27, 75–82. [Google Scholar] [CrossRef]
  4. Mu, G.J.; Liu, J.Q. An analysis of the oasis evolution and its control factors. Quat. Sci. 2000, 20, 539–546. [Google Scholar]
  5. Wang, J.F. Analysis on runoff variation in the Beida River Basin under the influence of climate change and human activities. J. Arid. Land Resour. Environ. 2019, 33, 86–91. [Google Scholar]
  6. Wang, X.Y.; Liu, S.Z.; Chen, X.S. Dynamic Changes and Driving Factors of Oasis in Hexi Corridor. J. Desert Res. 2019, 39, 212–219. [Google Scholar]
  7. Sun, Q.Q.; Zhang, P.; Jiao, X.; Han, W.; Sun, Y.; Sun, D. Identifying and understanding alternative states of dryland landscape: A hierarchical analysis of time series of fractional vegetation-soil nexuses in China’s Hexi Corridor. Landsc. Urban Plan. 2021, 215, 104225. [Google Scholar] [CrossRef]
  8. Li, X.J.; Bai, Y.P.; Li, M.; Ma, J.H. Analysis on spatiotemporal correlation between water resource change and ecological Environment in Hexi Corridor. Bull. Soil Water Conserv. 2019, 33, 86–91. [Google Scholar]
  9. Li, S.; Yan, C. Oasis evolution and human factors analysis in Hexi Corridor over the recent 20 years. J. Arid. Land Resour. Environ. 2013, 27, 92–98. [Google Scholar]
  10. Han, L.; Zhang, Z.; Qiang, Z.; Xin, W. Desertification assessments in the Hexi corridor of northern China’s Gansu Province by remote sensing. Nat. Hazards 2015, 75, 2715–2731. [Google Scholar] [CrossRef]
  11. Bai, J.; Wang, X.G.; Zhao, C.Z. Evaluation on the coordinated development ability of Eco economic system in Hexi Corridor oases. Arid. Zone Geogr. 2010, 33, 130–135. [Google Scholar]
  12. Gao, Z.R.; Liu, X.Y.; Yang, Q.H.; Ma, Y.D. Climate-environmental evolution in desert-oasis ecotone in the Hexi corridor. Arid. Zone Res. 2010, 27, 31–38. [Google Scholar] [CrossRef]
  13. Guan, Q.; Yang, L.; Pan, N.; Lin, J.; Xu, C.; Wang, F.; Liu, Z. Greening and Browning of the Hexi Corridor in Northwest China: Spatial Patterns and Responses to Climatic Variability and Anthropogenic Drivers. Remote Sens. 2018, 10, 1270. [Google Scholar] [CrossRef] [Green Version]
  14. Sun, P.; Gong, J.; Gao, Y.J.; Xie, Y.C.; Qian, D.W. Spatiotemporal change of oases and their landscape response in arid areas in Northwest China. Arid. Zone Res. 2014, 31, 355–361. [Google Scholar]
  15. Hu, G.Y.; Dong, Z.B.; Wei, Z. Spatial and temporal change of desertification land of Zoige Basin in recent 30 years and its cause analysis. Adv. Earth Sci. 2009, 24, 908–916. [Google Scholar]
  16. Wang, Z.; Huang, N.; Luo, L.; Li, X.; Ren, C.; Song, K.; Chen, J. Shrinkage and fragmentation of marshes in the West Songnen Plain, China, from 1954 to 2008 and its possible causes. Int. J. Appl. Earth Obs. Geoinf. 2011, 13, 477–486. [Google Scholar] [CrossRef]
  17. Stow, D.; Daeschner, S.; Hope, A. Variability of the seasonally integrated normalized difference vegetation index across the north slope of Alaska in the 1990s. Int. J. Remote Sens. 2003, 24, 1111–1117. [Google Scholar] [CrossRef]
  18. Song, Y.; Ma, M.G. Study on vegetation cover change in northwest china based on SPOT VEGETATION data. J. Desert Res. 2007, 27, 89–93. [Google Scholar]
  19. Gocic, M.; Trajkovic, S. Analysis of changes in meteorological variables using Mann-Kendall and Sen’s slope estimator statistical tests in Serbia. Glob. Planet. Chang. 2013, 100, 172–182. [Google Scholar] [CrossRef]
  20. Saikia, P.; Konwar, K. Analysis of Changes in Groundwater Levels Using Mann-Kendall and Sen’s Slope Estimator in Kamrup (M) District, Assam. In Geography in the 21st Century Emerging Issues and the Way Forward; Namya Press: New Delhi, India, 2020. [Google Scholar]
  21. Jiang, W.G.; Yuan, L.H.; Wang, W.J.; Cao, R.; Zhang, Y.F.; Shen, W.M. Spatiotemporal analysis of vegetation variation in the Yellow River Basin. Ecol. Indic. 2015, 51, 117–126. [Google Scholar] [CrossRef]
  22. Yue, S.; Pilon, P.; Cavadias, G. Power of the Mann Kendall and Spearman′s rho tests for detecting monotonic trends in hydrological series. J. Hydrol. 2002, 259, 254–271. [Google Scholar] [CrossRef]
  23. Fensholt, R.; Langanke, T.; Rasmussen, K.; Reenberg, A.; Prince, S.D.; Tucker, C.; Scholes, R.J.; Le, Q.B.; Bondeau, A.; Eastman, R.; et al. Greenness in semi-arid areas across the globe 1981-2007 an earth observing satellite-based analysis of trends and drivers. Remote Sens. Environ. 2012, 121, 144158. [Google Scholar] [CrossRef]
  24. Jiang, Y.; Huang, J. The temperature spatial distribution characteristics based on GIS technology in Gansu Province. J. Arid. Meteorol. 2013, 31, 206–211. [Google Scholar]
  25. Nemani, R.R.; Keeling, C.D.; Hashimoto, H.; Jolly, W.M.; Piper, S.C.; Tucker, C.J.; Myneni, R.B.; Running, S.W. Climate-driven increases in global terrestrial net primary production from 1982 to 1999. Science 2003, 300, 1560–1563. [Google Scholar] [CrossRef] [PubMed] [Green Version]
  26. Xu, H.M.; Gao, Q.Z.; Huang, Y.M.; Jia, H.K. Simulated the impact of climate change on net primary production in hilly area of Loess Plateau, China. Acta Ecol. Sin. 2006, 26, 2938–2947. [Google Scholar]
  27. Mu, S.J.; Li, J.L.; Zhou, W.; Yang, H.F.; Zhang, C.B.; Ju, W.M. Spatial-temporal distribution of net primary productivity and its relationship with climate factors in Inner Mongolia from 2001 to 2010. Acta Ecol. Sin. 2013, 33, 3752–3764. [Google Scholar]
  28. Chen, B.Z.; Xu, G.; Coops, N.C.; Ciais, P.; Innes, J.L.; Wang, G.Y.; Myneni, R.B.; Wang, T.L.; Krzyzanowski, J.; Li, Q.L. Changes in vegetation photosynthetic activity trends across the Asia-Pacific region over the last three decades. Remote Sens. Environ. 2014, 144, 28–41. [Google Scholar] [CrossRef]
  29. Hou, W.J.; Gao, J.B.; Wu, S.H.; Dai, E. Interannual variations in growing-season NDVI and its correlation with climate variables in the southwestern karst region of China. Remote Sens. 2015, 7, 11105–11124. [Google Scholar] [CrossRef] [Green Version]
  30. Pan, T.; Wu, S.H.; He, D.M.; Dai, E.F.; Liu, Y.J. Effects of longitudinal range-gorge terrain on the eco-geographical pattern in Southwest China. J. Geogr. Sci. 2012, 22, 825–842. [Google Scholar] [CrossRef]
  31. Dunkerley, D.L. Intra-event intermittency of rainfall: An analysis of the metrics of rain and no-rain periods. Hydrol. Processes 2015, 29, 3294–3305. [Google Scholar] [CrossRef]
  32. Li, C.; Zhu, T.; Zhou, M.; Yin, H.; Wang, Y.; Sun, H.; Cao, H.; Han, H. Temporal and spatial change of Net Primary Productivity of vegetation and its determinants in Hexi Corridor. Acta Ecol. Sin. 2021, 41, 1931–1943. [Google Scholar]
  33. Diao, W.; Zhao, Y.; Zhai, J.; Fan, H.E.; Sui, B.; Zhu, Y. Temporal Spatial Evolution and Driving Force Analysis of Minqin Oasis during 1987–2017. J. Irrig. Drain. 2019, 38, 106–113. [Google Scholar]
  34. Zhu, Z.Q.; Liu, L.M.; Zhang, J.L. Impact of grain for green project on landscape pattern in hilly loess region in Southern Ningxia: Landscape evolution process assessment of Zhong-zhuangcun small water shed in 1993–2005. Acta Ecol. Sin. 2010, 30, 146–154. [Google Scholar]
  35. Bai, F.; Li, W.P.; Li, Z.H. Analysis on the main causes resulting in vegetation degeneration in the Heihe River Basin. Arid. Zone Res. 2008, 25, 219–224. [Google Scholar] [CrossRef]
  36. Lan, Y.C.; Sun, B.M.; Ding, Y.J. Studies on ecological environment changes of Heihe River Basin and its influence factors. J. Arid. Land Resour. Environ. 2004, 18, 32–39. [Google Scholar]
  37. Zhang, Y.; Zhao, W. Vegetation and soil property response of short-time fencing in temperate desert of the Hexi Corridor, northwestern China. Catena 2015, 133, 43–51. [Google Scholar] [CrossRef]
  38. Yang, G.H.; Bao, A.M.; Chen, X.; Liu, H.L.; Huang, Y.; Dai, S.Y. Study of the vegetation cover change and its driving factors over Xinjiang during 1998–2007. Glaciol. Geocryol. 2009, 31, 436–445. [Google Scholar]
  39. Li, X.; Zhang, X.; Niu, J.; Tong, L.; Kang, S.; Du, T.; Li, S.; Ding, R. Irrigation water productivity is more influenced by agronomic practice factors than by climatic factors in Hexi Corridor, Northwest China. Sci. Rep. 2016, 6, 37971. [Google Scholar] [CrossRef] [Green Version]
  40. Wang, X.Y.; Chen, X.S.; Ding, Q.P.; Zhao, X.Y.; Wang, X.J.; Ma, Z.W.; Lian, J. Vegetation and soil environmental factor characteristics, and their relationship at different desertification stages: A case study in the Minqin desert-oasis ecotone. Acta Ecol. Sin. 2018, 38, 1569–1580. [Google Scholar]
  41. Wang, X.Y.; Lian, J.; Yang, X.P.; Zhao, X.Y.; Wang, X.J.; Ma, Z.W.; Gong, C.K.; Qu, H.; Wang, B. Variation in vegetation and its response to environmental factors in Maqu County. Acta Ecol. Sin. 2019, 39, 923–935. [Google Scholar]
  42. Simpson, R.W.; Petroeschevsky, A.; Lowe, I. An ecological footprint analysis for Australia. Aust. J. Environ. Manag. 2000, 7, 11–18. [Google Scholar] [CrossRef]
  43. Zhang, J.Y.; Li, Y.; Zhao, W.Z.; Shi, X. Tracking analysis on Changes of ecological patterns in Hexi Corridor region. Water Resour. Prot. 2015, 31, 5–10. [Google Scholar]
Figure 1. Location of meteorological stations and DEM information in the study area.
Diversity 14 00370 g001
Figure 2. Data processing and analysis flow chart.
Diversity 14 00370 g002
Figure 3. Land use in the Hexi Corridor: (a) 2000, (b) 2020 and (c) changed area.
Diversity 14 00370 g003
Figure 4. Spatiotemporal distribution of growing season NDVI during 2000–2020.
Diversity 14 00370 g004
Figure 5. Correlation analysis of NDVI and (a) precipitation and (b) temperature changes in the Hexi Corridor during 2000–2020.
Diversity 14 00370 g005
Figure 6. Trend of the NDVI in the Hexi Corridor during 2000–2020.
Diversity 14 00370 g006
Figure 7. Night light index and residential areas of the Hexi Corridor in (a) 2000 and (b) 2020.
Diversity 14 00370 g007
Table 1. Transfer matrix of land use types in the oases of the Hexi Corridor from 2000 to 2020.
Land TypesFarm LandForestGrasslandWater BodiesSnow or GlaciersResidential LandBare Land or DesertThe Total Area
Farm land5.050.060.500.030.000.120.646.40
Forest0.042.530.370.010.000.000.093.04
Grassland0.300.3619.060.050.000.011.7321.50
Water bodies0.030.010.050.460.000.000.090.64
Snow or glaciers0.000.000.000.000.400.000.050.45
Residential land0.160.000.040.000.000.320.170.68
Bare land or desert0.170.091.590.040.060.0265.3267.28
The total area5.753.0521.600.590.460.4768.08100
Table 2. Landscape pattern index of the entire Hexi Corridor.
YearNPAREALSIAISHDICONTAG
200060,7654.5492142.674298.03131.358777.6839
202070,4063.9263145.205997.99601.363477.5832
Publisher’s Note: MDPI stays neutral with regard to jurisdictional claims in published maps and institutional affiliations.

