
Mitochondrial Genomes of two Lycosa spiders (Araneae, Lycosidae): Genome Description and Phylogenetic Implications


The Co-Innovation Center for Sustainable Forestry in Southern China, College of Biology and the Environment, Nanjing Forestry University, Nanjing 210037, China
*
Author to whom correspondence should be addressed.
†
These authors contributed equally to this work.
Diversity 2022, 14(7), 538; https://0-doi-org.brum.beds.ac.uk/10.3390/d14070538
Submission received: 24 April 2022
/
Revised: 29 June 2022
/
Accepted: 2 July 2022
/
Published: 3 July 2022
(This article belongs to the Topic Arthropod Biodiversity: Ecological and Functional Aspects)
Abstract
:We sequenced the complete mitochondrial genomes of Lycosa shansia, and Lycosa singoriensis by combining Sanger and next-generation sequencing methods and analyzed the sequenced genomes in order to explore the phylogenetic placement and the mitogenome composition and evolution of these species. The mitochondrial genome of L. shansia was 14,638 bp, whereas that of L. singoriensis was 13,686 bp. The type of genes and direction of the coding strand present in the mitogenomes were the same as those in other species of Lycosoidea, including two ribosomal RNA genes (rRNAs), 22 transfer RNA genes (tRNAs), and 13 protein-coding genes (PCGs). The mitogenomes of the two species exhibited negative AT and positive GC skews. This indicated that the nucleotide compositions of the mitogenomes of L. singoriensis and L. shansia tended to be T and G. Both the mean and median values of Ka/Ks of ATP8 were the highest among the 13 protein-coding genes, indicating that it might have evolved more rapidly than the other protein-coding genes in both species. ATP8 may have undergone more relaxed selection constraints and accumulated more mutations. In addition, many tRNAs lacked T and D stem loops; a few had no acceptor stems. The assessed species were recovered nested within Lycosidae with high support. The present findings will be useful for future studies on the mitogenome evolution of spiders.
1. Introduction
Mitochondria are important energy-supplying organelles that provide ATP to organisms through oxidative phosphorylation and are closely related to the respiration process. They are present in most eukaryotic cells [1]. In general, the mitogenome of arthropods is a circular, double-stranded molecule, ranging in size from 14 to 20 kb, and typically containing a standard set of 13 protein-coding genes (PCGs), 2 ribosomal RNA genes (rRNAs), 22 transfer RNA genes (tRNAs), and 1 control region (CR), also called the A + T-rich region. Mitochondria have their own genetic material and genetic system and have become excellent targets for studying the origin and phylogeny of species owing to their high evolutionary rate, matrilineal inheritance, and ease of amplification [2,3].
In recent years, spider mitogenome components, such as COI, rRNAs, and tRNAs, have been sequenced and widely used in phylogenetic analyses [4,5,6,7]. However, these mitochondrial sequences are much shorter than the complete mitogenome sequences and typically have limited phylogenetic information [8,9]. Additional reliable datasets, such as complete mitogenome sequences, can make phylogenetic reconstruction more efficient [2,9,10]. In addition, researchers can better judge phylogenetic relationships through complete mitogenome sequences because they can provide information that is lacking in fragments, such as gene rearrangement, tRNA secondary structure [11], genetic code changes, replication, and transcriptional regulation patterns.
With the application of next-generation sequencing (NGS) technology, an increasing amount of mitogenome data have been obtained. However, the publication of animal mitogenomes in the National Center for Biotechnology Information (NCBI) database has mostly focused on fish, mammals, and birds. Information on highly diverse groups such as invertebrates is scarce [10]. Spiders are an example of such a group: with more than 50,105 species discovered to date the number of complete mitogenomes in GenBank is only 53 (https://www.ncbi.nlm.nih.gov, (accessed on 7 August 2021), representing only 28 of 129 families. Filling the gaps in their mitogenome sequences could help us better understand the phylogenetic relationships within Araneae [9,12].
Our study focused on two spider species belonging to the genus Lycosa. The spider genus Lycosa is one of the most species-rich genera within the Lycosidae [13,14]. They are wandering spiders that mostly live on forest grounds and are the major predators of agricultural pests [15]. The purpose of this study was to investigate the structure of the mitogenome of spiders of the Lycosidae family, including gene sequence, nucleotide composition, genome size, codon usage, gene overlap, tRNA secondary structure, and phylogenetic placement [16].
2. Materials and Methods
2.1. Sample Collection and DNA Extraction
The samples were collected from Zibo, Shandong (117.958° E, 36.640° N), and Urumqi, Xinjiang (87.501° E, 43.775° N). Individuals of L. shansia and L. singoriensis were identified morphologically. The experimental samples did not include endangered or protected species and were treated following animal welfare guidelines. Genomic DNA was extracted using DNAiso reagent (Takara, Beijing, China). All samples were stored in a cryogenic freezer at −80 °C in the Zoology Laboratory of Nanjing Forestry University.
2.2. Splicing and Annotation of Mitogenome Sequences
The library was constructed via end repair, A-tailing, adapter ligation, and PCR. The library of mitogenome DNA was sequenced using the Illumina platform (2 × 150 bp read pair) (Novogene, Beijing, China). The mitogenomes of Wadicosa fidelis (Accession: KP100666.1), Pardosa laura (Accession: KM272948.1), and L. shansia (Accession: MW776434.1 marked as unverified) were used as templates for the two Lycosa samples. Sequence contigs were assembled and trimmed using the medium sensitivity/fast option in the Geneious Prime 2021 software [17,18]. Consensus sequences were constructed in Geneious using a 99% base call threshold. The complete mitogenome of L. shansia was obtained while in L. singoriensis it was incomplete. To complete the mitochondrial sequences of L. singoriensis, PCR primers were designed (Table 1). Target fragments were amplified in a volume of 30 μL, including 1 μL template DNA, 15 μL 2 × Rapid Taq Master Mix (Vazyme, Nanjing, China), 0.5 μL of each primer, and 13 μL H2O. The PCR program included pre-denaturation at 95 °C for 3 min, denaturation at 95 °C for 15 s, 35 cycles of 50–60 °C for 15 s each, 72 °C for 2 min, and finally 72 °C for 10 min. PCR products were separated by electrophoresis on a 1.2% agarose gel and sent to TSINGKE Biological Technology (Nanjing, China) for Sanger sequencing. The mitogenome was assembled using the DNAStar v7.1. software (Madison, WI, USA).
MITOS WebServer (http://mitos.bioinf.uni-leipzig.de/index.py, (accessed on 30 August 2021) [19] was used for sequence annotation. The positions of the start and stop codons or intron/exon junctions of the PCGs were manually corrected using BLAST with NCBI non-redundant protein sequence database. To determine the RNA secondary structure, we compared the predictions of the MITOS WebServetRNAs cancan-SE 2.0 [20,21,22], and ARWE [23], based on the cloverleaf secondary structure information. For undetectable tRNAs, we used the tRNA sequences of other spiders in GenBank to detect the location and boundary of each tRNA, and manually checked the anticodon arm motifs. Two rRNAs were predicted by comparison with the reference mitogenome and their boundaries were determined using adjacent tRNAs. A map of the mitogenome was constructed using CGView [24].
2.3. Sequence Analysis
Using MEGA v7.0 [25], we calculated the base composition and relative synonymous codon use (RSCU) of the mitogenomes of the two Lycosa species and calculated the nucleotide composition. The relative numbers of A to T (AT-skew) and G to C (GC-skew) were calculated using the following formulas: AT-skew = (A − T)/(A + T) and GC skew = (G − C)/(G + C) [26], which were used to measure the differences in nucleotide composition between genes. The rate of non-synonymous substitutions (Ka), rate of synonymous substitutions (Ks), and the Ka/Ks ratio were generated graphically using DnaSP5 [27]. A tandem repeat finder (http://tandem.bu.edu/trf/trf.html, (accessed on 10 September 2021) was used to predict tandem repeat sequences in the CR.
2.4. Phylogenetic Analysis
To study the phylogenetic placement of the Lycosa species, we constructed a phylogenetic tree based on a concatenated set of base sequences of 13 PCGs and two rRNAs from the 53 spider mitogenomes available at NCBI GenBank and the two new mitogenomes obtained in this study (Table 2). We used PhyloSuitev1.2.1 [28] to analyze the phylogeny of the dataset using the maximum likelihood (ML) and Bayesian methods (BI). The model (GTR + F + R6) was selected automatically using ModelFinder wrapped in IQ-TREE [29]. An alternate ML tree was also constructed with 5000 bootstraps using IQ-TREE [30,31]. We also used ModelFinder to select the best partition model for BI analysis. The selected parameters, GTR + F + I + G4, were fed to MrBayes, allowing four chains to run simultaneously, two chains running independently for two million generations, sampling trees every 1000 generations, and a burn-in of 25% tree.
3. Results and Discussion
3.1. Mitogenome Composition
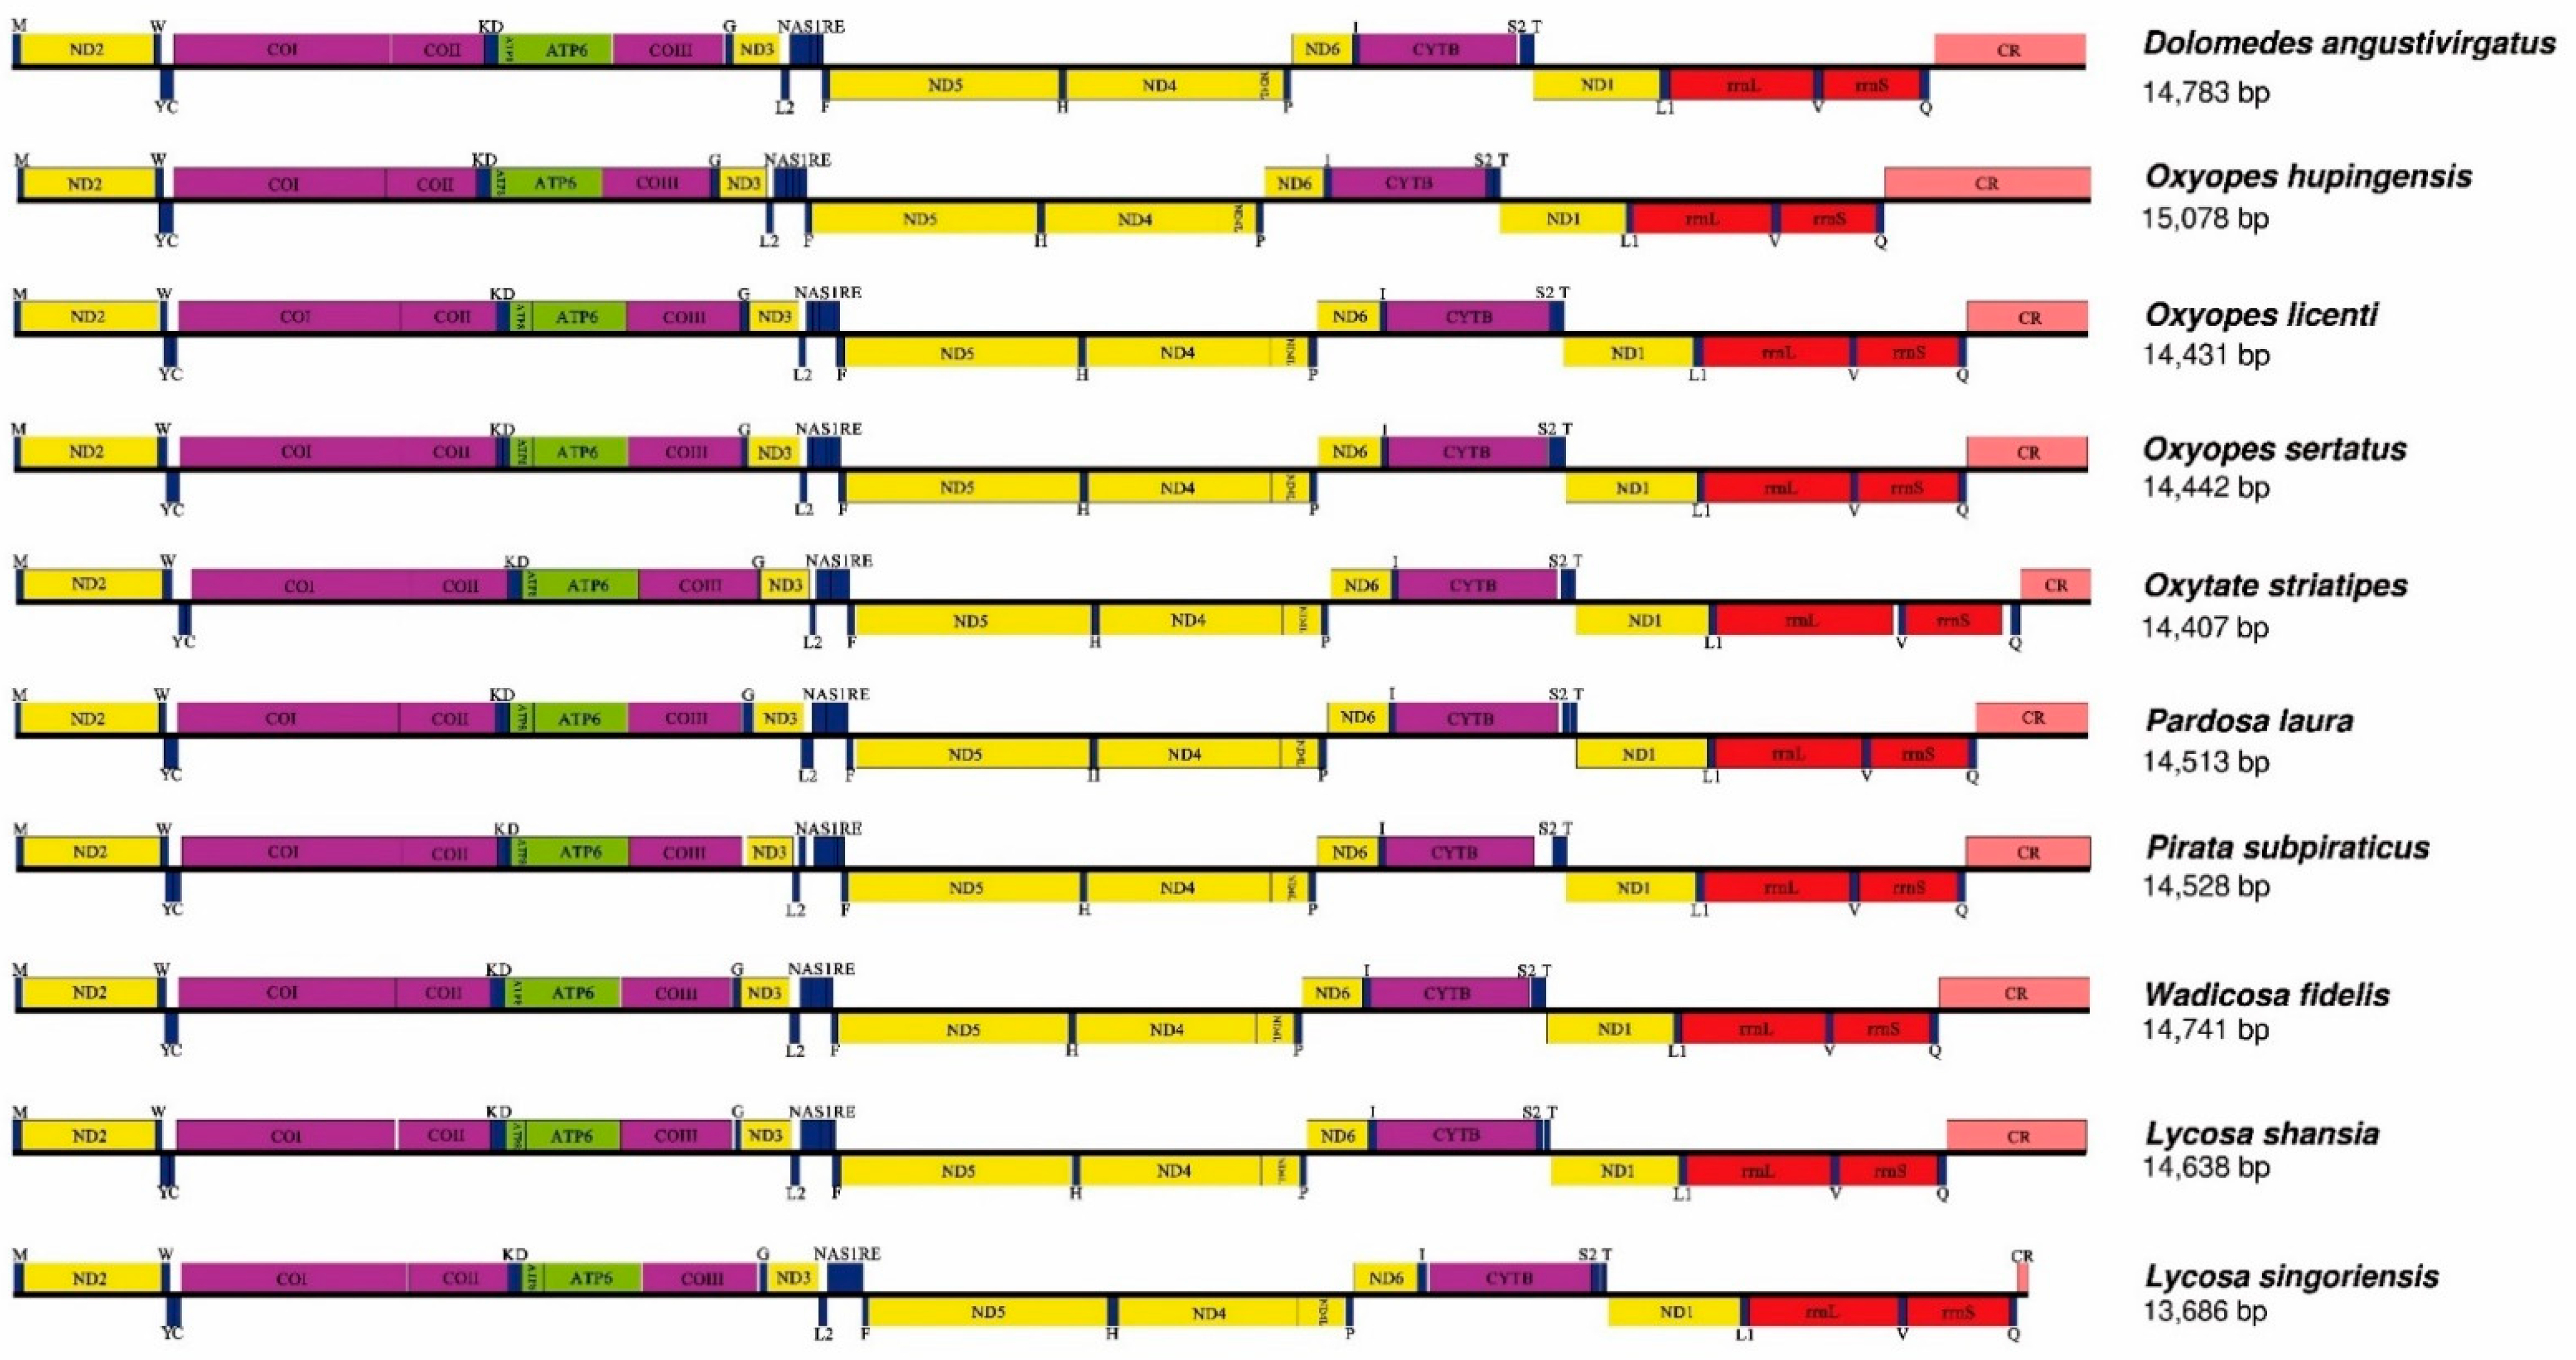
The mitogenomes of L. shansia and L. singoriensis were closed circular double-stranded DNA molecules with lengths of 14,638 bp and 13,686 bp, respectively (Figure 1). These two mitogenomes were submitted to GenBank (accession numbers: OK032619 and OK032620). We compared the data from the two species with eight closely related spiders and found high sequence similarity (Figure 1 and Figure 2). Both species had the typical genetic composition of most spiders: 22 genes including 9 PCGs and 13 tRNAs, were located in the major strand (J-chain). The other 15 genes included 4 PCGs, 9 tRNAs, and 2 rRNAs located in the minor strand (N-chain) (Figure 1, Table 3).
3.2. Nucleotide Composition
Similar to the mitogenomes of most arthropods [32], the nucleotide compositions of the mitogenomes of the two species exhibited a high A + T bias. (Table 2) In the mitogenome of L. singoriensis, the A + T content was 75.1% (A = 31.1%, T = 44.0%, G = 16.7%, and C = 8.2%) while in L. shansia, it was higher accounting for 79.3% (A = 35.5%, T = 43.7%, G = 12.7%, and C = 8.0%) (Table 2). Most metazoan mitogenomes generally have a significant strand-specific bias, which can be determined by calculating the AT and GC skew [33]. The mitogenomes of the two species exhibited negative AT and positive GC skews. This indicated that the nucleotide compositions of the mitogenomes of L. singoriensis and L. shansia tended to be T and G, respectively. A difference between the two suborders was detected by comparing the nucleotide skew of the mitogenome of previously sequenced spiders. In Opisthothelae, the average value of the AT skew was −0.094, ranging from −0.191 for Pholcus phalangioides to −0.015 for Cyclosa argenteoalba. The value of the GC skew ranged from 0.171 for C. argenteoalba to 0.472 for Phyxioschema suthepium, with an average of 0.277. In contrast, the GC skews of Liphistius erawan and Songthela hangzhouensis, in Mesothelae, were −0.235, and −0.361, respectively, showing a nucleotide composition skewed toward C in this suborder (Figure 3). In addition, a difference in nucleotide skew appeared to exist in the Opisthothelae suborder. For example, the GC-skew of Mygalomorphae was relatively higher than that of Araneoidea; however, the AT-skew of Araneoidea was relatively higher than that of the RTA clade (thus named for the retrolateral tibial apophysis of the male copulatory organs). The results are consistent with previous studies [9,34].
3.3. Protein-Coding Genes and Codon Usage Patterns
The RSCU of the mitogenomes of L. shansia and L. singoriensis was consistent with the tendency of A + T in the genetic coding of most invertebrate mitogenomes (Figure 4). The three most commonly used codons were AUU (encoding Ile), UAA (encoding Leu2), and UUU (encoding Phe), all of which were composed of A and U. The three most commonly used amino acids in L. shansia accounted for 43.04% of the total amino acids: Ile (20.57%), Leu2 (12.1%), and Phe (10.37%). In L. singoriensis the three most commonly used amino acids accounted for 38.59% of the total: Ile (17.65%), Leu2 (10.83%), and Phe (10.11%). Codons rich in GC might have been abandoned in the process of evolution; for example, CCG does not appear in L. singoriensis and appears only once in L. shansia.
The lengths of the PCGs detected in the two newly sequenced mitogenomes ranged from 151 bp to 1632 bp (Table 3). The AT-skew of the L. shansia PCGs ranged from −0.42 to 0.01, while that of L. singoriensis ranged from −0.22 to 0.05. Most PCGs used the standard starting codon of invertebrate mitochondria (ATN), except for COIII, which started from TTG (Table 3). Most PCGs in both mitogenomes terminated with a TAA or TAG codon, whereas the remaining PCGs terminated at a single T codon (Table 3). This incomplete termination codon is also present in other spider species (Araneae) and can be accomplished by post-transcriptional polyadenylation [11,35].
We calculated the Ka/Ks values using 13 PCGs from 55 spider species (Figure 5) and found that the mean and median values of Ka/Ks of ATP8 were the highest. This means that ATP8 had more amino acid diversity and might have evolved more rapidly than other PCGs in both species, for example it might have undergone looser selection constraints and accumulated more mutations. In another study, ATP8 was found to be more likely to lose its function [33], thus, ATP8 may be an effective marker for classifying a species into several sub-populations. The mean and median values of Ka/Ks for COI were the lowest. This indicates that COI was under greater evolutionary pressure and had the slowest rate of evolution among these genes. The Ka/Ks values for all 13 PCGs were less than 1 (Figure 5), suggesting that purification selection might dominate the evolution of mitogenomes [36,37]. This is similar to the findings of other studies [38].
3.4. Ribosomal and Transfer RNA Genes and Control Regions
Among the 22 tRNAs identified in L. shansia and L. singoriensis, serine and leucine corresponded to 2 tRNAs, and the other 18 tRNAs corresponded to 1 amino acid each. The longest tRNA of L. shansia was 68 bp trnR and the shortest was 41 bp trnT, with an average length of 58 bp. Nine of the tRNAs overlapped with other genes with a maximum number of overlapping bases of 25. In the sequence of L. singoriensis, the longest tRNA was 67 bp trnA and the shortest was trnT, with a length of 44 bp and an average length of 57 bp. Ten trnA-overlapping genes were also identified. The largest overlapping region was of 28 bases, while the measured tRNA length was shorter than the average tRNA length of arthropods (66 bp) [34] but similar to that of other arachnids. These truncated tRNAs and the large area of gene overlap [11] might be factors contributing to the reduction in spider mitogenome size. The lengths of rrnL were 1015 bp (L. shansia) and 1018 bp (L. singoriensis) and were both located between trnL1 (CUN) and trnV. The lengths of rrnS were 693 bp (L. shansia) and 706 bp (L. singoriensis) and were located between trnV and trnQ. Both L. shansia and L. singoriensis exhibited only one CR between trnQ and trnM. The CR of L. shansia was 984 bp, whereas that of L. singoriensis was very short (72 bp). Thus, this sequence was the shortest of the 55 spider species used in this study, with only 13,686 bp (Table 2). Although most mitogenomes were relatively stable, CR showed great variability because it is a non-coding region. The CR region may vary greatly among different species and even among individuals of the same species [2,39,40]. As shown in Figure 2, the size of the CR also affected the size of the spider mitogenome [36]. After analyzing the CR sequence, we found that there were many repetitive fragments in the L. singoriensis sequence, but not in L. shansia’s, indicating that tandem repeats might be an important factor affecting CR length. This conclusion has been confirmed in other animal studies [41].
Figure 6 shows the secondary structures of the 18 tRNAs successfully predicted in the two mitogenomes. The other four tRNAs genes could not be predicted. Most of these structures cannot fold into a typical cloverleaf structure. Metazoan tRNAs fold into typical cloverleaf structures with an acceptor stem (acceptor), D stem-loop (DHU), anticodon stem-loop (anticodon), and T stem-loop (TΨC). However, atypical tRNA structures have been observed in the mitogenomes of many arthropods [42], and their tRNAs typically lack TΨC. These atypical tRNAs can be functionally modified via post-transcriptional editing [10,43,44]. In addition, some studies have reported that degeneration of tRNAs might progress further, losing the TΨC-arm and DHU-arm to become armless tRNAs [10,45]. For example, nine tRNAs of L. shansia and five tRNAs of L. singoriensis lost the TΨC, while trnS1 and trnS2 of both spiders lost the DHU (Figure 6). Many examples of mitochondrial tRNAs with one or both arms missing can also be found in several other species of Araneae, such as the trnS of Tetragnatha maxillosa and T. nitens [34]. However, when tagging and analyzing the tRNA structure of Lycosidae species, we found that the acceptors of some tRNAs were completely missing, forming an open-loop structure (L. shansia trnC and trnT, L. singoriensis trnQ). This study is the first to predict the structure of tRNAs in Lycosa spiders, although the results may be of limited accuracy due to the software used. It is necessary to conduct further research on the tRNAs of Lycosa spiders by sequencing more species.
3.5. Phylogenetic Analysis
Identical tree topologies were obtained by BI and ML methods (Figure 7). All major branches in the tree were well supported by 0.526-1 BPP in BI analyses and 48–100% BS in ML analyses. In addition, the topology was very similar to those of other studies [11,34,46,47,48,49,50].
According to the phylogenetic tree, the Lycosidae family was divided into two groups: the first group was recovered as (L. shanasia + L. singoriensis), and the second group was recovered as (Pirata subpiraticus + (P. laura + W. fidelis)). This was well supported by both the BI and ML analyses.
4. Conclusions
The mitogenome structures of L. shansia and L. singoriensis were the same as those of the other Lycosoidea species. In addition, many tRNAs lacked the T and D stem loops. Noteworthy, a few tRNAs had no acceptor stems at all. We analyzed the nucleotide composition and found that the mitogenomes of the two species exhibited negative AT and positive GC skews. This is similar to other species in RTA clade. By analyzing the Ka/Ks ratio for the 13 PCGs, we found that ATP8 may have undergone milder selection constraints and accumulated more mutations. Furthermore, we reveal the position of two Lycosidae species in the phylogenetic.
Author Contributions
Conceptualization, W.Y., H.L. and S.Z.; methodology, W.Y. and J.W.; formal analysis, W.Y., J.W. and X.Z.; writing—original draft preparation, W.Y. and J.W; writing—review and editing, X.Z., H.L. and S.Z. All authors have read and agreed to the published version of the manuscript.
Funding
This work was supported by the Priority Academic Program Development of Jiangsu Higher Education Institutions (PAPD).
Institutional Review Board Statement
Not applicable.
Informed Consent Statement
Not applicable.
Data Availability Statement
DNA sequences: GenBank accession number OK032619.1, Lycosa shansia and OK032620.1, for Lycosa singoriensis.
Conflicts of Interest
The authors have no competing interests to declare.
References
- Hebert, S.L.; Lanza, I.R.; Nair, K.S. Mitochondrial DNA alterations and reduced mitochondrial function in aging. Mech. Ageing Dev. 2010, 131, 451–462. [Google Scholar] [CrossRef] [PubMed] [Green Version]
- Xu, W.; Lin, S.; Liu, H. Mitochondrial genomes of five Hyphessobrycon tetras and their phylogenetic implications. Ecol. Evol. 2021, 11, 12754–12764. [Google Scholar] [CrossRef]
- Tyagi, K.; Kumar, V.; Poddar, N.; Prasad, P.; Tyagi, I.; Kundu, S.; Chandra, K. The gene arrangement and phylogeny using mitochondrial genomes in spiders (Arachnida: Araneae). Int. J. Biol. Macromol. 2020, 146, 488–496. [Google Scholar] [CrossRef] [PubMed]
- Wheeler, W.C.; Coddington, J.A.; Crowle, L.M.; Dimitrov, D.; Goloboff, P.A.; Griswold, C.E.; Hormiga, G.; Prendini, L.; Ramirez, M.J.; Sierwald, P.; et al. The spider tree of life: Phylogeny of Araneae based on target-gene analyses from an extensive taxon sampling. Cladistics 2017, 33, 574–616. [Google Scholar] [CrossRef] [PubMed]
- Oshida, T.; Masuda, R. Phylogeny and Zoogeography of Six Squirrel Species of the Genus Sciurus (Mammalia, Rodentia), Inferred from Cytochrome b Gene Sequences. Zool. Sci. 2000, 17, 405–409. [Google Scholar] [CrossRef] [Green Version]
- Astrin, J.J.; Huber, B.A.; Misof, B.; Klütsch, C.F.C. Molecular taxonomy in pholcid spiders (Pholcidae, Araneae): Evaluation of species identification methods using CO1 and 16S rRNA. Zool. Scr. 2006, 35, 441–457. [Google Scholar] [CrossRef]
- Wang, Z.L.; Yang, X.Q.; Wang, T.Z.; Yu, X. Assessing the effectiveness of mitochondrial COI and 16S rRNA genes for DNA barcoding of farmland spiders in China. Mitochondrial DNA Part A 2017, 29, 695–702. [Google Scholar] [CrossRef] [PubMed]
- Fernández, R.; Hormiga, G.; Giribet, G. Phylogenomic Analysis of Spiders Reveals Nonmonophyly of Orb Weavers. Curr. Biol. 2014, 24, 1772–1777. [Google Scholar] [CrossRef] [PubMed] [Green Version]
- Wang, Z.-L.; Li, C.; Fang, W.-Y.; Yu, X.-P. Characterization of the complete mitogenomes of two Neoscona spiders (Araneae: Araneidae) and its phylogenetic implications. Gene 2016, 590, 298–306. [Google Scholar] [CrossRef] [PubMed]
- Pons, J.; Bover, P.; Bidegaray-Batista, L.; Arnedo, M.A. Arm-less mitochondrial tRNAs conserved for over 30 millions of years in spiders. BMC Genom. 2019, 20, 665. [Google Scholar] [CrossRef] [Green Version]
- Wang, Z.-L.; Li, C.; Fang, W.-Y.; Yu, X.-P. The Complete Mitochondrial Genome of two Tetragnatha Spiders (Araneae: Tetragnathidae): Severe Truncation of tRNAs and Novel Gene Rearrangements in Araneae. Int. J. Biol. Sci. 2016, 12, 109–119. [Google Scholar] [CrossRef] [PubMed] [Green Version]
- Crampton-Platt, A.; Timmermans, M.J.T.N.; Gimmel, M.L.; Kutty, S.N.; Cockerill, T.D.; Khen, C.V.; Vogler, A.P. Soup to Tree: The Phylogeny of Beetles Inferred by Mitochondrial Metagenomics of a Bornean Rainforest Sample. Mol. Biol. Evol. 2015, 32, 2303–2316. [Google Scholar] [CrossRef] [PubMed]
- Piacentini, L.N.; Ramírez, M.J. Hunting the wolf: A molecular phylogeny of the wolf spiders (Araneae, Lycosidae). Mol. Phylogenetics Evol. 2019, 136, 227–240. [Google Scholar] [CrossRef]
- Polotow, D.; Carmichael, A.; Griswold, C.E. Total evidence analysis of the phylogenetic relationships of Lycosoidea spiders (Araneae, Entelegynae). Invertebr. Syst. 2015, 29, 124. [Google Scholar] [CrossRef] [Green Version]
- Planas, E.; Fernández-Montraveta, C.; Ribera, C. Molecular systematics of the wolf spider genus Lycosa (Araneae: Lycosidae) in the Western Mediterranean Basin. Mol. Phylogenetics Evol. 2013, 67, 414–428. [Google Scholar] [CrossRef] [PubMed]
- Basso, A.; Babbucci, M.; Pauletto, M.; Riginella, E.; Patarnello, T.; Negrisolo, E. The highly rearranged mitochondrial genomes of the crabs Maja crispata and Maja squinado (Majidae) and gene order evolution in Brachyura. Sci. Rep. 2017, 7, 4096. [Google Scholar] [CrossRef] [PubMed] [Green Version]
- Akram, A.M.; Chaudhary, A.; Kausar, H.; Althobaiti, F.; Abbas, A.S.; Hussain, Z.; Fatima, N.; Zafar, E.; Asif, W.; Afzal, U.; et al. Analysis of RAS gene mutations in cytogenetically normal de novo acute myeloid leukemia patients reveals some novel alterations. Saudi J. Biol. Sci. 2021, 28, 3735–3740. [Google Scholar] [CrossRef] [PubMed]
- Zhang, J.; Weng, Y.; Ye, D.; You, Y.; Shi, J.; Chen, J. The complete chloroplast genome sequence of Casuarina equisetifolia. Mitochondrial DNA Part B 2021, 6, 3046–3048. [Google Scholar] [CrossRef]
- Bernt, M.; Donath, A.; Jühling, F.; Externbrink, F.; Florentz, C.; Fritzsch, G.; Pütz, J.; Middendorf, M.; Stadler, P.F. MITOS: Improved de novo metazoan mitochondrial genome annotation. Mol. Phylogenetics Evol. 2013, 69, 313–319. [Google Scholar] [CrossRef] [PubMed]
- Lowe, T.M.; Chan, P.P. tRNAscan-SE On-line: Integrating search and context for analysis of transfer RNA genes. Nucleic Acids Res. 2016, 44, W54–W57. [Google Scholar] [CrossRef] [PubMed]
- Chan, P.P.; Lowe, T.M. tRNAscan-SE: Searching for tRNA Genes in Genomic Sequences. In Gene Prediction; Humana: New York, NY, USA, 2019; Volume 1962, pp. 1–14. [Google Scholar] [CrossRef]
- Chan, P.P.; Lin, B.Y.; Mak, A.J.; Lowe, T.M. tRNAscan-SE 2.0: Improved detection and functional classification of transfer RNA genes. Nucleic Acids Res. 2021, 49, 9077–9096. [Google Scholar] [CrossRef] [PubMed]
- Laslett, D.; Canback, B. ARWEN: A program to detect tRNA genes in metazoan mitochondrial nucleotide sequences. Bioinformatics 2008, 24, 172–175. [Google Scholar] [CrossRef] [Green Version]
- Stothard, P.; Wishart, D.S. Circular genome visualization and exploration using CGView. Bioinformatics 2005, 21, 537–539. [Google Scholar] [CrossRef] [PubMed] [Green Version]
- Kumar, S.; Stecher, G.; Tamura, K. MEGA7: Molecular Evolutionary Genetics Analysis Version 7.0 for Bigger Datasets. Mol. Biol. Evol. 2016, 33, 1870–1874. [Google Scholar] [CrossRef] [PubMed] [Green Version]
- Perna, N.T.; Kocher, T.D. Patterns of nucleotide composition at fourfold degenerate sites of animal mitochondrial genomes. J. Mol. Evol. 1995, 41, 353–358. [Google Scholar] [CrossRef] [PubMed]
- Librado, P.; Rozas, J. DnaSP v5: A software for comprehensive analysis of DNA polymorphism data. Bioinformatics 2009, 25, 1451–1452. [Google Scholar] [CrossRef] [Green Version]
- Zhang, D.; Gao, F.; Jakovlić, I.; Zhou, H.; Zhang, J.; Li, W.X.; Wang, G.T. PhyloSuite: An integrated and scalable desktop platform for streamlined molecular sequence data management and evolutionary phylogenetics studies. Mol. Ecol. Resour. 2019, 20, 348–355. [Google Scholar] [CrossRef]
- Nguyen, L.-T.; Schmidt, H.A.; Von Haeseler, A.; Minh, B.Q. IQ-TREE: A Fast and Effective Stochastic Algorithm for Estimating Maximum-Likelihood Phylogenies. Mol. Biol. Evol. 2015, 32, 268–274. [Google Scholar] [CrossRef] [PubMed]
- Minh, B.Q.; Nguyen, M.A.T.; Von Haeseler, A. Ultrafast Approximation for Phylogenetic Bootstrap. Mol. Biol. Evol. 2013, 30, 1188–1195. [Google Scholar] [CrossRef]
- Guindon, S.; Dufayard, J.-F.; Lefort, V.; Anisimova, M.; Hordijk, W.; Gascuel, O. New Algorithms and Methods to Estimate Maximum-Likelihood Phylogenies: Assessing the Performance of PhyML 3.0. Syst. Biol. 2010, 59, 307–321. [Google Scholar] [CrossRef] [Green Version]
- Zhao, J.; Li, H.; Winterton, S.L.; Liu, Z. Ancestral Gene Organization in the Mitochondrial Genome of Thyridosmylus langii (McLachlan, 1870) (Neuroptera: Osmylidae) and Implications for Lacewing Evolution. PLoS ONE 2013, 8, e62943. [Google Scholar] [CrossRef] [PubMed]
- Hassanin, A.; Léger, N.; Deutsch, J. Evidence for Multiple Reversals of Asymmetric Mutational Constraints during the Evolution of the Mitochondrial Genome of Metazoa, and Consequences for Phylogenetic Inferences. Syst. Biol. 2005, 54, 277–298. [Google Scholar] [CrossRef] [PubMed]
- Ovchinnikov, S.; Masta, S.E. Pseudoscorpion mitochondria show rearranged genes and genome-wide reductions of RNA gene sizes and inferred structures, yet typical nucleotide composition bias. BMC Evol. Biol. 2012, 12, 31. [Google Scholar] [CrossRef] [PubMed] [Green Version]
- Ojala, D.; Montoya, J.; Attardi, G. tRNA punctuation model of RNA processing in human mitochondria. Nature 1981, 290, 470–474. [Google Scholar] [CrossRef]
- Chang, H.; Qiu, Z.; Yuan, H.; Wang, X.; Li, X.; Sun, H.; Guo, X.; Lu, Y.; Feng, X.; Majid, M.; et al. Evolutionary rates of and selective constraints on the mitochondrial genomes of Orthoptera insects with different wing types. Mol. Phylogenetics Evol. 2020, 145, 106734. [Google Scholar] [CrossRef]
- Hurst, L.D. The Ka/Ks ratio: Diagnosing the form of sequence evolution. Trends Genet. 2002, 18, 486–487. [Google Scholar] [CrossRef]
- Kumar, V.; Tyagi, K.; Chakraborty, R.; Prasad, P.; Kundu, S.; Tyagi, I.; Chandra, K. The Complete Mitochondrial Genome of endemic giant tarantula, Lyrognathus crotalus (Araneae: Theraphosidae) and comparative analysis. Sci. Rep. 2020, 10, 74. [Google Scholar] [CrossRef]
- Gong, L.; Shi, W.; Si, L.-Z.; Wang, Z.-M.; Kong, X.-Y. The complete mitochondrial genome of peacock sole Pardachirus pavoninus (Pleuronectiformes: Soleidae) and comparative analysis of the control region among 13 soles. Mol. Biol. 2015, 49, 408–417. [Google Scholar] [CrossRef]
- Padhi, A. Geographic variation within a tandemly repeated mitochondrial DNA D-loop region of a North American freshwater fish, Pylodictis olivaris. Gene 2014, 538, 63–68. [Google Scholar] [CrossRef]
- Xu, W.; Ding, J.; Lin, S.; Xu, R.; Liu, H. Comparative mitogenomes of three species in Moenkhausia: Rare irregular gene rearrangement within Characidae. Int. J. Biol. Macromol. 2021, 183, 1079–1086. [Google Scholar] [CrossRef]
- Mao, M.; Dowton, M. Complete mitochondrial genomes of Ceratobaeus sp. and Idris sp. (Hymenoptera: Scelionidae): Shared gene rearrangements as potential phylogenetic markers at the tribal level. Mol. Biol. Rep. 2014, 41, 6419–6427. [Google Scholar] [CrossRef] [PubMed]
- Masta, S.E. Mitochondrial Sequence Evolution in Spiders: Intraspecific Variation in tRNAs Lacking the TΨC Arm. Mol. Biol. Evol. 2000, 17, 1091–1100. [Google Scholar] [CrossRef] [Green Version]
- Masta, S.E.; Boore, J.L. Parallel Evolution of Truncated Transfer RNA Genes in Arachnid Mitochondrial Genomes. Mol. Biol. Evol. 2008, 25, 949–959. [Google Scholar] [CrossRef] [PubMed] [Green Version]
- Klimov, P.B.; Oconnor, B.M. Improved tRNA prediction in the American house dust mite reveals widespread occurrence of extremely short minimal tRNAs in acariform mites. BMC Genom. 2009, 10, 598. [Google Scholar] [CrossRef] [PubMed] [Green Version]
- Vidergar, N.; Toplak, N.; Kuntner, M. Streamlining DNA Barcoding Protocols: Automated DNA Extraction and a New cox1 Primer in Arachnid Systematics. PLoS ONE 2014, 9, e113030. [Google Scholar] [CrossRef] [PubMed]
- Maddison, W.P. A phylogenetic classification of jumping spiders (Araneae: Salticidae). J. Arachnol. 2015, 43, 231–292. [Google Scholar] [CrossRef]
- Azevedo, G.H.F.; Griswold, C.E.; Santos, A.J. Systematics and evolution of ground spiders revisited (Araneae, Dionycha, Gnaphosidae). Cladistics 2017, 34, 579–626. [Google Scholar] [CrossRef]
- Ban, X.C.; Shao, Z.K.; Wu, L.J.; Sun, J.T.; Xue, X.F. Highly diversified mitochondrial genomes provide new evidence for interordinal relationships in the Arachnida. Cladistics 2022. [Google Scholar] [CrossRef]
- Heath, T.A.; Hedtke, S.M.; Hillis, D.M. Taxon sampling and the accuracy of phylogenetic analyses. J. Syst. Evol. 2008, 46, 239–257. [Google Scholar] [CrossRef]
Figure 1.
Annotated mitogenomes of L. shansia and L. singoriensis.

Figure 2.
Comparison of mitogenome structure among ten Lycosoidea species.

Figure 3.
The AT-skew (grey squares) and GC-skew (red circles) of 55 species of the Araneae. The species names are as follows: 1. Araneus angulatus 2. Araneus ventricosus 3. Argiope amoena 4. Argiope bruennichi 5. Argiope perforata 6. Cyclosa argenteoalba 7. Cyclosa japonica 8. Cyrtarachne nagasakiensis 9. Hypsosinga pygmaea 10. Neoscona adianta 11. Neoscona multiplicans 12. Neoscona nautica 13. Neoscona scylla 14. Neoscona theisi 15. Agelena silvatica 16. Tetragnatha maxillosa 17. Tetragnatha nitens 18. Trichonephila clavata 19. Trichonephila clavipes 20. Argyroneta aquatica 21. Ebrechtella tricuspidata 22. Carrhotus xanthogramma 23. Epeus alboguttatus 24. Cheliceroides longipalpis 25. Habronattus oregonensis 26. Phanuelus gladstone 27. Phintella cavaleriei 28. Plexippus paykulli 29. Telamonia vlijmi 30. Desis jiaxiangi 31. Selenops bursarius 32. Dolomedes angustivirgatus 33. Oxyopes hupingensis 34. Oxyopes licenti 35. Oxyopes sertatus 36. Oxytate striatipes 37. Pardosa laura 38. Pirata subpiraticus 39. Wadicosa fidelis 40. Lycosa shansia 41. Lycosa singoriensis 42. Cheiracanthium triviale 43. Hypochilus thorelli 44. Loxosceles similis 45. Mesabolivar sp 46. Pholcus sp 47. Pholcus phalangioides 48. Parachtes romandiolae 49. Phyxioschema suthepium 50. Atypus karschi 51. Calisoga longitarsis 52. Cyriopagopus hainanus 53. Ornithoctonus huwena 54. Songthela hangzhouensis 55. Liphistius erawan.

Figure 4.
The codon distribution and RSCU of L. shansia and L. singoriensis.

Figure 5.
The Ka/Ks ratio for the 13 PCGs of 55 spider mitogenomes.

Figure 6.
The secondary structure of 18 mitochondrial tRNAs in L. shansia and L. singoriensis.

Figure 7.
13 PCGs and 2 rRNAs-based phylogenetic tree of 55 Araneae species. Numbers at nodes representing the posterior probability and bootstrap values for BI and ML analysis, respectively. Values are shown next to nodes, with posterior probability on the left and ML bootstrap support values on the right. Names with a star are the sequences obtained in this study.


Table 1.
Primers used for completing the mitogenome of L. singoriensis.
| Primer | Region | Forward Primer Sequence (5′→3′) | Reverse Primer Sequence (5′→3′) |
|---|---|---|---|
| Lysi-1 | trnM-COI | AGGTCAGCTAATAAAGCTAA | AACCAATTACAAACCCACC |
| Lysi-2 | trnK-ATP6 | AGGTGTTAGTCTCTTAAATT | GCYATTATATTAGCAGCYAA |
| Lysi-3 | COIII-ND5 | GGATTTGAAGCAGCAGCTTG | GGATTACCATTCACATCAGG |
| Lysi-4 | ND5 | CCTGATGTGAATGGTAATCC | ATTATAGACTGAATCTCATC |
| Lysi-5 | ND5-ND4 | ATGAGATTCAGTCTATAATG | CCTTAATCGCTTATTCATCA |
| Lysi-6 | ND4-CYTB | GGTAGGTGATATTAAGATTA | ATWCTAGCWCCATTACATG |
| Lysi-7 | CYTB-ND1 | TRTTCATATTCAACCTGAAT | ATYGGATGATCWACTAATTC |
| Lysi-8 | rrnL-rrnS | AGTTCGATAGGGTCTTATCG | CCTATTTATAATGGCGGCAT |
| Lysi-9 | rrnS-ND2 | AGGTTCCTCTAATAAGATGA | CATGAACCAATCATCTCTAC |
Table 2.
Summary of the mitogenomes used in the analyses.
| Order | Family | Species | Accession Number | Total Length (bp) | Total A + T (%) |
|---|---|---|---|---|---|
| Araneomorphae | Araneidae | Araneus angulatus | KU365988.1 | 14,205 | 75.1 |
| Araneidae | Araneus ventricosus | KM588668.1 | 14,617 | 73.4 | |
| Araneidae | Argiope amoena | KJ607907.1 | 14121 | 72.1 | |
| Araneidae | Argiope bruennichi | KJ594561.1 | 14,063 | 73.4 | |
| Araneidae | Argiope perforata | MK512574.1 | 14,032 | 74.2 | |
| Araneidae | Cyclosa argenteoalba | KP862583.1 | 14,575 | 73.7 | |
| Araneidae | Cyclosa japonica | MK512575.1 | 14,687 | 73.0 | |
| Araneidae | Cyrtarachne nagasakiensis | KR259802.1 | 14,402 | 75.7 | |
| Araneidae | Hypsosinga pygmaea | KR259803.1 | 14,193 | 76.1 | |
| Araneidae | Neoscona adianta | KR259805.1 | 14,161 | 74.6 | |
| Araneidae | Neoscona multiplicans | MK052682.1 | 14,074 | 74.8 | |
| Araneidae | Neoscona nautica | KR259804.1 | 14,049 | 78.8 | |
| Araneidae | Neoscona scylla | MK086023.1 | 14,092 | 74.6 | |
| Araneidae | Neoscona theisi | KP100667.1 | 14,156 | 75.2 | |
| Agelenidae | Agelena silvatica | KX290739.1 | 14,776 | 74.5 | |
| Tetragnathidae | Tetragnatha maxillosa | KP306789.1 | 14,578 | 74.5 | |
| Tetragnathidae | Tetragnatha nitens | KP306790.1 | 14,639 | 74.3 | |
| Nephilidae | Trichonephila clavata | AY452691.1 | 14,436 | 76.0 | |
| Nephilidae | Trichonephila clavipes | LC619787.1 | 14,902 | 77.2 | |
| Dictynidae | Argyroneta aquatica | KJ907736.1 | 16,000 | 72.2 | |
| Thomisidae | Ebrechtella tricuspidata | KU852748.1 | 14,532 | 76.2 | |
| Thomisidae | Oxytate striatipes | KM507783.1 | 14,407 | 78.2 | |
| Salticidae | Carrhotus xanthogramma | KP402247.1 | 14,563 | 75.1 | |
| Salticidae | Epeus alboguttatus | MH922026.1 | 14,625 | 77.6 | |
| Salticidae | Cheliceroides longipalpis | MH891570.1 | 14,334 | 79.0 | |
| Salticidae | Habronattus oregonensis | AY571145.1 | 14,381 | 74.4 | |
| Salticidae | Phanuelus gladstone | MT773150.1 | 14,458 | 75.1 | |
| Salticidae | Phintella cavaleriei | MW540530.1 | 14,325 | 78.1 | |
| Salticidae | Plexippus paykulli | KM114572.1 | 14,316 | 73.5 | |
| Salticidae | Telamonia vlijmi | KJ598073.1 | 14,601 | 77.3 | |
| Desidae | Desis jiaxiangi | MW178198.1 | 14,610 | 77.0 | |
| Selenopidae | Selenops bursarius | KM114573.1 | 14,272 | 74.4 | |
| Pisauridae | Dolomedes angustivirgatus | KU354434.1 | 14,783 | 76.8 | |
| Oxyopidae | Oxyopes hupingensis | MK518391.1 | 15,078 | 77.9 | |
| Oxyopidae | Oxyopes licenti | MT741489.1 | 14,431 | 78.1 | |
| Oxyopidae | Oxyopes sertatus | KM272950.1 | 14,442 | 75.9 | |
| Lycosidae | Pardosa laura | KM272948.1 | 14,513 | 77.4 | |
| Lycosidae | Pirata subpiraticus | KM486623.1 | 14,528 | 75.6 | |
| Lycosidae | Wadicosa fidelis | KP100666.1 | 14,741 | 76.0 | |
| Lycosidae | Lycosa shansia | OK032619 | 14,638 | 79.3 | |
| Lycosidae | Lycosa singoriensis | OK032620 | 13,686 | 75.1 | |
| Hypochilidae | Hypochilus thorelli | EU523753.1 | 13,991 | 70.3 | |
| Cheiracanthiidae | Cheiracanthium triviale | MN334527.1 | 14,595 | 77.9 | |
| Sicariidae | Loxosceles similis | MK425700.1 | 14,683 | 72.8 | |
| Pholcidae | Mesabolivar sp | MH643812.1 | 14,941 | 70.6 | |
| Pholcidae | Pholcus sp | KJ782458.1 | 14,279 | 65.8 | |
| Pholcidae | Pholcus phalangioides | JQ407804.1 | 14,459 | 65.9 | |
| Dysderidae | Parachtes romandiolae | MN052923.1 | 14,220 | 71.4 | |
| Mygalomorphae | Dipluridae | Phyxioschema suthepium | JQ407802.1 | 13,931 | 67.4 |
| Atypidae | Atypus karschi | MT832081.1 | 14,149 | 73.7 | |
| Nemesiidae | Calisoga longitarsis | EU523754.1 | 14,070 | 64.0 | |
| Theraphosidae | Cyriopagopus hainanus | MN877932.1 | 13,874 | 69.6 | |
| Theraphosidae | Ornithoctonus huwena | AY309259.1 | 13,874 | 69.8 | |
| Mesothelae | Liphistiidae | Songthela hangzhouensis | AY309258.1 | 14,215 | 72.2 |
| Liphistiidae | Liphistius erawan | JQ407803.1 | 14,197 | 67.7 |
Table 3.
Mitochondrial composition of the L. shansia (on the left) and L. Singoriensis (on the right).
Table 3.
Mitochondrial composition of the L. shansia (on the left) and L. Singoriensis (on the right).
| Name | Location | Size (bp) | Intergenic Nucleotides | Codon | Strand | ||
|---|---|---|---|---|---|---|---|
| From | To | Start | Stop | ||||
| trnM | 1\1 | 66\63 | 66\63 | 0\0 | J | ||
| ND2 | 66\67 | 1013\1009 | 948\943 | −1\3 | ATA\ATT | TAA\T | J |
| trnW | 1012\1010 | 1058\1068 | 47\59 | −2\0 | J | ||
| trnY | 1045\1041 | 1103\1097 | 59\57 | −14\28 | N | ||
| trnC | 1109\1086 | 1150\1140 | 42\55 | 5\−12 | N | ||
| COI | 1160\1142 | 2701\2680 | 1542\1539 | 9\1 | ATA\ATA | TAA\TAA | J |
| COII | 2728\2689 | 3375\3355 | 648\667 | 26\8 | ATA\TTG | TAA\T | J |
| trnK | 3376\3356 | 3422\3415 | 47\60 | 0\0 | J | ||
| trnD | 3422\3399 | 3486\3455 | 65\57 | −1\−17 | J | ||
| ATP8 | 3472\3448 | 3622\3606 | 151\159 | −15\−8 | ATA\ATT | T\TAA | J |
| ATP6 | 3624\3606 | 4289\4268 | 666\663 | 1\−1 | ATA\ATA | TAA\TAA | J |
| COIII | 4293\4272 | 5078\5057 | 786\786 | 3\3 | TTG\TTG | TAA\TAG | J |
| trnG | 5096\5071 | 5146\5125 | 51\55 | 17\13 | J | ||
| ND3 | 5150\5129 | 5503\5473 | 354\345 | 3\3 | ATT\ATT | TAA\TAG | J |
| trnL2(UUR) | 5504\5473 | 5561\5532 | 58\60 | 0\−1 | N | ||
| trnN | 5563\5532 | 5622\5584 | 60\53 | 1\−1 | J | ||
| trnA | 5600\5567 | 5658\5633 | 59\67 | −23\−18 | J | ||
| trnS1(AGN) | 5653\5631 | 5706\5683 | 54\53 | −6\−3 | J | ||
| trnR | 5709\5679 | 5776\5733 | 68\55 | 2\−5 | J | ||
| trnE | 5754\5721 | 5812\5775 | 59\55 | −23\−13 | J | ||
| trnF | 5788\5768 | 5845\5812 | 58\45 | −25\−8 | N | ||
| ND5 | 5844\5813 | 7475\7436 | 1632\1624 | −2\0 | ATA\ATA | TAA\T | N |
| trnH | 7481\7438 | 7535\7502 | 55\65 | 5\1 | N | ||
| ND4 | 7536\7503 | 8817\8726 | 1282\1224 | 0\0 | TTG\ATT | T\TAA | N |
| ND4L | 8818\8724 | 9085\9048 | 268\325 | 0\−3 | ATT\ATA | T\T | N |
| trnP | 9078\9052 | 9134\9103 | 57\52 | −8\3 | N | ||
| ND6 | 9138\9109 | 9569\9538 | 432\430 | 3\5 | TTG\TTG | TAA\T | J |
| trnI | 9568\9539 | 9632\9604 | 65\66 | −2\0 | J | ||
| CYTB | 9624\9620 | 10754\10721 | 1131\1102 | −9\15 | ATT\ATT | TAA\T | J |
| trnS2(UCN) | 10755\10722 | 10806\10775 | 52\54 | 0\0 | J | ||
| trnT | 10814\10781 | 10854\10824 | 41\44 | 7\5 | J | ||
| ND1 | 10856\10833 | 11765\11733 | 910\901 | 1\8 | ATA\ATA | T\T | N |
| trnL1(CUN) | 11756\11737 | 11821\11788 | 66\52 | 10\3 | N | ||
| rrnL | 11822\11789 | 12836\12806 | 1015\1018 | 0\0 | N | ||
| trnV | 12837\12807 | 12897\12862 | 61\56 | 0\0 | N | ||
| rrnS | 12898\12861 | 13590\13566 | 693\706 | 0\2 | N | ||
| trnQ | 13591\13567 | 13654\13613 | 64\47 | 0\0 | N | ||
| CR | 13655\13614 | 14638\13686 | 984\73 | 0\0 | J | ||
Publisher’s Note: MDPI stays neutral with regard to jurisdictional claims in published maps and institutional affiliations. |
© 2022 by the authors. Licensee MDPI, Basel, Switzerland. This article is an open access article distributed under the terms and conditions of the Creative Commons Attribution (CC BY) license (https://creativecommons.org/licenses/by/4.0/).
Share and Cite
MDPI and ACS Style
Ye, W.; Wang, J.; Zhao, X.; Liu, H.; Zhu, S. Mitochondrial Genomes of two Lycosa spiders (Araneae, Lycosidae): Genome Description and Phylogenetic Implications. Diversity 2022, 14, 538. https://0-doi-org.brum.beds.ac.uk/10.3390/d14070538
AMA Style
Ye W, Wang J, Zhao X, Liu H, Zhu S. Mitochondrial Genomes of two Lycosa spiders (Araneae, Lycosidae): Genome Description and Phylogenetic Implications. Diversity. 2022; 14(7):538. https://0-doi-org.brum.beds.ac.uk/10.3390/d14070538
Chicago/Turabian StyleYe, Wentao, Jiachen Wang, Xinyi Zhao, Hongyi Liu, and Sheng Zhu. 2022. "Mitochondrial Genomes of two Lycosa spiders (Araneae, Lycosidae): Genome Description and Phylogenetic Implications" Diversity 14, no. 7: 538. https://0-doi-org.brum.beds.ac.uk/10.3390/d14070538
Note that from the first issue of 2016, this journal uses article numbers instead of page numbers. See further details here.