Article

Diversity of Nearctic Dragonflies and Damselflies (Odonata)

by
John C. Abbott
1,*,
Cornelio A. Bota-Sierra
1,2,
Robert Guralnick
3,
Vincent Kalkman
4,
Enrique González-Soriano
5,
Rodolfo Novelo-Gutiérrez
6,
Seth Bybee
7,
Jessica Ware
8 and
Michael W. Belitz
3
1
Alabama Museum of Natural History & UA Museums Department of Research and Collections, The University of Alabama, Tuscaloosa, AL 35487, USA
2
Grupo de Entomología Universidad de Antioquia (GEUA), Universidad de Antioquia, Medellin 50010, Colombia
3
Florida Museum of Natural History, University of Florida, Gainesville, FL 32611, USA
4
Naturalis Biodiversity Center, 2333 CR Leiden, The Netherlands
5
Departamento de Zoología, Instituto de Biología, Universidad Nacional Autónoma de México, Apartado Postal 70-153, Mexico City 04510, Mexico
6
Red de Biodiversidad y Sistemática, Instituto de Ecología AC, Xalapa 91073, Mexico
7
Department of Biology and Monte L. Bean Museum, Brigham Young University, Provo, UT 84602, USA
8
American Museum of Natural History, Division of Invertebrate Zoology, New York, NY 10024, USA
*
Author to whom correspondence should be addressed.
Submission received: 19 May 2022 / Revised: 6 July 2022 / Accepted: 12 July 2022 / Published: 18 July 2022
(This article belongs to the Special Issue Diversity, Ecology and Evolution of Odonata)

Abstract

:
Rarely have studies assessed Odonata diversity for the entire Nearctic realm by including Canada, the United States, and Mexico. For the first time, we explored Odonata diversity in this region according to a definition of natural community assemblages and generated species distribution models (SDMs). Species occurrence data were assembled by reviewing databases of specimens held by significant Odonata repositories and through an extensive search of literature references. Species were categorized as forest-dependent or non-forest-dependent, as lentic or lotic-dependent, and according to conservation status. Predicted distributions were stacked for all species across their entire ranges, including areas outside of the Nearctic. Species richness and corrected weighted endemism (CWE) were then calculated for each grid cell. We found a pattern of greater species richness in the eastern portion of the Nearctic, which can be explained by the higher aquatic habitat diversity at micro and macroscales east of the Rocky Mountains, promoting niche partitioning and specialization. In the Nearctic region, the southeastern US has the highest number of endemic species of dragonflies and damselflies; this degree of endemism is likely due to glacial refuges providing a foundation for the evolution of a rich and unique biota.

Graphical Abstract

1. Introduction

Dragonflies and damselflies (Odonata) are amongst the most recognizable insects. Their study in the Nearctic dates back to the 18th century (e.g., [1], but see [2] for a review). Moreover, their cultural significance stretches further back in time, serving a role in the traditions of multiple Native American cultures [3,4]. Knowledge about Nearctic Odonata is most complete for the United States and Canada, with significant efforts to close gaps in our understanding of conservation, taxonomy, ecology, physiology, and evolutionary biology (e.g., [5,6,7,8,9,10]). In northern Mexico some regional assessments and studies in key areas have been published (e.g., [11,12,13,14,15,16]). Nevertheless, knowledge gaps of Odonate distributions across the Nearctic portions of Mexico make it difficult to address questions about richness and endemism within the region.
The full Nearctic realm is defined by a distinct assemblage of natural communities in the North American continent, whose northern boundaries are Greenland west to Alaska, and whose southern boundaries are three mountain ranges of northern and central Mexico: Sierra Madre Occidental, Sierra Madre Oriental, and Eje Neovolcánico Transversal [17]. These mountainous regions are considered part of the Mexican transition zone where the Neotropical and Nearctic biotas converge, making them biodiversity hotspots [18,19].
The biodiversity of Odonata has not been studied on the basis of a Nearctic definition according to natural community assemblages. Rather, most studies loosely defined the Nearctic realm politically, as north of the Mexican border, a fauna that currently includes 471 species [20]. Rarely have studies assessed Odonata diversity for the entire Nearctic realm by including Canada, the United States, and Mexico [2,21]. Usually, the US/Canada fauna [22,23] and Mexican faunas [24,25] have been treated separately. To date, no complete assessment for the entire Nearctic has been published.
In this study, we showcase production of species distribution models (SDMs) for the Odonate diversity of the entire Nearctic, utilizing a best practices approach with strong attention to curation and expert assessment at every step during production. This effort led to predicted distributions at relatively fine grain for 509 species that occur north of the Mexican mountain ranges to the Arctic pole. Input occurrence data used for modeling were scrupulously assembled from the published literature, museum databases, and the citizen science repository Odonata Central [26] to create these models, which were then used to create maps of richness and endemism.
We used these maps to address a set of questions about the structure of Odonate spatial diversity. First, we used the data in the IUCN red list [27] to map the distribution of the threatened and endangered species occurring in the Nearctic. We also mapped the aquatic habitat (lotic vs. lentic) used by the immature stages and the terrestrial habitat (forest vs. non-forest obligates) used by adults. Lastly, we mapped sampling efforts to identify potential gaps in our knowledge. These maps provide key means to assess hotspots of diversity and endemism, which are often poorly understood in insects, with importance in fields such as conservation and ecology. We explicitly address the following questions empirically: Are there differences in diversity patterns shown by forest and non-forest species? Are there differences in diversity patterns shown by lotic and lentic species? Are there areas with relatively high endemism, and do these match areas of endemism shown for other insect or animal groups? Are there areas with a relatively high percentage of globally threatened species, and how do these match with Odonate hotspots? Can areas be defined with a strong mismatch between predicted diversity and recorded diversity, and where is sampling least strong, so that information gaps can be closed?

2. Materials and Methods

2.1. Definition of Nearctic Realm

We followed the strict definition of Olson et al. [28] for the Nearctic realm, which does not include the three mountain ranges of northern and central Mexico, leaving this transition zone, along with several Neotropical Odonates, out of the study (Figure 1).

2.2. Species Occurrence Data

Species occurrence data were assembled by reviewing databases at the following entomological collections in Mexico and the USA: Alabama Museum of Natural History (ALMNH), Colección Nacional de Insectos Instituto de Biología Universidad Autónoma de México (CNIN/IBUNAM), Florida State Collection of Arthropods (FSCA), Instituto de Ecología Colección Entomológica, Xalapa (IEXA), Natalia von Ellenrieder (NvE), and Rosser W. Garrison (RWG). Furthermore, an extensive search of literature references was performed using the following keywords in English and Spanish: Mexico, USA, Canada, Odonata, dragonflies, damselflies, libélulas, and Norte América. The main references consulted were Behrstock et al. [29], Calvert [30,31], Cuevas–Yañez et al. [12], González-Soriano et al. [32], González-Soriano & Novelo-Gutiérrez [33], Escoto-Moreno et al. [13,34], Ortega-Salas and González-Soriano [15], and Upson et al. [11]. Every locality lacking geographic coordinates was georeferenced using Google Earth [35] by searching for the location presented. The resulting coordinates were chosen when no more accurate information was available. The data were vetted and curated by examination of distribution maps by J.C.A., C.B.S., E.G.S., and R.N.G. Additionally, expert vetted records stored at Odonata Central [26], a public database for Odonate citizen science (www.odonatacentral.org, accessed on 10 May 2022), were also compiled for the Nearctic. All data used are compiled in Supplementary Material Table S1.
Using these occurrence records, we generated a list of all species of Odonata with non-vagrant records in the Nearctic. The Nearctic realm was defined using the WWF Biome 2 definition from a shapefile provided by The Nature Conservancy [28]. In total, there were 509 species that were determined to be residents of the Nearctic. While we only included species from the Nearctic, occurrences for those species with ranges outside the realm were included in our downstream modeling steps. Full species ranges are particularly critical for appropriately determining endemism and conservation status [36].
Once the initial occurrence data for Nearctic species were assembled, we ran the occurrence records through a cleaning pipeline in the R package CoordinateCleaner [37] that flagged records (1) with equal latitude and longitude coordinates, (2) within a 1000 m radius around the geographic centroids of political countries and provinces, and (3) with either zero longitude or latitude. Maps displaying both unflagged and flagged occurrence records were generated for each species in our Nearctic species list for expert review. During this step, expert review (J.C.A., C.B.S., E.G.S., and R.N.G.) was used to determine which occurrence records should be removed from the database because they were determined to be incorrect, generating a final dataset of curated occurrence records to be used for distribution modeling.

2.3. Functional Traits and Conservation Status

We subdivided our species list on the basis of two functional traits and conservation status as determined by the International Union for the Conservation of Nature (IUCN). Species were categorized as forest-dependent or non-forest dependent, as lentic or lotic-dependent, and according to conservation status. Information on habitat use, aquatic habitat by immature stages and terrestrial habitat by adults, were collected on the basis of the literature and expert knowledge. The following questions were used to classify each species: Can the species survive without forests? Can the species survive without a lotic environment? Those where the answer was “no” were labeled “forest obligate” or “lotic obligate”, whereas, when the answer was yes, they were labeled as non-forest or lentic. We also included the IUCN conservation category of the 509 species in the Nearctic realm. All but one species were assessed, and the data were downloaded from the IUCN portal [27]. Threatened species included species with red list categories classified by the IUCN as either near-threatened, vulnerable, endangered, or critically endangered. After subdividing the species, we stacked the distributions of all species within each category and calculated the richness and CWE (corrected weighted endemism) values for each grid cell as explained below. While Calabrese et al. [38] suggested using continuous values for stacking ENMs (ecological niche models), we custom-tuned models during thresholding to avoid overfitting as described below and, thus, opted for stacking the thresholded outputs. We generated bivariate maps to visualize species richness and CWE for forest/non-forest species and lentic/lotic species on a single map. Bivariate categories were calculated by determining cells lower than the 33rd percentile, between the 33rd and 66th percentile, and greater than the 66th percentile of species richness given a certain trait.
To test if terrestrial or aquatic habitats used by Odonates has an effect on the overall range size, two Wilcoxon tests were performed using R software version 4.1.2 (R Core Team; Vienna, Austria) [39]. The first test used terrestrial habitat categorized as forest- and non-forest-dependent species as the predictor variable. The second test used aquatic habitat categorized as lotic or lentic species. The dependent variable for both tests was the range size predicted for every species measured by the total number of pixels in which the species was predicted to occur. We expected lentic species to have larger range sizes, as hypothesized by [40]. Similarly, forest species are expected to have smaller ranges than non-forest-dependent ones since they are highly specialized [41,42,43] in patchy distributed habitats.

2.4. Species Distribution Modeling

We built a species distribution pipeline in R to predict the distribution of all 509 species found in the Nearctic. This pipeline was strategically designed to efficiently model the distributions of hundreds of species, while including multiple steps that customize the process for each species.
First, we defined the accessible area, which was the geographic area where the distribution model was both fit and projected by generating a buffered alpha hull around the accepted occurrence records. The alpha hull was calculated using the getDynamicAlphaHullfunction from the R package rangeBuilder [44], where we set the fraction of occurrences that can fall outside of the polygon to be zero, with an initial alpha value of 20 and an allowed maximum of three disjunct polygons. We then buffered the alpha hull by the larger value of either 75 km or the 80th percentile distance between an occurrence record and the nearest occurrence records to ensure that the accessible area included areas that were accessible to a species through time [45]. These hulls were vetted for quality by expert curators (J.C.A., C.B.S., E.G.S., and R.N.G.).
Next, we spatially thinned occurrence records to remove potential spatial biases, where certain areas had more records than other areas, likely reflecting differences in human sampling effort more than changes in relative abundance across a landscape. Spatially thinning occurrence records were demonstrated to improve species distribution models using low-structure data sources [46]. We calculated the area of each accessible area in square meters using the area function in the R package raster [47] and retained all data points if a species’ accessible area was less than 100,000 km2. If a species had an accessible area ≥100,000 km2 and <250,000 km2, we only retained one occurrence record per 25 km grid; if accessible area was ≥250,000 km2 and <1,000,000 km2, one record per 50 km grid was retained; if accessible area was ≥1,000,000 km2 and <2,500,000 km2, one record per 100 km grid was retained; if accessible area was ≥2,500,000 km2, one record per 200 km grid was retained. Even with thinning, there were still issues with data biases, requiring further efforts to tune model outputs, as discussed below.
After generating species-specific accessible areas and spatially thinning occurrence records, we fit an initial Maxent model [48] using default settings in the dismo package in R [49]. Maxent uses a machine learning algorithm to fit relationships between species occurrence records and background samples to environmental predictors [50]. Our initial model included 13 of the 19 bioclimatic variables provided by WorldClim (Table 1) [51]. These initial 13 variables were chosen to reduce multicollinearity in our initial model, while still including a number of bioclimatic variables we expect to be important to the ecological niche of Odonata. Initial bioclimatic variables had a spatial resolution of 30 s (~900 m at the equator) and were aggregated fivefold to the coarser resolution of approximately 4.5 km at the equator. Bioclimatic variables and occurrence records were reprojected to Lambert azimuthal equal area projection before analysis. To further avoid potentially problematic multicollinearity in our models, we calculated the variance inflation factors (VIF) of our initial model with all 13 bioclimatic variables [52]. If any predictor variable had a VIF >5, we removed the variable with the lowest permutation contribution to the model. We then fit a new Maxent model with default settings and repeated this step until no variables were retained in the model with a VIF greater than 5.
Using the species-specific predictor variables determined by following the above process, we next used the R package ENMeval [53] to quantitatively evaluate a suite of Maxent models with different tuning parameters in an effort to optimize model complexity and prevent overfitting. We fit models for every combination of tuning parameters with regularization multipliers of 0.5, 1, 2, 3, and 4 and feature classes of “linear”, “linear + quadratic”, “hinge”, “linear + quadratic + hinge”, “linear + quadratic + hinge + product”, and “linear + quadratic + hinge + product + threshold”. Block partitioning of five random partitions was used to partition occurrence and background localities into training and testing bins. The model with the lowest AICc value was selected as our top model if it had training and validation AUC values greater than 0.7. In the rare cases where training or validation AUCs were less than 0.7, our top model was selected as the model with the highest validation AUC. To select a threshold value to transform our predicted Maxent model into a binary (presence/absence) surface, we reclassified our predicted Maxent model surface into a binary surface based on five different thresholding values. These values were the zeroth, first, 2.5th, fifth, and 10th percentiles of the predicted SDM on a ClogLog scale. Given these five binary surfaces, we calculated the sensitivity (percentage of actual presences predicted) and specificity (percentage of actual pseudo-absences predicted) for reclassified surfaces, where pseudo-absences were randomly generated within the accessible area and the number of pseudo-absences matched the number of spatially thinned occurrence records. An adapted true skill statistic (Equation (1)) was calculated to find a thresholding value that balances type I and type II errors, although specificity was given one-third the weight of sensitivity given the presence-only nature of our occurrence records. The percentile value that led to the highest true skill statistic was selected as our final thresholding value and used to generate the predicted presence/absence distribution.
T S S = ( S e n s i t i v i t y + 1 3 × S e n s i t i v i t y ) 1 .
The top Maxent models and binary surfaces were mapped for each species and underwent expert evaluation by J.C.A. and C.B.S. Species with predicted distributions that did not pass expert evaluation were rerun after making custom changes to the modeling framework to improve predicted distributions. These custom changes included altering accessible areas, decreasing the number of background points for species with small accessible areas or few sample points, and altering the thresholding value. Altering threshold values was undertaken when there was clear evidence of over- or under-commission in model results.

2.5. Calculating Richness and Endemism

Predicted distributions were stacked for all species across their entire ranges, including areas outside of the Nearctic realm. Species richness and corrected weighted endemism (CWE) were calculated for each grid cell. Species richness here is defined as the number of species per cell. Weighted endemism (Equation (2)) uses a moving window analysis including the central cell and the eight neighboring cells to sum for each taxon t in the set of taxa T in the neighborhood, and the number of cells in the neighborhood containing taxon t (the local range, rt) divided by its range (Rt, the number of cells in which it is found). CWE is the quotient of weighted endemism (WE) divided by richness (Equation (3) [54]).
W E = t T r t R t .
C W E = W E R i c h n e s s .

3. Results

We found that each species had a custom combination of bioclimatic variables that best predicted the species distribution given our occurrence records and had variance inflation factors <5 (Table 1). Across all 509 species, the variables that had the highest permutation importance were the mean temperature of wettest quarter, mean diurnal range, annual mean temperature, temperature seasonality, and precipitation seasonality (Table 1).

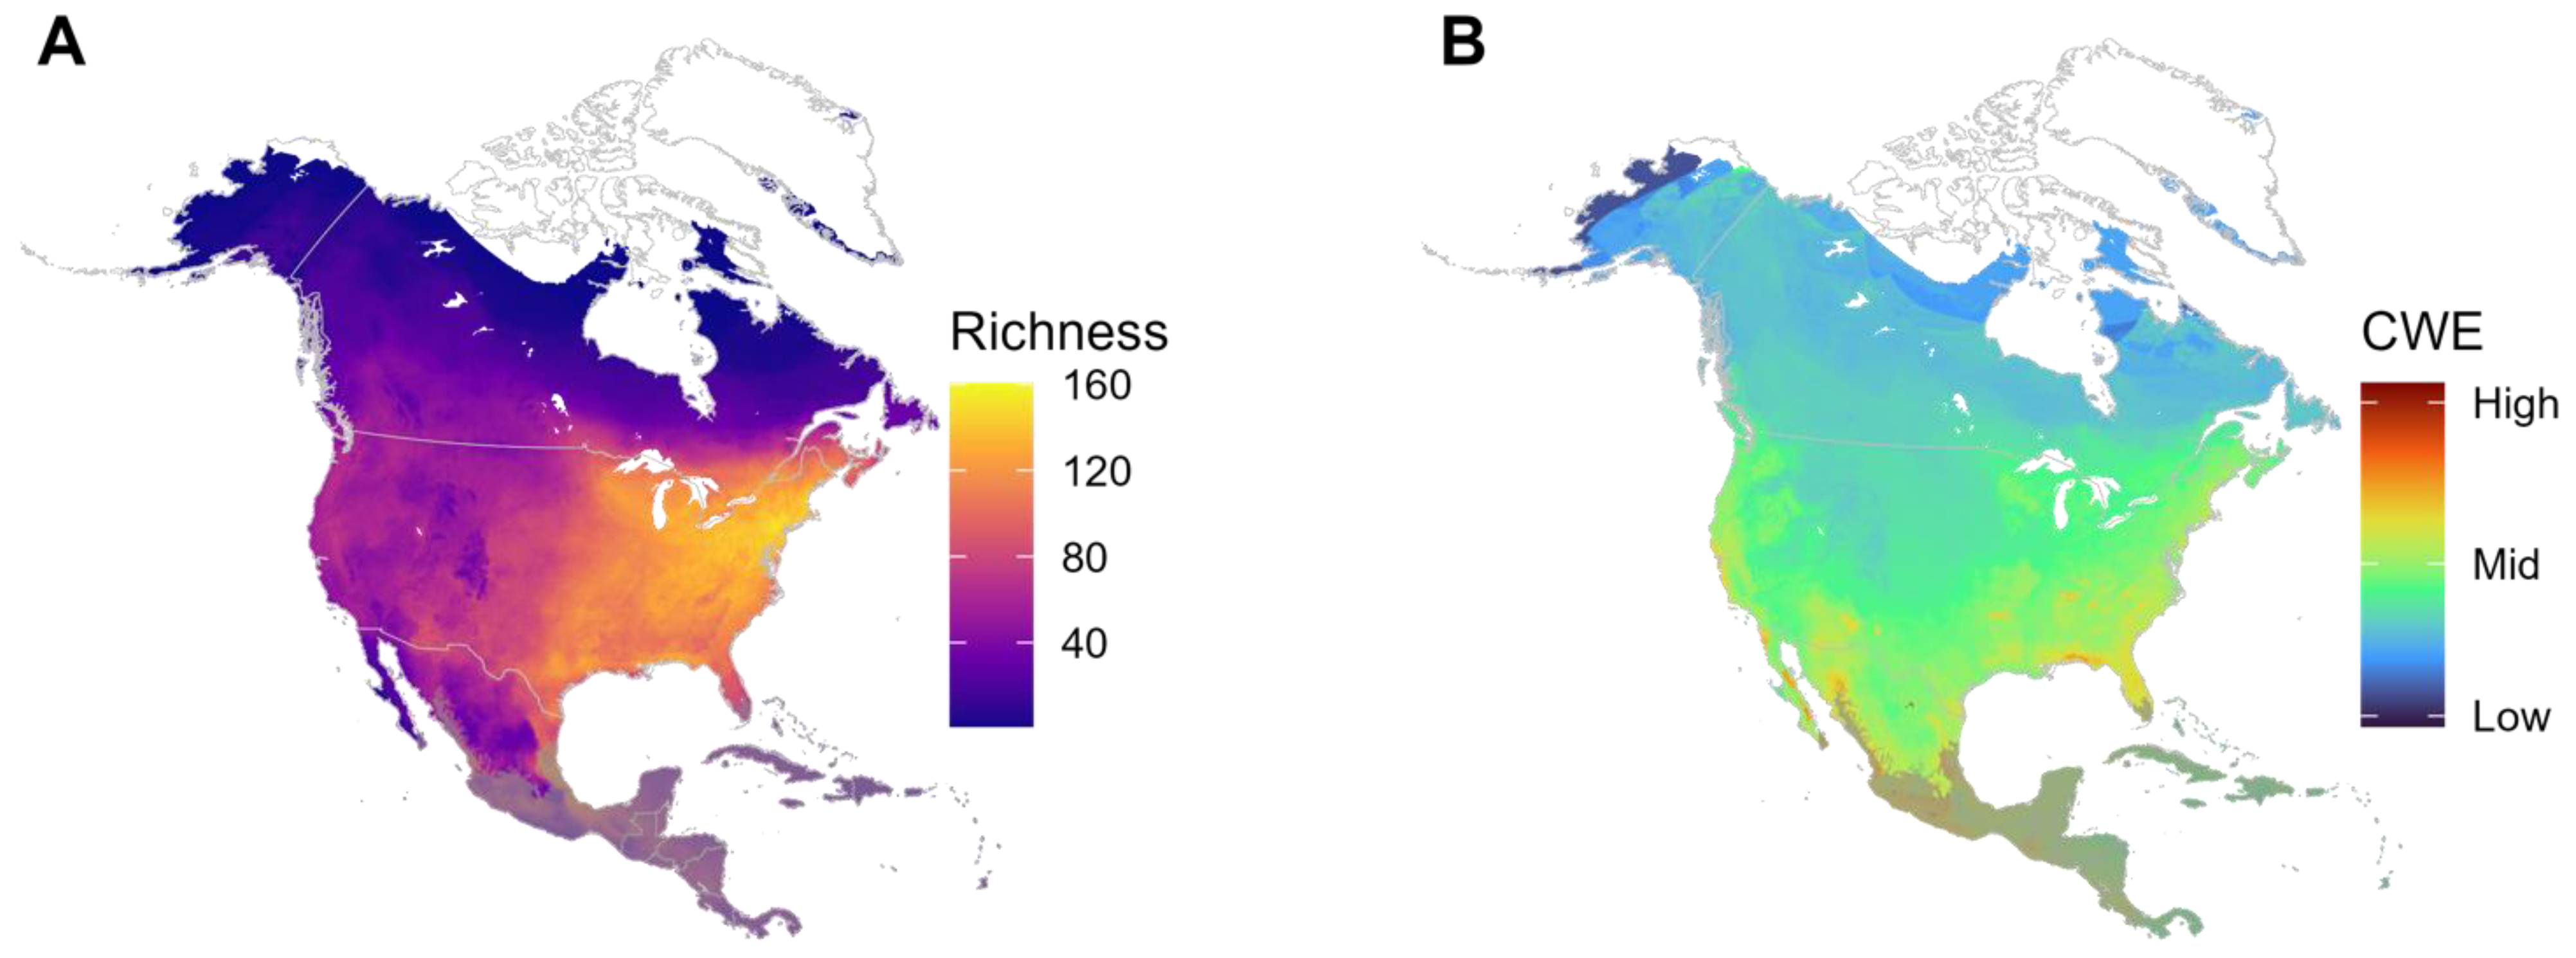
3.1. Richness and Corrected Weighted Endemism (CWE)

Among the 509 species recorded in the Nearctic, 77 reach the transition zone within the central Mexico mountains ranges, 119 species also occur in the Neotropics beyond the Mexican transition zone, eight are shared with the Palearctic region, and one species, Pantala flavescens, occurs in the tropical and subtropical areas on all continents except Antarctica. Crocothemis servilia is an invasive species which is widespread in Asia. In sum, a total of 303 species are fully unique to the Nearctic (Figure 1A, Supplementary Table S1).
Species richness increases in the eastern region. The deserts in northern Mexico and the Rocky Mountains are notable with low species richness. The greatest number of endemics occurs along the southeastern coastal regions and the Mexican transition zone (Figure 1B).

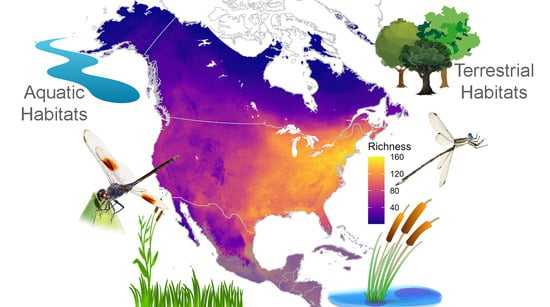
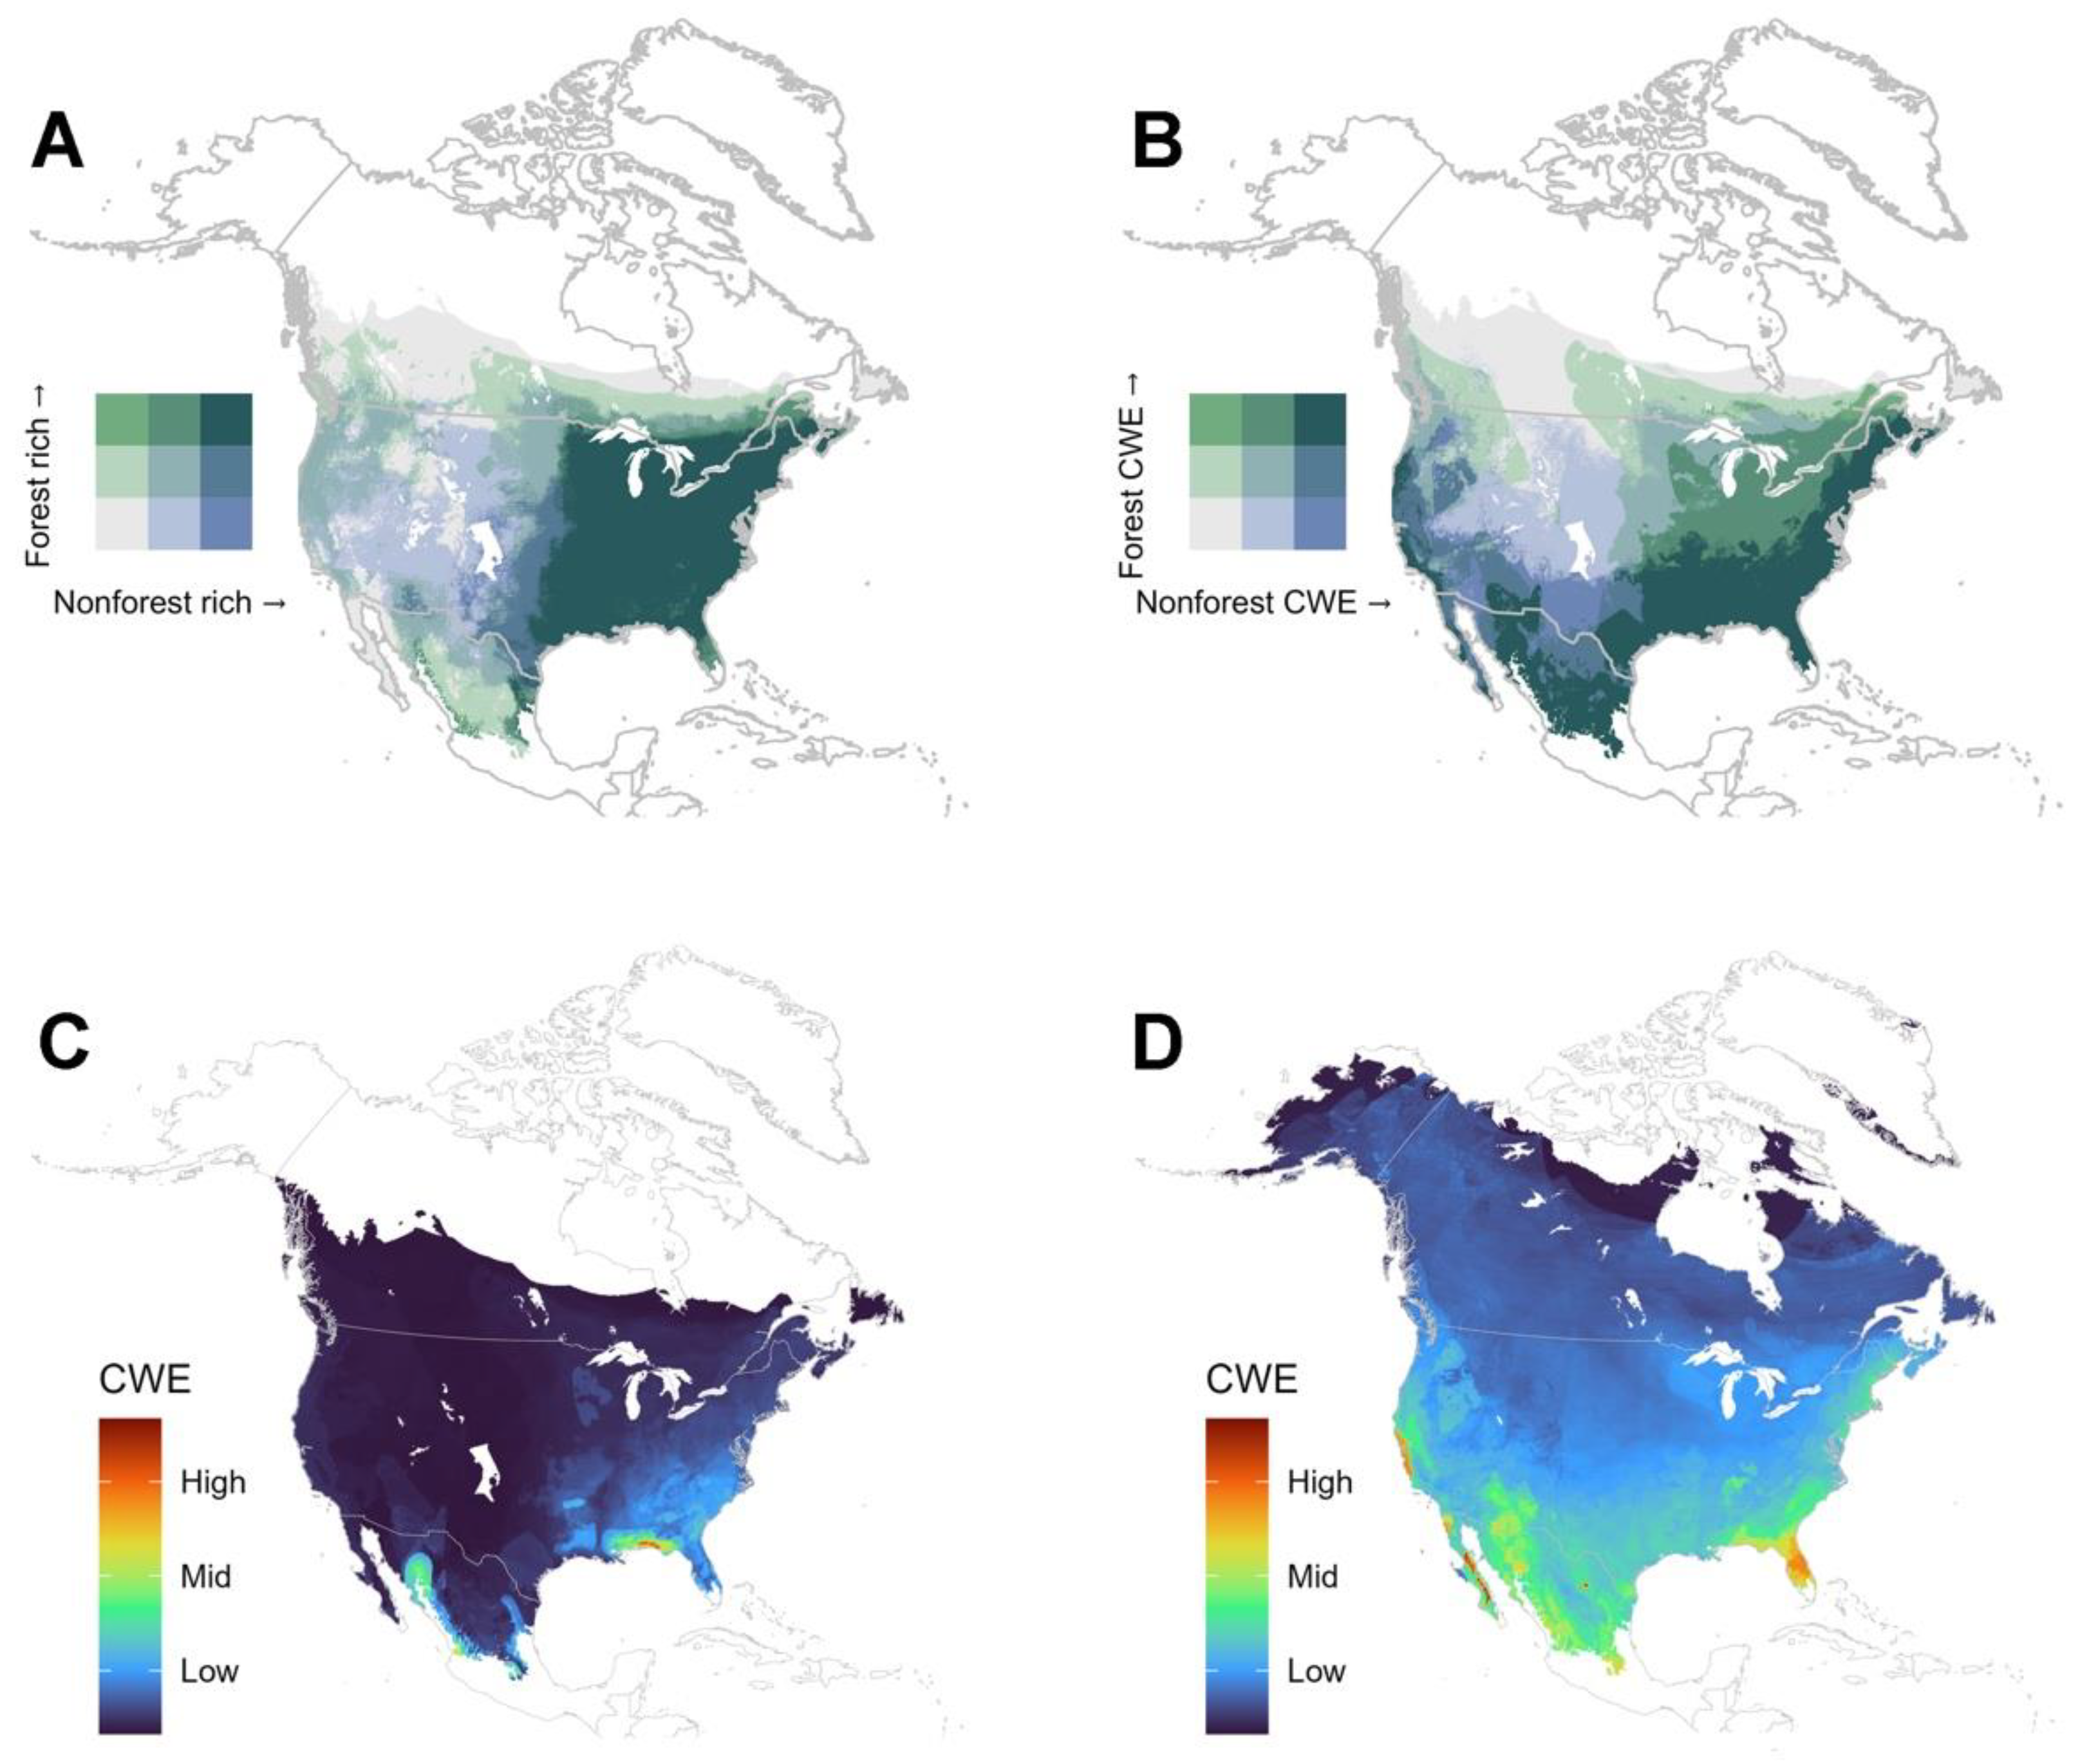
3.2. Richness and Endemism by Terrestrial and Aquatic Habitats

There are a total of 116 forest-dependent species (22.7%, see Supplementary Table S1). Most forest-dependent species belong to the families Gomphidae (35.4% of its species), Coenagrionidae (17.5%), and Corduliidae (37.3%), along with all the species in the families Platystictidae and Cordulegastridae. They are distributed throughout the Nearctic, but the highest diversity is found east of the 95° W meridian (Figure 2A). Forest-dependent species are also common in the southern part of the Nearctic along the Mexican transition zone and the southern forests of Canada (Figure 2A). There are 393 non-forest species, most of them in the families Libellulidae (95% of its species), Coenagrionidae (82.5%), Gomphidae (64.6%), and Aeshnidae (77.1%), with the families Lestidae and Macromiidae categorized as non-forest-dependent. CWE is higher for forest species in the northeast when compared to the non-forest species and higher for non-forest species in the west compared to forest species (Figure 2B). CWE for forest-dependent species is highest in the southeast (Figure 2C), whereas, for non-forest dependent species, it is highest in the southeast (central Florida) and California and Baja California in the west (Figure 2D).
There are 221 strictly lotic species in the Nearctic (43.4%, see Supplementary Table S1), most of them in the families Gomphidae (82.3% of its species) and Coenagrionidae (46.8%), with species in the families Calopterygidae, Macromiidae, and Platystictidae being strictly lotic. There are proportionately more lotic species than lentic in the Mexican plateau near the transition zone and in southern Canada (Figure 3A). There are 288 lentic species, most of them in the families Libellulidae (88.3% of its species), Coenagrionidae (53.2%), and Corduliidae (52.9%); the families Aeshnidae, Lestidae, and Petaluridae do not depend on lotic habitats in the Nearctic. There is an equal proportion of relative lotic CWE to lentic CWE in much of the eastern, southern, and western areas of the Nearctic (Figure 3B). CWE is highest for lentic species in the southeast (central Florida) and California and Baja California in the west (Figure 3C), whereas, for lotic-dependent species, it is highest in the southeast and Mexican transition zone (Figure 3D).
We found that forest-dependent species, on average, have smaller ranges than non-forest-dependent species (W = 14,122, p= 1.567 × 10⁻⁹, Figure 4A). Similarly, we found that lotic species, on average, have a smaller range than lentic species (W = 44,150, p = 2.347 × 10⁻¹⁵, Figure 4B).
Most families contained both forest and non-forest dependent species, as well as lentic and lotic-dependent species (Figure 5). The eight largest families (Aeshnidae, Calopterygidae, Coenagrionidae, Corduliidae, Gomphidae, Lestidae, Libellulidae, and Macromiidae) had species categorized as exclusively non-forest-dependent or had most of their species characterized as non-forest-dependent.
The Petaluridae and Lestidae were characterized as uniformly requiring lentic environments. The largest family, the Coenagrionidae, contained about half lentic-, half lotic-dependent species. Within the next two largest families, there were predominately lotic-dependent species (Gomphidae) or lentic-dependent species (Libellulidae). Further examination of shifts between lotic and lentic environments will require a more complete phylogeny for North American taxa.

3.3. Richness of Species According to IUCN Red List Category

Of the species found in the Nearctic, 10 are listed as data-deficient, six as vulnerable, seven as near-threatened, and three as endangered, while the majority, 482 species, are listed as least concern (Supplementary Table S1; Figure 6). Only Hetaerina calverti, a recently described species, is not yet assessed. The southeast and Mexican transition zone contain the majority of the endangered and data-deficient species (Figure 7).

3.4. Sampling Effort

Figure 8 shows the sampling effort and concentration across the Nearctic, where a high sampling effort can generally be observed except in Mexico, some places in the Rocky Mountains, parts of Canada, and Alaska. Some of the areas with the lowest sampling effort may indeed be areas where dragonflies are effectively absent; however, closing gaps via direct reporting of absences is still needed.

4. Discussion

4.1. General Diversity Patterns

The pattern of greater species richness in the eastern portion of the Nearctic (Figure 1A) can be explained by the higher aquatic habitat diversity at micro and macroscales east of the Rocky Mountains, promoting niche partitioning and specialization [55]. Much of the eastern portion of the Nearctic fauna may have benefitted from refuges for aquatic faunas being created by Pleistocene glaciation events, while extensive portions of western faunas were extirpated by glaciation [56,57,58]. This idea has not been directly tested, however, and deserves greater attention. Greater species richness in the east has been previously reported for Nearctic Odonata [20,56]. Higher species richness is also seen east of the Rocky Mountains within the Nearctic for other freshwater groups, e.g., rotifers, bivalves, amphipods, crayfish, fish, and turtles [59].
The southeastern US is home to the highest number of endemic dragonflies and damselflies in the Nearctic, likely due to glacial refuges, which provided a foundation for the evolution of a rich and unique biota in this area. The southeastern Nearctic is recognized as a hotspot of endemicity in groups such as turtles, fish, bivalves, gastropods, crayfish, and amphipods [57,58,60,61,62,63].
The greater topographical changes in the west have resulted in less aquatic habitat diversity than in the east [64,65], which is probably one of the main reasons for the lower species richness in these areas. Nonetheless, some species are unique to western Nearctic areas (Figure 1B). Similar distributions have been recorded in other aquatic insects, including stoneflies (Plecoptera) and caddisflies (Trichoptera), in which two clearly distinct components within the Nearctic fauna are observed: one in the east and one in the west [66,67,68]. The pattern is the opposite for butterflies and bumblebees, which do not depend on aquatic habitats and have the highest species richness in the western Nearctic [36,69], a mountainous region where plant diversity is also the highest [70].
We recognize that there is bias when using opportunistic naturalist occurrences (Odonata Central), as well as collection records from museums [71,72]. Most of the records are close to urbanized areas and roads, whereas some regions such as northern Mexico and northern Canada are clearly undersampled compared to the other Nearctic areas. Efforts toward closing these gaps should be conducted soon, especially in northern Mexico where new species have been found in recent years [73,74]. Nevertheless, we expect that the large-scale biodiversity pattern will not change significantly.
Compared to the Palearctic region (404 species), Odonate richness is similar, albeit with the whole of Europe supporting fewer than 140 species [75]. A number of freshwater groups show higher overall diversity in the Palearctic compared to the Nearctic, e.g., Ephemeroptera [76], Plecoptera [67], rotifers [55], gastropods [63], and amphipods [58]. The relative paucity, however, of freshwater vertebrate groups such as fish and turtles in the Palearctic, as compared to the Nearctic, is likely, in part, a result of the Pleistocene glaciations since there were more refugees in the Nearctic [57,61].
The composition of the Nearctic Odonate fauna is strongly influenced by Neotropical species. There is overlap in the Mexican transition zone with 23.4% of Nearctic species occurring in both the Nearctic and Neotropical realms. Outside of the Mexican transition zone, the shared species are mainly distributed along the coastal areas and the southeastern portion of the Nearctic.
Some species (e.g., Lestes dryas, Aeshna juncea, Aeshna subarctica, Somatochlora sahlbergi, and Libellula quadrimaculata) probably historically dispersed through the Bering Strait and are found in both the Palearctic and the Nearctic. They are mostly widely distributed within these areas or represent the northernmost-occurring Odonate species (e.g., Somatochlora sahlbergi), found north of the treeline. Pantala flavescens is probably the only species capable of consistent transoceanic dispersions without the aid of humans. Its amazing gliding abilities, together with a very fast larval cycle [77] and its adaptation to become dormant enabling it to survive drought conditions [78], make it the most widespread Odonata species in the world [79].
Outside of P. flavescens, probably only two species have crossed the Atlantic Ocean unaided by humans on more than a single occasion: Anax junius, native to the Nearctic which has not successfully reproduced in the Palearctic, and Anax ephippiger, native to Africa and southwest Asia, but with migrations spanning across Europe. Within the Neotropics, it has been found in the Lesser Antilles and French Guiana where it has successfully reproduced; it has, thus far, not been documented in the Nearctic.
In addition, Crocothemis servilia, a widespread Asian species, was first recorded in Florida in 1977 [80] and probably was carried as a nymph in the roots of aquarium plants (Buczynski and Bielak-Bielecki (2012) [81]); it is known as invasive in different countries. Ischnura hastata is one of the smallest species on the American continent. It is widespread in the Pacific and Caribbean Islands, and it occurs in both the Palearctic and the Neotropical realms. In the Palearctic, a population occurs on the Azores Islands within the Atlantic Ocean and is only composed of females where parthenogenetic reproduction occurs. It is thought that a gravid female was likely carried by wind to the islands and managed to survive the transatlantic flight [82,83].

4.2. Are There Differences in Diversity Patterns Shown by Forest and Non-Forest Species?

We classified 22.6% (115 species) as not being able to establish a population in the absence of forested habitat. The proportion of forest-dependent and non-forest-dependent species tends to be equal throughout much of the eastern Nearctic. This is explained by the greater diversity of Odonates throughout the east and this region supporting one of the largest areas of hardwood forests in the Nearctic. Heading westward, there is a greater proportion of non-forest-dependent species, many of which are wide-ranging with broad habitat requirements. Forest-dependent species are generally absent from the Great Plains and western Nearctic except for the Pacific Northwest, home to the only temperate rainforest in the west.
Northern Mexico is also home to a higher proportion of forest-dependent species which are largely Neotropical in origin. Northern Mexico is largely arid (except the Cuatro Cienagas area, which stands out for its high biodiversity [15]) and is known for a low species richness. However, forested areas within the zone run along the river margins and support a larger number of habitat restricted specialists. The area is also under-sampled compared to the rest of the Nearctic.
We found that non-forest-dependent species generally have larger range sizes than forest-dependent species, similar to the pattern reported in the tropical Andes, where non-forest species occupy larger elevation ranges compared to forest-dependent species [84]. This is likely due to forest-dependent species being more specialized [41,42,43] than open-area species which can reproduce in a wide variety of broadly available habitats.

4.3. Are There Differences in Diversity Patterns Shown by Lotic and Lentic Species?

We classified 43.4% (221 species) as unable to have lasting populations in the absence of a lotic habitat. The proportion of lotic-dependent species tends to be higher than the lentic species in the arid southwest and mountain areas in northern Mexico and some areas in the west. Most of the lentic environments in these regions are ephemeral [85], which does not favor the establishment of most Odonate species needing permanent water bodies to complete their life cycle [86]. There is an increase in the proportion of lentic species in Florida and in the Pacific northwest, likely due to the predominance of wetlands in these regions.
We found that lentic species generally have larger range sizes than lotic-dependent ones (Figure 5). Moreover, most of the species that are shared between the Nearctic and other realms (e.g., Neotropical and Palearctic) are lentic. These observations align with Hof et al. (2006) who analyzed latitudinal ranges for Odonates occurring in Europe and North America and hypothesized that lentic bodies of water are likely more ephemeral, thus favoring species with more effective dispersal abilities; as a result, lentic species would have larger ranges.
In the east, where the highest number of species occurs, the proportion of lentic and lotic species is similar, but there are still some areas where lentic endemicity is higher. Most of the species endemicity is in the southern area of the Nearctic toward coastlines, where the proportion of lotic and lentic endemic species is similar throughout most of the area, aligning with the glacial refugia explanation. Lotic CWE is proportionally higher in the mountainous regions of northern Mexico and the Rockies, where the overall lotic species richness is also higher than the lentic species richness.

4.4. Are There Areas with Relatively High Endemism?

The general pattern of CWE reveals hotspots in the southeast and west coast extending southward into Baja California and northern Mexico, extending northward into the southwestern United States (Figure 1B). The areas of highest CWE for both forest-dependent and non-forest-dependent species is in the extreme southeastern portion of the Nearctic (Figure 2C,D) along the surrounding areas of the Gulf Coast of Mexico, likely a result of refugia that resulted from the Pleistocene glaciation [56]. Non-forest-dependent CWE is highest in central Florida or the southeasternmost portion of the Nearctic and a result of species “spillover” from Caribbean Islands and northern expansion of the tropical Mexican fauna. Other areas of high CWE for non-forest-dependent species are found along the coastline of California and southward into Baja California. The former is due to low species richness (only 51 species known along the central coastline) and a relatively high proportion (10 species) with a restricted range in that area. Range-restricted species in Baja California are remnant northern extensions of the Neotropical fauna.
CWE for lentic- and lotic-dependent species shows a similar pattern to forest- and non-forest-dependent species with hotspots occurring in the southeast and northern Mexico (Figure 3C,D). This is expected, because most species that have limited ranges are associated with lotic environments which are, in turn, generally found in forested areas, and, as discussed previously, in the Nearctic, these refugial habitats are found in the southeast. The Cuatro Ciénegas Basin in north central Mexico is a particular hotspot for lotic species (Figure 3D). It is a protected nature reserve supporting inflowing rivers and streams, as well as pools providing unique aquatic habitats for Odonates.

4.5. Are There Areas with a Relatively High Percentage of Globally Threatened Species?

The areas of highest globally threatened species (Figure 7) correspond to areas of high CWE, which is no surprise given that range size is a key criterion used for the assessment of the Odonate species in the IUCN red list, and that data on the population dynamics are available for very few species [87]. As expected, most of the endangered species are found principally in the southeast. Within the Nearctic, there are three species ranked by the IUCN Red List as endangered (Cordulegaster sarracenia, Ischnura gemina, and Libellula coahuiltecana); two of them inhabit lentic environments in non-forested areas and one is found in lotic forested habitats. Six additional species listed as vulnerable (Argia rudolphi, Leptobasis melinogaster, Libellula jesseana, Phanogomphus sandrius, Progomphus lambertoi, and Stylurus potulensis), and seven additional species are assessed as near-threatened (Nehalennia pallidula, Ophiogomphus acuminatus, Ophiogomphus australis, Ophiogomphus edmundo, Phanogomphus hodgesi, Phanogomphus westfalli, and Somatochlora ozarkensis). Of these 16 species, half belong to the family Gomphidae; eight are forest-dependent and eight are lotic-dependent. Eleven species are found in the southeast, and, of the remaining three, one is restricted to the central west coast of California and two are restricted to the northern Mexican area. Exploration of less sampled areas in northern Mexico especially may lead to discovery of range-restricted species given the existing evidence of endemism and relative paucity of sampling compared to most other regions. This area certainly deserves more collection focus and has already yielded the discovery of new species [73,74,88].

5. Conclusions

Evaluating the aquatic life cycle and requirements of dragonflies and damselflies along with the recent geological history is key to understanding their diversity distribution patterns in the Nearctic. As aquatic insects, Pleistocene glaciations likely strongly constrain Odonate distributions to refugia mainly found in the southeast. These refugia also likely served as dispersal corridors for Neotropical species through the Caribbean Islands and Central America. These long-term areas of ample aquatic habitat, including today, serve as a major driver for Odonate diversity. Nevertheless, further work utilizing phylogenetic tools can provide an even sharper view of historical forces shaping current Nearctic diversity.
Terrestrial habitats are also important for Odonate distribution, with forest specialized species occupying smaller geographic ranges compared with non-specialists. Nevertheless, this pattern is different from that observed in strictly terrestrial insects such as butterflies and bumblebees, which are tied to plants. In these groups the diversity increases along with plant diversity in mountainous areas. Odonates do not follow this pattern, probably because they are hunters, and their specialization in forest habitats depends more on the structure of the vegetation (e.g., open-understory and thick-branched habitats), rather than on the diversity of the plant species.

Supplementary Materials

The following supporting information can be downloaded at https://0-www-mdpi-com.brum.beds.ac.uk/article/10.3390/d14070575/s1: Supplementary Table S1. List of the Odonata species recorded in the Nearctic, with their IUCN conservation status, their terrestrial and aquatic habitat, and the biogeographic realms where they occur. En: endangered, LC: least concern, NA: not assessed, NT: near-threatened, Vu: vulnerable. The table is also available at (https://0-doi-org.brum.beds.ac.uk/10.5281/zenodo.6544045 (accessed on 13 July 2022).

Author Contributions

Conceptualization, J.C.A., C.A.B.-S., R.G., V.K. and S.B.; methodology, J.C.A., C.A.B.-S., R.G., V.K. and S.B.; software, R.G. and M.W.B.; validation, J.C.A., C.A.B.-S., E.G.-S. and R.N.-G.; formal analysis, J.C.A., C.A.B.-S., R.G. and M.W.B.; data curation, J.C.A., C.A.B.-S., E.G.-S. and R.N.-G.; writing—original draft preparation, J.C.A., C.A.B.-S., R.G., V.K., E.G.-S., R.N.-G. and M.W.B.; writing—review and editing, J.C.A., C.A.B.-S., R.G., V.K., E.G.-S., R.N.-G., S.B., J.W. and M.W.B.; project administration, J.C.A., R.G., S.B. and J.W.; funding acquisition, J.C.A., R.G., S.B. and J.W. All authors contributed critically to the drafts and gave final approval for publication. All authors have read and agreed to the published version of the manuscript.

Funding

This work was supported by NSF Awards (Abbott: 2002489; Ware: 2002473; Bybee: 2002432; Guaralnick: 2002457), Genealogy of Odonata (GEODE): Dispersal and color as drivers of 300 million years of global dragonfly evolution.

Institutional Review Board Statement

Not applicable.

Informed Consent Statement

Not applicable.

Data Availability Statement

Data are provided in the paper and Supplementary Table S1. The composite richness and endemism values for each cell (released as GeoTIFF), the composite richness and endemism values for each cell broken out by trait (lentic, lotic, forest, and non-forest; released as 4 CSVs), and the species-specific SDMs showing the predicted areas of presence for each species (released as seven zip files) are available from a Zenodo repository (https://0-doi-org.brum.beds.ac.uk/10.5281/zenodo.6544045 (accessed on 13 July 2022)).

Acknowledgments

We are grateful to Rosser Garrison and Natalia von Ellenrieder for sharing their distributional database for Odonates. Bill Mauffray shared the database for specimens in the FSCA.

Conflicts of Interest

The authors declare no conflict of interest.

References

  1. Hagen, H.A. Synopsis of the Odonata of America. Proc. Boston Soc. Nat. Hist. 1875, 18, 20–96. [Google Scholar]
  2. Needham, J.G.; Westfall, M.J.; May, M. Dragonflies of North America: The Odonata (Anisoptera) Fauna of Canada, the Continental United States, Northern Mexico and the Greater Antilles; Scientific Publishers: Singapore, 2014. [Google Scholar]
  3. Davis, J. Dragon Flies: The Fascinating World of Odonata in Art, Culture and Religion; 2011. [Google Scholar]
  4. Hillerman, T. The Boy Who Made Dragonfly, 2nd ed.; University of New Mexico Press: Albuquerque, NM, USA, 1986. [Google Scholar]
  5. Fincke, O.M. Sperm Competition in the Damselfly Enallagma Hageni Walsh (Odonata: Coenagrionidae): Benefits of Multiple Mating to Males and Females. Behav. Ecol. Sociobiol. 1984, 14, 235–240. [Google Scholar] [CrossRef]
  6. Garrison, R. A Synopsis of the Genus Argia of the United States with Keys and Descriptions of New Species, Argia sabino, A. leonorae, and A. pima (Odonata: Coenagrionidae). Trans. Am. Entomol. Soc. 1994, 120, 287–368. [Google Scholar]
  7. May, M. Simultaneous Control of Head and Thoracic Temperature by the Green Darner Dragonfly Anax junius (Odonata: Aeshnidae). J. Exp. Biol. 1995, 198, 2373–2384. [Google Scholar] [CrossRef] [PubMed]
  8. Ware, J.; May, M.; Kjer, K. Phylogeny of the Higher Libelluloidea (Anisoptera: Odonata): An Exploration of the Most Speciose Superfamily of Dragonflies. Mol. Phylogenet. Evol. 2007, 45, 289–310. [Google Scholar] [CrossRef] [PubMed]
  9. Dunkle, S.W. Dragonflies through Binoculars: A Field Guide to Dragonflies of North America; Oxford University Press: New York, NY, USA, 2000. [Google Scholar]
  10. Tennessen, K.J. Dragonfly Nymphs of North America: An Identification Guide; Springer: Berlin, Germany, 2019. [Google Scholar]
  11. Upson, S.; Danforth, D.; Gonzalez-Soriano, E.; Behrstock, R.A.; Bailowitz, R.A. A Preliminary Checklist of the Odonata of Sonora, Mexico. Bull. Am. Odonatol. 2007, 10, 23–51. [Google Scholar]
  12. Cuevas-Yañez, K. Los Odonatos (Insecta: Odonata) de La Hidroeléctrica de Patla (El Pozo) y del Río Tecpatlán, Zihuateutla, Puebla, México. Dugesiana 2007, 14, 83–91. [Google Scholar]
  13. Escoto-Moreno, J.A.; Novelo-Gutiérrez, R.; Sigala-Rodríguez, J.; Escoto-Rocha, J.; Carrillo-Lara, D.E.; Reynoso-Velasco, D. First Records of Odonata from Zacatecas State, Mexico. Not. Odonatol. 2015, 8, 151–155. [Google Scholar]
  14. Novelo-Gutiérrez, R.; Gonzalez-Soriano, E. Odonata de La Reserva de La Biosfera La Michilia, Durango, Mexico. Parte II. Nayades. Folia Entomol. Mex. 1991, 164, 107–164. [Google Scholar]
  15. Ortega-Salas, H.; Gonzalez-Soriano, E. Odonata of the Cuatro Ciénegas Basin. In Animal Diversity and Biogeography of the Cuatro Ciénegas Basin; Álvarez, F., Ojeda, M., Eds.; Springer: Berlin, Germany, 2019; pp. 117–128. ISBN 978-3-030-11261-5. [Google Scholar]
  16. Cuevas–Yañez, K.; Espinosa–Rivera, J.C.; Martínez–Falcón, A.P.; Córdoba–Aguilar, A. Are All Mexican Odonate Species Documented? An Assessment of Species Richness. Syst. Biodivers. 2017, 15, 253–258. [Google Scholar] [CrossRef]
  17. Escalante, T.; Morrone, J.J. Toward a Biogeographic Regionalization of the Nearctic Region: Area Nomenclature and Digital Map. Zootaxa 2021, 5027, 351–375. [Google Scholar] [CrossRef] [PubMed]
  18. Halffter, G.; Morrone, J.J. An Analytical Review of Halffter’s Mexican Transition Zone, and Its Relevance for Evolutionary Biogeography, Ecology and Biogeographical Regionalization. Zootaxa 2017, 4226, 1–46. [Google Scholar] [CrossRef] [PubMed]
  19. Morrone, J.J. The Mexican Transition Zone; Springer: Cham, Switzerland, 2020; ISBN 9783030479169. [Google Scholar]
  20. Paulson, D.R.; Dunkle, S.W. A Checklist of North American Odonata: Including English Name, Etymology, Type Locality, and Distribution. 2012 Edition. Occas. Pap. Slater Museum Nat. Hist. 2021, 56, 1–86. [Google Scholar]
  21. Bailowitz, R.; Danforth, D.; Upson, S. A Field Guide to the Dragonflies & Damselflies of Arizona and Sonora; Nova Granada Publications: Tucson, AZ, USA, 2015. [Google Scholar]
  22. Paulson, D.R. Dragonflies and Damselflies of the West; Princeton University Press: Princeton, NJ, USA, 2009. [Google Scholar]
  23. Paulson, D.R. Dragonflies and Damselflies of the East.; Princeton University Press: Princeton, NJ, USA, 2011. [Google Scholar]
  24. González-Soriano, E.; Novelo-Gutiérrez, R. Odonata. In Biodiversidad, Taxonomia y Biogeografia de Artropodos de Mexico: Hacia una Sintesis de Su Conocimiento; Llorente-Bousquets, J., Garcia-Aldrete, A.N., González-Soriano, E., Eds.; Facultad de Ciencias UNAM: México City, Mexico, 1996; pp. 147–167. [Google Scholar]
  25. González-Soriano, E.; Novelo-Gutiérrez, R. Odonata of Mexico revisited. In Odonata: Biology of Dragonflies; Tyagi, B.K., Ed.; Scientific Publishers: Jodhpur, India, 2007; pp. 105–136. [Google Scholar]
  26. Abbott, J.C. Odonata Central. Available online: http://www.odonatacentral.org (accessed on 3 February 2022).
  27. IUCN. The IUCN Red List of Threatened Species. Available online: https://www.iucnredlist.org (accessed on 2 March 2022).
  28. Olson, D.M.; Dinerstein, E.; Wikramanayake, E.D.; Burgess, N.D.; Powell, G.V.N.; Underwood, E.C.; D’amico, J.A.; Itoua, I.; Strand, H.E.; Morrison, J.C.; et al. Terrestrial Ecoregions of the World: A New Map of Life on Earth. Bioscience 2001, 51, 933. [Google Scholar] [CrossRef]
  29. Behrstock, R.A.; Danforth, D.; Upson, S. A List of the Odonata of Chihuahua State, Mexico, Including New State Records and the First Mexican Record of Argia Alberta, Kennedy, 1918. Bull. Am. Odonatol. 2007, 10, 52–63. [Google Scholar]
  30. Calvert, P.P. Odonata. In Biologia Centrali Americana: Insecta Neuroptera; R. Porter & Dulau Co.: London, UK, 1892–1908; pp. 17–420. [Google Scholar]
  31. Calvert, P.P. Contributions to a Knowledge of the Odonata of the Neotropical Region, Exclusive of Mexico and Central America. Ann. Carnegie Museum 1909, 6, 73–280. [Google Scholar]
  32. González-Soriano, E.; Noguera, F.A.; Zaragoza-Caballero, S.; Ramírez-García, E. Odonata de un Bosque Tropical Caducifolio: Sierra de San Javier, Sonora, México. Rev. Mex. Biodivers. 2009, 80, 341–348. [Google Scholar] [CrossRef]
  33. Gonzalez-Soriano, E.; Novelo-Gutiérrez, R. Odonata de La Reserva de La Biosfera de La Michilia, Durango, Mexico. Parte I. Imagos. Folia Entomol. Mex. 1991, 105, 67–105. [Google Scholar]
  34. Escoto-Moreno, J.A.; Márquez, J.; Novelo-Gutiérrez, R. Los Odonatos (Insecta: Odonata) Del Estado de Hidalgo, México: Situación Actual y Perspectivas. Rev. Mex. Biodivers. 2014, 85, 1043–1053. [Google Scholar] [CrossRef] [Green Version]
  35. Google Earth Pro 2021.
  36. Earl, C.; Belitz, M.W.; Laffan, S.W.; Barve, V.; Barve, N.; Soltis, D.E.; Allen, J.M.; Soltis, P.S.; Mishler, B.D.; Kawahara, A.Y.; et al. Spatial Phylogenetics of Butterflies in Relation to Environmental Drivers and Angiosperm Diversity across North America. iScience 2021, 24, 102239. [Google Scholar] [CrossRef]
  37. Zizka, A.; Silvestro, D.; Andermann, T.; Azevedo, J.; Duarte Ritter, C.; Edler, D.; Farooq, H.; Herdean, A.; Ariza, M.; Scharn, R.; et al. CoordinateCleaner: Standardized Cleaning of Occurrence Records from Biological Collection Databases. Methods Ecol. Evol. 2019, 10, 744–751. [Google Scholar] [CrossRef]
  38. Calabrese, J.M.; Certain, G.; Kraan, C.; Dormann, C.F. Stacking Species Distribution Models and Adjusting Bias by Linking Them to Macroecological Models. Glob. Ecol. Biogeogr. 2014, 23, 99–112. [Google Scholar] [CrossRef]
  39. R Core Team. R: A Language and Environment for Statistical Computing; R Foundation for Statistical Computing: Vienna, Austria, 2019. [Google Scholar]
  40. Hof, C.; Brändle, M.; Brandl, R. Lentic Odonates Have Larger and More Northern Ranges than Lotic Species. J. Biogeogr. 2006, 33, 63–70. [Google Scholar] [CrossRef]
  41. Corbet, P.S. Forests as habitats for dragonflies (Odonata). In Forests and Dragonflies; Cordero-Rivera, A., Ed.; Pensoft: Sofia, Bulgaria; Moscow, Russia, 2006; pp. 13–35. [Google Scholar]
  42. Sahlén, G. Specialists vs. generalists among dragonflies—The importance of forest environments in the formation of diverse species pools. In Forests and Dragonflies; Cordero-Rivera, A., Ed.; Pensoft: Sofia, Bulgaria; Moscow, Russia, 2006; pp. 153–179. [Google Scholar]
  43. Bota-Sierra, C.A.; García-Robledo, C.; Escobar, F.; Novelo-Gutiérrez, R.; Londoño, G.A. Environment, Taxonomy and Morphology Constrain Insect Thermal Physiology along Tropical Mountains. Funct. Ecol. 2022. early view. [Google Scholar] [CrossRef]
  44. Davis Rabosky, A.R.; Cox, C.L.; Rabosky, D.L.; Title, P.O.; Holmes, I.A.; Feldman, A.; McGuire, J.A. Coral Snakes Predict the Evolution of Mimicry across New World Snakes. Nat. Commun. 2016, 7, 11484. [Google Scholar] [CrossRef]
  45. Barve, N.; Barve, V.; Jiménez-Valverde, A.; Lira-Noriega, A.; Maher, S.P.; Peterson, A.T.; Soberón, J.; Villalobos, F. The Crucial Role of the Accessible Area in Ecological Niche Modeling and Species Distribution Modeling. Ecol. Modell. 2011, 222, 1810–1819. [Google Scholar] [CrossRef]
  46. Steen, V.A.; Elphick, C.S.; Tingley, M.W. An Evaluation of Stringent Filtering to Improve Species Distribution Models from Citizen Science Data. Divers. Distrib. 2019, 25, 1857–1869. [Google Scholar] [CrossRef]
  47. Hijmans, R.J. Package ‘Raster’—Geographic Data Analysis and Modeling; CRAN Repos, 2019. Available online: https://rspatial.org/raster (accessed on 10 May 2022).
  48. Phillips, S.J.; Anderson, R.P.; Dudík, M.; Schapire, R.E.; Blair, M.E. Opening the Black Box: An Open-Source Release of Maxent. Ecography 2017, 40, 887–893. [Google Scholar] [CrossRef]
  49. Hijmans, R.J.; Phillips, S.; Leathwick, J.; Elith, J. Dismo: Species Distribution Modeling; R Package Version 1.1-4; Cran. 2017. Available online: https://cran.r-project.org/web/packages/dismo/dismo.pdf (accessed on 10 May 2022).
  50. Merow, C.; Smith, M.J.; Silander, J.A. A Practical Guide to MaxEnt for Modeling Species’ Distributions: What It Does, and Why Inputs and Settings Matter. Ecography 2013, 36, 1058–1069. [Google Scholar] [CrossRef]
  51. Fick, S.E.; Hijmans, R.J. WorldClim 2: New 1-Km Spatial Resolution Climate Surfaces for Global Land Areas. Int. J. Climatol. 2017, 37, 4302–4315. [Google Scholar] [CrossRef]
  52. Naimi, B.; Hamm, N.A.S.; Groen, T.A.; Skidmore, A.K.; Toxopeus, A.G. Where Is Positional Uncertainty a Problem for Species Distribution Modelling? Ecography 2014, 37, 191–203. [Google Scholar] [CrossRef]
  53. Kass, J.M.; Muscarella, R.; Galante, P.J.; Bohl, C.L.; Pinilla-Buitrago, G.E.; Boria, R.A.; Soley-Guardia, M.; Anderson, R.P. ENMeval 2.0: Redesigned for Customizable and Reproducible Modeling of Species’ Niches and Distributions. Methods Ecol. Evol. 2021, 12, 1602–1608. [Google Scholar] [CrossRef]
  54. González-Orozco, C.E.; Laffan, S.W.; Miller, J.T. Spatial Distribution of Species Richness and Endemism of the Genus Acacia in Australia. Aust. J. Bot. 2011, 59, 601–609. [Google Scholar] [CrossRef]
  55. Segers, H. Global Diversity of Rotifers (Rotifera) in Freshwater. Hydrobiologia 2008, 595, 49–59. [Google Scholar] [CrossRef]
  56. Kalkman, V.J.; Clausnitzer, V.; Dijkstra, K.D.B.; Orr, A.G.; Paulson, D.R.; Van Tol, J. Global Diversity of Dragonflies (Odonata) in Freshwater. Hydrobiologia 2008, 595, 351–363. [Google Scholar] [CrossRef]
  57. Lévêque, C.; Oberdorff, T.; Paugy, D.; Stiassny, M.L.J.; Tedesco, P.A. Global Diversity of Fish (Pisces) in Freshwater. Hydrobiologia 2008, 595, 545–567. [Google Scholar] [CrossRef]
  58. Väinölä, R.; Witt, J.D.S.; Grabowski, M.; Bradbury, J.H.; Jazdzewski, K.; Sket, B. Global Diversity of Amphipods (Amphipoda; Crustacea) in Freshwater. Hydrobiologia 2008, 595, 241–255. [Google Scholar] [CrossRef]
  59. Balian, E.V.; Segers, H.; Lévèque, C.; Martens, K. The Freshwater Animal Diversity Assessment: An Overview of the Results. Hydrobiologia 2008, 595, 627–637. [Google Scholar] [CrossRef]
  60. Bogan, A.E. Global Diversity of Freshwater Mussels (Mollusca, Bivalvia) in Freshwater. Hydrobiologia 2008, 595, 139–147. [Google Scholar] [CrossRef]
  61. Bour, R. Global Diversity of Turtles (Chelonii; Reptilia) in Freshwater. Hydrobiologia 2008, 595, 593–598. [Google Scholar] [CrossRef]
  62. Crandall, K.A.; Buhay, J.E. Global Diversity of Crayfish (Astacidae, Cambaridae, and Parastacidae—Decapoda) in Freshwater. Hydrobiologia 2008, 595, 295–301. [Google Scholar] [CrossRef]
  63. Strong, E.E.; Gargominy, O.; Ponder, W.F.; Bouchet, P. Global Diversity of Gastropods (Gastropoda; Mollusca) in Freshwater. Hydrobiologia 2008, 595, 149–166. [Google Scholar] [CrossRef]
  64. Batzer, D.P.; Baldwin, A.H. Wetland Habitats of North America: Ecology and Conservation Concerns; University of California Press: Berkley, CA, USA, 2012. [Google Scholar]
  65. Rey, J.R.; Walton, W.E.; Wolfe, R.J.; Roxanne, C.; O’Connell, S.M.; Berg, J.; Sakolsky-Hoopes, G.E.; Laderman, A.D. North American Wetlands and Mosquito Control. Int. J. Environ. Res. Public Health 2012, 9, 4537–4605. [Google Scholar] [CrossRef]
  66. Stewart, K.W.; Stark, B.P. Nymphs of North American Stonefly Genera (Plecoptera); The Caddis Press: Columbus, OH, USA, 2002. [Google Scholar]
  67. Fochetti, R.; Tierno De Figueroa, J.M. Global Diversity of Stoneflies (Plecoptera; Insecta) in Freshwater. Hydrobiologia 2008, 595, 365–377. [Google Scholar] [CrossRef]
  68. De Moor, F.C.; Ivanov, V.D. Global Diversity of Caddisflies (Trichoptera: Insecta) in Freshwater. Hydrobiologia 2008, 595, 393–407. [Google Scholar] [CrossRef]
  69. Williams, P.H. Mapping Variations in the Strength and Breadth of Biogeographic Transition Zones Using Species Turnover. Proc. R. Soc. B Biol. Sci. 1996, 263, 579–588. [Google Scholar] [CrossRef]
  70. Mishler, B.D.; Guralnick, R.; Soltis, P.S.; Smith, S.A.; Soltis, D.E.; Barve, N.; Allen, J.M.; Laffan, S.W. Spatial Phylogenetics of the North American Flora. J. Syst. Evol. 2020, 58, 393–405. [Google Scholar] [CrossRef]
  71. Collins, S.D.; Abbott, J.C.; McIntyre, N.E. Quantifying the Degree of Bias from Using County-Scale Data in Species Distribution Modeling: Can Increasing Sample Size or Using County-Averaged Environmental Data Reduce Distributional Overprediction? Ecol. Evol. 2017, 7, 6012–6022. [Google Scholar] [CrossRef] [PubMed] [Green Version]
  72. Botella, C.; Joly, A.; Monestiez, P.; Bonnet, P.; Munoz, F. Bias in Presence-Only Niche Models Related to Sampling Effort and Species Niches: Lessons for Background Point Selection. PLoS ONE 2020, 15, e0232078. [Google Scholar] [CrossRef]
  73. Ortega-Salas, H.; González-Soriano, E. A New Species of Libellula Linnaeus, 1758, from the Cuatro Ciénegas Basin, Coahuila, México (Anisoptera: Libellulidae). Zootaxa 2015, 4028, 589–594. [Google Scholar] [CrossRef]
  74. Vega-Sánchez, Y.M.; Mendoza-Cuenca, L.F.; González-Rodríguez, A. Hetaerina Calverti (Odonata: Zygoptera: Calopterygidae) sp. Nov., a New Cryptic Species of the American Rubyspot Complex. Zootaxa 2020, 4766, 485–497. [Google Scholar] [CrossRef] [PubMed]
  75. Kalkman, V.J.; Boudot, J.-P.; Futahashi, R.; Abbott, J.C.; Bota-Sierra, C.A.; Guralnick, R.; Bybee, S.M.; Ware, J.L.; Belitz, M.W. Diversity of Palaearctic Dragonflies and Damselflies (Odonata). Diversity 2022. in preparation. [Google Scholar]
  76. Barber-James, H.M.; Gattolliat, J.L.; Sartori, M.; Hubbard, M.D. Global Diversity of Mayflies (Ephemeroptera, Insecta) in Freshwater. Hydrobiologia 2008, 595, 339–350. [Google Scholar] [CrossRef]
  77. Suhling, F.; Schenk, K.; Padeffke, T.; Martens, A. A Field Study of Larval Development in a Dragonfly Assemblage in African Desert Ponds (Odonata). Hydrobiologia 2004, 528, 75–85. [Google Scholar] [CrossRef]
  78. Van Damme, K.; Dumont, H.J. A Drought-Resistant Larva of Pantala flavescens (Fabricius, 1798) (Odonata: Libellulidae) in the Lençóis Maranhenses, NE-Brazil. Int. J. Odonatol. 1999, 2, 69–76. [Google Scholar] [CrossRef]
  79. Ware, J.; Kohli, M.K.; Mendoza, C.M.; Troast, D.; Jinguji, H.; Hobson, K.A.; Sahlén, G.; Anderson, R.C.; Suhling, F. Evidence for Widespread Gene Flow and Migration in the Globe Skimmer Dragonfly Pantala Flavescens. Int. J. Odonatol. 2022, 25, 43–55. [Google Scholar] [CrossRef]
  80. Paulson, D.R. An Asiatic Dragonfly, Crocothemis servilia (Drury), Established in Florida (Anisoptera: Libellulidae). Not. Odonatol. 1978, 1, 9–10. [Google Scholar]
  81. Buczyński, P.; Bielak-Bielecki, P. Crocothemis servilia (Drury, 1773) (Odonata: Libellulidae) Introduced with Aquarium Plants to Lublin (Poland). Ann. UMCS Biol. 2012, 67, 21–26. [Google Scholar] [CrossRef] [Green Version]
  82. Cordero Rivera, A.; Lorenzo Carballa, M.O.; Utzeri, C.; Vieira, V. Parthenogenetic Ischnura hastata (Say), Widespread in the Azores (Zygoptera: Coenagrionidae). Odonatologica 2005, 34, 1–9. [Google Scholar]
  83. Lorenzo-Carballa, M.O.; Beatty, C.D.; Utzeri, C.; Vieira, V.; Cordero-Rivera, A. Parthenogenetic Ischnura Hastata Revisited: Present Status and Notes on Population Ecology and Behaviour (Odonata: Coenagrionidae). Int. J. Odonatol. 2009, 12, 395–411. [Google Scholar] [CrossRef]
  84. Bota-Sierra, C.A.; Flórez-V, C.; Escobar, F.; Sandoval-H, J.; Novelo-Gutiérrez, R.; Londoño, G.A.; Cordero-Rivera, A. The Importance of Tropical Mountain Forests for the Conservation of Dragonfly Biodiversity: A Case from the Colombian Western Andes. Int. J. Odonatol. 2021, 24, 233–247. [Google Scholar] [CrossRef]
  85. Bogan, M.T.; Noriega-Felix, N.; Vidal-Aguilar, S.L.; Findley, L.T.; Lytle, D.A.; Gutiérrez-Ruacho, O.G.; Alvarado-Castro, J.A.; Varela-Romero, A. Biogeography and Conservation of Aquatic Fauna in Spring-Fed Tropical Canyons of the Southern Sonoran Desert, Mexico. Biodivers. Conserv. 2014, 23, 2705–2748. [Google Scholar] [CrossRef]
  86. Corbet, P.S. Dragonflies: Behaviour and Ecology of Odonata; Harley Books: Colchester, UK, 1999. [Google Scholar]
  87. Tognelli, M.F.; Lasso, C.A.; Bota-Sierra, C.A.; Jiménez-Segura, L.F.; Cox, N.A. Estado de Conservación y Distribución de la Biodiversidad de Agua Dulce en Los Andes Tropicales, 1st ed.; Tognelli, M.F., Lasso, C.A., Bota-Sierra, C.A., Jiménez-Segura, L.F., Cox, N.A., Eds.; IUCN: Gland, Switzerland; Cambridge, UK; Arlington, TX, USA, 2016; ISBN 9782831717913. [Google Scholar]
  88. González-Soriano, E. Leptobasis melinogaster spec. nov., a New Species from Mexico (Zygoptera: Coenagrionidae). Odonatologica 2002, 31, 181–185. [Google Scholar]
Figure 1. (A) Distribution of Odonata richness and (B) corrected weighted endemism (CWE) of Nearctic Odonates. Gray shading represents the Neotropical realm.
Diversity 14 00575 g001
Figure 2. Species richness and corrected weighted endemism for terrestrial habitats used by Odonate species in the Nearctic realm. (A) Bivariate plot showing distribution of richness for forest-dependent and non-forest-dependent species; (B) bivariate plot showing distribution of corrected weighted endemism (CWE) for forest-dependent and non-forest-dependent species; (C) corrected weighted endemism (CWE) for forest-dependent species; (D) corrected weighted endemism (CWE) for non-forest-dependent species.
Diversity 14 00575 g002
Figure 3. Species richness and corrected weighted endemism for aquatic habitats used by Odonate species in the Nearctic realm. (A) Bivariate plot showing distribution of richness for lotic-dependent and lentic species; (B) bivariate plot showing distribution of corrected weighted endemism (CWE) for lotic-dependent and lentic species; (C) corrected weighted endemism (CWE) for lentic-dependent species; (D) corrected weighted endemism (CWE) for lotic-dependent species.
Diversity 14 00575 g003
Figure 4. Range size (defined by the number of cells with predicted presence) for (A) lentic- and lotic-dependent Odonata species and (B) forest- and non-forest-dependent species.
Diversity 14 00575 g004
Figure 5. Species richness by family for forest- and non-forest-dependent species (above) and lentic- and lotic-dependent species (below).
Diversity 14 00575 g005
Figure 6. Terrestrial and aquatic habitats of the 24 species categorized as EN (endangered), VU (vulnerable), NT (near-threatened), and DD (data-deficient), according to the IUCN red list.
Diversity 14 00575 g006
Figure 7. Distribution of the species richness for the IUCN Red List category of least concern.
Diversity 14 00575 g007
Figure 8. Odonata sampling effort in the Nearctic realm.
Diversity 14 00575 g008
Table 1. Description of predictor variables included in our SDM modeling framework, and the mean permutation contribution of each variable averaged across all our top models.
Bioclimatic VariableDescriptionMean Permutation Contribution
Bio 8Mean temperature of wettest quarter14.4
Bio 2Mean diurnal range 13.7
Bio 1Annual mean temperature11.1
Bio 4Temperature seasonality10.3
Bio 15Precipitation seasonality10.2
Bio 9Mean temperature of driest quarter9.6
Bio 5Max temperature of warmest month6.7
Bio 13Precipitation of wettest month5.4
Bio 14Precipitation of driest month5.0
Bio 12Annual precipitation3.7
Bio 6Min temperature of coldest month3.45
Bio 16Precipitation of wettest quarter3.2
Bio 17Precipitation of driest quarter3.1
Publisher’s Note: MDPI stays neutral with regard to jurisdictional claims in published maps and institutional affiliations.

