
Advancing Forensic Chemical Analysis to Classify Wild and Captive Turtles
by
 ,
,
John B. Hopkins III
1,*,
Cheryl A. Frederick
1,
Derek Yorks
2,
Erik Pollock
3 and
Matthew W. H. Chatfield
4 1
Center for Wildlife Studies, Camden, ME 04843, USA
2
Maine Department of Inland Fisheries and Wildlife, Bangor, ME 04441, USA
3
Stable Isotope Laboratory, University of Arkansas, Fayetteville, AR 72701, USA
4
School of Biology and Ecology, University of Maine, Orono, ME 04469, USA
*
Author to whom correspondence should be addressed.
Diversity 2023, 15(10), 1056; https://0-doi-org.brum.beds.ac.uk/10.3390/d15101056
Submission received: 4 August 2023
/
Revised: 20 September 2023
/
Accepted: 27 September 2023
/
Published: 30 September 2023
(This article belongs to the Collection Stable Isotope Ecology)
Abstract
:The diets and environments that individuals experience can vary greatly within and among wildlife populations. These individual experiences can be compared using the chemical signatures of animal tissues, which can differentiate animals into groups, including those raised in the wild versus those held in captive facilities. In this study, we compared different combinations of four stable isotope ratios and 15 trace elements derived from the claw tips of captive wood turtles throughout the eastern U.S. and wild wood turtles (Glyptemys insculpta) from Maine to develop predictive models used to determine their origins. The purpose of this work is to develop an objective statistical tool that law enforcement can use to help prosecute poachers. We found that the chemical signatures of 14 (12 trace elements and 2 stable isotope ratios) of the 19 markers we explored were different between wild and captive wood turtles, thus reflecting the differences in their diets and environments. We found that our stable isotope ratio model had nearly perfect predictive accuracy in classifying wild wood turtles as wild and captive wood turtles as captive, whereas our trace element and combined model were 100% accurate, thus validating this statistical approach for determining the origins of confiscated wood turtles from Maine.
Keywords:
carbon; trace elements; δ13C; δ2H; δ15N; δ18O; hydrogen; stable isotopes; nitrogen; oxygen; wildlife forensics; wood turtles1. Introduction
Chemical analysis holds tremendous promise as a law enforcement tool for combating the illegal wildlife trade. Stable isotope ratios and trace element concentrations derived from animal tissues generally indicate the diets and environments that animals experienced during tissue growth [1]. As such, these chemical signatures in tissues can be used to classify confiscated animals objectively as captive-raised versus wild-caught, which is useful evidence when prosecuting those involved in wildlife trafficking [2].
Claws and other keratinized tissue are particularly useful for chemical analysis because, even though they grow and undergo wear, claws are resistant to chemical change after collection and can be sampled from live specimens using minimally invasive methods—an important consideration when handling species of conservation concern. In addition, the collection, storage, and shipping of small samples (3–30 mg) involves minimal effort, cost, and expertise, making the large-scale application of chemical analysis feasible. To date, stable isotope ratios derived from keratinized tissue have been used to distinguish between captive and wild-caught specimens, including bird feathers [3,4], lizard skins [5], rhino horns [6], and turtle claws [7], and trace elements in scutes have been used to discern between captive and wild sea turtles [8].
Turtles are among the most heavily trafficked vertebrate groups in the world [9]. Recent confiscations indicate that wood turtles (Glyptemys insculpta), which are found in the midwestern and northeastern U.S. and southeastern Canada, are poached and sold illegally both within the U.S. and abroad, making them a species of particular concern for conservation law enforcement [10,11]. The annual migration of wood turtles from a terrestrial to an aquatic environment makes them an ideal candidate for accumulating a unique combination of stable isotopes from food, water, and sediment sources. For instance, earlier work found that the claw tips of wild wood turtles (n = 35) had lower δ13C and δ15N values compared to captive turtles (n = 36), likely due to captive turtles consuming higher proportions of corn and animal protein, respectively [7]. In addition, wood turtles are omnivorous generalists—eating a variety of soft-bodied invertebrates, insects, tadpoles, leafy vegetation, fruits, fungi, and carrion in wild environments (reviewed in [12])—further contributing to differences in chemical profiles between turtles with wild versus captive diets.
Similar to earlier work with wild and captive-bred pythons in [2], we explored the use of both stable isotope ratios and trace element concentrations to predict the origin of wood turtles in Maine. In this study, we extend [7] by including two additional stable isotope ratios (δ2H and δ18O) and 15 trace elements to discriminate between wild wood turtles from Maine and captive wood turtles from facilities throughout the eastern U.S. The goal of the study is to develop a statistical model that correctly classifies all wild wood turtles from Maine as wild and all captive wood turtles as captive. To achieve our goal, we compared predictive models that relied on a combination of either four stable isotope ratios, 15 trace elements, or a combination of both.
2. Materials and Methods
2.1. Study Area and Sampling
In 2020 and 2021, as part of an ongoing research and monitoring study in central Maine, we sampled 35 wild, adult wood turtles during regular stream surveys using minimally invasive methods described in [7,13]. With the aid of our partners, we collected claw tips from 12 additional wild, adult wood turtles from three areas in Maine during the same years as the previous study [7]. We assumed that claw tips reflect the diets of turtles at least 6 months prior to collection [7,14]. Due to concerns about illegal collection, the locations of wild wood turtles from both studies (n = 47) are not included here.
We also analyzed the claw tips of 2 additional captive wood turtles that were sampled during the same years as [7] (n = 36), totaling 38 different captive wood turtles in this study. All captive turtles used in this study were held for at least one year to allow for any dietary changes from a wild to captive environment to be catalogued in their claw tips [7,14].
2.2. Stable Isotope Analyses
2.2.1. δ13C and δ15N Analysis
We conducted stable isotope analysis at the University of Arkansas Stable Isotope Lab (UASIL). Staff at UASIL wrapped ~0.3 mg of claw material in tin capsules; analyzed these samples using an EA-isolink elemental analyzer interfaced via ConFlo IV to a Delta V plus isotope ratio mass spectrometer (IRMS) (Thermo Electron Bermen, Bermen, Germany); and normalized delta values to international scale values (per mil, ‰) using standards USGS 41a (n = 19) and USGS 8573 (n = 19) with δ13C = 36.55‰, −26.39‰ and δ15N = 47.55‰, −4.52‰, respectively. The maximum standard deviations for all runs were 0.07‰ for carbon and 0.09‰ for nitrogen.
2.2.2. δ2H and δ18O
We conducted hydrogen and oxygen isotope ratio analyses at UASIL. Staff at UASIL weighed and wrapped ~0.3 mg of claw material in high purity silver capsules; analyzed these samples using a TCEA (high temperature reduction unit) interfaced via ConFlo IV to a Delta V Advantage isotope ratio mass spectrometer (Thermo Electron Bermen, Bermen, Germany); and normalized delta values (per mil, ‰) to international scale values using standards USGS KHS (n = 38) and CBS (n = 38) with δ2H = −35.3‰, −157‰ and δ18O = 21.21‰, −2.39‰, respectively. The maximum standard deviations for all runs were 1.7‰ for hydrogen and 0.8‰ for oxygen.
2.3. Trace Element Analyses
We conducted inductively coupled plasma mass spectrometry (ICP-MS) at UASIL. Staff at UASIL weighed 2.6–12 mg of sample into polypropylene centrifuge tubes using a Sartorius SC2 microbalance and dissolved these samples in high concentration, high purity nitric acid (Alistar Plus, VWR, Radnor, VA, USA), and digestion was performed at 70 °C in a convection oven (all solutions were clear without remaining undissolved material), followed by diluting the resulting solutions to 2% HNO3 and then conducting ICP-MS analysis using a Thermo ICapQ mass spectrometer. The system was operated in KED (kinetic energy discrimination) mode to facilitate the removal of polyatomic interferences. External calibration used several multi-element standards across the concentration range (68-A High Purity Standards, 71-B Inorganic Ventures). We used the following stable isotopes to determine concentrations of each trace element: Magnesium-24, Aluminium-27, Potassium-39, Calcium-43, Calcium-44, Titanium-48, Chromium-52, Manganese-55, Iron-57, Nickel-60, Copper-63, Zinc-66, Strontium-88, Tin-118, and Barium-137. Staff at the UASIL corrected solution concentrations for mass and dilution, and we reported trace element concentrations as mg/kg (ppm) of dry weight.
2.4. Statistical Analyses
For each of the 19 chemical markers, we tested for statistical differences (α = 0.05) between wild and captive turtles using the same procedures in [7]. We then used the R (v4.2.2 [15]) package glmnet (v4.1.4 [16]) to fit generalized logistic regression models (codes: wild = 1, captive = 0) via penalized maximum likelihood to three sets of standardized data and performed K-fold cross-validation on each candidate set, yielding the best model from all combinations of models. We used the following 3-step approach to determine the top stable isotope model, trace element model, and combined model. First, we determined the top stable isotope model using all four stable isotope ratios for wood turtles sampled in [7] (35 wild and 36 captive) and 2 additional wild wood turtles (n = 73). We included all four stable isotopes because we assume the additional data (δ2H and δ18O) will yield a better model than our top model in [7] and believe these additional data will be valuable to include in future models when we attempt to predict the geographical origins of confiscated turtles. Next, we conducted the same procedure to produce the top trace element model using trace elements for wild and captive wood turtles (n = 71:33 wild and 24 captives in [7] + 12 additional wild turtles and 2 captive) that were statistically different. Lastly, we used all four stable isotope ratios and trace elements from our top trace element model to determine the top combined model (n = 59:33 wild and 24 captives in [7] + 2 additional wild turtles). To ensure quality control of future data collected by law enforcement officers who may not be trained in aging and sexing turtles, we did not include sex (male, female, or juvenile) as a covariate in our models. In the end, we reported the sensitivity (true positive rate), specificity (true negative rate), and accuracy (success rate) of each model’s ability to predict turtle origin. We also provided a direct measure of the effect size and direction of the relationship between our response and predictor variables in our top regression models (Table 1) by listing the unstandardized coefficients.
3. Results
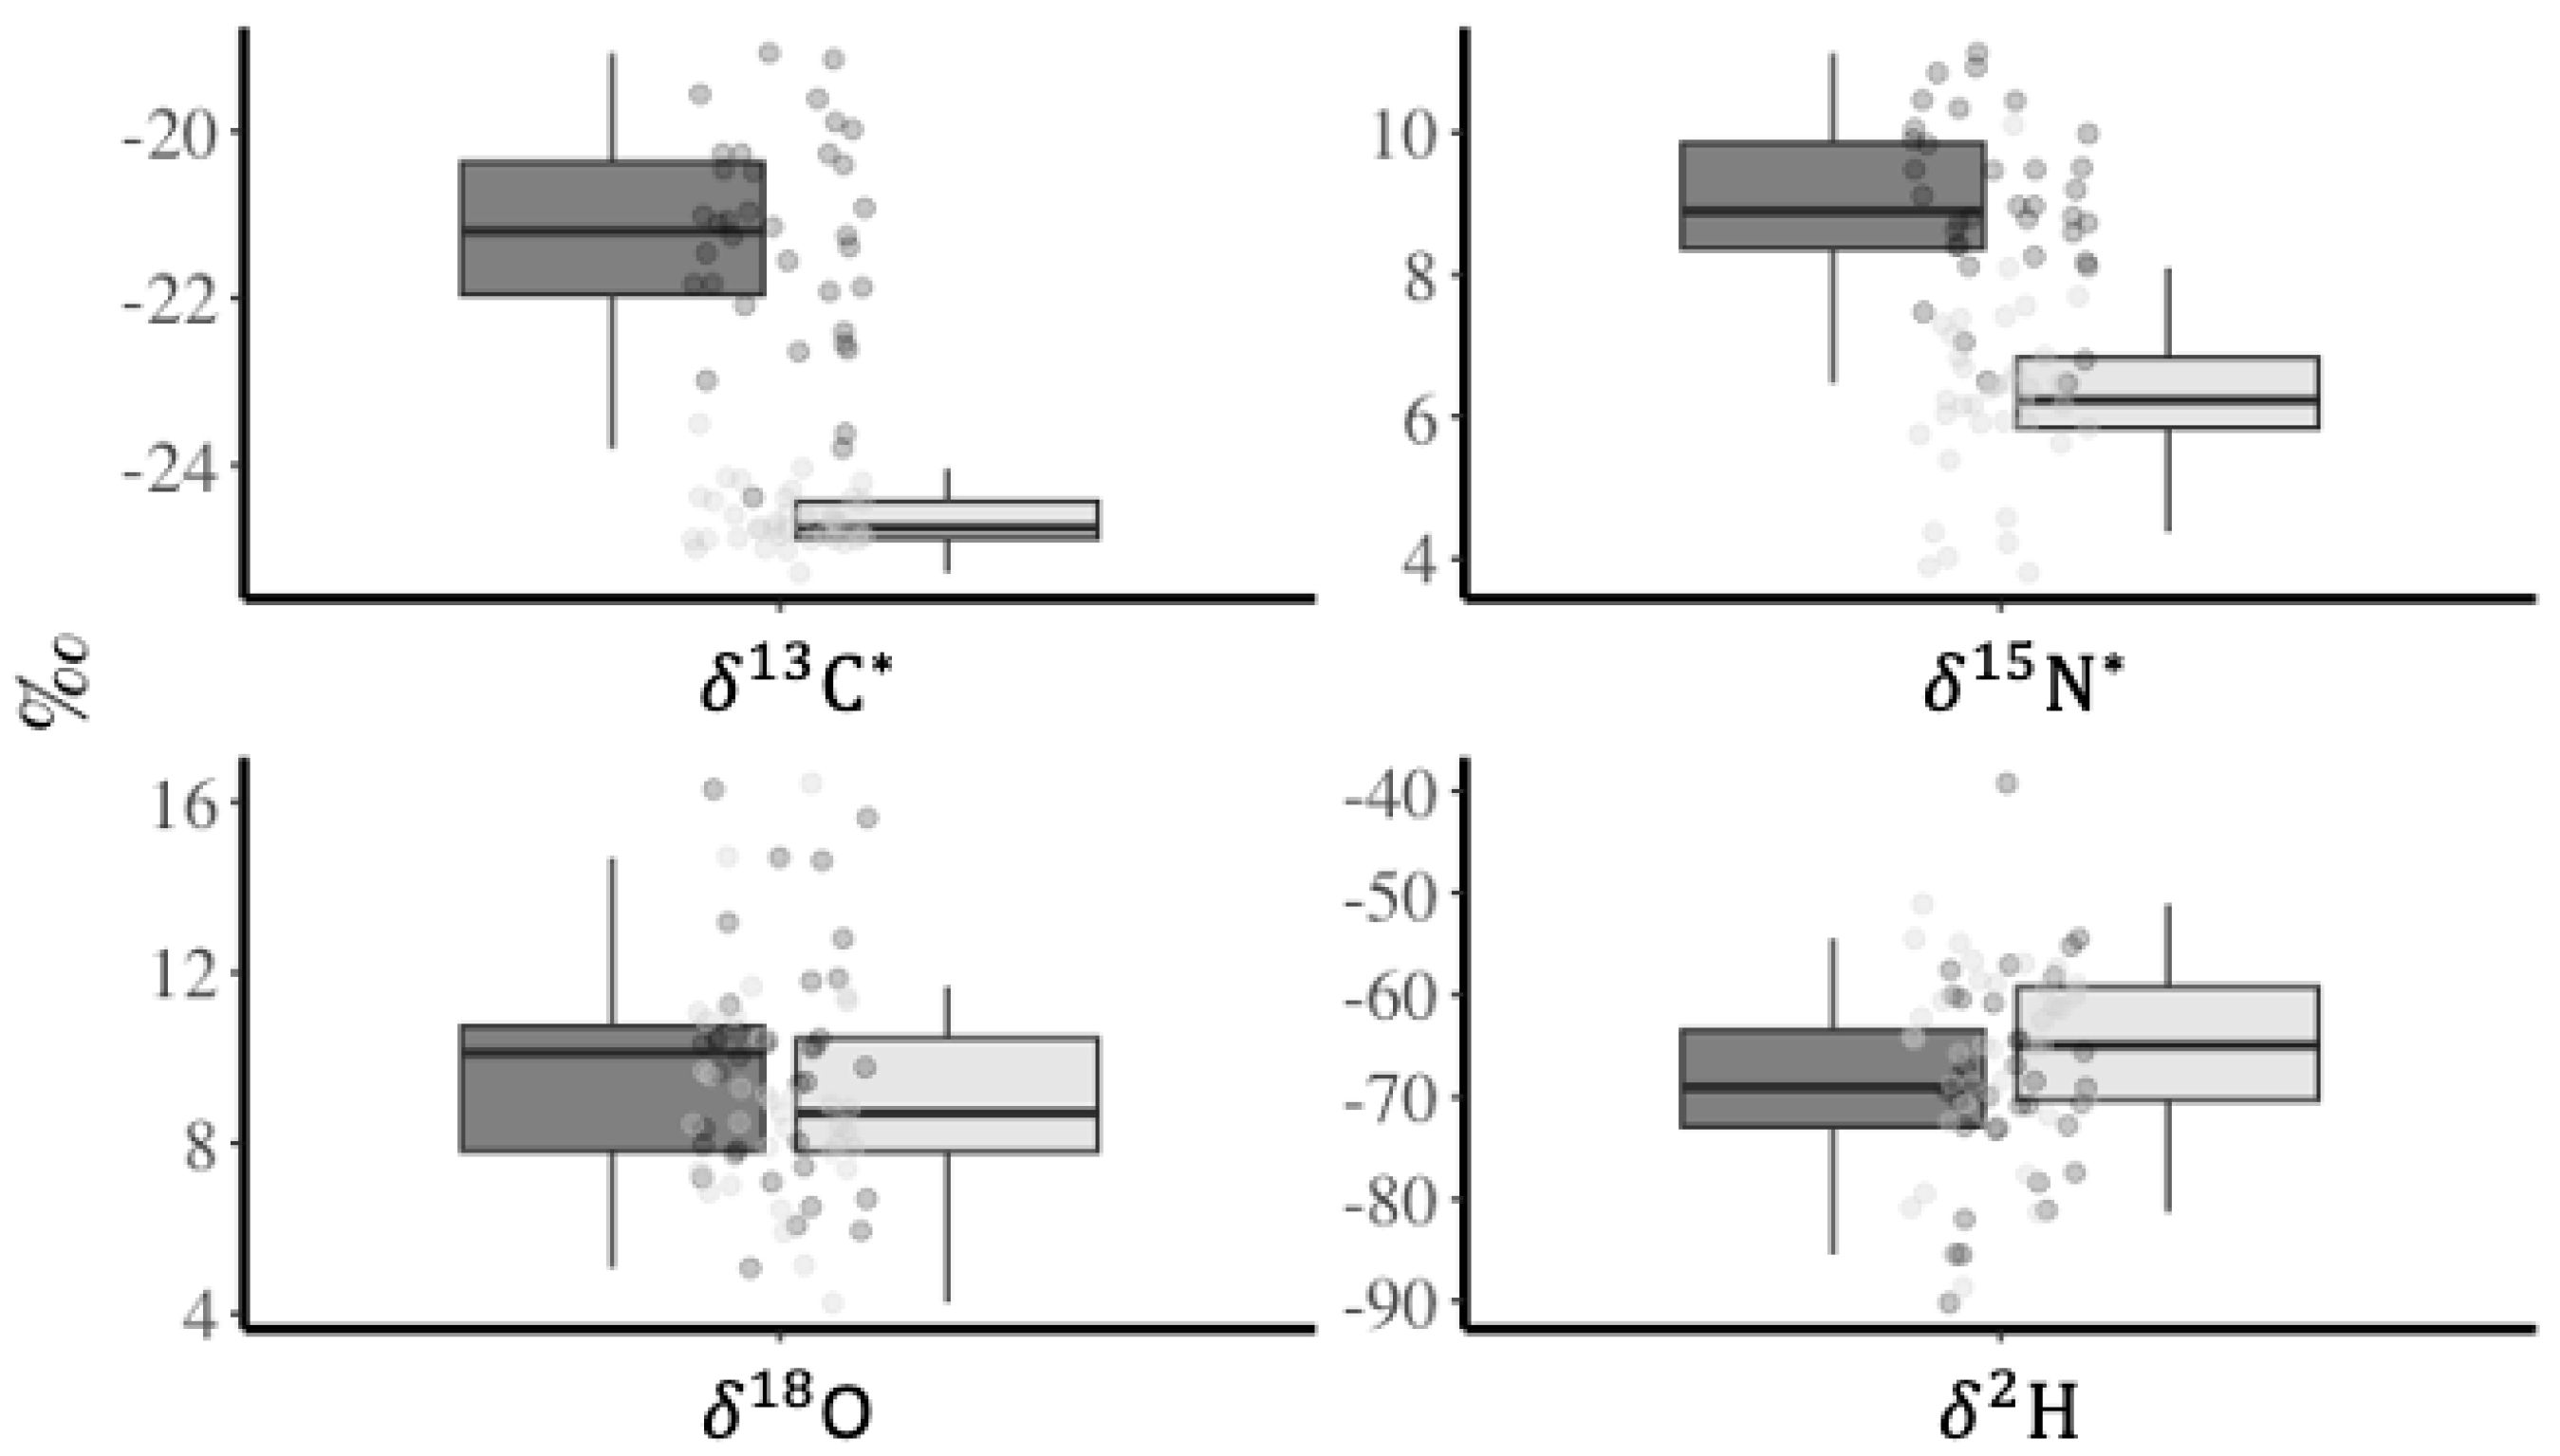
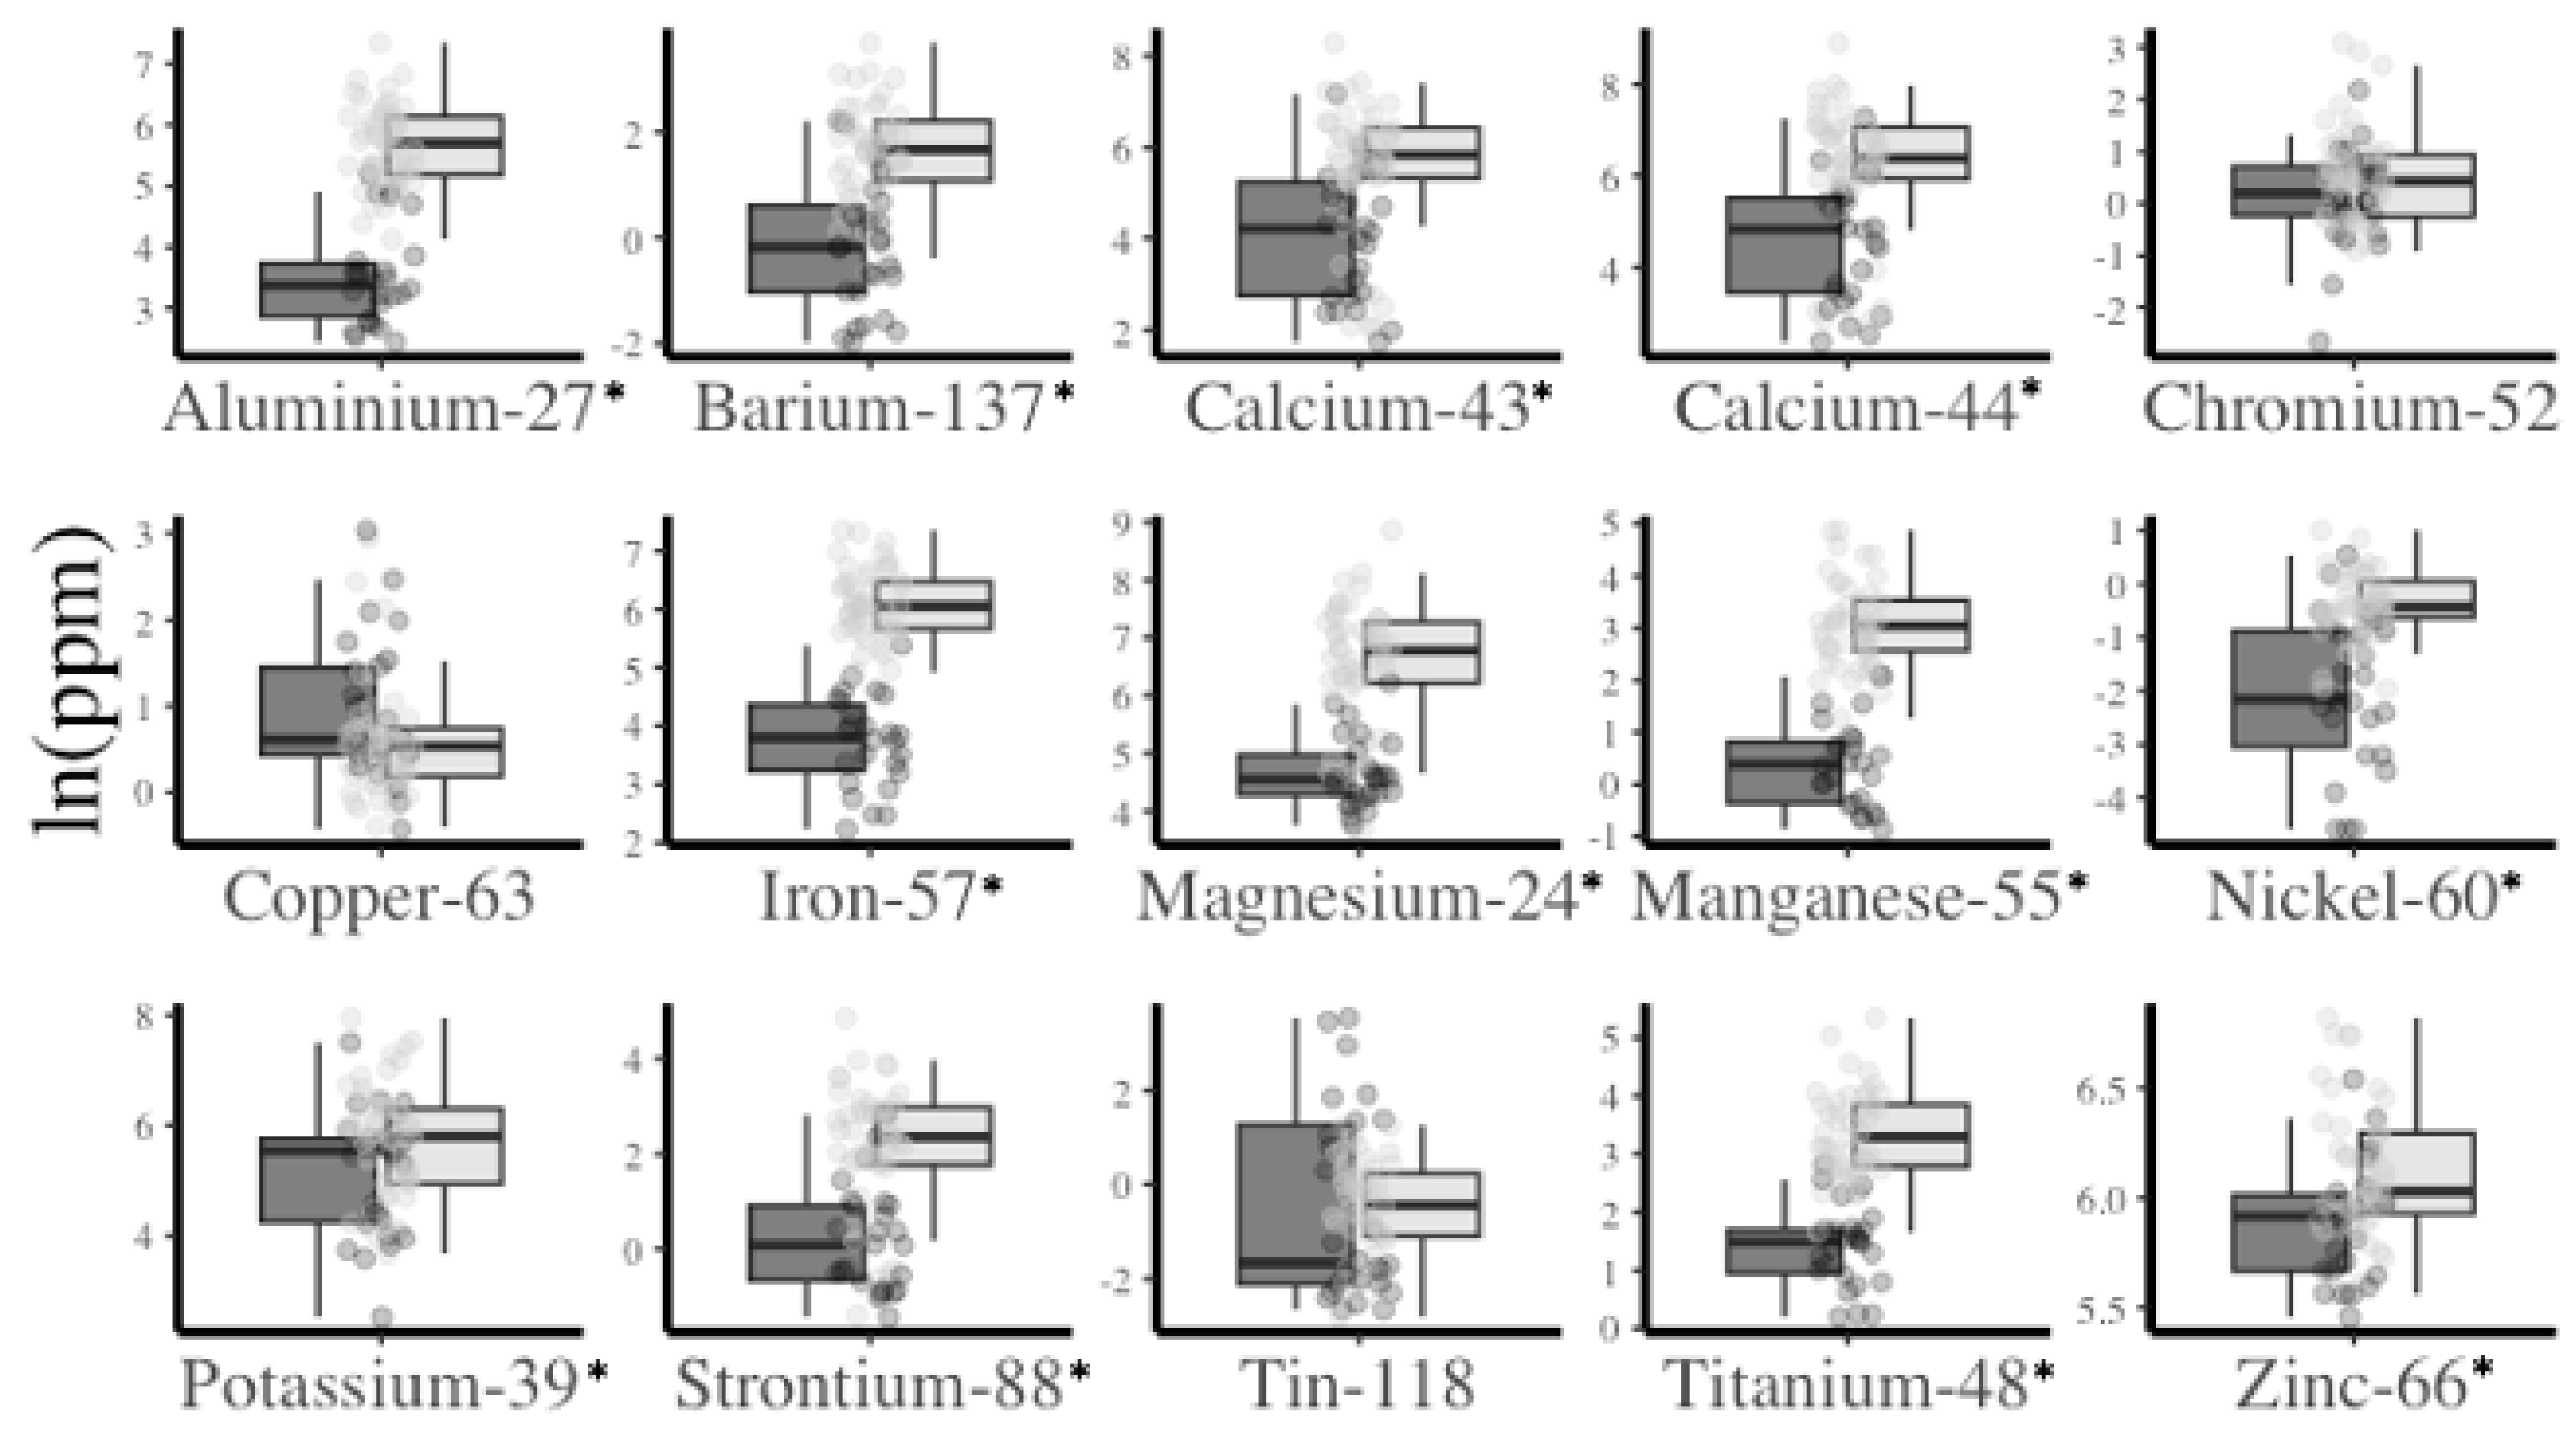
Similar to [7], we found that captive turtles had higher δ13C and δ5N values than wild wood turtles (Figure 1). Conversely, we discovered that all trace element concentrations, except for Chromium, Copper, and Tin, were lower in captive wood turtles than wild wood turtles (Figure 2). We removed Chromium, Copper, and Tin from our list of predictors used in subsequent analyses.
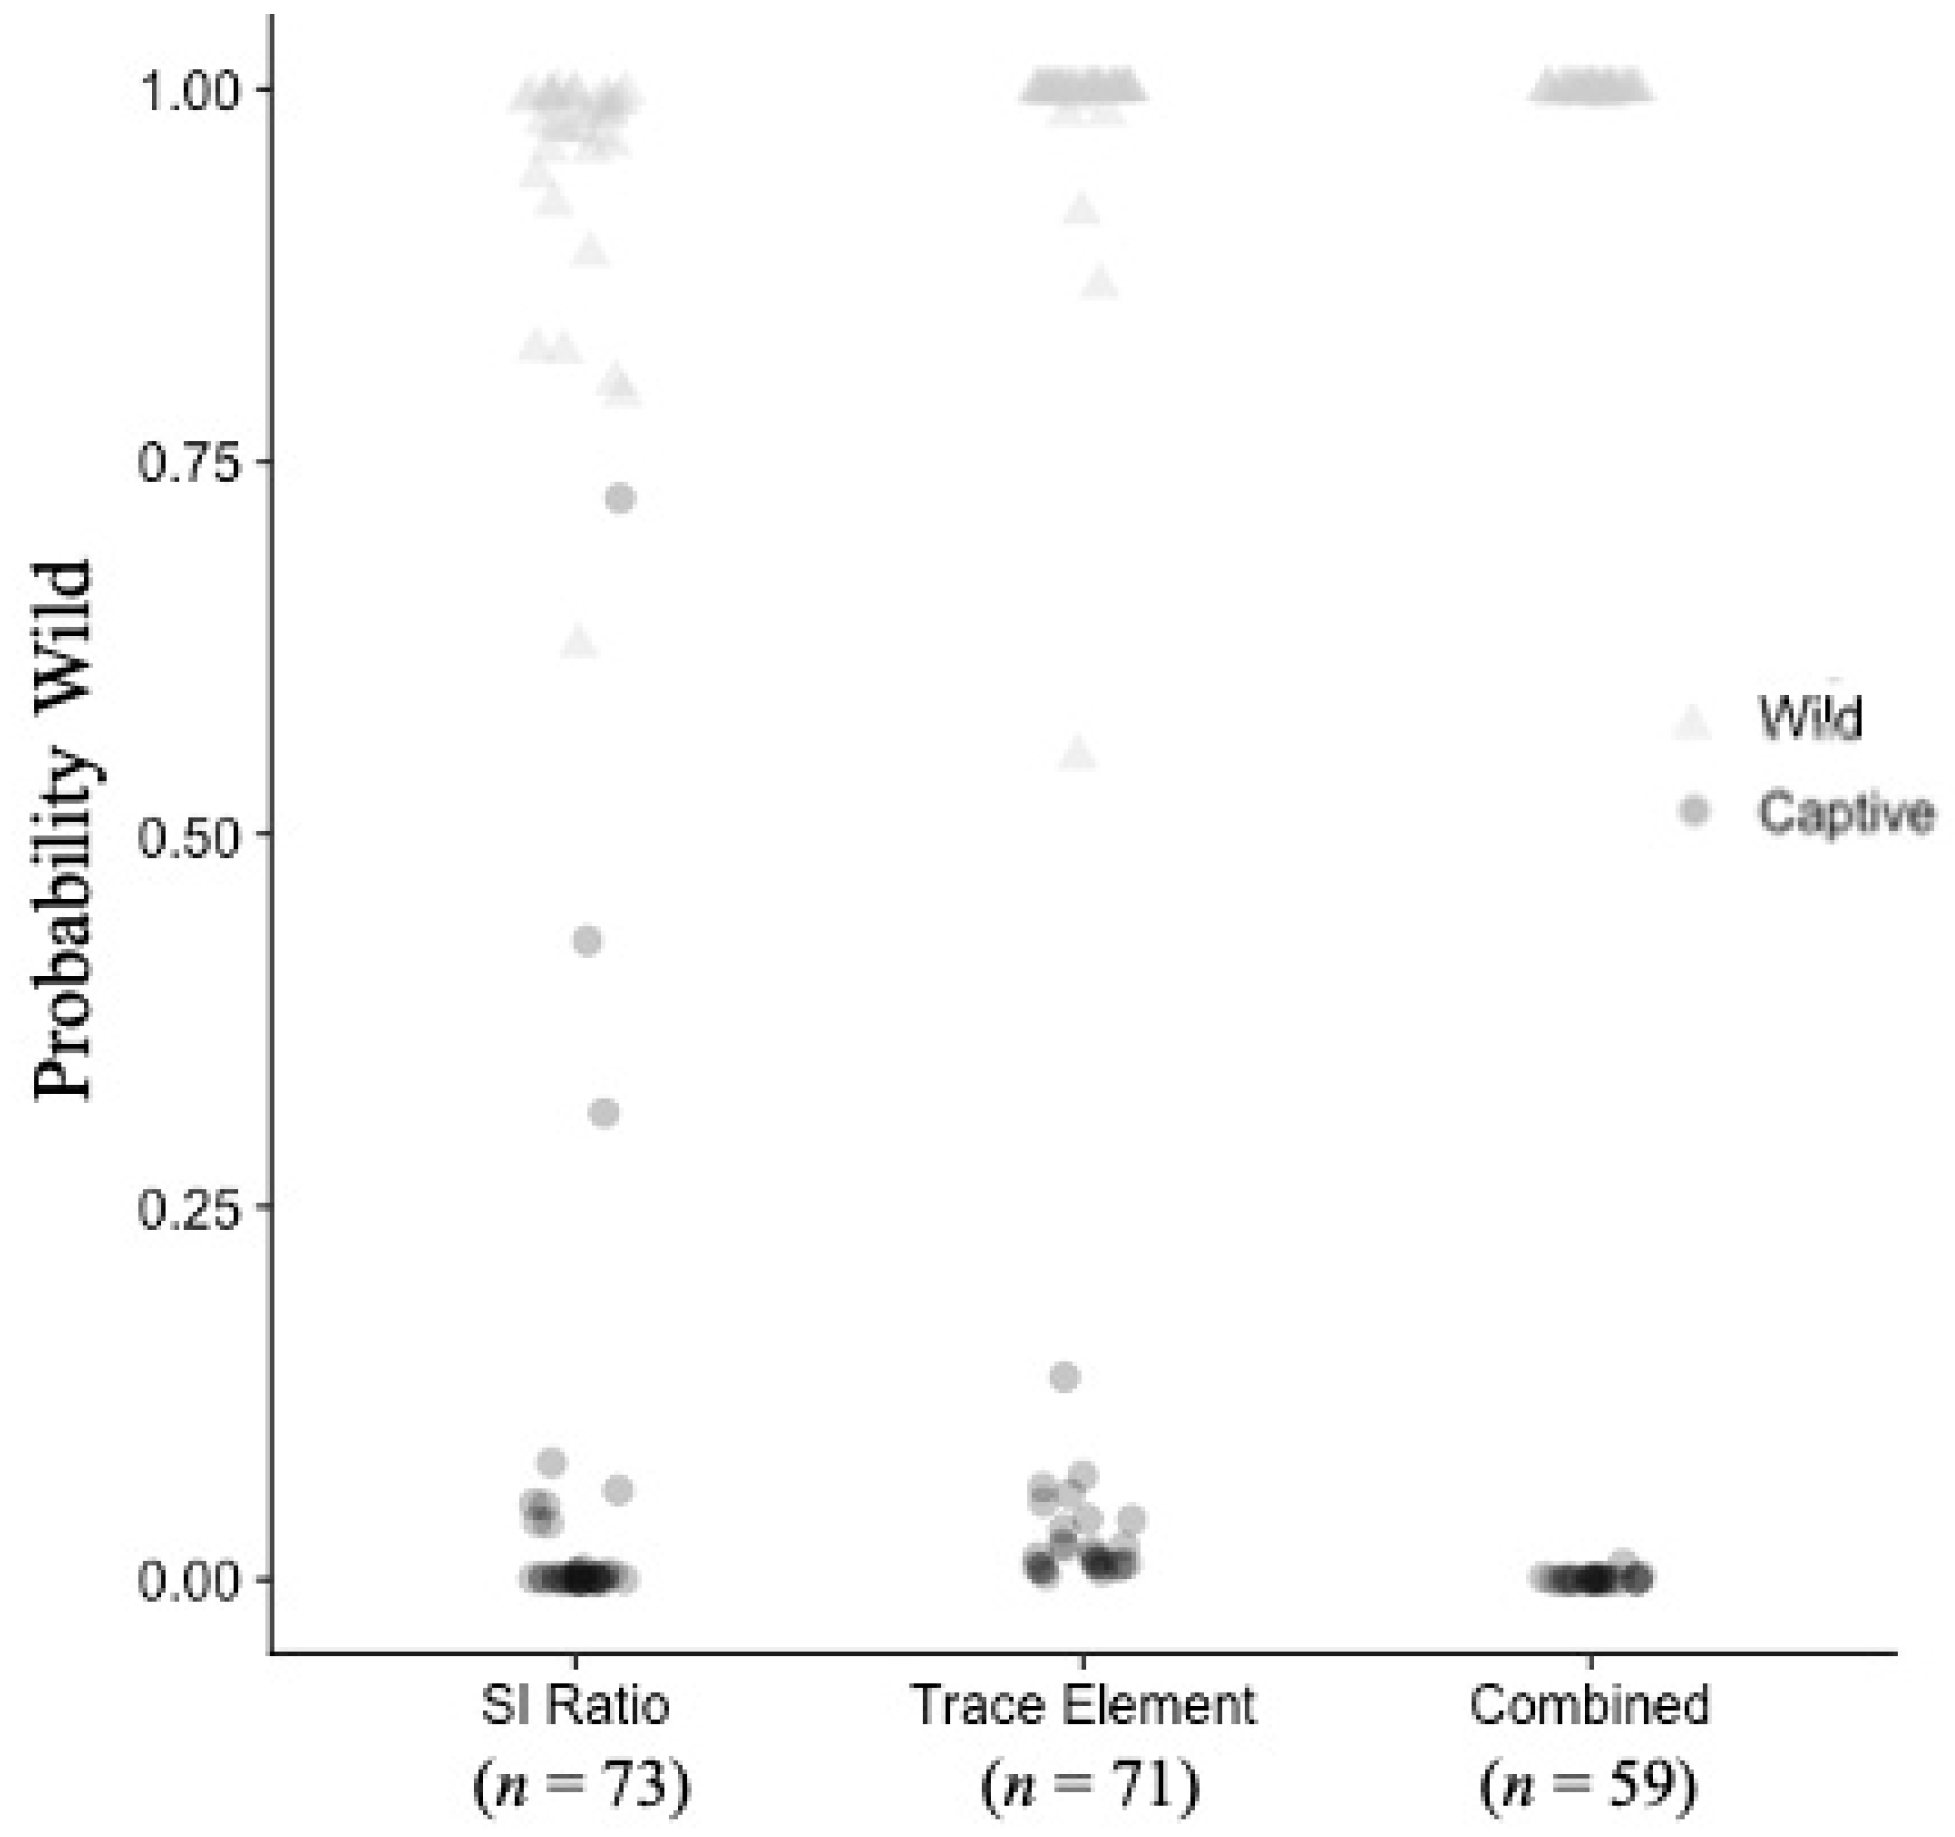
We found that the top stable isotope ratio model in this study predicted all but one captive wood turtle as wild (sensitivity = 100%; specificity = 97%; accuracy = 99%), whereas the top trace element model and combined model correctly classified all wild wood turtles as wild and all captive wood turtles as captive (i.e., 100% sensitivity, specificity, and accuracy) (Figure 3). Our combined model was the best overall. Captive turtles had the average probability of being <0.1% wild, and wild turtles had the probability of being >99.9% wild (Figure 3). We found that δ13C and δ15N were important for correctly classifying wood turtles as wild or captive (like [7]), as were different combinations of trace elements, depending on the model (Table 1).
4. Discussion
Our combined model discriminated perfectly between wild wood turtles from Maine and captive wood turtles from a variety of locations throughout the eastern U.S. When compared to [7], which only used two stable isotope ratios, model accuracy improved from 97% to 100% (Table 1).
We found that δ13C and δ15N values were among the most useful covariates for predicting wild and captive wood turtles in both models that included stable isotope ratios (Figure 1, Table 1). Captive turtles had higher δ13C and δ15N values than wild turtles, likely because their formulated diets contained more animal protein (elevating δ15N) and corn (elevating δ13C) than wild turtles [7] (Figure 1).
δ2H and δ18O values were not as useful in classifying wild and captive turtles as δ13C and δ15N values. δ2H and δ18O may, however, be important covariates for predicting the geographic origin of wild turtles, as these isotope systems are known to vary systematically in meteoric water around the world and are transferred from plants to animal tissues [17,18,19]. δ2H is particularly useful because it varies in animals along a latitudinal gradient, making it an ideal isotopic system for studying the origins of migratory species [18,20,21] or potentially detecting where a confiscated animal originated geographically. δ18O may also be useful for pinpointing the geographic origins of turtles, as this isotopic system varies in animals among marine, freshwater, and terrestrial systems [22].
Just as δ13C and δ15N values vary between animals that forage in the wild versus those that feed on a formulated diet in captivity [7], other chemical markers may also differ due to these animals having different diets. For instance, commercially produced pelleted feeds often contain high mineral content stemming from raw ingredients, supplementation, and trace amounts from milling equipment [23]. Previous studies found that commercially sourced macroinvertebrates fed to hellbenders (Cryptobranchus alleganiensis) contained less than one third as much ash, reflecting total minerals within a food, than wild macroinvertebrates [24]; gut microbiomes indicated a higher plant-based diet and a deficiency in fruits in captive versus wild Beal’s eyed turtles (Sacalia bealei) [25]; and unlike the nine elements that were higher in wild green sea turtles (Chelonia mydas), copper and selenium were higher in captive sea turtles due to an enrichment in their pelleted diet [8].
Similar to measuring δ13C and δ15N values in animal tissues to understand their dietary habits, trace elements can be used to understand the environments in which animals live. For example, municipal water sources and natural water bodies or ground water have different levels of anthropogenic inputs and treatments, which subsequently influence their elemental concentrations [26]. Turtles housed in captive facilities in urban areas are therefore expected to have elemental signatures of municipal water. Municipal water systems often have treatments that focus on the removal of iron and manganese due to taste, odor, and bacterial clogging [27]. In contrast, natural waters often increase in acidity and reduce redox potential (eH) from precipitation through runoff and groundwater movement in surface waters. Low pH and low eH commonly increase the solubility of trace elements [27]. Municipal treatments, flocculation, aeration, and coagulation have the opposite effect on pH and eH and provide a mechanism of trace element removal, which is evident in this study with captive turtles having lower concentrations of trace elements than their wild counterparts (Figure 2). Calcium, magnesium, and, to a lesser extent, aluminum are hardness elements and are subject to removal from most municipal waters, as they can result in scale and pipe clogging [28] (Figure 2). The process can also reduce water hardness either as a primary objective or the secondary result of other desired actions (i.e., organic carbon removal). The substitution of strontium for calcium ions is well known, and the decrease is likely due to the removal of hardness elements (Figure 2).
Although our best combined model is capable of distinguishing between captive and wild wood turtles with 100% certainty, we must extend its predictive capabilities to other species and geographic regions for it to be widely useful to law enforcement. Currently, law enforcement and resource management practitioners can contact the authors to conduct both the lab and statistical analyses used to calculate the probability that a confiscated wood turtle in Maine is wild. Models with wider applicability than wood turtles in Maine will be available in the future via a graphical user interface (GUI). Our user-friendly GUI will also include other emydine turtle species that are a conservation concern in the Northeast, including spotted (Clemmys guttata), Blanding’s (Emydoidea blandingii), and box (Terrapene carolina) turtles. In addition, as stable isotopes are known to vary across the landscape [29,30], the chemical profiles of turtles in other areas may also be different. We will, therefore, expand the generalizability of the model beyond Maine to include wild samples from across each species’ geographic range. Lastly, we recognize that some captive animals are exposed to well water, as opposed to treated municipal water, and may be fed diets containing wild foods, such as locally harvested plants and invertebrates. Future work will address the likelihood of misclassifications (e.g., the same captive turtle in this study was misclassified as wild by the isotope model and trace element model) and the incorporation rates of elements catalogued in claw tips, which includes understanding claw growth and wear rates, respectively.
5. Conclusions
The work we present contributes to a holistic approach in the global effort to combat illegal wildlife trafficking [31]. For example, synergistic approaches utilizing stricter policies, improved communication across agencies and between governments, and more rigorous policing that includes advanced law enforcement tools will be required to curb the illegal turtle trade. With the ability to distinguish unambiguously between captive and wild Maine wood turtles, our findings are a major step toward the development of an important conservation law enforcement tool to combat the illegal wildlife trade. The raw data used to develop our models are available in Supplementary Materials.
Supplementary Materials
The following supporting information can be downloaded at: https://0-www-mdpi-com.brum.beds.ac.uk/article/10.3390/d15101056/s1.
Author Contributions
Conceptualization, J.B.H.III; methodology, J.B.H.III, M.W.H.C. and C.A.F.; sample analysis, E.P.; statistical analysis, J.B.H.III; resources, M.W.H.C., C.A.F. and D.Y.; data curation, M.W.H.C. and C.A.F.; writing—original draft preparation, J.B.H.III, M.W.H.C. and C.A.F.; writing—review and editing, M.W.H.C., C.A.F., D.Y. and E.P.; visualization, J.B.H.III; supervision, M.W.H.C. and C.A.F.; project administration, M.W.H.C.; funding acquisition, M.W.H.C., C.A.F., D.Y., J.B.H.III and E.P. All authors have read and agreed to the published version of the manuscript.
Funding
This research was funded by the Maine Department of Inland Fisheries and Wildlife, the Dorr Foundation, the William P. Wharton Trust, the USDA National Institute of Food and Agriculture, McIntire-Stennis Project Number ME0-42301 through the Maine Agricultural and Forest Experiment Station, Center for Wildlife Studies, University of Arkansas, and a Christine Stevens Wildlife Award on behalf of the Animal Welfare Institute.
Institutional Review Board Statement
Sampling at some Maine localities was conducted under the Department of Inland Fisheries and Wildlife Scientific Collection Permit numbers 2020-447, 2021-447, and 2022-660.
Data Availability Statement
The raw data used to develop our models are available in Supplementary Materials.
Acknowledgments
We thank the Maine Department of Inland Fisheries and Wildlife, the U.S. Fish and Wildlife Service, and the following institutions for contributing samples and providing other project support: the AZA SAFE program and the Chelonian Taxon Advisory Group, the Center for Wildlife, Clyde Peeling’s Reptiland, Elmwood Park Zoo, John Ball Zoo, Lincoln Park Zoo, Maryland Zoo in Baltimore, New Jersey Division of Fish and Wildlife, Oklahoma City Zoo, The Orianne Society, Potter Park Zoo, Saint Louis Zoo, Staten Island Zoo, Tennessee Aquarium, Unity College, and Virginia Living Museum. Lastly, we thank J. Ferguson for his guidance and review of our statistical analyses.
Conflicts of Interest
The authors declare no conflict of interest.
References
- Fry, B. Stable Isotope Ecology; Springer: New York, NY, USA, 2006; Volume 521. [Google Scholar]
- Natusch, D.J.D.; Carter, J.F.; Aust, P.W.; Tri, N.V.; Tinggi, U.; Riyanto, A.; Lyons, J.A. Serpent’s Source: Determining the Source and Geographic Origin of Traded Python Skins Using Isotopic and Elemental Markers. Biol. Conserv. 2017, 209, 406–414. [Google Scholar] [CrossRef]
- Jiguet, F.; Kardynal, K.J.; Hobson, K.A. Stable isotopes reveal captive vs. wild origin of illegally captured songbirds in France. Forensic Sci. Int. 2019, 302, 109884. [Google Scholar] [CrossRef]
- Castelli, P.M.; Reed, L.M. Use of Stable Isotopes to Distinguish Wild from Pen-Raised Northern Bobwhite. Wildl. Soc. Bull. 2017, 41, 140–145. [Google Scholar] [CrossRef]
- van Schingen, M.; Ziegler, T.; Boner, M.; Streit, B.; Nguyen, Q.T.; Crook, V.; Ziegler, S. Can isotope markers differentiate between wild and captive reptile populations? A case study based on crocodile lizards (Shinisaurus crocodilurus) from Vietnam. Glob. Ecol. Conserv. 2016, 6, 232–241. [Google Scholar] [CrossRef]
- Cerling, T.E.; Andanje, S.A.; Gakuya, F.; Kariuki, J.M.; Kariuki, L.; Kingoo, J.W.; Khayale, C.; Lekolool, I.; Macharia, A.N.; Anderson, C.R.; et al. Stable isotope ecology of black rhinos (Diceros bicornis) in Kenya. Oecologia 2018, 187, 1095–1105. [Google Scholar] [CrossRef]
- Hopkins, J.B., III; Frederick, C.A.; Yorks, D.; Pollock, E.; Chatfield, M.W. Forensic application of stable isotopes to distinguish between wild and captive turtles. Biology 2022, 11, 1728. [Google Scholar] [CrossRef] [PubMed]
- Shaw, K.R.; Lynch, J.M.; Balazs, G.H.; Jones, T.T.; Pawloski, J.; Rice, M.R.; French, A.D.; Liu, J.; Cobb, G.P.; Klein, D.M. Trace element concentrations in blood and scute tissues from wild and captive Hawaiian green sea turtles (Chelonia mydas). Environ. Toxicol. Chem. 2021, 40, 208–218. [Google Scholar] [CrossRef]
- UNODC. World Wildlife Crime Report; UNODC: Vienna, Austria, 2016; p. 9. [Google Scholar]
- Jones, M.T.; Willey, L.L. Status and Conservation of the Wood Turtle in the Northeastern United States; Northeast Association of Fish and Wildlife Agencies’ Regional Conservation Needs Program: Cabot, VT, USA, 2015; 271p. [Google Scholar]
- Jones, M.T.; Willey, L.L.; Mays, J.D.; Akre, T.S.B.; Tamplin, J.W.; Gipe, K.D.; Burne, M.R.; Kleopfer, J.D.; Badje, A. Habitat in Biology and Conservation of the Wood Turtle; Northeast Association of Fish and Wildlife Agencies, Inc.: Petersburgh, NY, USA, 2021; pp. 81–111. [Google Scholar]
- Willey, L.L.; Akre, T.S.B.; Jones, M.T.; Browm, D.J.; Tamplin, J.W. Chapter 6: Spatial Ecology and Seasonal Behavior. In Biology and Conservation of the Wood Turtle; Jones, M.T., Willey, L.L., Eds.; Northeast Association of Fish and Wildlife Agencies, Inc.: Petersburgh, NY, USA, 2021. [Google Scholar]
- Hopkins, J.B., III; Cutting, K.A.; Warren, J.M. Use of Stable Isotopes to Investigate Keratin Deposition in the Claw Tips of Ducks. PLoS ONE 2013, 8, e81026. [Google Scholar] [CrossRef]
- Aresco, M.J.; Travis, J.; MacRae, P.S.D. Trophic Interactions of Turtles in a North Florida Lake Food Web: Prevalence of Omnivory. Copeia 2015, 103, 343–356. [Google Scholar] [CrossRef]
- R Core Team. R: A Language and Environment for Statistical Computing; R Foundation for Statistical Computing: Vienna, Austria, 2022; Available online: https://www.R-project.org/ (accessed on 5 June 2023).
- Friedman, J.; Hastie, T.; Tibshirani, R. Regularization Paths for Generalized Linear Models via Coordinate Descent. J. Stat. Softw. 2010, 33, 1–22. Available online: https://www.jstatsoft.org/v33/i01/ (accessed on 5 June 2023). [CrossRef]
- Estep, M.F.; Dabrowski, H. Tracing food webs with stable hydrogen isotopes. Science 1980, 209, 1537–1538. [Google Scholar] [CrossRef]
- Hobson, K.A. Tracing Origins and Migration of Wildlife Using Stable Isotopes: A Review. Oecologia 1999, 120, 314–326. [Google Scholar] [CrossRef] [PubMed]
- Bowen, G.J.; Wassenaar, L.I.; Hobson, K.A. Global Application of Stable Hydrogen and Oxygen Isotopes to Wildlife Forensics. Oecologia 2005, 143, 337–348. [Google Scholar] [CrossRef]
- Hobson, K.A.; Wassenaar, L.I. Linking breeding and wintering grounds of neotropical migrant songbirds using stable hydrogen isotopic analysis of feathers. Oecologia 1996, 109, 142–148. [Google Scholar] [CrossRef]
- Rubenstein, D.R.; Hobson, K.A. From birds to butterflies: Animal movement patterns and stable isotopes. Trends Ecol. Evol. 2004, 19, 256263. [Google Scholar] [CrossRef]
- Koch, P.L. Isotopic study of the biology of modern and fossil vertebrates. In Stable Isotopes in Ecology and Environmental Science; Blackwell Publishing Ltd.: Hoboken, NJ, USA, 2007; pp. 99–154. [Google Scholar]
- Ricketts, V.; Dierenfeld, E.S.; Sauer, C.; Whitehouse-Tedd, K. Feed intake and dietary composition of iron (Fe), copper (Cu), vitamin E, and tannic acid of five captive black rhinoceros (Diceros bicornis) in a UK collection. Zoo Biol. 2021, 40, 52–58. [Google Scholar] [CrossRef] [PubMed]
- Augustine, L.K.; Terrell, A.; Petzinger, C.; Nissen, B.; Maslanka, M. Nutritional analysis of diet items available to captive and free-ranging hellbenders (Cryptobranchus alleganiensis). Herpetol. Rev. 2016, 47, 63–69. [Google Scholar]
- Fong, J.J.; Sung, Y.H.; Ding, L. Comparative analysis of the fecal microbiota of wild and captive beal’s eyed turtle (Sacalia bealei) by 16S rRNA gene sequencing. Front. Microbiol. 2020, 11, 570890. [Google Scholar] [CrossRef]
- Khatri, N.; Tyagi, S. Influences of natural and anthropogenic factors on surface and groundwater quality in rural and urban areas. Front. Life Sci. 2015, 8, 23–39. [Google Scholar] [CrossRef]
- Chaturvedi, S.; Dave, P.N. Removal of iron for safe drinking water. Desalination 2012, 303, 1–11. [Google Scholar] [CrossRef]
- Malakootian, M.; Mansoorian, H.J.; Moosazadeh, M. Performance evaluation of electrocoagulation process using iron-rod electrodes for removing hardness from drinking water. Desalination 2010, 255, 67–71. [Google Scholar] [CrossRef]
- Flem, B.; Moen, V.; Finne, T.E.; Viljugrein, H.; Kristoffersen, A.B. Trace element composition of smolt scales from Atlantic salmon (Salmo salar L.), geographic variation between hatcheries. Fish. Res. 2017, 190, 183–196. [Google Scholar] [CrossRef]
- Guo, X.; Zuo, R.; Meng, L.; Wang, J.; Teng, Y.; Liu, X.; Chen, M. Seasonal and spatial variability of anthropogenic and natural factors influencing groundwater quality based on source apportionment. Int. J. Environ. Res. Public Health 2018, 15, 279. [Google Scholar] [CrossRef] [PubMed]
- Gray, T.N.; Marx, N.; Khem, V.; Lague, D.; Nijman, V.; Gauntlett, S. Holistic management of live animals confiscated from illegal wildlife trade. J. Appl. Ecol. 2017, 54, 726–730. [Google Scholar] [CrossRef]
Figure 1.
Carbon (δ13C), nitrogen (δ15N), oxygen (δ18O), and hydrogen (δ2H) stable isotope values (per mil, ‰, measured by IRMS) derived from the claw tips of captive wood turtles (dark boxes and circles; n = 36) sampled at various animal care facilities throughout the eastern U.S. and wild wood turtles (light boxes and circles; n = 37) captured in Maine, 2021–2022. The box in each plot denotes the interquartile range, which is the difference between the 75th and 25th percentiles (50% of the data). The upper and lower whiskers are the maximum and minimum values of the data that are within 1.5 times the interquartile range over the 75th and 25th percentiles, respectively. An asterisk (*) denotes a significant difference between wild and captive wood turtles.

Figure 2.
Trace element concentrations (ppm, measured by ICP-MS) derived from the claw tips of captive wood turtles (dark; n = 26) sampled at various animal care facilities throughout the eastern U.S. and wild wood turtles (light; n = 45) captured in Maine, 2021–2022. The box in each plot denotes the interquartile range, which is the difference between the 75th and 25th percentiles (50% of the data). The upper and lower whiskers are the maximum and minimum values of the data that are within 1.5 times the interquartile range over the 75th and 25th percentiles, respectively. An asterisk (*) denotes a significant difference between wild and captive wood turtles.

Figure 3.
The probability that wild and captive wood turtles (circles) were classified as wild by each top model.
Figure 3.
The probability that wild and captive wood turtles (circles) were classified as wild by each top model.


Table 1.
Unstandardized coefficients for the predictors associated with the three top models compared in this study. Gray fields indicate the predictor was not included in the modeling activity, and blank fields denote that the predictor was not significant and was not included in the model.
Table 1.
Unstandardized coefficients for the predictors associated with the three top models compared in this study. Gray fields indicate the predictor was not included in the modeling activity, and blank fields denote that the predictor was not significant and was not included in the model.
| Model | |||
|---|---|---|---|
| Predictors | SI Ratio (n = 73) | Trace Element (n = 71) | Combined (n = 59) |
| Intercept | −39.939 | −6.125 | −69.656 |
| δ13C | −2.320 | −3.140 | |
| δ15N | −0.896 | −1.585 | |
| δ2H | 0.087 | 0.003 | |
| δ18O | −0.227 | −0.768 | |
| Magnesium-24 | 0.006 | 0.001 | |
| Aluminium-27 | |||
| Potassium-39 | −0.001 | ||
| Calcium-43 | |||
| Calcium-44 | |||
| Titanium-48 | |||
| Manganese-55 | 0.019 | ||
| Iron-57 | 0.041 | 0.027 | |
| Nickel-60 | |||
| Zinc-66 | 0.002 | 0.035 | |
| Strontium-88 | |||
| Barium-137 | −0.727 | −0.791 | |
Disclaimer/Publisher’s Note: The statements, opinions and data contained in all publications are solely those of the individual author(s) and contributor(s) and not of MDPI and/or the editor(s). MDPI and/or the editor(s) disclaim responsibility for any injury to people or property resulting from any ideas, methods, instructions or products referred to in the content. |
© 2023 by the authors. Licensee MDPI, Basel, Switzerland. This article is an open access article distributed under the terms and conditions of the Creative Commons Attribution (CC BY) license (https://creativecommons.org/licenses/by/4.0/).
Share and Cite
MDPI and ACS Style
Hopkins, J.B., III; Frederick, C.A.; Yorks, D.; Pollock, E.; Chatfield, M.W.H. Advancing Forensic Chemical Analysis to Classify Wild and Captive Turtles. Diversity 2023, 15, 1056. https://0-doi-org.brum.beds.ac.uk/10.3390/d15101056
AMA Style
Hopkins JB III, Frederick CA, Yorks D, Pollock E, Chatfield MWH. Advancing Forensic Chemical Analysis to Classify Wild and Captive Turtles. Diversity. 2023; 15(10):1056. https://0-doi-org.brum.beds.ac.uk/10.3390/d15101056
Chicago/Turabian StyleHopkins, John B., III, Cheryl A. Frederick, Derek Yorks, Erik Pollock, and Matthew W. H. Chatfield. 2023. "Advancing Forensic Chemical Analysis to Classify Wild and Captive Turtles" Diversity 15, no. 10: 1056. https://0-doi-org.brum.beds.ac.uk/10.3390/d15101056
Note that from the first issue of 2016, this journal uses article numbers instead of page numbers. See further details here.