
Responses of Phytoplankton Communities to Flow Regulation in Northeastern Riverine Wetlands of China
1
Key Laboratory of Wetland Ecology and Environment, Northeast Institute of Geography and Agroecology, Chinese Academy of Sciences, Changchun 130102, China
2
Heilongjiang Province Forestry Technical Service Center, Harbin 150060, China
3
State Key Laboratory of Black Soils Conservation and Utilization, Northeast Institute of Geography and Agroecology, Chinese Academy of Sciences, Changchun 130102, China
*
Author to whom correspondence should be addressed.
Diversity 2023, 15(12), 1191; https://0-doi-org.brum.beds.ac.uk/10.3390/d15121191
Submission received: 19 October 2023
/
Revised: 23 November 2023
/
Accepted: 23 November 2023
/
Published: 1 December 2023
(This article belongs to the Special Issue Biodiversity and Ecosystem Function)
Abstract
:Among the impacts of dam construction on river ecosystem, runoff regulation and habitat fragmentation are the two major concerns. Herein, the response characteristics of phytoplankton communities to reservoir impoundment and dam interception were explored by taking Manjiang and Songjiang rivers, where a man-made engineering project was constructed, and the natural stretches located in the up-streams as the research objects. The results obtained revealed that the compositions of phytoplankton communities, collected from the 21 sampling sites in the riverine wetlands of reservoir stretch, flow-reduced stretch, and natural stretch, were dissimilar. The communities of phytoplankton were clustered into three groups. The co-occurrence network analysis indicated that the interspecific relationship structures of phytoplankton communities of each group were different. The indicator species Chlamydomonas ovalis, Synedra acus, and Chlamydomonas globosa, belonged to the Reservoir Wetlands Group, Diatoma vulgare, Fragilaria ca pucina, and Meridion circulare belonged to the Flow-reduced Wetlands Group, and Ceratoneis arcus and Treubaria crassispina belonged to the Natural Wetlands Group. The functional group L0 was the absolute dominant group in all three groups of the riverine wetlands, but a discrepancy was that the proportions of functional group X2 and functional group C in the Reservoir Wetlands Group were remarkably higher, while the proportion of functional group MP in the Flow-reduced Wetlands Group was noticeably higher. By assessing the status of the phytoplankton community composition and the functional group structure, we concluded that current velocity and water depth were crucial influencing factors, and the functional group structure based on the classification of livable water could be applied as a good indication for demonstrating phytoplankton community succession.
1. Introduction
Phytoplankton are floating microscopic plants that live in water, and are usually referred to as planktonic algae; they are a key producer of organic matter and a key link of nutrient chain in an aquatic ecosystem. Phytoplankton live in various waterbodies such as oceans, rivers, and lakes, particularly in open water [1]. These tiny microorganisms, that are sensitive to habitat changes, reflect the community structure and functional composition of aquatic organisms [2]. The identity of an ecosystem mainly depends on the distribution and abundance of biologically functional traits and is mostly affected by climate or natural and artificial disturbance [3]. The uncertainty of environmental variables makes it hard to precisely predict or evaluate phytoplankton and dominant species, while the phytoplankton’s functional diversity can provide more information [4].
As a renewable but limited resource, an aquatic ecosystem should meet a number of changing requirements, including water supply and quality [5]. Rapid variation in water temperature, mineralization, and nutrient status will alter a nascent aquatic environment [6]. From an ecological perspective, aquatic organisms have evolved diverse strategies and structures to respond to particular hydrological regimes [7]. For instance, extreme events, such as flooding exert selective pressures on aquatic populations and determine the relative success of various species [8]. In the riverine wetlands on both sides of the river, the aquatic and terrestrial ecosystems meet to configure a typical ecotone [9]. The ecotone of an aquatic ecosystem plays a vital role in maintaining or promoting richness, biomass production and stability of the biological community [10].
In numerous investigations, phytoplankton are employed as a measure to evaluate the health status and the response mechanism of the aquatic ecosystem, while the river is commonly regarded as a whole [11,12,13]. However, ignoring the discrepancies in biological communities in stretches will hinder the investigation of the impact of man-made changes on the physical structure and restoration of local aquatic ecological environment [14]. Rivers are characterized by continuous runoff, which affects physical morphology, deposition patterns, and biological organisms [15]. Anthropogenic regulation of river discharge will not only alter the hydrological state, but also affect the self-regulation ability of rivers to cope with natural ecological alterations [16].
Riverine wetlands have been classified into four hydrological connectivity categories based on river connection to the nearest river and channel depth: riparian, non-riparian shallow, non-riparian mid-deep, and non-riparian deep [17]. The role of aquatic macroinvertebrates as indicators of river ecological status has long been established [9]. However, the development of effective macroinvertebrate biological indicators for riverine wetlands’ ecological status is lagging. Changes in hydrological connectivity between river channels and their coastal wetlands pose a major threat to the function of river ecosystems [18]. We know very little about the frequency, duration, and relative importance of connectivity to date [19]. River ecosystems with riverine wetlands are complex and versatile as interactions of different aquatic organisms occur there, so the analysis of the impacts on a single species, population or community may be inadequate [20]. But we will combine earlier studies of aquatic insects belong to benthic invertebrates [5] and studies of zooplankton, assess the specific development trends of different groups of aquatic organisms due to the impact of hydrologic connectivity of isolated wetlands in order to obtain the most mature biological indicators of river and riverine wetland ecosystem in Northeast China.
Prior to the 1990s, the Manjiang River and the Songjiang River remained in a largely natural state, due to a lesser number of construction activities to build water facilities as well as human activities. However, the SongShan diversion, which is being built on the Manjiang River, has blocked the flow and hydrological connectivity since 1993. It has been shown that seasonal hydrological connectivity should be maintained in future riverfront wetland management to protect biodiversity and ecological resilience [21]. We hypothesized that the community compositions or functional groups of phytoplankton and the natural habitats had been considerably altered in the natural stretch over a certain period of years after dam construction. In order to clarify the trends of variations in phytoplankton communities due to different types of human interference, this paper discusses the response characteristics of phytoplankton community structure and functional groups in the Manjiang and Songjiang rivers of Changbai Mountains, which have been affected by the water diversion projects in Northeast China. A longitudinal comparison of phytoplankton in different stretches affected by multiple cascaded reservoirs was carried out. We hope that our results will contribute to improving river ecosystem function and aquatic biodiversity [22].
2. Study Design
2.1. Study Area
The SongShan Hydropower Station is constructed on the Manjiang River, which is 153 km long. The XiaoShan, ShiLong, and ShuangGou hydropower stations are constructed on the Songjiang River, which is 143 km long.
The rivers Manjiang and Songjiang are located in the Changbai Mountains of Northeastern China. The climate of this area is humid, hot, and rainy due to the Pacific monsoon in summer. The forest surface coverage of this area is about 75%.
The SongShan Reservoir (S1: 127.44° E, 42.09° N), located in the middle of the Manjiang River, shunts water to the Songjiang River, which significantly impacts the lower stretches of the Manjiang and Songjiang rivers. This diversion reduces flow of the Manjing River, while it increases flow of the Songjiang River. Furthermore, the lower stretch of the Songjiang River is further altered by a series of reservoirs: XiaoShan (S2: 127.45° E, 42.24° N), ShiLong (S3: 127.32° E, 42.37° N) and ShuangGou (S4: 127.38° E, 42.34° N).
2.2. Sampling Design
Phytoplankton samples were collected in June (Spring), August (Summer) and October (Autumn), respectively. We intended to minimize the effects of different seasons and temperatures, and highlight the effects of riverine wetlands in different stretches on phytoplankton samples by averaging the data.
We set up 21 sampling sites in total (Figure 1). Sampling sites included (I) upstream riverine wetlands of reservoir stretches of both rivers (A1–A6); (II) different reservoir impoundments (S1–S5) and downstream riverine wetlands away from the dams where flows have been restored (S6–S8); and (III) riverine wetlands of flow-reduced stretches of the lower portions of reservoirs of both rivers (M1–M6) and the confluence of the Manjiang and Songjiang rivers (M7). We limited riparian habitats to waters within 5 m of land. This configuration of habitat types allowed us to assess the response of wetland phytoplankton communities to changes in the riparian environment.
2.3. Sample Handling
Phytoplankton samples were collected with 0.015 mm diameter plankton nets and 5 L water samplers. The water samplers were stored in bottles after adding 15% Luge reagent. After allowing the samples to stand and deposit for 48 h, 30 mL of the stored water was then transferred to 100 mL sample bottles for further storage. Phytoplankton were identified and counted with a 0.1 mL plankton counting tube under an optical microscope. With two replicated observations, a total of 100 visual fields from each sample were observed to obtain their averaged value. The third observation was performed if the relative counts were greater than ±15% [23,24].
2.4. Functional Traits
The concept of functional groups, which was introduced into aquatic ecosystems [25] from terrestrial ecosystems [26], was employed to classify the biological characteristics of phytoplankton including physiology, morphology, life history and behavior of organisms [27,28]. Phytoplankton have been divided into 31 functional groups (FG) [29,30,31], and 40 functional groups are being currently updated after several revisions [32].
2.5. Data Analysis
Species dominance index was used to identify dominant species. The Shannon–Wiener diversity index and the Pielou evenness index were used to identify species richness.
Based on the logarithmic transformation of original abundance, the similarity of phytoplankton among wetlands was calculated using the Bray–Curtis dissimilarity coefficient. On this basis, we performed a hierarchical cluster analysis of phytoplankton communities by means of intergroup mean clustering. Both SIMPROF test and cluster analysis were performed with Primer 7.0 software (CABIT Information Technology Co., LTD; Shanghai, China).
Through the network analysis, the relationships among different phytoplankton communities from the same group of riverine wetlands were identified as data structure diagrams. Spearman correlation coefficient among phytoplankton communities was applied to construct an interactive network using the interaction platform Gephi 0.9.2.
PC-ORD 5 was used to determine the indicator species and representative indicator taxa of each wetland type. The experiment used the abundance and frequency of taxa in a given taxa to generate index values of 0 (no index value) to 100 (perfect index value) for each taxon, and the significance was tested with the Monte Carlo analysis.
3. Results
3.1. Phytoplankton Community Assemblage Structure
A total of 68 phytoplankton species in seven phyla were identified (Table 1). The species of Bacillariophyta and Chlorophyta are very rich in variety and quantity. Euglenophyta and Pyrrophyta have only one species each, but neither exists in natural riverine wetlands. In contrast to the natural riverine wetlands where phytoplankton communities are the thinnest, the reservoir riverine wetlands are significantly richer in species. After calculating the dominance index, we statistically obtained nine dominant species from five phyla (Table 2). Species from Bacillariophyta account for more than half of the total.
We calculated the common biological indexes for each sampling site to observe the regularity of phytoplankton species richness in different types of riverine wetlands. From the natural riverine wetlands in upstream to the flow-reduced riverine wetlands in midstream and then to the reservoir riverine wetlands in downstream, the Shannon–Wiener diversity index showed a slightly increasing trend, and the Pielou evenness index always fluctuated without showing a rule (Figure 2).
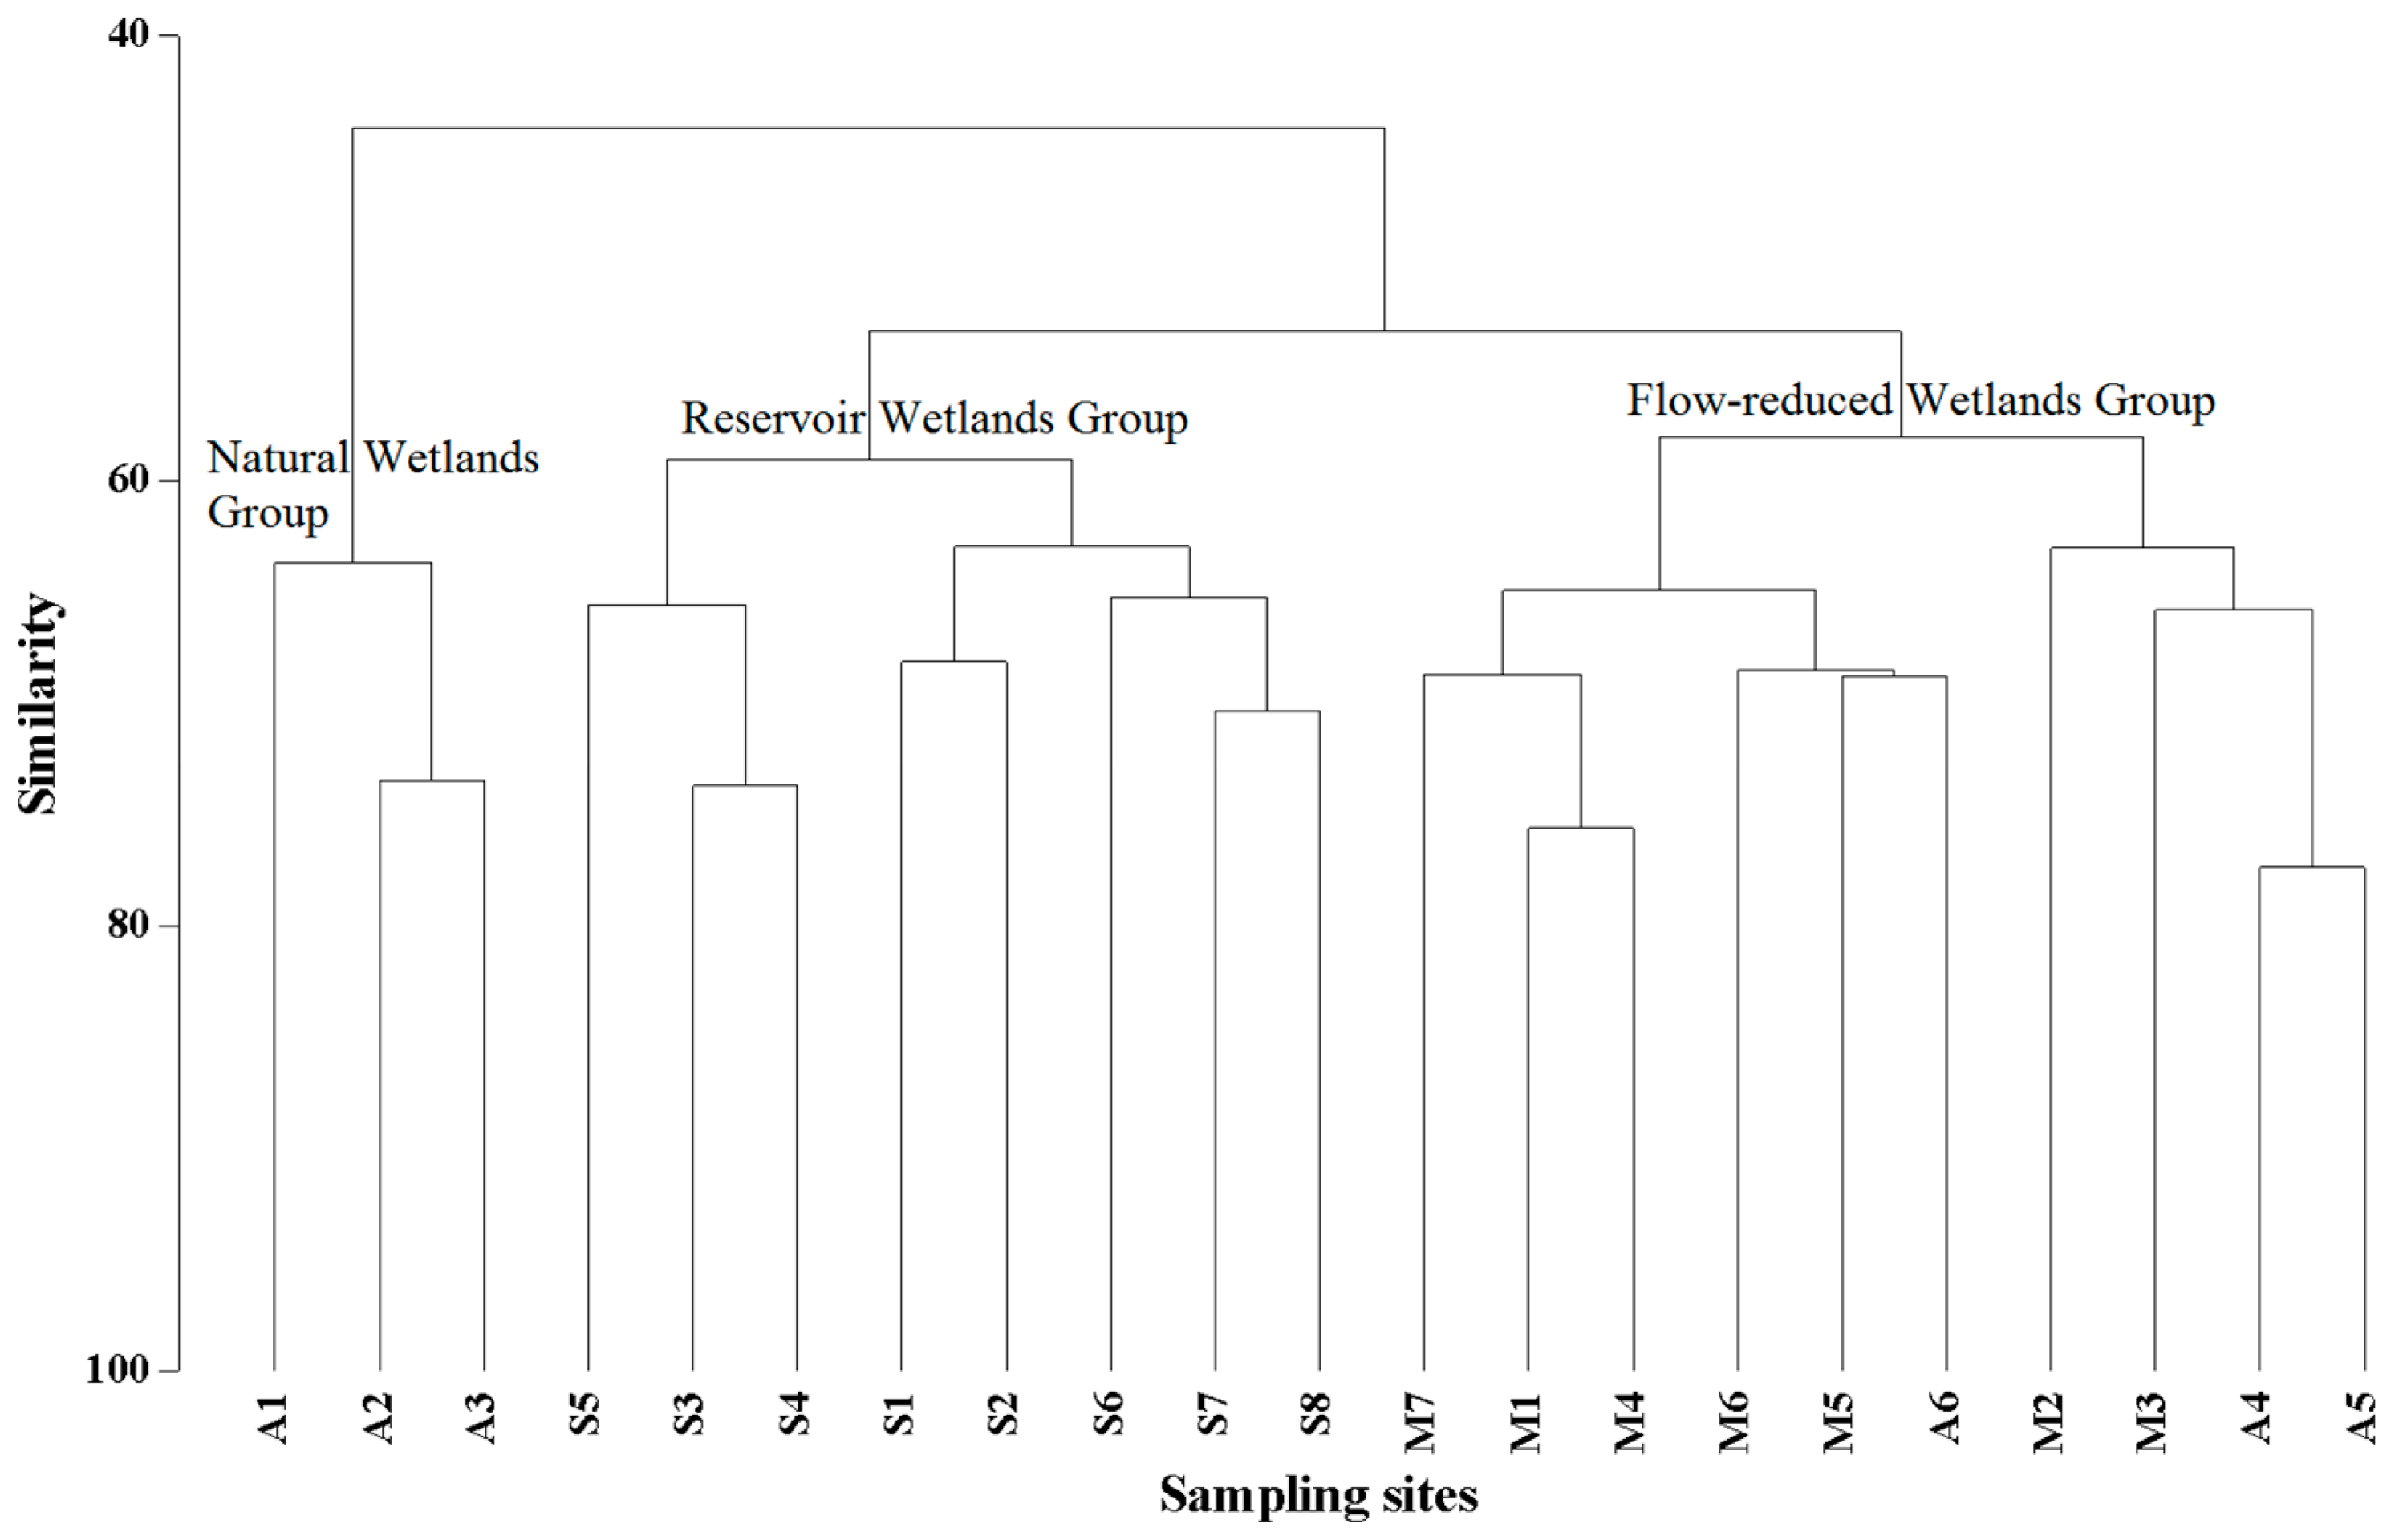
Phytoplankton communities from the 21 sampling sites were clustered into three groups (Figure 3). The sampling sites in the wetlands close to various reservoir impoundment or in the wetlands downstream away from the dams were clustered into the Reservoir Wetlands Group (S1–S8). The Flow-reduced Wetlands Group, including sites M1–M10 and A4–A6, occurred in the flow-reduced stretches due to the SongShan diversion or cascade reservoirs, and natural stretch in the upper portions of the Songjiang River. The sampling sites in riverine wetlands of natural stretch in the upper portions of the Manjiang River were referred to as the Natural Wetlands Group (A1–A3).
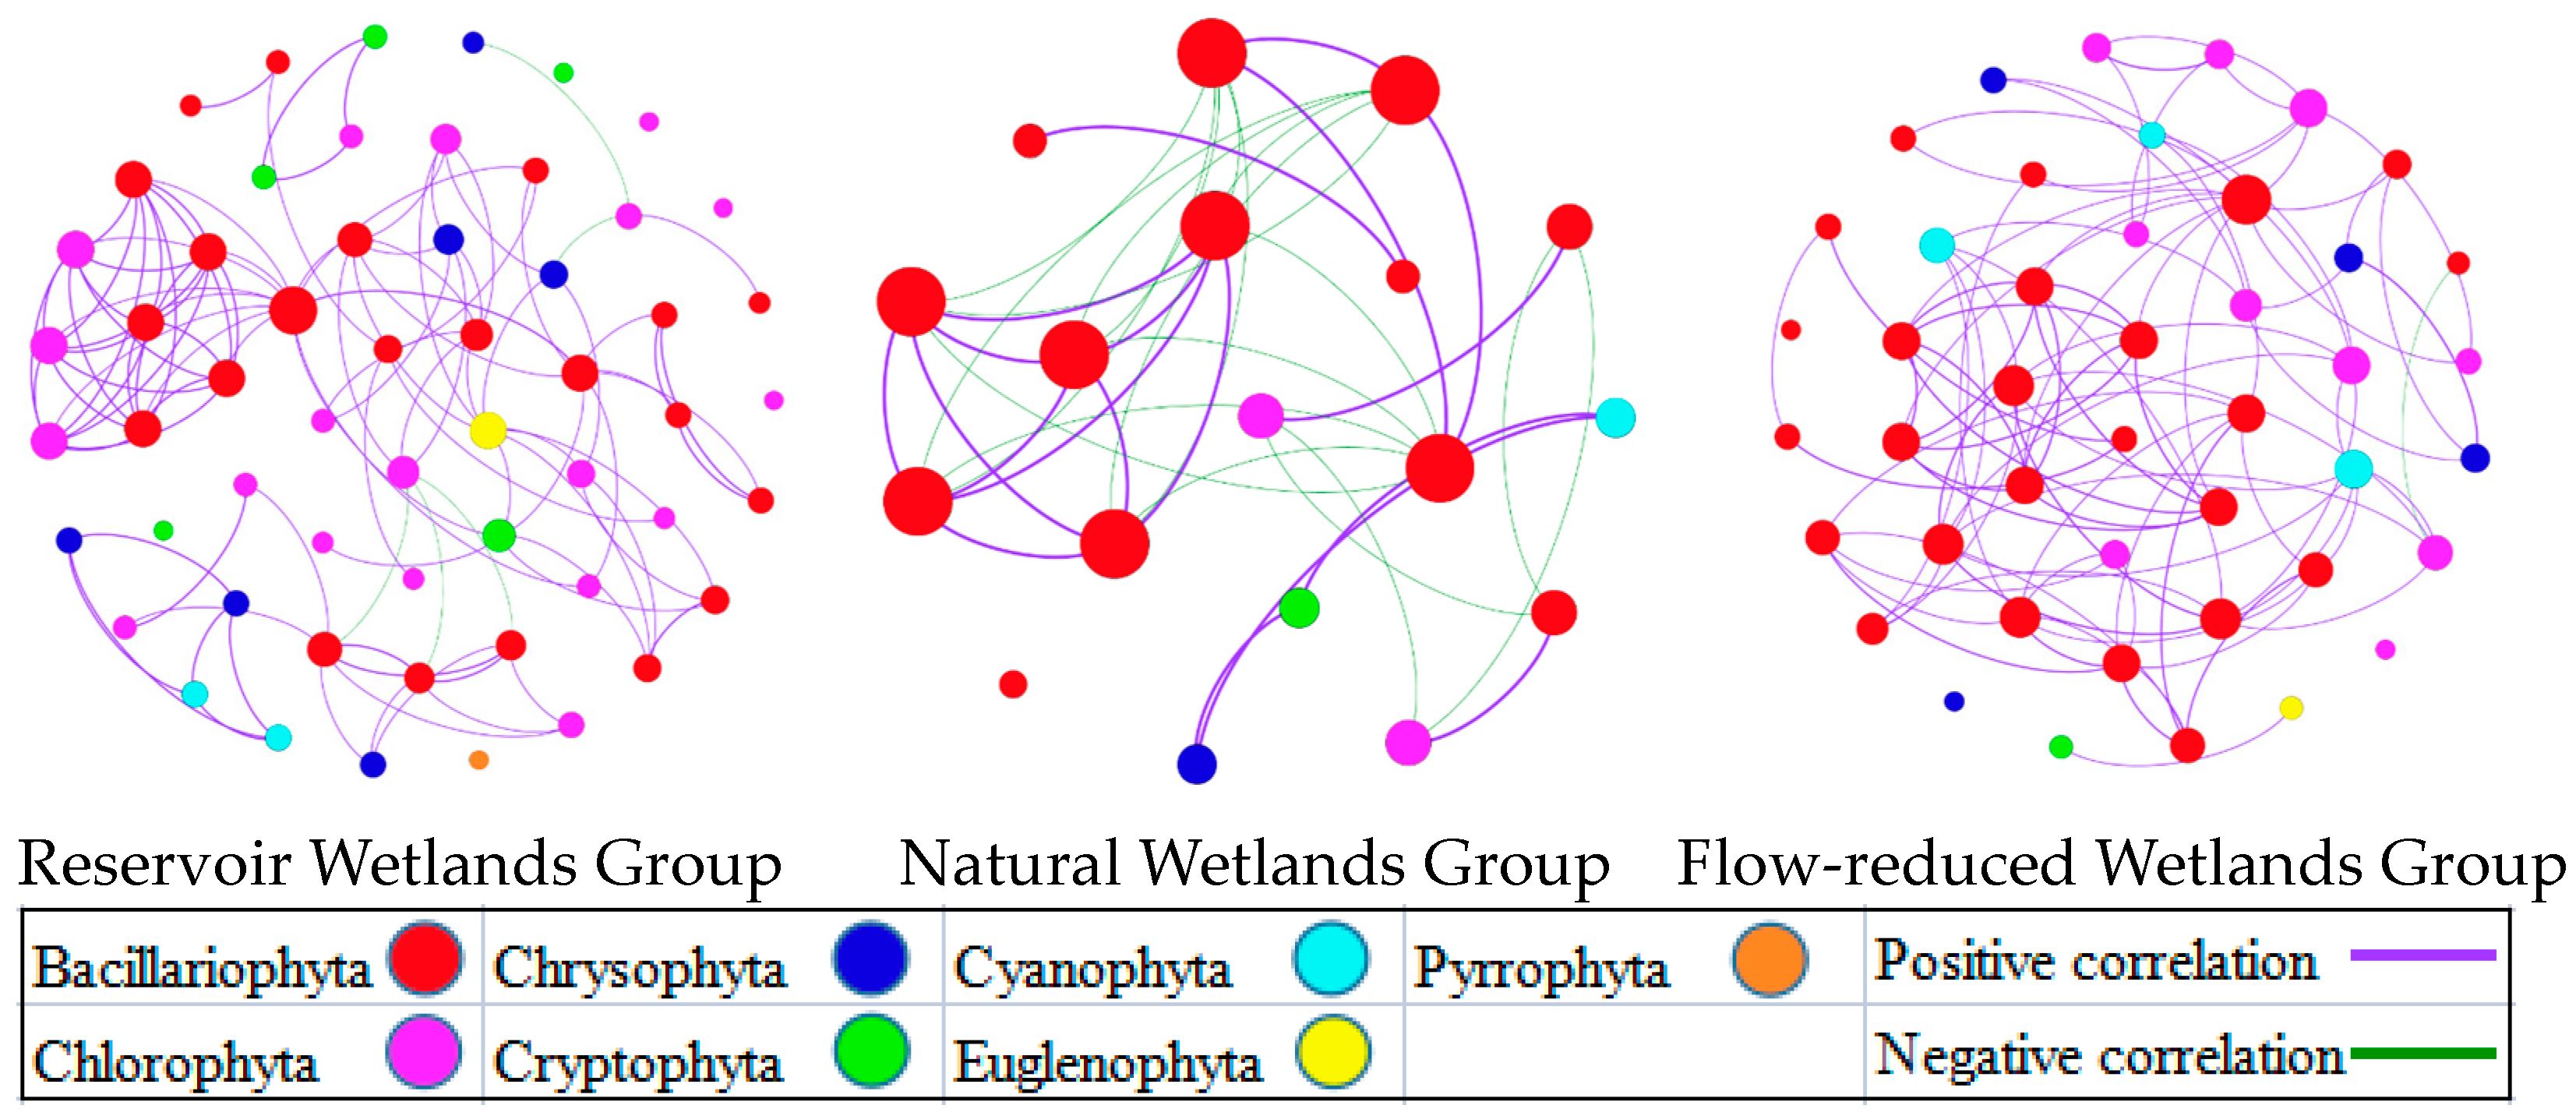
Spearman correlations based on phytoplankton community network analysis revealed the effect of river flow regulation on phytoplankton (Figure 4). Both the Reservoir Wetlands Group and the Flow-reduced Wetlands Group were significantly different from the Natural Wetlands Group and had modular structures; the modular values were 0.697 and 0.699, respectively. These results implied that the phytoplankton community networks of these two groups can be divided into small, independent, interacting modules with unique properties. The dominant group with a strong correlation with other groups were Bacillariophyta in the Reservoir Wetlands Group and the Flow-reduced Wetlands Group. Furthermore, the phytoplankton community of the Natural Wetlands Group showed a single and integral structure dominated by the Bacillariophyta species.
Thirteen phytoplankton taxa were selected as indicator species (Table 3). Chlamydomonas ovalis Zietz, Synedra acus Kutz., and Chlamydomonas globosa Snow. et al. were indicators for the Reservoir Wetlands Group. Diatoma vulgare Bory, Fragilaria capucina Desm., and Meridion circulare Ag. were indicators for the Flow-reduced Wetlands Group. Ceratoneis arcus Ktz. and Treubaria crassispina Smith were indicators for the Natural Wetlands Group.
3.2. Phytoplankton Community Functional Group
Phytoplankton were divided into nineteen functional groups (Table 1). The reservoir wetlands had more functional groups of phytoplankton than the natural wetlands and flow-reduced riverine wetlands. In natural wetlands, phytoplankton in mainstream were less than that in tributaries and increased from upstream to downstream (Figure 5). Additionally, the functional group L0 was the sole dominant group in these three riverine wetlands. The functional group L0 adapted to medium-nutrient water, was resistant to low-nutrient water and sensitive to water stratification. Compared with the natural wetlands, the proportions of functional group X2 and C in the reservoir wetlands were noticeably higher (Figure 5). The functional group X2 adapted to shallow water from medium to high nutrition and was sensitive to filter feeding. Functional group C adapted to mixed and medium-sized lakes, nutritious but without stratified water, was resistant to low carbon and light, and sensitive to low silicon content. Compared with the natural wetlands, the proportion of functional group MP in flow-reduced riverine wetlands was remarkably higher. The functional group MP adapted to medium-nutrient water as well as unstable shallow lakes.
4. Discussion
Numerous investigations have revealed that the construction and operation of water conservancy projects could lead to random variations in aquatic ecological environment and aquatic organisms [33,34,35]. In our study, we verified that community characteristics of phytoplankton differed in riverine wetlands with different water conditions due to the influence of dam construction, and then analyzed the succession trend of phytoplankton communities in this case.
The dam intercepting the water flow considerably affected the river runoff and partially contributed to the hydrologic conditions such as water depth and velocity, which varied greatly from one stretch to another, and indirectly determined the composition of aquatic organisms in the riverine wetland of the stretch [36,37,38]. Phytoplankton are a low-order component of aquatic communities with an abundance of species and individuals. The structure and composition of the phytoplankton community alter in response to changes in hydrologic conditions [39,40]. In the current investigation, phytoplankton communities collected from 21 sampling sites with different hydrological conditions were divided into three groups via cluster analysis, namely Reservoir Wetlands Group, Flow-reduced Wetlands Group and Natural Wetlands Group. The reservoir stretch has the largest water depth and the lowest flow velocity, and the water temperature lessens with the increase in depth, while the surface water commonly exhibits a higher temperature [41]. The value of chlorophyll in the reservoir stretches was the highest (0.698–1.784), followed by the flow-reduced stretches (0.323–1.052), and the natural stretches (0.317–0.793). These factors are very conducive to the propagation and accumulation of phytoplankton.
The variations in community structure and composition of phytoplankton could lead to differences in interspecific relationships, and the results of co-occurrence network analysis in the current scrutiny also reflected the results of cluster analysis [42]. The hydrological conditions of both Reservoir Wetlands Group and Flow-reduced Wetlands Group were relatively stable. Moreover, the interspecific relationship was relatively stable, and the interspecific interaction was relatively strong in these phytoplankton communities, and the co-occurrence network exhibited a modular structure.
According to the adaptation between aquatic organisms and the aquatic ecological environment, the indicator species can reflect the change tendency of aquatic organism community and aquatic ecological environment [43]. Eight, three, and two indicator species of phytoplankton communities were found in Reservoir Wetlands Group, Flow-reduced Wetlands Group and Natural Wetlands Group, respectively, and there was no overlap of indicator species among these three stretch groups. Almost all indicator species of the three groups belonged to the taxa Bacillariophyta and Chlorophyta, and Bacillariophyta exhibited a weak adaptability, while Chlorophyta showed a strong adaptability to water changes. We thus believe that cascade reservoirs lead to apparent discrepancies in the water environment of the three groups of riverine wetlands, and the wetland status can maintain a long-term stability [44].
The discrepancies in the proportions of phytoplankton functional groups in various riverine wetlands are essentially related to the adaptation of different species to the habitat, which is determined by hydrological conditions [45,46]. The species and quantity of phytoplankton in the Reservoir Wetlands Group were remarkably higher than those in the Flow-reduced Wetlands Group and the Natural Wetlands Group. Due to various forms of organic matter and minerals flowing into the reservoir along with the river, which gradually accumulated and enriched the reservoir, the suspended matter and bacteria in the reservoir stretch greatly increased. Furthermore, light and restrictions on other organisms provide environmental advantages for phytoplankton to survive [47,48]. Compared with the Natural Wetlands Group, functional group X2 and functional group C in the Reservoir Wetlands Group were abundant, indicating their response to the nutrient enrichment in the reservoir stretch, while the functional group MP, which is more suitable for unstable water, grew well in the Flow-reduced Wetlands Group. The volume and period of runoff in the flow-reduced stretch are mainly controlled by human activities, with highly random variations [49].
Restoration or reconstruction of hydrological connectivity is the central and fundamental objective of wetland restoration. The operation of cascade reservoirs typically intensifies negative impacts on biota and environmental variables. Dam construction should ensure the hydrological connectivity between upstream and downstream of the dam as well as the river channel and the riverine wetland. This scrutiny also provides a basis for an efficacious biomonitoring program which can use phytoplankton to restore wetlands in Northeastern China. Therefore, it can be exploited to identify the negative effects of engineering construction and the effectiveness of restoration efforts. This integrated approach should be potentially extended to the evaluation of worldwide wetland projects where phytoplankton are naturally distributed.
We set up similar sampling sites in the same study area and carried out research on benthic invertebrates [5]. The biological indexes, network analysis, functional group analysis and Canonical Correspondence Analysis with physical and chemical characteristics of rivers benthic invertebrates were conducted. In our previous research, we confirmed that cascade reservoirs significantly affect the composition and structure of aquatic organism communities in riverine wetlands of different stretches, which is consistent with the findings of this study. The benthic invertebrates from 22 sampling sites were also divided into Natural Wetlands Group, Reservoir Wetlands Group and Flow-reduced Wetlands Group. However, they showed different succession trends because of the different biological characteristics between benthic invertebrates and phytoplankton. For example, the result of network analysis shows that the benthic invertebrates communities of the Natural Wetlands Group and Flow-reduced Wetlands Group have modular structures, but the benthic invertebrates community of the reservoir wetlands group shows a single and integral structure. We will conduct subsequent studies on the same topic with zooplankton as the research object, and finally synthesize all the research conclusions, which will contribute to ecological protection of rivers in Northeast China.
5. Conclusions
Our results show that environmental variables are the most crucial factors in explaining the status of phytoplankton communities. Variations in indicator species of phytoplankton and their proportion of functional group composition were identified in different riverine wetlands. The phytoplankton community structure was sensitive to variations in hydrological connectivity with various types of riverine wetlands based on cascading reservoirs in the Manjiang and Songjiang rivers. Dam construction resulted in noticeable differences in the composition of phytoplankton communities in the riverine wetlands of reservoir stretch, flow-reduced stretch, and natural stretch. Co-occurrence network analysis further showed that the relationships among phytoplankton species were different in the three riverine wetlands. In addition, we also identified indicator species and variations in functional group composition ratio of phytoplankton in different riverine wetlands.
Author Contributions
Conceptualization, H.W. and Y.M.; methodology, H.W.; software, H.W.; validation, Y.M.; formal analysis, Y.M.; investigation, Y.M.; resources, H.W.; data curation, Y.M.; writing—original draft preparation, Y.M.; writing—review and editing, H.W.; visualization, H.W.; supervision, H.W.; project administration, H.W.; funding acquisition, H.W. All authors have read and agreed to the published version of the manuscript.
Funding
This work was supported by the Science and Technology Development Program of Jilin Province (20230101348JC; 20210509037RQ; JL2022-12) and the Professional Association of the Alliance of International Science Organizations (ANSO-PA-2020-14).
Data Availability Statement
Data is unavailable due to privacy or ethical restrictions.
Acknowledgments
We thank Xinhua He of the University of Western Australia for English editing and valuable comments.
Conflicts of Interest
The authors declare no conflict of interest.
References
- Muhammad, B.L.; Kim, T.; Ki, J.S. 18S rRNA analysis reveals high diversity of phytoplankton with emphasis on a naked Dinoflflagellate Gymnodinium sp. at the Han River (Korea). Diversity 2021, 13, 73. [Google Scholar] [CrossRef]
- Guo, J.; Zheng, Y.Y.; Teng, J.H.; Wang, X.M.; Song, J.X. Characteristics of spatial distribution for microbial ecology inside and outside source water reservoir. J. Clean Prod. 2021, 311, 127697. [Google Scholar] [CrossRef]
- Rui, P.R.; Feio, M.J.; Almeida, S.F.P.; Vieira, C.; Aguiar, F.C. Multi-biologic group analysis for an ecosystem response to longitudinal river regulation gradients. Sci. Total Eviron. 2021, 767, 144327. [Google Scholar] [CrossRef]
- Kim, D.Y.; Ji, R.B.; Feng, Z.X.; Jang, J.B.; Lee, D.I.; Lee, W.C.; Kang, C.K. Estuarine dam water discharge enhances summertime primary productivity near the southwestern Korean coast. Mar. Pollut. Bull. 2023, 191, 114971. [Google Scholar] [CrossRef]
- Meng, Y.; Wu, H.T.; Guan, Q.; Lu, K.L.; Kang, Y.J.; Dai, G.H. Responses of riparian insect communities to flow regulation in riverine wetlands of Northeastern China. Hydrobiologia 2022, 850, 3865–3877. [Google Scholar] [CrossRef]
- Korneva, L.G.; Solovyeva, V.V.; Sakharova, E.G. On the distribution of Peridiniopsis kevei Grigor. et Vasas (Dinophyta) in the upper Volga reservoirs. Inland Water Biol. 2015, 8, 414–416. [Google Scholar] [CrossRef]
- Wu, Q.; Li, Q.H.; Luo, H.; Chen, Q.; Chen, H.X.; Dong, Y.J.; Li, S.H. Comparison in phytoplankton diversity-productivity-community stability between river-type reservoir and lake-type reservoir. J. Oceanol Limnol. 2022, 40, 1485–1507. [Google Scholar] [CrossRef]
- dos Santos, N.C.L.; Garcia, B.E.; Dias, J.D.; Lopes, T.M.; Affonso, I.D.; Severi, W.; Gomes, L.C.; Agostinho, A.A. Cumulative ecological effects of a Neotropical reservoir cascade across multiple assemblages. Hydrobiologia 2018, 819, 77–91. [Google Scholar] [CrossRef]
- Yue, Y.H.; Fu, Z.W.; Chen, X.P.; Yang, M.; Wang, B.L.; Wang, F.S. Community structure and diversity phytoplankton in the Wujiang River Basin reservoir. J. Shanghai University (Nat. Sci. Edi.) 2021, 27, 97–105. [Google Scholar]
- Zhang, H.X.; Huo, S.L.; Cao, X.H.; Ma, C.Z.; Zhang, J.T.; Wu, F.C. Homogenization of reservoir eukaryotic algal and cyanobacterial communities is accelerated by dam construction and eutrophication. J. Hydrol. 2021, 603, 126842. [Google Scholar] [CrossRef]
- Kamidis, N.; Koutrakis, E.; Sapounidis, A.; Sylaios, G. Impact of river damming on downstream hydrology and hydrochemistry: The case of lower Nestos River catchment (NE. Greece). Water 2021, 13, 2832. [Google Scholar] [CrossRef]
- Korneva, L.G.; Solovyeva, V.V. Dynamics of morphofuncitonal groups of phytoplankton in the Rybinsk Reservoir and assessment of the Reservoir water quality by the community index. Water Resour. 2021, 48, 65–72. [Google Scholar] [CrossRef]
- Sirunda, J.; Oberholster, P.; Wolfaardt, G.; Truter, C.; van der Merwe, S. Long-term study of the drought impact on the phytoplankton concentration and assemblages in two water supply reservoirs in Namibia. Afr. J. Aquat. Sci. 2023, 48, 152–165. [Google Scholar] [CrossRef]
- Kumar, J.; Alam, A.; Borah, S.; Gogoi, P.; Das, B.K. Influence of barrages on hydrological parameters and functional groups of phytoplankton of a subtropical river Ganga, India. Environ. Sci. Pollut. R. 2023, 30, 77469–77487. [Google Scholar] [CrossRef] [PubMed]
- Caio, G.R.; Janne, S.; Gilsineia, C.; Felipe, S.P.; Marcela, M.; Patricia, D.; Marcelo, M.M. Functional rather than taxonomic diversity reveals changes in the phytoplankton community of a large dammed river. Ecol. Indic. 2021, 121, 107048. [Google Scholar] [CrossRef]
- Adamovich, B.V.; Medvinsky, A.B. Human activity as a factor causing the biomass, structure and seasonal dynamics of phytoplankton in adjacent fishponds. Rend. Lincei.-Sci. Fis. 2023, 34, 605–633. [Google Scholar] [CrossRef]
- Leibowitz, S.G.; Hill, R.A.; Creed, I.F.; Compton, J.E.; Golden, H.E.; Weber, M.H.; Rains, M.C.; Jones, C.E.; Lee, E.H.; Christensen, J.R.; et al. National hydrologic connectivity classification links wetlands with stream water quality. Nat. Water 2023, 1, 370–380. [Google Scholar] [CrossRef] [PubMed]
- Nagata, Y.; Ishiyama, N.; Nakamura, F.; Shibata, H.; Fukuzawa, K.; Morimoto, J. Contribution of Hydrological Connectivity in Maintaining Aquatic Plant Communities in Remnant Floodplain Ponds in Agricultural Landscapes. Wetlands 2023, 43, 38. [Google Scholar] [CrossRef]
- Esther, L.; Joshua, M.E.; Matthew, J.C. Patterns of Wetland Hydrologic Connectivity Across Coastal-Plain Wetlandscapes. Water Resour. 2023, 59, e2023WR034553. [Google Scholar] [CrossRef]
- Pénélope, B.D.; Guillaume, G.; Michael, P.; Joseph, C.; Milla, R. Integrating hydrological connectivity and zooplankton composition in Arctic ponds and lakes. Freshw. Biol. 2023, 68, 2131–2150. [Google Scholar]
- Ma, J.S.; Chen, W.Q.; Chen, M.J.; Zhong, K.; Yao, N.; Zhang, X.M.; Zhang, H.; Jeppesen, E.; Zhou, Q. Water level fluctuations associated with hydrological connectivity consolidate the food web stability of the largest Chinese freshwater lake via mediating trophodynamics and trophic structure. Ecol. Indic. 2023, 153, 110372. [Google Scholar] [CrossRef]
- Stepchinski, L.M.; Rains, M.C.; Lee, L.C.; Lis, R.A.; Nutter, W.L.; Rains, K.C.; Stewart, S.R. Hydrologic Connectivity and Flow Generation from California Vernal Pool, Swale, and Headwater Stream Complexes to Downstream Waters. Wetlands 2023, 43, 34. [Google Scholar] [CrossRef]
- Hu, H.J.; Wei, Y.X. The Freshwater Algae of China, 1st ed.; Science Press: Beijing, China, 2006; pp. 1–1023. [Google Scholar]
- Zhou, F.X.; Chen, J.H. Freshwater Micro-Organisms Atlas, 1st ed.; Chemical Industry Press: Beijing, China, 2005; pp. 1–367. [Google Scholar]
- Reynolds, C.S. Phytoplankton assemblages and their periodicity in stratifying lake systems. Ecography 1980, 3, 141–159. [Google Scholar] [CrossRef]
- Grime, J.P. Evidence for the existence of three primary strategies in plants and its relevance to ecological and evolutionary theory. Am. Nat. 1977, 111, 1169–1194. [Google Scholar] [CrossRef]
- Merritt, R.W.; Cummins, K.W. An introduction to the aquatic insects of North America. Freshwater Sci. 1996, 15, 593–595. [Google Scholar]
- Li, X.Z.; Liu, L.S.; Li, B.Q. Research and Practice of Marine Macroinvertebrate in China, 1st ed.; Maritime Press: Beijing, China, 2010; pp. 55–57. [Google Scholar]
- Reynolds, C.S.; Huszar, V.; Kruk, C.; Naselli, F.L.; Melo, S. Towards a functional classification of the freshwater phytoplankton. J. Plankton Res. 2002, 24, 417–428. [Google Scholar] [CrossRef]
- Reynolds, C.S. Phytoplankton periodicity: The interactions of form, function and environmental variability. Freshwater Biol. 1984, 14, 111–142. [Google Scholar] [CrossRef]
- Reynolds, C.S. Vegetation Processes in the Pelagic: A Model for Ecosystem Theory; Kinne, O., Ed.; Excellence in Ecology; Ecology Institute: Oldendorf/Luhe, Germany, 1997; pp. 70–71. [Google Scholar]
- Padisak, J.; Crossetti, L.O.; Naselli, F.L. Use and misuse in the application of the phytoplankton functional classification: A critical review with updates. Hydrobiologia 2009, 621, 1–19. [Google Scholar] [CrossRef]
- Bazhenova, O.P.; Mikhailov, V.V. Phytoplankton as an indicator of the modern ecological state of the Novosibirsk Reservoir. Inland Water Biol. 2021, 14, 670–678. [Google Scholar] [CrossRef]
- Huang, G.J.; Wang, X.Q.; Chen, Y.S.; Deng, L.; Xu, D.J. Survival strategies of phytoplankton functional groups to environmental factors in a drinking water reservoir, central China. Ann. Limnol.-Iny. J. Lim. 2021, 57, 18. [Google Scholar] [CrossRef]
- Wang, Y.B.; Liu, P.; Wu, C.; Li, X.; An, R.H.; Xie, K. Reservoir ecological operation by quantifying outflow disturbance to aquatic community dynamics. Eviron. Res. Lett. 2021, 16, 074005. [Google Scholar] [CrossRef]
- Wang, B.L.; Yang, X.Y.; Li, S.L.; Liang, X.; Li, X.D.; Wang, F.S.; Yang, M.L.; Liu, C.Q. Anthropogenic regulation governs nutrient cycling and biological succession in hydropower reservoirs. Sci. Total Eviron. 2022, 834, 155392. [Google Scholar] [CrossRef]
- Datsenko, Y.S.; Puklakov, V.V. Forecasting Phytoplankton Development in a Designed Low-Head Reservoir on the Don River. Water Resour. 2020, 47, 103–112. [Google Scholar] [CrossRef]
- Abdela, K.A.; Fantabil, A.; Muleta, D.; Yohannes, T.; Jonah, K. Bibliographic review on drought and water level articles. Discover Water 2023, 3, 17. [Google Scholar] [CrossRef]
- Trindade, R.M.L.; dos Santos, S.M.; de Souza, C.A.; dos Santos, C.R.A.; Bortolini, J.C. Using morphofunctional characteristics as a model of phytoplankton dynamics in a tropical reservoir. Braz. J. Bot. 2021, 44, 467–477. [Google Scholar] [CrossRef]
- Almeida, R.; Formiga, N.E.; Sousa, P.I.; Antunes, S.C. Contribution of zooplankton as a biological element in the assessment of reservoir water quality. Limnetical 2020, 39, 245–261. [Google Scholar] [CrossRef]
- Teixeira, A.P.; Bortolini, J.C.; Carneiro, F.M. Taxonomic and functional spatial distribution model of phytoplankton in tropical cascading reservoirs. Braz. J. Bot. 2022, 45, 791–805. [Google Scholar] [CrossRef]
- Mohanty, T.R.; Tiwari, N.K.; Das, B.K.; Swain, H.S.; Jhonson, C.; Banerjee, T. Riverine connectivity influences the phytoplankton ecology in the open floodplain wetland of the lower river Ganga. Environ. Monit. Assess. 2023, 195, 1403. [Google Scholar] [CrossRef] [PubMed]
- Abobi, S.M.; Kluger, L.C.; Wolff, M. Comparative assessment of food web structure and fisheries productivity of three reservoirs in Ghana. Fisheries Manag. Ecol. 2021, 28, 573–591. [Google Scholar] [CrossRef]
- Cazzanelli, M.; Castillo, M.M.; Soria, B.M.; Ochoa, G.S.; Sepúlveda, L.A.; Patiño, E.S.G.; Jiménez, P.N.C.; Rodiles, H.R. Epiphytes support aquatic consumers of a large floodplain lake ecosystem in the southern Gulf of Mexico. Aquat. Sci. 2023, 85, 114. [Google Scholar] [CrossRef]
- Han, L.B.; Li, Q.H.; Chen, W.S.; Wang, X.; Zhou, S.H.; Han, M.S.; Brancelj, A. The key environmental factors driving the succession of phytoplankton functional groups in Hongfeng Reservoir, southwest China. J. Oceanol. Limnol. 2022, 40, 1472–1484. [Google Scholar] [CrossRef]
- Sharip, Z. Changes in phytoplankton and zooplankton abundance and diversity in macrophyte-dominated and open pelagic ecosystem of shallow reservoirs. Inland Water Biol. 2021, 14, 427–437. [Google Scholar] [CrossRef]
- Meng, Y.; Wu, H.T.; Guan, Q.; Lu, K.L. The ecological response of Odonata larvae to hydrologic connection blocking in riverside wetlands of the Wusuli River. Chinese J. Ecol. 2021, 40, 453–459. [Google Scholar]
- Li, R.H.; Wu, Z.Q.; Huang, X.S.; Li, L.; Huang, L.; Liu, W.; Li, Y.P.; Wu, J.Q. Correlation analysis of water quality and aquatic communities in Dawangtan Reservoir, China. J. Coastal Res. 2020, 104, 575–583. [Google Scholar] [CrossRef]
- Sarma, V.V.S.S.; Krishna, M.S.; Srinivas, T.N.R. Long-term changes in Nutrient Concentration and Fluxes from the Godavari Estuary: Role of River Discharge and Fertilizer Inputs. Estuar. Coast. 2023, 46, 959–973. [Google Scholar] [CrossRef]
Figure 1.
Location of the 21 sampling sites in riverine wetlands along the Manjiang and Songjiang rivers.
Figure 1.
Location of the 21 sampling sites in riverine wetlands along the Manjiang and Songjiang rivers.

Figure 2.
The Shannon–Wiener diversity index and the Pielou evenness index analysis of phytoplankton communities of 21 sampling sites in the riverine wetlands along the Manjiang and Songjiang rivers.
Figure 2.
The Shannon–Wiener diversity index and the Pielou evenness index analysis of phytoplankton communities of 21 sampling sites in the riverine wetlands along the Manjiang and Songjiang rivers.

Figure 3.
Cluster analysis of phytoplankton communities of 21 sampling sites in the riverine wetlands along the Manjiang and Songjiang rivers.
Figure 3.
Cluster analysis of phytoplankton communities of 21 sampling sites in the riverine wetlands along the Manjiang and Songjiang rivers.

Figure 4.
Co-occurrence network diagrams for phytoplankton communities in the riverine wetlands of Reservoir Wetlands Group, Natural Wetlands Group and Flow-reduced Wetlands Group.
Figure 4.
Co-occurrence network diagrams for phytoplankton communities in the riverine wetlands of Reservoir Wetlands Group, Natural Wetlands Group and Flow-reduced Wetlands Group.

Figure 5.
Distribution proportions of phytoplankton functional groups in the riverine wetlands of reservoir stretch, flow-reduced stretch and natural stretch. RW: reservoir wetlands; FW: flow-reduced wetlands; NW: natural wetlands. C, D, F, MP, L0, S1, X2, and X3 are the functional groups of phytoplankton [32].


Table 1.
List and functional groups of phytoplankton in the riverine wetlands of natural stretches in the upper portions of both rivers, the different reservoir impoundments, and the flow-reduced stretches in the lower portions of reservoirs on the Manjiang and Songjiang rivers.
Table 1.
List and functional groups of phytoplankton in the riverine wetlands of natural stretches in the upper portions of both rivers, the different reservoir impoundments, and the flow-reduced stretches in the lower portions of reservoirs on the Manjiang and Songjiang rivers.
| Phylum | Species | NW | RW | FW | FG |
|---|---|---|---|---|---|
| Bacillariophyta | Amphora ovalis | 1 | 2 | L0 | |
| Asterionella formosa | 2 | 1 | C | ||
| Ceratoneis arcus | 1 | 1 | MP | ||
| Cocconeis placentula | 1 | 1 | MP | ||
| Cyclotella meneghiniana | 2 | 3 | 2 | C | |
| Cymatopleura solea | 1 | MP | |||
| Cymbella ventricosa | 1 | 2 | 2 | MP | |
| Diatoma vulgare | 1 | 1 | 2 | MP | |
| Eunotia ehrenberg | 1 | MP | |||
| Fragilaria brevistriata | 2 | 3 | 3 | P | |
| Fragilaria ca pucina | 1 | 1 | 2 | P | |
| Fragilaria virescens | 1 | 1 | 1 | P | |
| Gyrosigma acuminatum | 1 | L0 | |||
| Gomphonema constrictum | 1 | 1 | MP | ||
| Gomphonema constrictum var.capitatum | 2 | 1 | 1 | MP | |
| Melosira granulata var. angustissima | 1 | 1 | 1 | P | |
| Melosira granulata var. angustissima f. spiralis | 1 | P | |||
| Melosira varians | 1 | 1 | 2 | TB | |
| Meridion circulare | 2 | 1 | 2 | MP | |
| Navicula anglica | 1 | 2 | 2 | MP | |
| Navicula dicephala | 1 | MP | |||
| Navicula exigua | 2 | 2 | 2 | MP | |
| Navicula radiosa | 2 | 1 | 2 | MP | |
| Pinnularia major | 1 | 1 | MP | ||
| Surirella angustata | 1 | MP | |||
| Synedra acus | 2 | 2 | 2 | D | |
| Synedra ulna | 1 | 1 | D | ||
| Synedra tabulata | 1 | 1 | 1 | D | |
| Chlorophyta | Actinastrum fluviatile | J | |||
| Ankistrodesmus acicularis | 1 | X1 | |||
| Ankistrodesmus angustus | 2 | 1 | X1 | ||
| Chlamydomonas globosa | 1 | 2 | 1 | X2 | |
| Chlamydomonas ovalis | 1 | 3 | 1 | X2 | |
| Chodatella quadriseta | 1 | 1 | J | ||
| Cosmarium obtusatum | 1 | N | |||
| Crucigenia apiculata | J | ||||
| Crucigenia tetrapedia | J | ||||
| Dictyosphaerium pulchellum | 2 | 1 | F | ||
| Kirchneriella lunaris | 1 | F | |||
| Oocystis elliptica | 1 | 1 | F | ||
| Pandorina morum | 2 | G | |||
| Scenedesmus platydiscus | 2 | J | |||
| Scenedesmus quadricauda | 1 | 2 | J | ||
| Selenastrum gracile | 1 | 1 | F | ||
| Stichococcus bacillaris | 1 | 1 | F | ||
| Tetrastrum elegans | 1 | J | |||
| Tetraëdron pusillum | 1 | J | |||
| Tetraëdron trilobulatum | 1 | J | |||
| Treubaria crassispina | 1 | 1 | F | ||
| Ulothris variabilis | MP | ||||
| Westella botryoides | 1 | F | |||
| Westellopsis linearis | 1 | F | |||
| Chrysophyta | Chromulina elegans | 2 | 3 | 2 | X3 |
| Chromulina globosa | 1 | 1 | X3 | ||
| Dinobryon divergens | 1 | E | |||
| Kephyrion planctonicum | 1 | 1 | X3 | ||
| Mallomonas Perty | 1 | Ws | |||
| Synura Ehrenberg | 1 | Ws | |||
| Cryptophyta | Chroomonas acuta | 1 | X2 | ||
| Cryptomonas ovata | 1 | 2 | 1 | Y | |
| Cyanophyta | Aphanizomenon flos-aquae | 1 | H1 | ||
| Chroococcus minutus | 1 | L0 | |||
| Merismopedia marssonii | 2 | 2 | L0 | ||
| Merismopedia minima | 4 | 4 | 4 | L0 | |
| Phormidium allorgei | 2 | 1 | S1 | ||
| Phormidium lismorense | 2 | S1 | |||
| Euglenophyta | Euglena oxyuris | 1 | 1 | W1 | |
| Pyrrophyta | Glenodinium pulvisculus | 1 | Y |
Abbreviations: FG: functional groups; FW: flow-reduced wetlands; NW: natural wetlands; RW: reservoir wetlands. Logarithmic scale: individual numbers 1–9 are represented by the number 1; individual numbers 10–99 are represented by the number 2; individual numbers 100–999 are represented by the number 3; individual numbers 1000–9999 are represented by the number 4.
Table 2.
Dominant species of phytoplankton communities in the riverine wetlands of natural stretches in the upper portions of reservoirs, the reservoir stretches, and flow-reduced stretches in the lower portions of reservoirs on the Manjiang and Songjiang rivers.
Table 2.
Dominant species of phytoplankton communities in the riverine wetlands of natural stretches in the upper portions of reservoirs, the reservoir stretches, and flow-reduced stretches in the lower portions of reservoirs on the Manjiang and Songjiang rivers.
| Phylum | Species | Frequency | Proportion | Dominance |
|---|---|---|---|---|
| Bacillariophyta | Cyclotella meneghiniana Kiits | 1.0000 | 0.1051 | 0.1051 |
| Cymbella ventricosa Kutz. | 0.8333 | 0.0283 | 0.0236 | |
| Fragilaria brevistriata Grun | 1.0000 | 0.1459 | 0.1459 | |
| Navicula exigua Greg | 1.0000 | 0.0912 | 0.0912 | |
| Synedra acus Kutz. | 0.8333 | 0.0422 | 0.0352 | |
| Chlorophyta | Chlamydomonas ovalis Zietz | 0.6667 | 0.2136 | 0.1424 |
| Chrysophyta | Chromulina elegans Doflein | 1.0000 | 0.0576 | 0.0576 |
| Cryptophyta | Cryptomonas ovata Ehrenberg | 0.5000 | 0.0432 | 0.0216 |
| Cyanophyta | Merismopedia minima G.Beck | 0.9444 | 0.0907 | 0.0857 |
Table 3.
Indicator species of phytoplankton communities in the riverine wetlands of Reservoir Wetlands Group, Flow-reduced Wetlands Group and Natural Wetlands Group.
Table 3.
Indicator species of phytoplankton communities in the riverine wetlands of Reservoir Wetlands Group, Flow-reduced Wetlands Group and Natural Wetlands Group.
| Group | Indicator Species | Functional Group | Indicator Value | p |
|---|---|---|---|---|
| Reservoir Wetlands Group | Chlamydomonas ovalis Zietz | X2 | 99.0 | 0.0002 |
| Synedra acus Kutz. | D | 70.2 | 0.0002 | |
| Chlamydomonas globosa Snow. | X2 | 84.5 | 0.0004 | |
| Ankistrodesmus angustus Bernard | X1 | 80.5 | 0.0004 | |
| Cyclotella meneghiniana Ktz. | C | 67.7 | 0.0034 | |
| Chromulina elegans Doflein | X3 | 65.0 | 0.0044 | |
| Kirchneriella lunaris Krich. | F | 62.5 | 0.0102 | |
| Asterionella formosa Hassall | C | 60.5 | 0.0268 | |
| Flow-reduced Wetlands Group | Diatoma vulgare Bory | MP | 84.6 | 0.0030 |
| Fragilaria capucina Desm. | P | 68.9 | 0.0124 | |
| Meridion circulare Ag. | MP | 73.1 | 0.0224 | |
| Natural Wetlands Group | Ceratoneis arcus Ktz. | MP | 89.9 | 0.0018 |
| Treubaria crassispina Smith | F | 61.0 | 0.0134 |
Disclaimer/Publisher’s Note: The statements, opinions and data contained in all publications are solely those of the individual author(s) and contributor(s) and not of MDPI and/or the editor(s). MDPI and/or the editor(s) disclaim responsibility for any injury to people or property resulting from any ideas, methods, instructions or products referred to in the content. |
© 2023 by the authors. Licensee MDPI, Basel, Switzerland. This article is an open access article distributed under the terms and conditions of the Creative Commons Attribution (CC BY) license (https://creativecommons.org/licenses/by/4.0/).
Share and Cite
MDPI and ACS Style
Meng, Y.; Wu, H. Responses of Phytoplankton Communities to Flow Regulation in Northeastern Riverine Wetlands of China. Diversity 2023, 15, 1191. https://0-doi-org.brum.beds.ac.uk/10.3390/d15121191
AMA Style
Meng Y, Wu H. Responses of Phytoplankton Communities to Flow Regulation in Northeastern Riverine Wetlands of China. Diversity. 2023; 15(12):1191. https://0-doi-org.brum.beds.ac.uk/10.3390/d15121191
Chicago/Turabian StyleMeng, Yao, and Haitao Wu. 2023. "Responses of Phytoplankton Communities to Flow Regulation in Northeastern Riverine Wetlands of China" Diversity 15, no. 12: 1191. https://0-doi-org.brum.beds.ac.uk/10.3390/d15121191
Note that from the first issue of 2016, this journal uses article numbers instead of page numbers. See further details here.