Article

Spatial Patterns of Neutral and Functional Genetic Variations along Dendritic Networks of Riverscape in Brown Trout Populations

1
CNRS (Centre National de la Recherche Scientifique), INPT (Institut National Polytechnique de Toulouse), UMR-5245 LEFE (Laboratoire Ecologie Fonctionnelle et Environnement), Université Toulouse III-Paul Sabatier, Av. de l’Agrobiopole, 31326 Auzeville-Tolosane, France
2
CNRS, IRD (Institut de Recherche pour le Développement), UMR-5174 EDB (Laboratoire Evolution & Diversité Biologique), Université Toulouse III-Paul Sabatier, Bâtiment 4R1 31062 cedex 9, 118 Rte de Narbonne, 31077 Toulouse, France
3
CNRS, SETE (Station d’Écologie Théorique et Expérimentale) du CNRS à Moulis, Université Toulouse III-Paul Sabatier, 2 Route du cnrs, 09200 Moulis, France
4
UMR DECOD (Ecosystem Dynamics and Sustainability), INRAE (Institut National de Recherche pour l’Agriculture, l’Alimentation et l’Environnement), Institut Agro, IFREMER (Institut Français de Recherche pour l’Exploitation de La Mer), 65 rue de Saint Brieuc, 35000 Rennes, France
5
Institut Universitaire de France IUF, 5 Rue Thomas Mann, 75013 Paris, France
6
CBGP (Centre de Biologie pour la Gestion des Populations), INRAE, CIRAD (Centre de coopération Internationale en Recherche Agronomique pour le Développement), Institut Agro, IRD, Université de Montpellier, Av. du Campus Agropolis, 34980 Montferrier-sur-Lez, France
*
Author to whom correspondence should be addressed.
Submission received: 14 April 2023 / Revised: 12 June 2023 / Accepted: 14 June 2023 / Published: 17 June 2023

Abstract

:
Understanding how environmental gradients shape the spatial patterns of intraspecific genetic diversity is a central issue in ecological and evolutionary sciences. In riverine ecosystems, there is generally an increase in neutral genetic diversity downstream, as well as an increase in genetic differentiation among upstream populations. However, selective pressures may vary markedly along the upstream–downstream gradient, which could modify these patterns, but this has rarely been tested empirically. Here, we investigated how environmental gradients in a river network could shape the spatial patterns of intraspecific genetic diversity and differentiation in both neutral SNP markers and functional genetic markers putatively under natural selection (candidate SNPs associated with physiological functions and immune Major Histocompatibility Complex (MHC) loci) in wild brown trout populations. First, we showed that both the distance from the confluence and the centrality on the river network could explain the variation in genetic diversity and differentiation. Second, we found that both neutral and functional markers followed a similar pattern, with a higher genetic diversity and a lower genetic differentiation among populations that were more central and/or near to the confluence. This study highlights the importance of considering both the spatial and hydrological factors of a river network to understand and predict the role of dendritic connectivity in the spatial patterns of genetic diversity and differentiation in wild fish populations.

1. Introduction

Understanding how environmental gradients shape the spatial patterns of intraspecific genetic diversity and differentiation is a central issue in ecology and evolution, with important implications for biodiversity conservation [1,2,3]. Genetic variation in natural populations is shaped by a combination of neutral factors such as mutation, drift, dispersal, and changes in the effective population size, as well as non neutral mechanisms such as natural selection. These mechanisms can lead to spatial patterns of genetic diversity and differentiation that can be observed at a small and large scale along latitudinal and longitudinal gradients [4,5,6,7].
Over the last decade, an increasing number of studies have examined how the specific spatial structure of riverine ecosystems and the associated environmental gradients shape genetic and ecological patterns [8]. Indeed, riverine ecosystems are hierarchical and dendritic networks are structured by elevation [9]. First, unidirectional water flow may cause downstream-biased dispersal and asymmetric gene flow [10,11,12]. Second, increased habitat availability downstream (due to increasing river width) may favor larger effective population sizes (Ne) [12,13]. Third, an upstream-directed colonization (assuming that founding populations are located downstream after, e.g., a glacial event) may lead to a loss of genetic variation along colonization routes [14]. These three processes may lead to an increase in neutral genetic diversity downstream [6,12,15,16,17]. Moreover, the dendritic geometry of riverscapes shapes the population structure so that downstream zones of confluence are potential admixture zones between individuals from different lineages, while upstream populations are expected to be more isolated from each other. This often leads to a higher neutral genetic differentiation among upstream populations compared to downstream populations [13,18,19,20]. Finally, anthropogenic fragmentation, such as dams or weirs, may negatively impact genetic diversity and the population structure according to species [21]. Up to now, most studies investigating the spatial patterns of genetic diversity of and/or differentiation in riverscapes have focused on neutral genetic markers, and there is thus a lack of knowledge on how functional genetic markers (i.e., DNA sequences coding for a protein) vary along dendritic networks, despite their functional importance in natural populations.
Indeed, environmental pressures in rivers may vary significantly along the upstream–downstream gradient, potentially resulting in different spatial patterns in functional genetic markers compared to neutral markers. For instance, water temperature, a key selective agent in ectotherms such as fish [22], generally increases downstream, while water quality generally decreases due to increased anthropogenic activities and pollution along the course of the river [23]. Additionally, predator and pathogen communities tend to be more diverse and more virulent in downstream areas due to increased temperature and prey/host diversity [24]. These environmental variations in selective pressures may influence the distribution of functional genetic variations in fish populations along rivers [25,26].
To tackle these questions, we used the brown trout (Salmo trutta) as a model species because it is particularly sensitive to temperature and water quality changes [27,28,29]. In addition, many wild brown trout populations suffer from various pathogens and diseases, whose prevalence and severity vary along the upstream–downstream gradient [30,31]. For instance, the myxozoan pathogen Tetracapsuloides bryosalmonae, responsible for Proliferative Kidney Disease (PKD), is often more prevalent downstream due to increased water temperature [32,33,34].
The aim of this study is therefore to investigate how environmental gradients shape intraspecific diversity and differentiation in both neutral and functional genetic markers in wild brown trout populations. Based on previous studies, we first predicted that neutral genetic diversity would be higher downstream due to one of the three processes explained above (i.e., downstream-biased dispersal, higher effective population size in downstream areas, upstream-directed colonization) [12]. We also expected to find a higher downstream genetic diversity for functional markers due to a higher selective pressure downstream. Second, we predicted that genetic differentiation measured using neutral markers would be higher between populations located upstream because of geographic isolation caused by dendritic networks of riverscapes [13]. In contrast, genetic differentiation in functional genetic markers could be lower between populations located upstream due to convergent selective pressures in all upstream sites (similar environmental biotic and abiotic conditions).

2. Materials and Methods

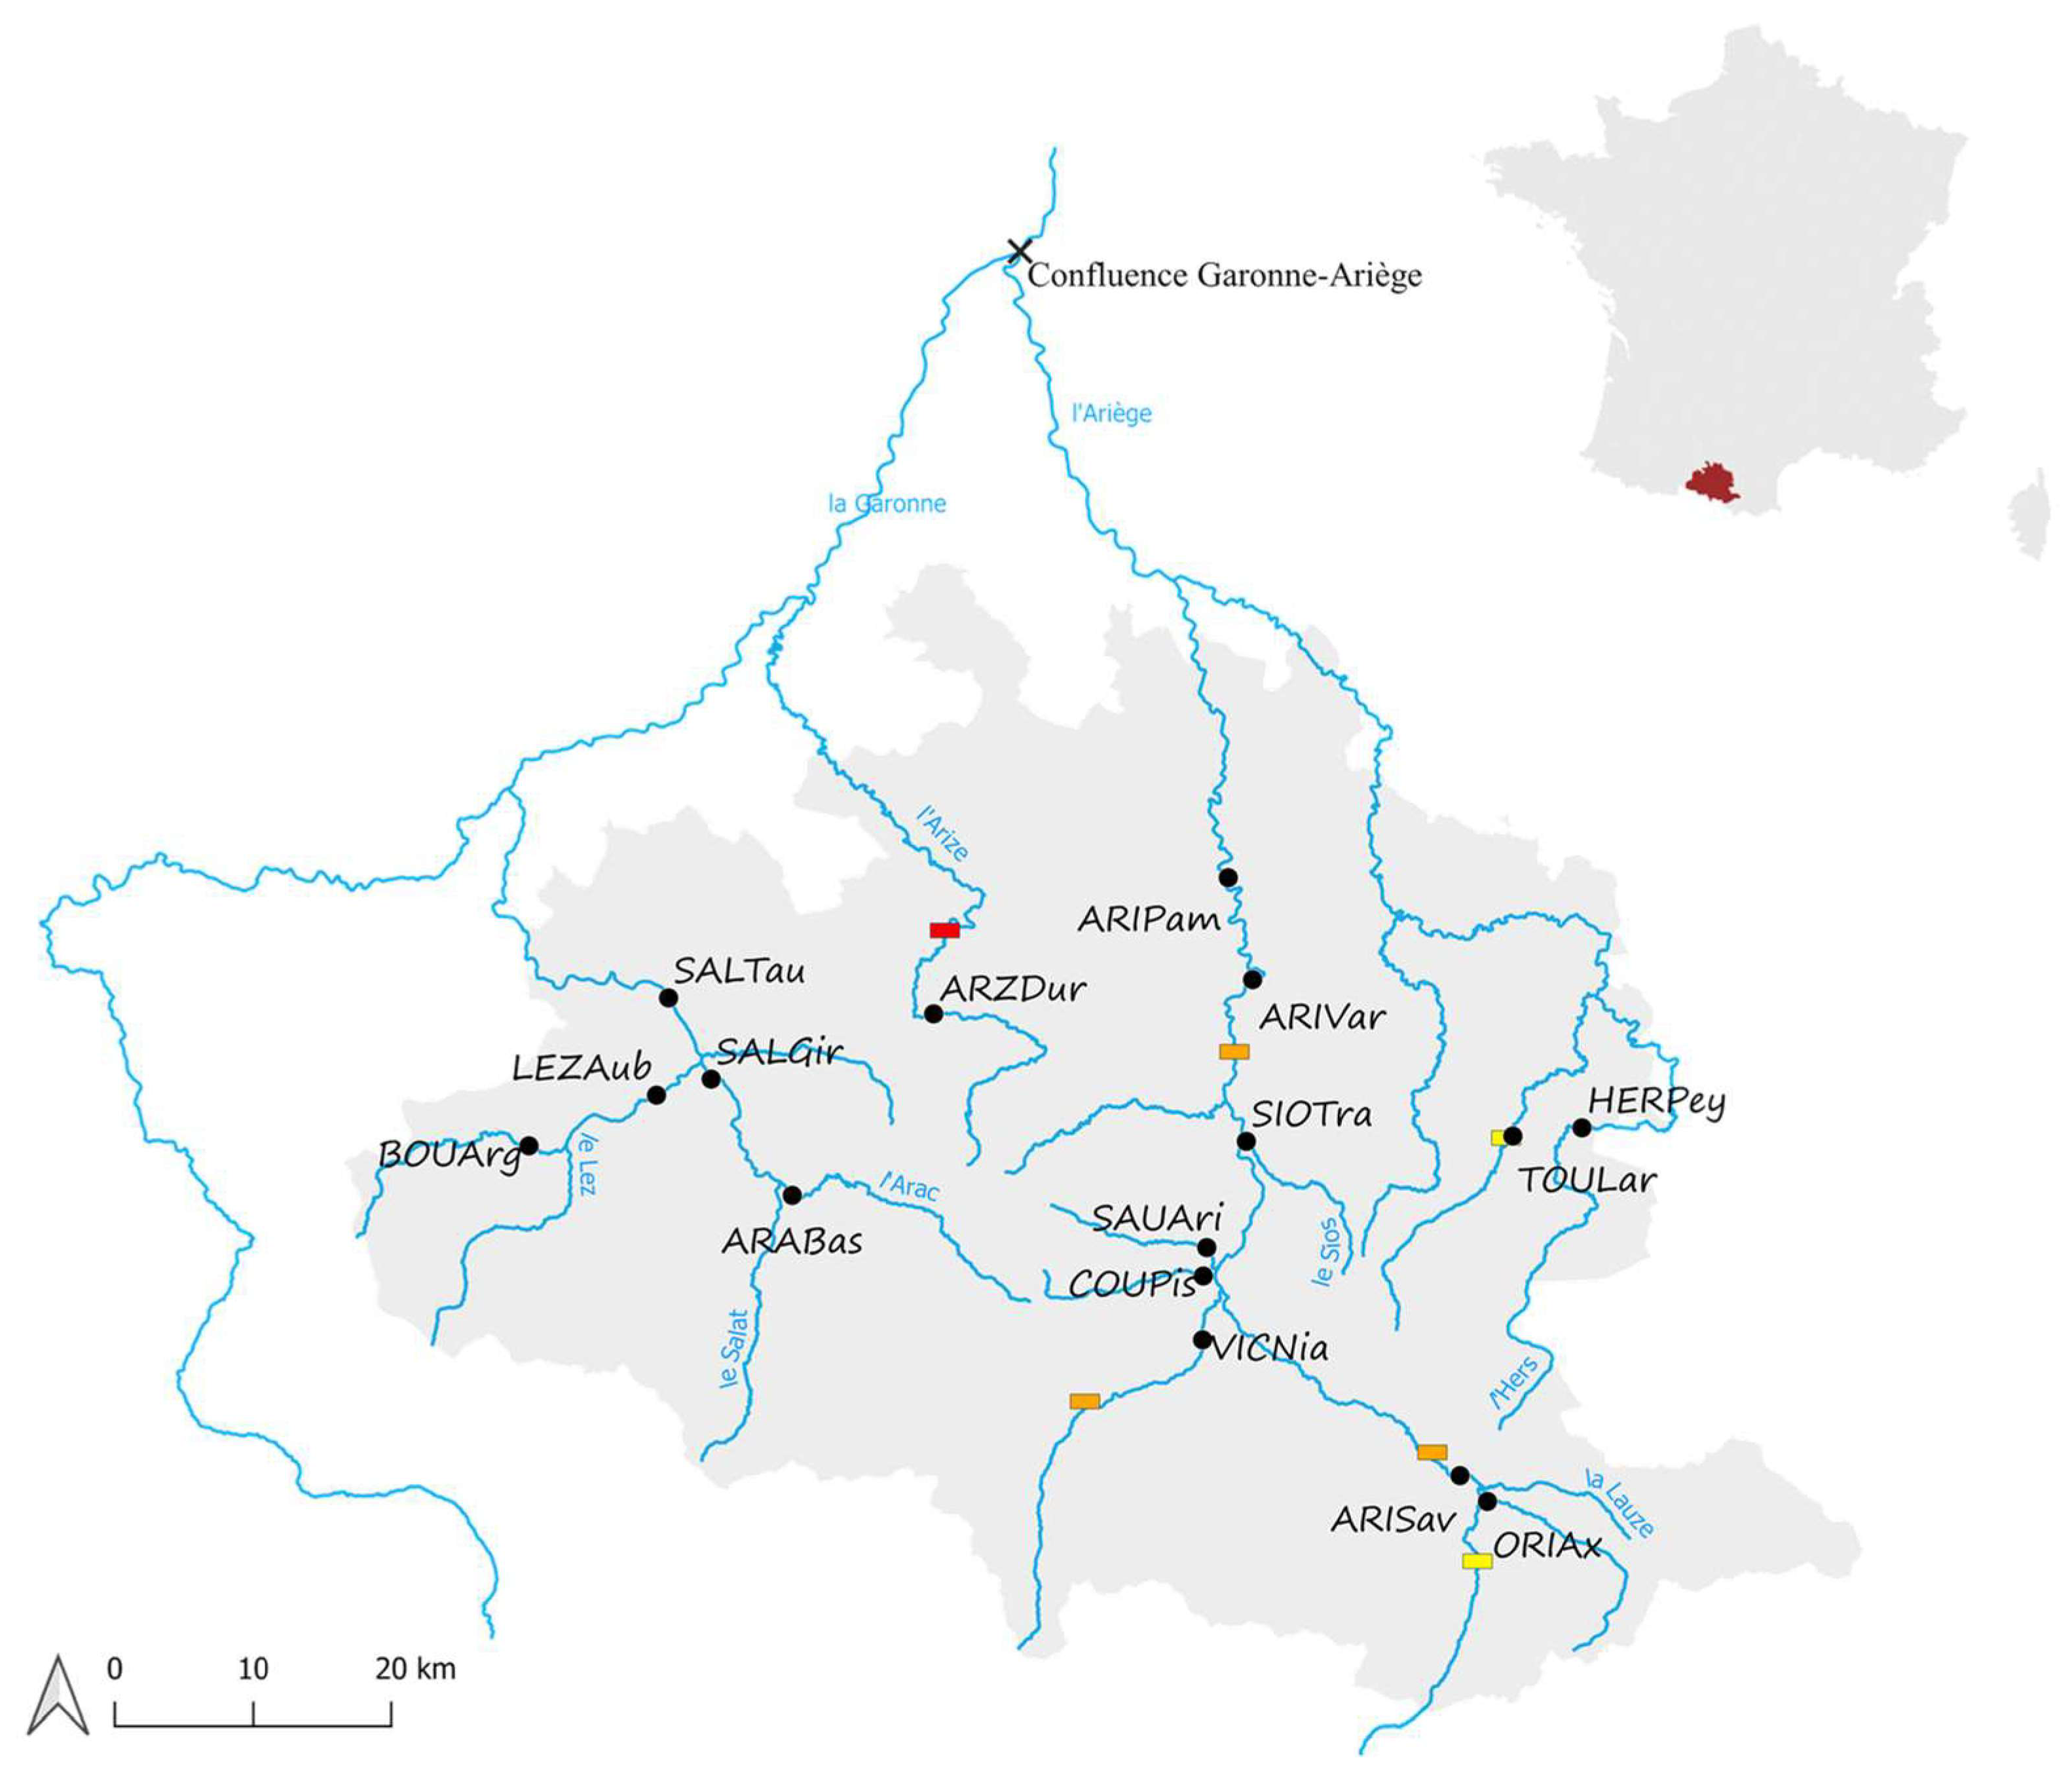
2.1. Study Areas and Fish Sampling

We sampled sixteen brown trout populations in the Central French Pyrenees along upstream–downstream gradients in the Garonne and Ariège sub-river basins (Ariège Department, southwestern France, Figure 1) between September and October 2018. For each site, up to twenty fish of different ages (0+, 1+ and 2+ fish) were sampled (n = 318, Table 1) using electrofishing. After anesthesia, a small piece of pelvic fin was sampled from each individual and stored in 96% alcohol for genotyping analyses.

2.2. Spatial Data

We used the distance of each site from a common confluence as a measure of the population position along the upstream–downstream gradient, with downstream populations having the shortest distance from the confluence [12,16]. Here, the nearest confluence shared by all the sites was that between the Ariège and the Garonne rivers (Figure 1). We also computed the centrality of each site on the river network, which represents how important a site is in terms of structural connectivity [35]). The centrality measure in a river network is the sum of distances of a node to all other nodes. We have thus added about 200 points along our river network every 5km, so that they are evenly spread over the network (Figure S1). We then calculated the shortest path between each pair of points in the network. Finally, we counted how often our sites of interest lie on the shortest path between each pair of nodes in the network in order to obtain centrality values, which were then scaled to the mean (Table 1). All these measures (i.e., distance from the confluence and centrality) were computed using Geographic Information System software (QGIS Development Team, 2008, V 3.12) with the “Shortest path” option from the network analysis tools.

2.3. Genotyping of Neutral and Functional Genetic Markers

Neutral genetic diversity was measured using a set of 143 putative neutral Single Nucleotide Polymorphisms (SNPs, Table S1) evenly spread across the brown trout genome, developed by Saint-Pé et al. [36]. Functional genetic diversity was first evaluated using a set of 19 ‘candidate’ SNPs markers (Table S2) related to physiological functions and/or tolerance or resistance to pathogens in brown trout [37]. SNP genotyping was conducted by the genomic service of LGC Genomics (Biosearch Technology, Teddington, UK) using a KASPAR® genotyping approach. To ensure the reliability of the genotyping, we duplicated 54 individuals that indicated no error in scoring. We also screened the genetic diversity of Major Histocompatibility Complex (MHC) class IIβ that is involved in several critical immune processes and parasite resistance [38,39]. MHC gene diversity is strongly affected by environmental variations (temperature, water quality and pathogen communities) along spatial gradients in salmonids [24,38].
The genotyping procedure of MHC class IIβ was described in Portanier et al. [40]. Concisely, a two-step PCR (polymerase chain reaction) was performed to amplify the second exon of the MHC class IIβ gene (Satr-DAB) in each fish, using the forward primer 5′-TCT GTA TTA TGT TTT CCT TCC-3′ [41] and the reverse primer 5′-CAC CTG TCT TGT CCA GTA TG-3′ [42]. Technical replicates for 54 individuals (17%) were used to measure the error rate and assess the robustness of the genotypes, and negative controls for PCR and indexing were added to each PCR microplate to detect potential contamination. PCR products were pooled by volume and a 2 × 250 bp paired-end Nano MiSeq (Illumina, San Diego, CA, USA) run was conducted. The FROGS software [43] was used to sort sequences, identify and discard artifactual variants, and generate the haplotypes and individual genotypes (Table S3).

2.4. Genetic Analyses

Descriptive statistics. Hardy-Weinberg expectations were calculated using Arlequin V. 3.5.2.2 [44]. Only the loci that showed deviations from Hardy–Weinberg equilibrium in all populations were excluded from the analysis. The loci that showed HWE deviations for at least one population were retained. FIS, observed (Ho), and expected (He) heterozygosity per population were calculated using GENETIX V. 4.05.2 [45] after 10,000 permutations of alleles within each population. The potential occurrence of null alleles and scoring errors due to stuttering or large allele dropout in the dataset was assessed using the software Micro-Checker V.2.2.3 ([46], Supporting Information S1).
Genetic diversity. FSTAT V.2.9.4 [47] was used to compute the allelic richness (Ar) as a standardized measure of population genetic diversity, adjusted for the smallest sample size (n = 13 individuals in our case) [12]. The local diversity estimate based on expected heterozygosity (He) was also tested along the environmental gradient.
Genetic differentiation. As a measure of differentiation, we computed the Pairwise FST. The pairwise FST was calculated using GENEPOP V. 4.7.5 [48] for each marker independently. We then computed the mean values of the pairwise FST for each population (hereafter mean FST) as a measure of population genetic uniqueness (Table S4; Refs. [12,49]).
Population genetic structure. In order to determine the number of genetically homogeneous groups, a Bayesian genetic clustering algorithm implemented in the package ‘rmaverick’ [50] of the R statistical software v.3.6.1 (R Development Core Team 2015) was performed on each type of genetic marker. Log-likelihood plots were obtained using the thermodynamic integration procedure implemented in ‘rmaverick’ to determine the optimal genetic clusters K (ranking from 1 to 10). Ten iterations were performed for each value of K. Each iteration consisted of a “Burnin” period of 10,000 steps, followed by a Monte Carlo Markov Chain (MCMC) of 200,000 steps. Individuals were assigned to the selected K groups with the greatest individual membership probabilities (Q-value). A preliminary analysis using neutral SNPs, which included individuals from the four main hatchery strains, allowed us to confirm that only the Touyre river sampled was impacted from the captive-bred strains (Figure S2).

2.5. Statistical Analyses

We tested the relationships between genetic diversity (Ar), the upstream–downstream gradient (using the distance from the confluence, hereafter called ‘dist conf’), centrality and the type of genetic marker (neutral/functional) using linear models. Explicative variables were set as fixed effects and we included first-order interactions. Quadratic terms were added to test for nonlinear effects. The model was written as follows:
Ar ~ dist conf × markers + dist conf2 × markers + centrality × markers + centrality2 × markers
Then, we tested the effects of the upstream–downstream gradient, centrality and the type of genetic marker on genetic differentiation (FST) using the same explanatory variables as described before. The model was written as follows:
mean FST ~ dist conf × markers + dist conf2 × markers + centrality × markers + centrality2 × markers
All variables were centered to the mean. The relationship between the distance from the confluence and the centrality was not significant (Spearman’s rho = −0.30, p = 0.255). We used the corrected Akaike information criterion (AICc) to identify the best model. In our case, a set of top models had a comparable AICc (ΔAICc < 2) and/or no model had a weight > 0.95 (i.e., the probability that a given submodel is the best; [51]). We thus performed a model averaging method on this set of best submodels (ΔAICc < 2) using the zero method with the model.avg function implemented in the R package MuMIn V 1.47.1 [52]. This procedure involved calculating a weighted average of parameter estimates, so that parameter estimates that provide the least information about the variance in the response variable are given little weight. In that way, the parameter’s relative importance (that is, the sum of weights over all the best submodels in which the variable appears) reflects the ‘importance of the effect’ that an explanatory variable may have on the response variable [53]. Additionally, we performed a correlation analysis between genetic markers using the cor.test function implemented in the R package Stats V 3.6.3 [54] to examine whether populations with higher neutral genetic diversity/differentiation were also those with higher functional genetic diversity/differentiation. The relationship between population pairwise genetic (FST, computed as FST/1 − FST values according to [55]) and hydrological distances for each type of marker was evaluated using a simple Mantel test via the mantel.rtest function implemented in the R package Ade4 V 1.7.13 [56]. To control for the potential impact of hydrological barriers such as dams or weirs on the population structure, we performed a partial Mantel test based on Spearman’s rank correlation using the mantel.partial implemented in the R package vegan V 2.5-6 [57]. The partial Mantel test can be used to test whether two matrices (here the genetic distances and the hydrological distances matrix) are correlated when controlling for a third matrix (matrix of hydrological barriers) [58]. All tests were conducted using the R software (R Development Core Team 2010, V 3.6.3).

3. Results

3.1. Robustness and Descriptive Genetic Statistics

No deviation from Hardy–Weinberg equilibrium (HWE) was found at a p < 0.05 level, except for one SNP (X109230 locus) that showed HWE deviation for all the sixteen populations. This SNP was thus removed from subsequent analyses. Seven populations showed a significant deviation from the HWE in neutral SNP markers (Table 2). However, these deviations were not associated with any particular locus (but with several), so these loci were retained in our analysis. For candidate SNP markers, all populations were at the HWE. Regarding the MHC class IIβ gene (Satr-DAB), a significant deviation from the HWE was found in five populations (Table 2), suggesting an excess of homozygotes certainly due to, e.g., potential null alleles (Supporting Information S1)).

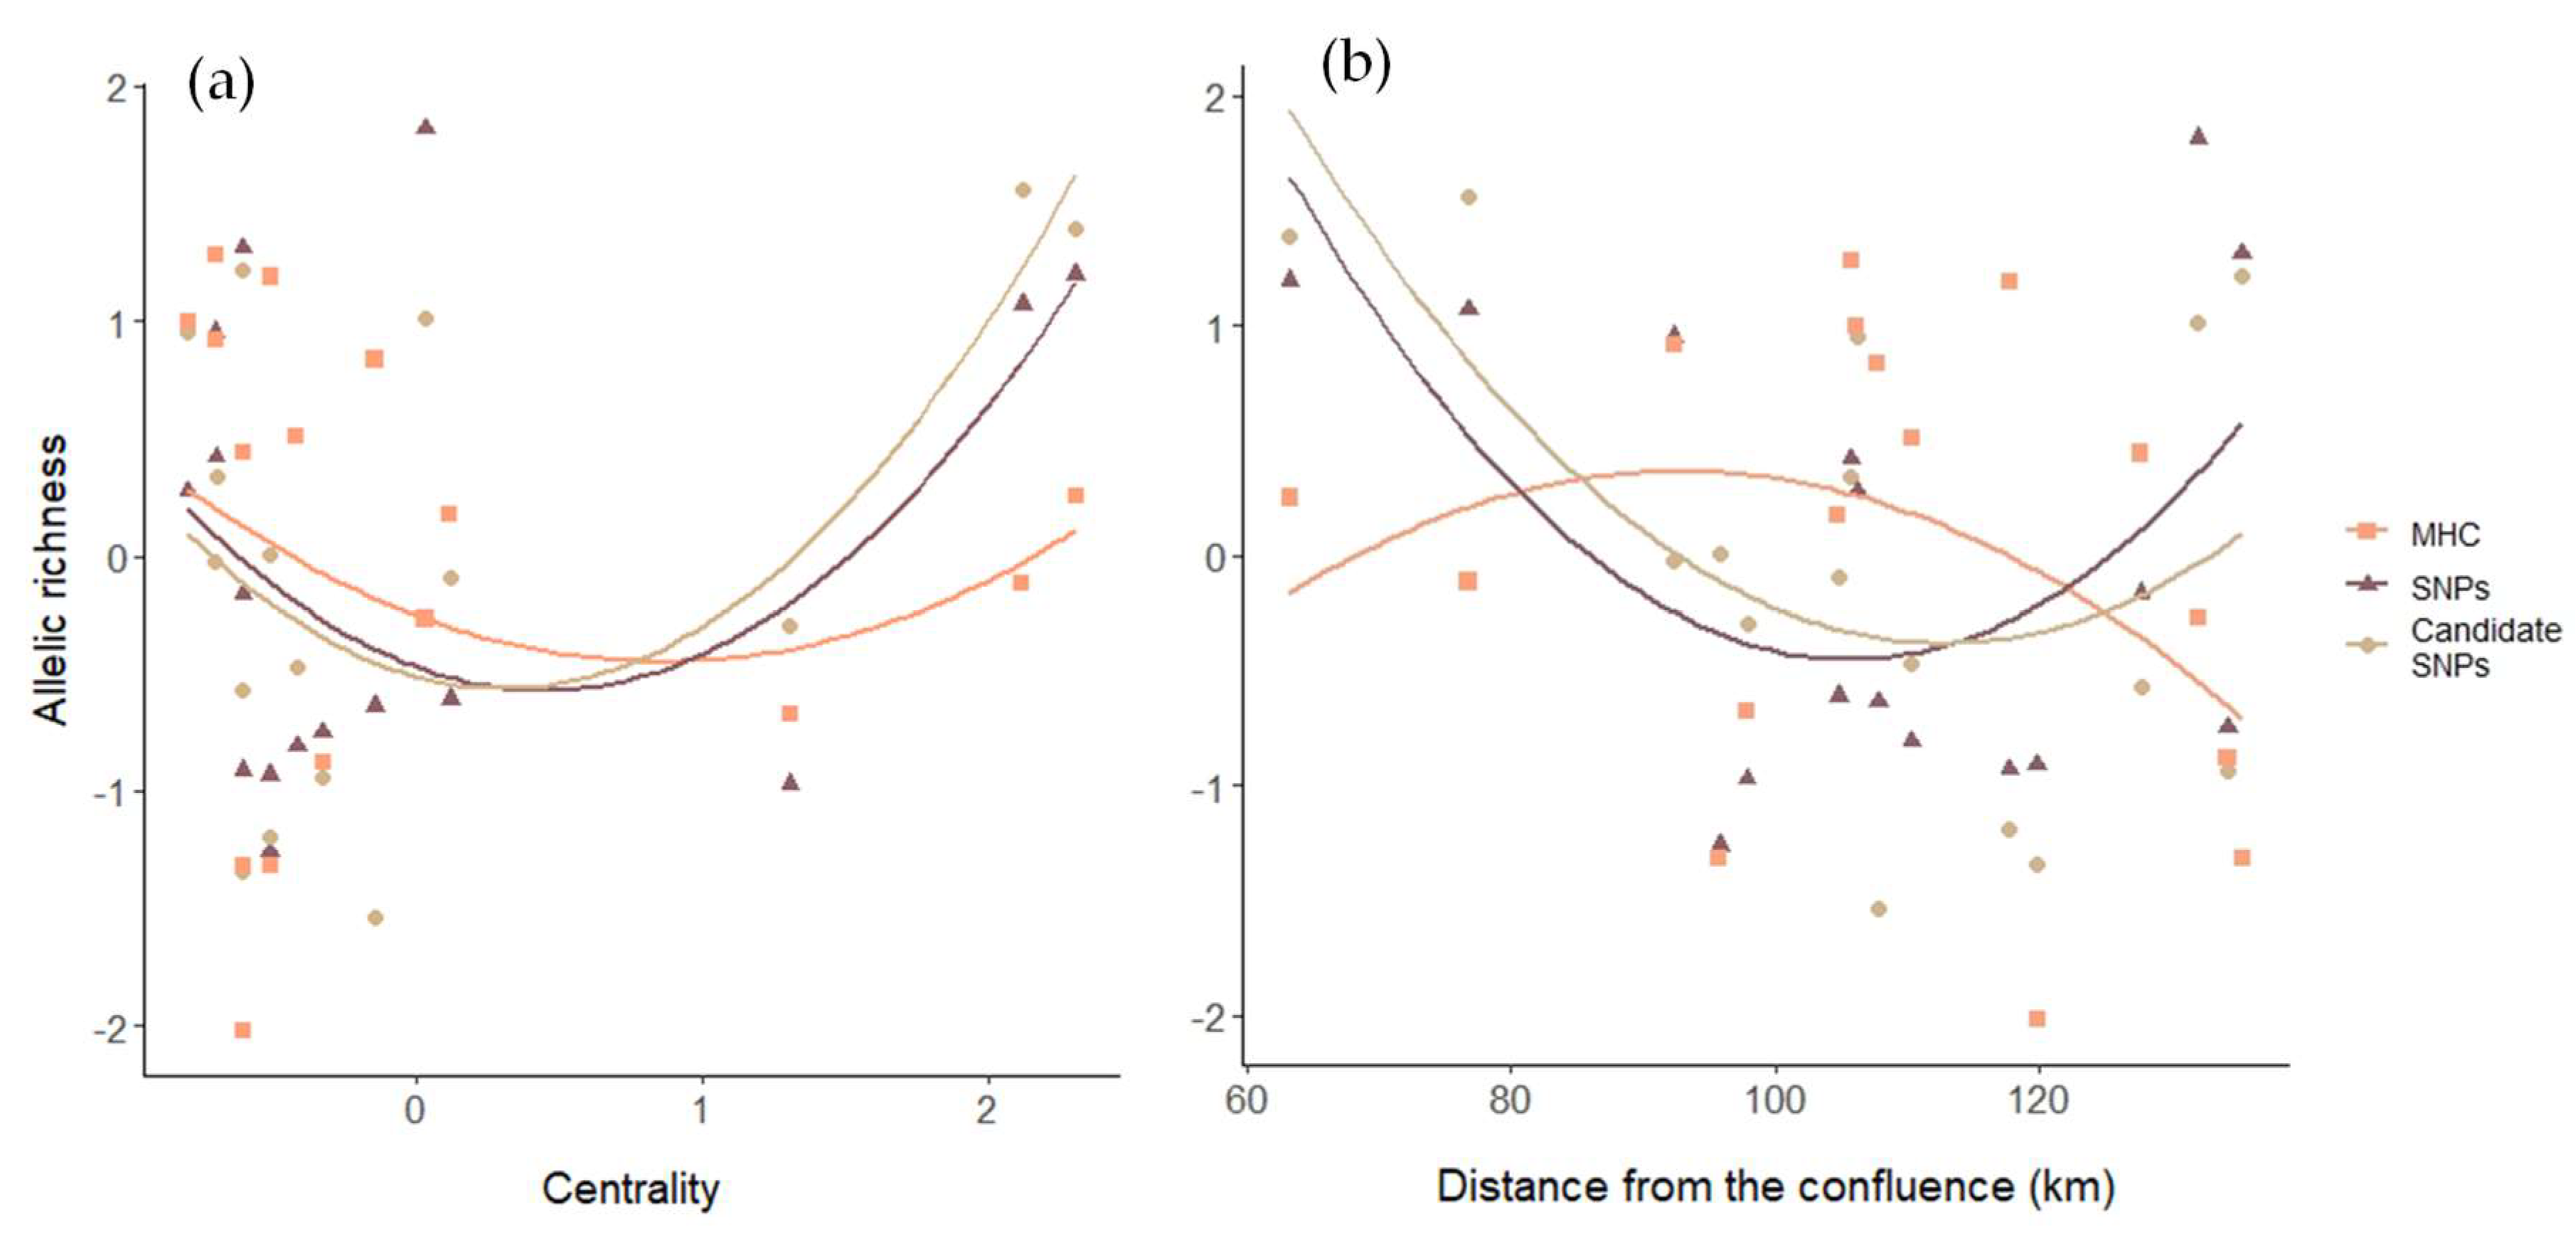
3.2. Genetic Diversity

The mean allelic richness (Ar) per population ranged between 1.45–1.67 and 1.45–1.63 at the SNPs and the candidate SNPs, respectively (Table 2). At the MHC class IIβ gene, the mean Ar per population ranged from 6.71 to 14.79, with a mean of 11.66 (Table 2).
The centrality, as well as the distance from the confluence, were both important predictors of genetic diversity in brown trout populations (Table 3 and Table 4), with higher genetic diversity in populations that were more central and/or closer to the confluence (Figure 2). The two predictors have similar relative importance invariations regarding genetic diversity (RI = 0.52, 0.48, respectively; Table 3 and Table 4). The type of marker was not retained in the best submodels, indicating that it does not explain the genetic diversity variation along the river network.
Regarding the He estimates, the distance from the confluence was the most important predictor of local diversity, with higher diversity in populations away from the confluence (Table S5, Figure S3).
Correlation analyses revealed that populations with higher neutral genetic diversity (SNPs marker) also had higher genetic diversity in the candidate SNP marker (r = 0.80), but not at the MHC marker (r = 0.15). There was no correlation between the two functional markers; populations with higher genetic diversity in the candidate SNP marker were not necessarily those with a higher genetic diversity in the MHC marker (r = 0.01).

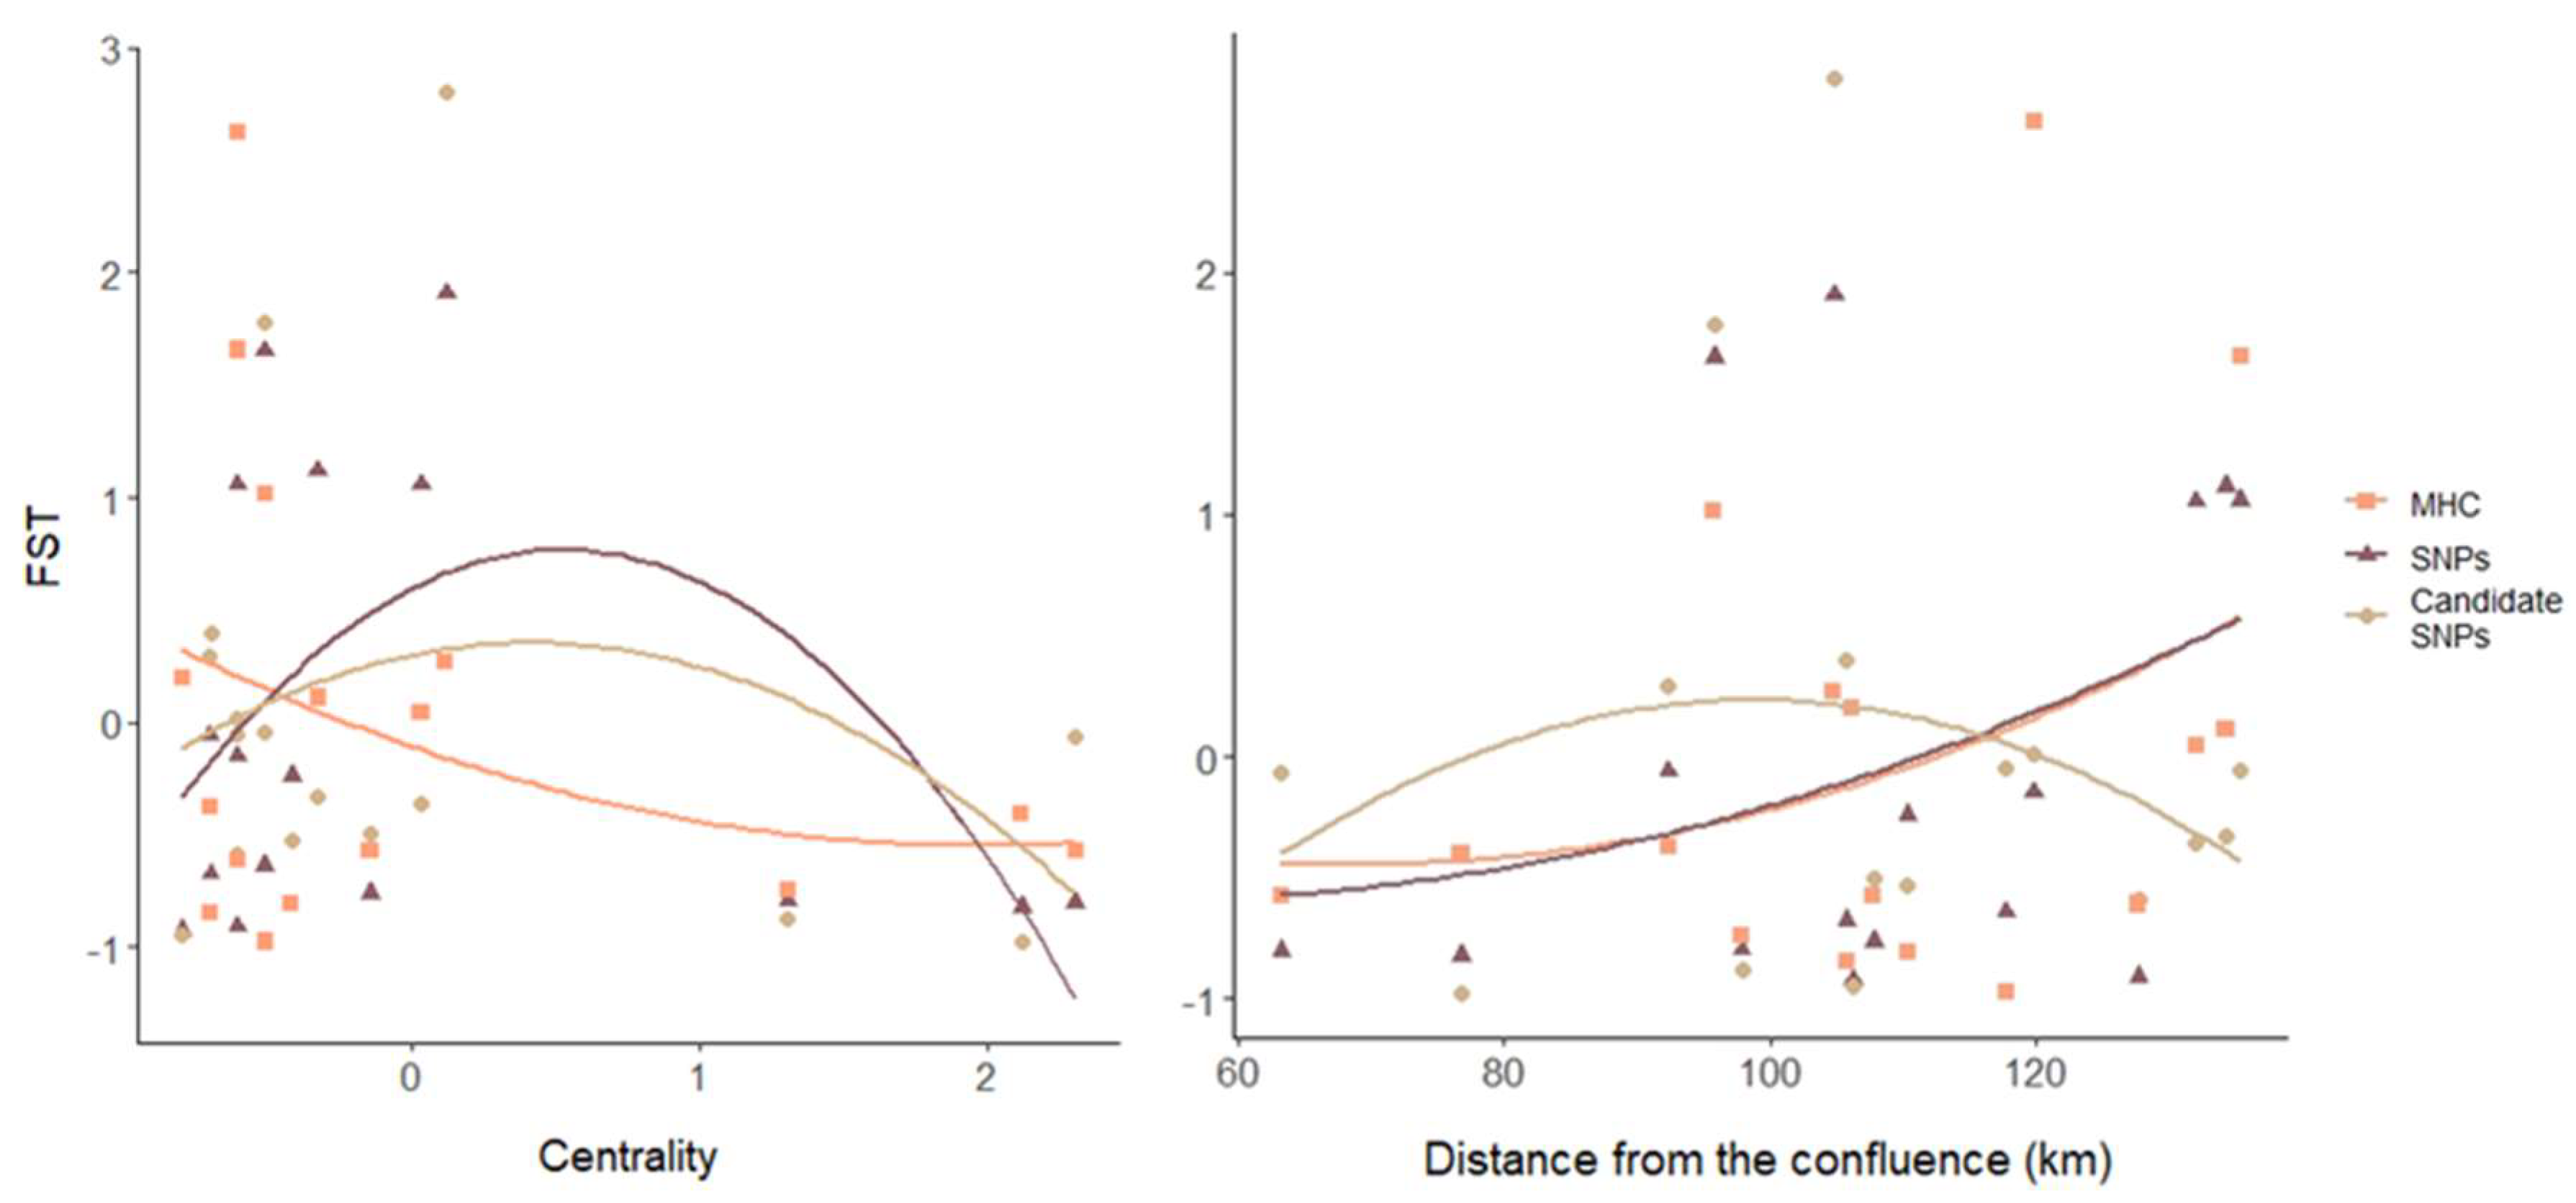
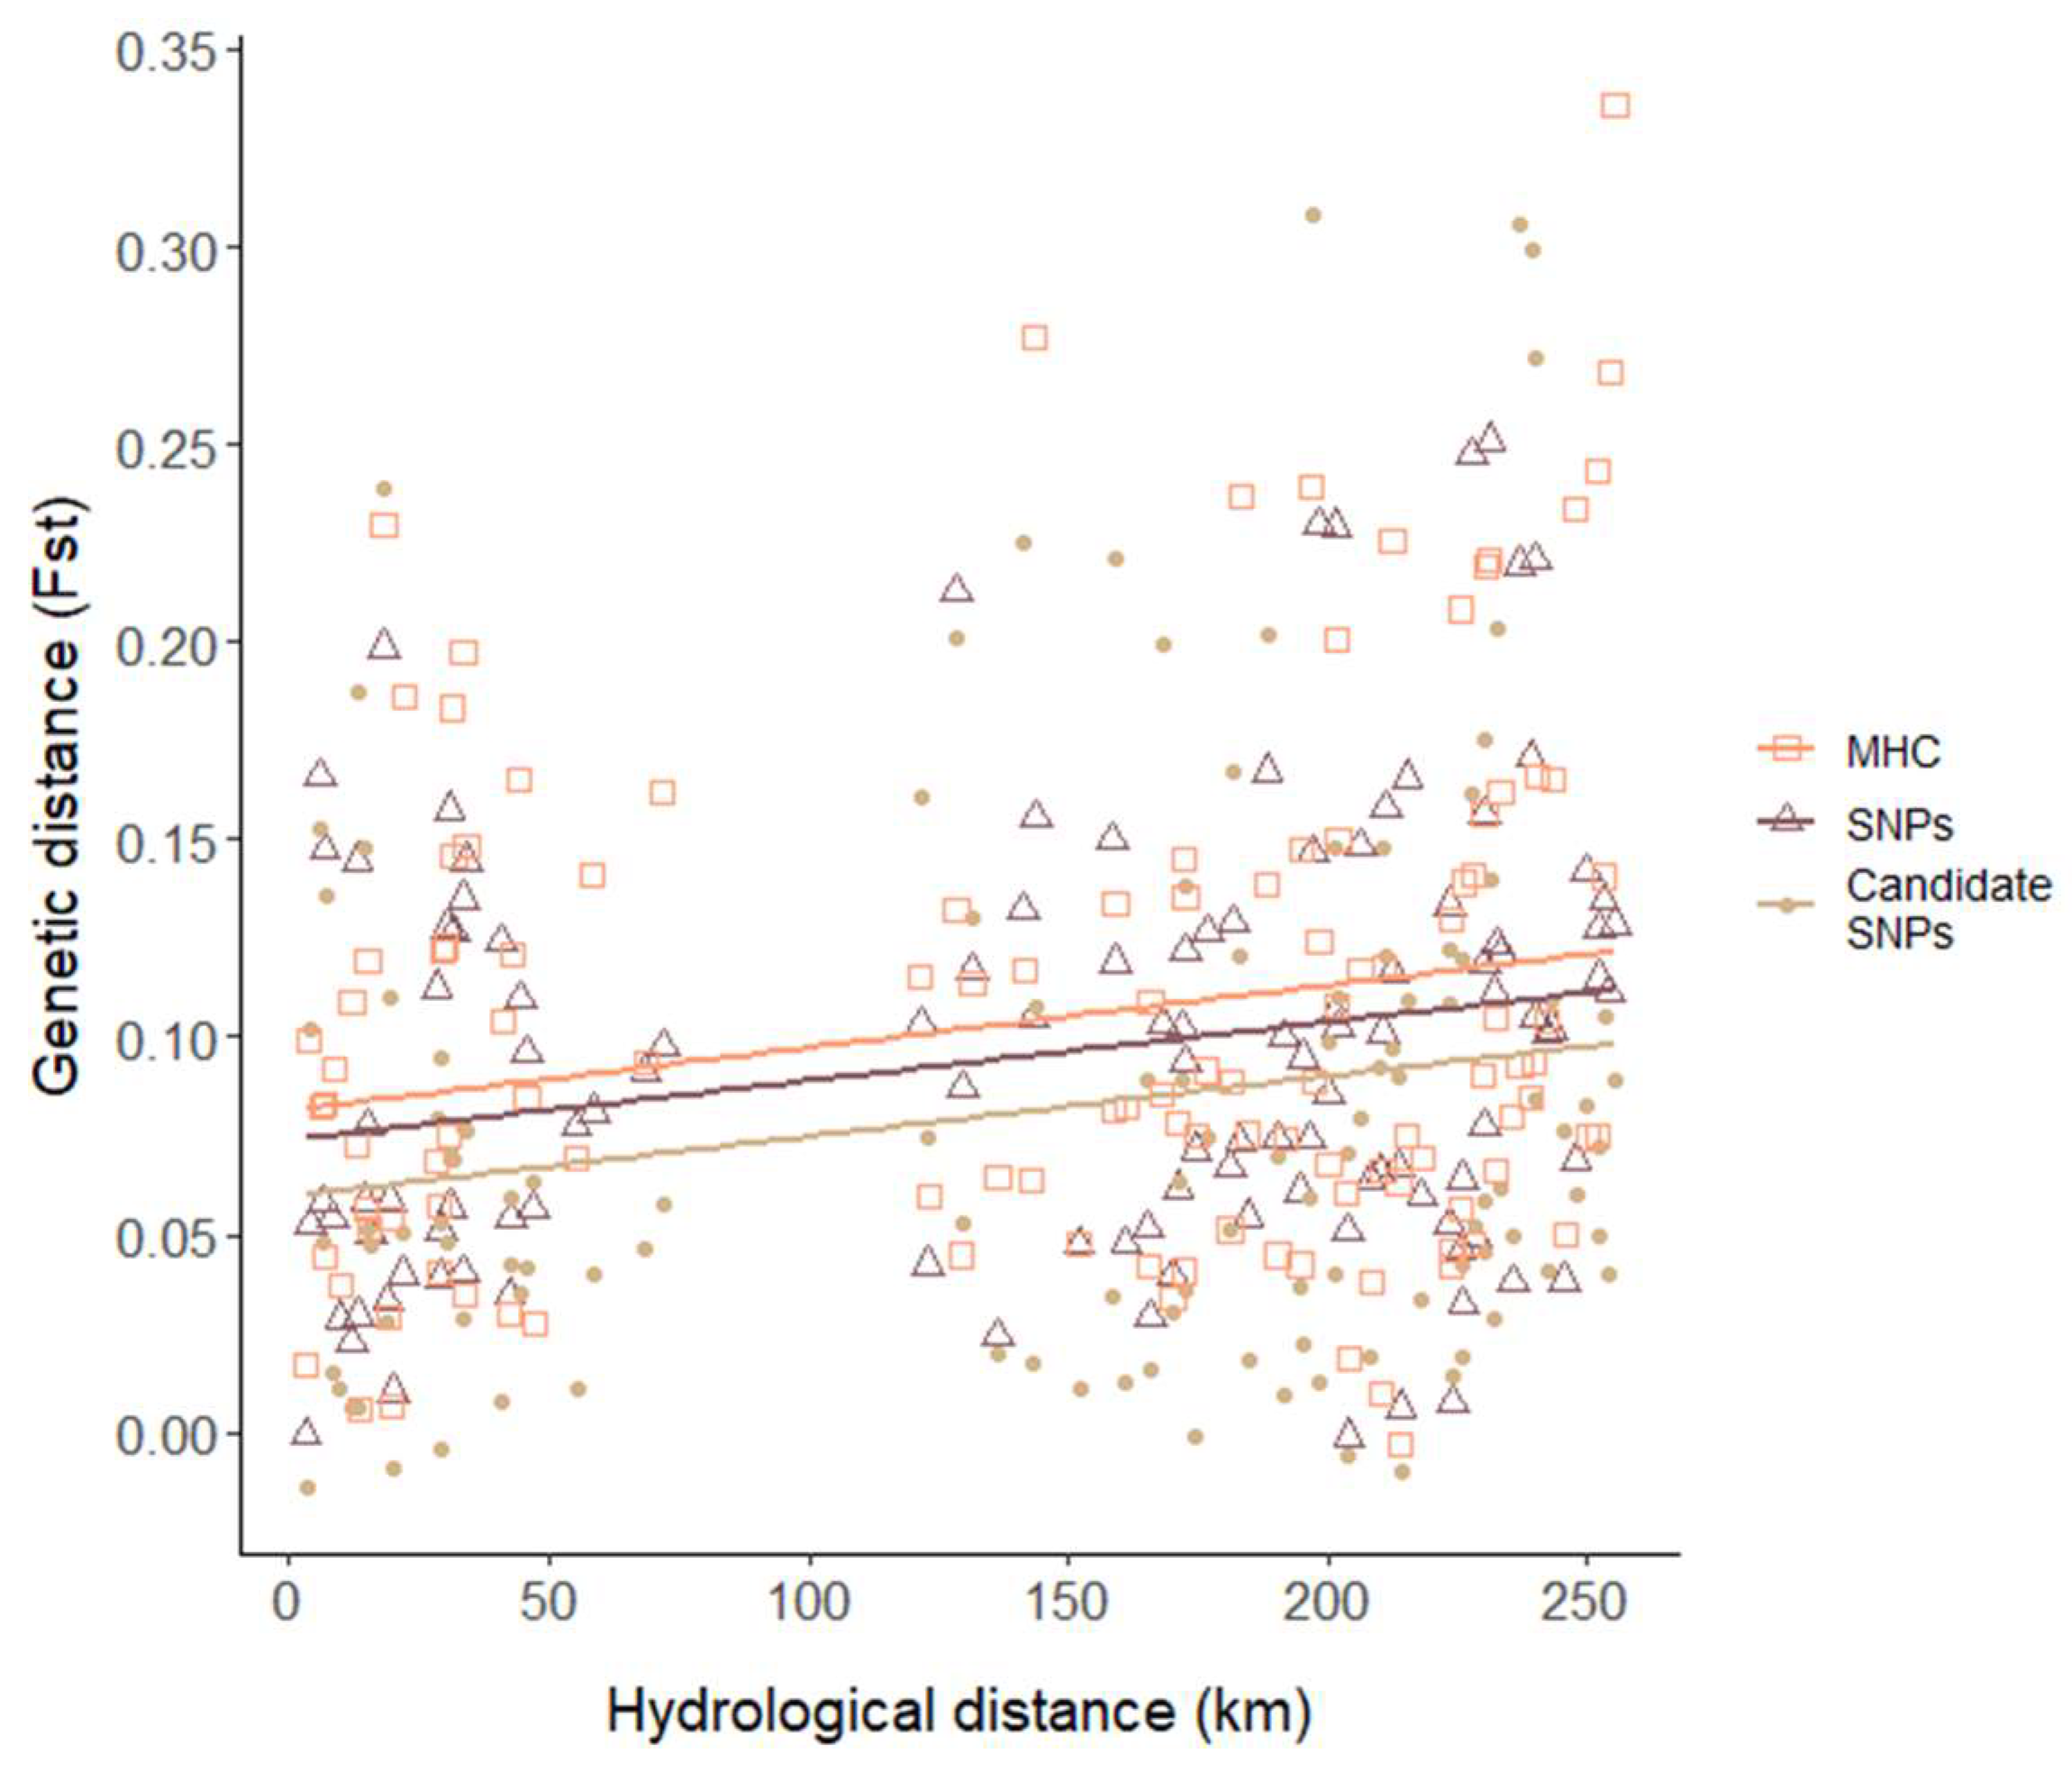
3.3. Genetic Differentiation

The mean FST per population ranged between 0.060 and 0.137 0.040 and 0.166 and 0.060 and 0.180 in the SNPs, the candidate SNPs and the MCH class IIβ gene, respectively (Table 2).
Centrality and the distance from the confluence both explained the variation in the genetic differentiation in brown trout populations (Table 3 and Table 4), with distinctly lower genetic differentiation among populations that were both most central and closest to the confluence (Figure 3). Centrality was retained in the two best submodels explaining variations in genetic differentiation (RI = 1, Table 3 and Table 4). The type of marker was not a significant predictor of genetic differentiation, indicating that it does not affect the variations in genetic differentiation.
Correlation analyses revealed that populations with higher genetic differentiation in the SNP marker also had higher genetic differentiation in the candidate SNPs marker (r = 0.71). However, this pattern was less evident in the MHC marker (r = 0.49). Moreover, there was no correlation between the two functional markers (i.e., candidate SNPs and MHC marker; r = 0.27).
The simple Mantel test suggested a significant positive relationship between genetic and hydrological distances, whatever the type of marker (r = 0.24, p = 0.016; r = 0.19, p = 0.045; r = 0.21, p = 0.030, in the SNPs, candidate SNPs and MHC marker, respectively, Figure 4). A partial Mantel test revealed that the number of dams and/or weirs did not impact the variance in the genetic differentiation in the SNPs, candidate SNPs and MHC marker (r = 0.13, p = 0.119; r = 0.15, p = 0.098; r = 0.15, p = 0.144, respectively).

3.4. Population Genetic Structure

The Bayesian clustering method applied on the neutral SNP genetic marker of all individuals revealed an optimal number of groups, K = 4, corresponding to four geographical groups: Garonne bassin, Ariège bassin, upstream of the Ariège river and the Touyre river, which were impacted by hatchery strains (Figure 1 and Figure 5A). Regarding the functional SNP genetic marker, the Bayesian clustering method revealed an optimal number of groups, K = 2, with significant admixture observed within each population, except for the Arize river and the Touyre river (Figure 5B). Finally, the Bayesian clustering method revealed an optimal number of groups, K = 2, for the functional MHC genetic marker, highlighting two geographical groups: the Garonne basin and the Ariège basin (Figure 1 and Figure 5C).

4. Discussion

This study aimed to investigate how environmental gradients, such as the upstream–downstream gradient and centrality in the river network, could shape the spatial patterns of intraspecific genetic diversity and differentiation at neutral compared to functional genetic markers, with the main assumption that functional markers do not necessarily have the similar spatial patterns as neutral markers, as follows. First, our results revealed that both the distance from the confluence and/or the centrality of the population in the river network could explain the pattern of variation in genetic diversity and differentiation at the metapopulation level. Second, contrary to our expectations, neutral and functional genetic markers did not display significantly different spatial patterns along the riverscape. Overall, genetic diversity was higher and genetic differentiation was lower in populations that were more central and/or near to the confluence, regardless of the type of marker (neutral or functional). Taken together, these results highlight the importance of considering the network structure of watersheds to better understand the spatial patterns of intraspecific variation.

4.1. Environmental Gradients Shape Spatial Patterns of Genetic Diversity and Differentiation

Paz-Vinas et al. [12] conducted a meta-analysis and found that the neutral genetic diversity of organisms that disperse only in rivers, such as fish or crustaceans, generally increases downstream, much more than those that also use the air (e.g., flying invertebrates) or terrestrial environments (e.g., amphibians). For instance, some fish species exhibit a very strong negative linear relationship between genetic diversity and distance from the river mouth (Xyphophorus helleri, [59] or Xyrauchen texanus, [60]). Our results corroborate this assumption, as the factors shaping genetic diversity were the populations’ centrality on the river network and/or distance from the confluence, with populations that were more central and/or closer to the confluence displaying a higher genetic diversity. We noticed that populations considered as “central” were actually those located downstream and closest to the confluence Garonne-Ariège, relative to all other populations (in the case for ARIPam, ARIVar and SALTau, Table 1, Figure 1). These observations are consistent with the literature, in which populations located close to a confluence displayed a higher genetic diversity, because these populations were at the crossroad between several genetically diversified populations [13,35]. Furthermore, it is possible that these populations displayed a higher effective size due to the increasing river width, thus reducing the potential effects of genetic drift [61].
Empirically and theoretically-based studies have shown an increase in genetic differentiation among upstream populations due to genetic drift and geographic isolation in the dendritic riverscape [13,19]. Our results corroborate this statement, as we found a relationship between the genetic differentiation (FST) and the environmental gradients. Specifically, populations that were least central and located farther away from the confluence exhibited higher levels of genetic differentiation. This result is consistent with the significant positive relationship observed in the Mantel test correlation analysis, which indicates that genetic differentiation tends to increase as the distance between two populations increases in brown trout populations. The genetic structure analysis further supports these findings, revealing distinct genetic patterns and a distinct population structure within the brown trout populations. Specifically, the Garonne basin and the Ariège basin exhibited different genetic profiles based on the analyzed genetic markers. These findings reflect the influence of river connectivity to gene flow, underlying the need to consider the dendritic shape of a river network when studying genetic diversity and differentiation patterns [13].
In summary, our findings have highlighted the significant influence of environmental gradients within river networks, such as centrality, the distance from the confluence, and the overall profile of the river network, including sub-basins, on the genetic diversity and differentiation observed in brown trout populations. These results underscore the importance of considering both spatial and hydrological factors in studies of genetic diversity and differentiation within riverine ecosystems. Moreover, these findings bring important implications for the genetic conservation and management of brown trout populations.

4.2. Different Genetic Markers Can Exhibit a Similar Pattern

Our study provides valuable insights into the genetic diversity and differentiation, as well as the population structure, of brown trout populations in the studied river network. Interestingly, the type of marker did not significantly explain the variation in genetic diversity and differentiation along the river network; the spatial distribution of alleles is the same whether the markers are neutral (SNPs) or presumably functional (candidate SNPs and MHC class IIβ gene), suggesting that the observed patterns were not marker-dependent.
Correlation analyses revealed interesting relationships between different markers. Populations with higher neutral genetic diversity and differentiation in the SNP genetic marker also displayed higher genetic diversity and differentiation in the candidate SNP genetic marker. One potential explanation is that the candidate SNPs used in this study may not be under selection for these Pyrenean fish populations. Indeed, we chose these candidate SNPs based on their potential role in immunity and resistance to a parasite in brown trout based on previous studies, but these SNPs were developed in populations from a different geographic area (Estonia, [37]). Because pathogen pressures vary between regions and/or may act on different genes or SNPs, candidate SNP variation may have been predominantly shaped by neutral evolutionary processes (e.g., drift and migration). Furthermore, it could be assumed that upstream areas may harbor a higher quality habitat for brown trout (e.g., a cooler water temperature), which would result in reduced selective pressures and make drift and isolation the main evolutionary drivers for these upstream populations, even at functional markers. Overall, we found an increase in genetic diversity in populations that are more central and/or closest to the confluence, and in contrast, an increase in genetic differentiation among populations that are least central and farther away from the confluence in these two types of SNP markers (neutral and “functional”).
Regarding the MHC genetic marker, we found the same pattern as the two SNP markers, that is, a higher genetic diversity in the most central populations and/or nearest to the confluence and a higher genetic differentiation among the least central populations and those furthest from the confluence. However, when we looked more closely, the correlation between the MHC marker and neutral SNP markers at the population scale was less pronounced, suggesting potential differences in the underlying evolutionary processes shaping genetic diversity in the MHC region. Furthermore, no correlation was found between the two functional markers (candidate SNPs and MHC marker), suggesting distinct genetic dynamics and selective pressures acting on these markers. As we mentioned above, it is possible that candidate SNP markers are not under selective pressure, unlike the MHC marker. Furthermore, it could be assumed that environmental pressures acting on MHC, such as pathogen diversity, might exert stronger effects on highly connected populations, particularly those located in the middle within the river network and near confluences. These populations could potentially act as hotspots for a community of diversified pathogens coming from various waterways [62]. Future MHC-based studies should therefore monitor pathogen diversity more precisely in highly connected areas while taking into account the connectivity between populations to further decipher the underlying mechanisms shaping variations in MHC genetic diversity and differentiation in river networks.
The population genetic structure analysis revealed distinct geographical groups within the brown trout populations. The Bayesian clustering method identified four groups based on the neutral SNPs marker, corresponding to the Garonne basin, Ariège basin, upstream of the Ariège river, and the Touyre river. This suggests that these populations exhibit clear genetic differentiation based on their geographic location. In contrast, the analysis of the functional SNP marker revealed two optimal groups, with notable admixture within each population, except for the Arize river and the Touyre river. Furthermore, the analysis of the functional MHC genetic marker highlighted two geographical groups, representing the Garonne basin and the Ariège basin. This result suggests that the genetic variation observed in the MHC genes is associated with specific geographic regions, potentially indicating differences in pathogen diversity or selective pressures. The observed differences in the population structure between the neutral and functional markers highlight the potential influence of different evolutionary processes on the genetic variation in brown trout populations. The patterns of population structure and local diversity observed for neutral SNPs reflected genetic drift and limited gene flow among populations. On the other hand, the functional genetic markers, such as the MHC genes, may be under strong selective pressures related to pathogens i. However, we point out that the Bayesian clustering methods could overestimate the genetic structure and detect artificial genetic clusters when isolation due to distance is only tested using Mantel tests and the sampling design is not evenly distributed along the river network [63,64].
Overall, our findings demonstrate the importance of considering both neutral and functional genetic markers in genetic studies to gain a comprehensive understanding of the population structure and genetic variation in wild species. The similar patterns observed in different markers driven by both neutral and adaptive evolutionary processes contribute to shaping the genetic diversity and differentiation of brown trout populations in this study area. Further research is warranted to explore the specific environmental factors or selective pressures that contribute to the observed genetic patterns. Additionally, investigating the functional significance of the identified genetic variations and their implications for the ecological and evolutionary dynamics of brown trout populations would provide valuable insights for conservation and management strategies.

5. Conclusions

Our study provides novel insights into the spatial patterns of intraspecific genetic diversity and differentiation in both neutral and functional genetic markers along environmental gradients in wild aquatic populations. We showed that centrality, the population’s distance from the confluence and the structure of the river network caused by the dendritic connectivity strongly influenced the genetic diversity and the differentiation among populations in both neutral and functional genetic markers. We also highlighted that these different markers followed the same spatial patterns despite the fact that they are shapedby different drift and isolation, with evolutionary forces shaping neutral genetic markers and the adaptative response to environmental pressures shaping functional genetic markers. This study highlights the importance of considering the spatial and hydrological factors of a river network to gain insights into the patterns of genetic diversity and differentiation in wild populations, which could help biodiversity managers to improve conservation strategies.

Supplementary Materials

The following supporting information can be downloaded at: https://0-www-mdpi-com.brum.beds.ac.uk/article/10.3390/d15060784/s1, Table S1. List of the 143 supposedly neutral SNP markers from the brown trout genome; Table S2. List of the 19 ‘candidate’ SNP markers related to the physiological functions of and/or tolerance or resistance to pathogens in brown trout; Table S3. Individual genotype at the MHC class IIβ gene (Satr-DAB); Figure S1. Map showing points added to measure centrality; Supporting Information S1. Null alleles and scoring errors; Table S4. Mean pairwise FST values (calculated using GENEPOP V.4.7.5) between sites measured at SNPs, candidate SNPs and MHC class IIβ markers, hydrological distance (km) between sites and number of dams and/or weirs >3m between sites; Figure S2. Introgressive hybridization; Table S5. Local diversity estimates based on expected heterozygosity (He); Figure S3: Local diversity (He) is higher in populations farther away from the confluence.

Author Contributions

S.B., E.Q. and L.J. designed the study; E.D., S.B., E.Q. and L.J. performed the fish sampling; L.G. calculated spatial data; M.G. genotyped MHC genes; G.L., E.D. and C.V. performed all genetic extractions; L.G. performed genetical and statistical analysis with inputs from S.B., E.Q. and L.J.; L.G., S.B., E.Q. and L.J. participated in the interpretation of results; L.G. wrote the manuscript under the guidance of S.B., E.Q. and L.J. All authors participated in the writing and revisions of the manuscript. All authors have read and agreed to the published version of the manuscript.

Funding

This study was funded by grants from the Agence de l’Eau Adour-Garonne (AX project), the OFB (PKD project), and a JCJC ANR (MULTIPAT). LJ is a junior member of the Institut Universitaire de France (IUF). The EDB laboratory is part of the TULIP Labex.

Institutional Review Board Statement

The authors declare that the collection and sacrifice of all fish included in this study were performed in accordance to local guidelines and regulations, i.e., authorized by Direction Départementale des Territoires (DDT) de l’Ariège, with inputs from either the Fédération de Pêche de l’Ariège or the Association Agréée de Pêche et de Protection des Milieux Aquatiques (AAPPMA), and the service départemental de l’Office Français de la Biodiversité (OFB).

Data Availability Statement

SNPs and MHC sequences and information are available on the file “List_markers.xlsx” in Supplementary Materials.

Acknowledgments

The authors wish to thank Laurent Garmendia, Allan Yotte, the Fédération de Pêche de l’Ariège and Armand Lautraite for their help. Some of the data used in this work were produced through the GenSeq technical facilities of the Institut des Sciences de l’Evolution de Montpellier with the support of LabEx CeMEB, an ANR “Investissements d’avenir” program (ANR-10-LABX-04-01).

Conflicts of Interest

The authors declare no conflict of interest.

References

  1. Legendre, P.; Fortin, M.J. Spatial Pattern and Ecological Analysis. Vegetatio 1989, 80, 107–138. [Google Scholar] [CrossRef]
  2. Ortego, J.; Riordan, E.C.; Gugger, P.F.; Sork, V.L. Influence of Environmental Heterogeneity on Genetic Diversity and Structure in an Endemic Southern Californian Oak. Mol. Ecol. 2012, 21, 3210–3223. [Google Scholar] [CrossRef]
  3. Chave, J. The Problem of Pattern and Scale in Ecology: What Have We Learned in 20 Years? Ecol. Lett. 2013, 16, 4–16. [Google Scholar] [CrossRef]
  4. Wright, S. Isolation by Distance. Genetics 1943, 28, 114–138. [Google Scholar] [CrossRef]
  5. Hillebrand, H. On the Generality of the Latitudinal Diversity Gradient. Am. Nat. 2004, 163, 192–211. [Google Scholar] [CrossRef] [Green Version]
  6. Watanabe, K.; Monaghan, M.T.; Omura, T. Longitudinal Patterns of Genetic Diversity and Larval Density of the Riverine Caddisfly Hydropsyche orientalis (Trichoptera). Aquat. Sci. 2008, 70, 377–387. [Google Scholar] [CrossRef]
  7. Lawrence, E.R.; Fraser, D.J. Latitudinal Biodiversity Gradients at Three Levels: Linking Species Richness, Population Richness and Genetic Diversity. Glob. Ecol. Biogeogr. 2020, 29, 770–788. [Google Scholar] [CrossRef] [Green Version]
  8. Blanchet, S.; Prunier, J.G.; Paz-Vinas, I.; Saint-Pé, K.; Rey, O.; Raffard, A.; Mathieu-Bégné, E.; Loot, G.; Fourtune, L.; Dubut, V. A River Runs through It: The Causes, Consequences, and Management of Intraspecific Diversity in River Networks. Evol. Appl. 2020, 13, 1195–1213. [Google Scholar] [CrossRef] [Green Version]
  9. Fagan, W.F. Connectivity, Fragmentation, and Extinction Risk in Dendritic Metapopulations. Ecology 2002, 83, 3243–3249. [Google Scholar] [CrossRef]
  10. Campbell Grant, E.H.; Lowe, W.H.; Fagan, W.F. Living in the Branches: Population Dynamics and Ecological Processes in Dendritic Networks. Ecol. Lett. 2007, 10, 165–175. [Google Scholar] [CrossRef]
  11. Morrissey, M.B.; de Kerckhove, D.T. The Maintenance of Genetic Variation Due to Asymmetric Gene Flow in Dendritic Metapopulations. Am. Nat. 2009, 174, 875–889. [Google Scholar] [CrossRef]
  12. Paz-Vinas, I.; Loot, G.; Stevens, V.M.; Blanchet, S. Evolutionary Processes Driving Spatial Patterns of Intraspecific Genetic Diversity in River Ecosystems. Mol. Ecol. 2015, 24, 4586–4604. [Google Scholar] [CrossRef] [Green Version]
  13. Paz-Vinas, I.; Blanchet, S. Dendritic Connectivity Shapes Spatial Patterns of Genetic Diversity: A Simulation-Based Study. J. Evol. Biol. 2015, 28, 986–994. [Google Scholar] [CrossRef]
  14. Cyr, F.; Angers, B. Historical Process Lead to False Genetic Signal of Current Connectivity among Populations. Genetica 2011, 139, 1417–1428. [Google Scholar] [CrossRef]
  15. Chaput-Bardy, A.; Fleurant, C.; Lemaire, C.; Secondi, J. Modelling the Effect of In-Stream and Overland Dispersal on Gene Flow in River Networks. Ecol. Model. 2009, 220, 3589–3598. [Google Scholar] [CrossRef] [Green Version]
  16. Alp, M.; Keller, I.; Westram, A.M.; Robinson, C.T. How River Structure and Biological Traits Influence Gene Flow: A Population Genetic Study of Two Stream Invertebrates with Differing Dispersal Abilities. Freshw. Biol. 2012, 57, 969–981. [Google Scholar] [CrossRef]
  17. Prunier, J.G.; Dubut, V.; Loot, G.; Tudesque, L.; Blanchet, S. The Relative Contribution of River Network Structure and Anthropogenic Stressors to Spatial Patterns of Genetic Diversity in Two Freshwater Fishes: A Multiple-Stressors Approach. Freshw. Biol. 2018, 63, 6–21. [Google Scholar] [CrossRef]
  18. Castric, V.; Bonney, F.; Bernatchez, L. Landscape Structure and Hierarchical Genetic Diversity in the Brook Charr, Salvelinus Fontinalis. Evolution 2001, 55, 1016–1028. [Google Scholar] [CrossRef]
  19. Finn, D.S.; Bonada, N.; Múrria, C.; Hughes, J.M. Small but Mighty: Headwaters Are Vital to Stream Network Biodiversity at Two Levels of Organization. J. N. Am. Benthol. Soc. 2011, 30, 963–980. [Google Scholar] [CrossRef] [Green Version]
  20. Prunier, J.G.; Dubut, V.; Chikhi, L.; Blanchet, S. Contribution of Spatial Heterogeneity in Effective Population Sizes to the Variance in Pairwise Measures of Genetic Differentiation. Methods Ecol. Evol. 2017, 8, 1866–1877. [Google Scholar] [CrossRef] [Green Version]
  21. Blanchet, S.; Rey, O.; Etienne, R.; Lek, S.; Loot, G. Species-Specific Responses to Landscape Fragmentation: Implications for Management Strategies. Evol. Appl. 2010, 3, 291–304. [Google Scholar] [CrossRef]
  22. Allen, A.P.; Gillooly, J.F.; Savage, V.M.; Brown, J.H. Kinetic Effects of Temperature on Rates of Genetic Divergence and Speciation. Proc. Natl. Acad. Sci. USA 2006, 103, 9130–9135. [Google Scholar] [CrossRef] [Green Version]
  23. Willis, G.H.; McDowell, L.L. Pesticides in Agricultural Runoff and Their Effects on Downstream Water Quality. Environ. Toxicol. Chem. 1982, 1, 267–279. [Google Scholar] [CrossRef]
  24. Dionne, M.; Miller, K.M.; Dodson, J.J.; Caron, F.; Bernatchez, L. Clinal Variation In MHC Diversity With Temperature: Evidence For The Role Of Host? Pathogen Interaction On Local Adaptation In Atlantic Salmon. Evolution 2007, 61, 2154–2164. [Google Scholar] [CrossRef]
  25. Hari, R.E.; Livingstone, D.M.; Siber, R.; Burkhardt-Holm, P.; Güttinger, H. Consequences of Climatic Change for Water Temperature and Brown Trout Populations in Alpine Rivers and Streams. Glob. Chang. Biol. 2006, 12, 10–26. [Google Scholar] [CrossRef]
  26. Elliott, J.M.; Elliott, J.A. Temperature Requirements of Atlantic Salmon Salmo Salar, Brown Trout Salmo trutta and Arctic Charr Salvelinus Alpinus: Predicting the Effects of Climate Change. J. Fish Biol. 2010, 77, 1793–1817. [Google Scholar] [CrossRef]
  27. Ojanguren, A.F.; Reyes-Gavilán, F.G.; Braña, F. Thermal Sensitivity of Growth, Food Intake and Activity of Juvenile Brown Trout. J. Therm. Biol. 2001, 26, 165–170. [Google Scholar] [CrossRef]
  28. Réalis-Doyelle, E.; Pasquet, A.; Charleroy, D.D.; Fontaine, P.; Teletchea, F. Strong Effects of Temperature on the Early Life Stages of a Cold Stenothermal Fish Species, Brown Trout (Salmo trutta L.). PLoS ONE 2016, 11, e0155487. [Google Scholar] [CrossRef] [Green Version]
  29. Borgwardt, F.; Unfer, G.; Auer, S.; Waldner, K.; El-Matbouli, M.; Bechter, T. Direct and Indirect Climate Change Impacts on Brown Trout in Central Europe: How Thermal Regimes Reinforce Physiological Stress and Support the Emergence of Diseases. Front. Environ. Sci. 2020, 8, 59. [Google Scholar] [CrossRef]
  30. Delghandi, M.R.; Menanteau-Ledouble, S.; Waldner, K.; El-Matbouli, M. Renibacterium salmoninarum and Mycobacterium spp.: Two Bacterial Pathogens Present at Low Levels in Wild Brown Trout (Salmo trutta fario) Populations in Austrian Rivers. BMC Vet. Res. 2020, 16, 40. [Google Scholar] [CrossRef] [Green Version]
  31. Sudhagar, A.; Kumar, G.; El-Matbouli, M. The Malacosporean Myxozoan Parasite Tetracapsuloides bryosalmonae: A Threat to Wild Salmonids. Pathogens 2020, 9, 16. [Google Scholar] [CrossRef] [Green Version]
  32. Hedrick, R.P.; MacConnell, E.; de Kinkelin, P. Proliferative Kidney Disease of Salmonid Fish. Annu. Rev. Fish Dis. 1993, 3, 277–290. [Google Scholar] [CrossRef]
  33. Bailey, C.; Segner, H.; Casanova-Nakayama, A.; Wahli, T. Who Needs the Hotspot? The Effect of Temperature on the Fish Host Immune Response to Tetracapsuloides bryosalmonae the Causative Agent of Proliferative Kidney Disease. Fish Shellfish Immunol. 2017, 63, 424–437. [Google Scholar] [CrossRef] [Green Version]
  34. Duval, E.; Quéméré, E.; Loot, G.; Jacquin, L.; Veyssière, C.; Blanchet, S. A Multifaceted Index of Population Health to Detect Risk-Prone Populations and Underlying Stressors in Wildlife. Biol. Conserv. 2022, 274, 109706. [Google Scholar] [CrossRef]
  35. Altermatt, F. Diversity in Riverine Metacommunities: A Network Perspective. Aquat Ecol 2013, 47, 365–377. [Google Scholar] [CrossRef] [Green Version]
  36. Saint-Pé, K.; Leitwein, M.; Tissot, L.; Poulet, N.; Guinand, B.; Berrebi, P.; Marselli, G.; Lascaux, J.-M.; Gagnaire, P.-A.; Blanchet, S. Development of a Large SNPs Resource and a Low-Density SNP Array for Brown Trout (Salmo trutta) Population Genetics. BMC Genom. 2019, 20, 582. [Google Scholar] [CrossRef] [Green Version]
  37. Ahmad, F.; Debes, P.V.; Palomar, G.; Vasemägi, A. Association Mapping Reveals Candidate Loci for Resistance and Anaemic Response to an Emerging Temperature-Driven Parasitic Disease in a Wild Salmonid Fish. Mol. Ecol. 2018, 27, 1385–1401. [Google Scholar] [CrossRef]
  38. Piertney, S.B.; Oliver, M.K. The Evolutionary Ecology of the Major Histocompatibility Complex. Heredity 2006, 96, 7–21. [Google Scholar] [CrossRef] [Green Version]
  39. Klein, J. Natural History of the Major Histocompatibility Complex; Wiley: Hoboken, NJ, USA, 1986; ISBN 978-0-471-80953-1. [Google Scholar]
  40. Portanier, E.; Garel, M.; Devillard, S.; Maillard, D.; Poissant, J.; Galan, M.; Benabed, S.; Poirel, M.-T.; Duhayer, J.; Itty, C.; et al. Both Candidate Gene and Neutral Genetic Diversity Correlate with Parasite Resistance in Female Mediterranean Mouflon. BMC Ecol. 2019, 19, 12. [Google Scholar] [CrossRef] [Green Version]
  41. Langefors, Å.; Lohm, J.; Von Schantz, T.; Grahn, M. Screening of Mhc Variation in Atlantic Salmon (Salmo salar): A Comparison of Restriction Fragment Length Polymorphism (RFLP), Denaturing Gradient Gel Electrophoresis (DGGE) and Sequencing. Mol. Ecol. 2000, 9, 215–219. [Google Scholar] [CrossRef]
  42. Olsén, K.H.; Grahn, M.; Lohm, J.; Langefors, Å. MHC and Kin Discrimination in Juvenile Arctic Charr, Salvelinus alpinus (L.). Anim. Behav. 1998, 56, 319–327. [Google Scholar] [CrossRef] [Green Version]
  43. Escudié, F.; Auer, L.; Bernard, M.; Mariadassou, M.; Cauquil, L.; Vidal, K.; Maman, S.; Hernandez-Raquet, G.; Combes, S.; Pascal, G. FROGS: Find, Rapidly, OTUs with Galaxy Solution. Bioinformatics 2018, 34, 1287–1294. [Google Scholar] [CrossRef] [Green Version]
  44. Excoffier, L.; Lischer, H.E.L. Arlequin Suite Ver 3.5: A New Series of Programs to Perform Population Genetics Analyses under Linux and Windows. Mol. Ecol. Resour. 2010, 10, 564–567. [Google Scholar] [CrossRef]
  45. Belkhir, K.; Borsa, P.; Chikhi, L.; Raufaste, N.; Bonhomme, F. 1996–2004 GENETIX 4.05, Logiciel Sous Windows TM Pour La Genetique Des Populations. 2004. Available online: http://www.univmontp2.fr/~genetix/genetix/genetix.htm (accessed on 10 April 2023).
  46. Oosterhout, C.V.; Hutchinson, W.F.; Wills, D.P.M.; Shipley, P. Micro-Checker: Software for Identifying and Correcting Genotyping Errors in Microsatellite Data. Mol. Ecol. Notes 2004, 4, 535–538. [Google Scholar] [CrossRef]
  47. Goudet, J. Fstat (Ver. 2.9.4), a Program to Estimate and Test Population Genetics Parameters. Updated from Goudet (1995). 2003. Available online: http://www.unil.ch/izea/softwares/fstat.html (accessed on 10 April 2023).
  48. Rousset, F. Genepop’007: A Complete Re-Implementation of the Genepop Software for Windows and Linux. Mol. Ecol. Resour. 2008, 8, 103–106. [Google Scholar] [CrossRef]
  49. Coleman, R.A.; Weeks, A.R.; Hoffmann, A.A. Balancing Genetic Uniqueness and Genetic Variation in Determining Conservation and Translocation Strategies: A Comprehensive Case Study of Threatened Dwarf Galaxias, Galaxiella Pusilla (Mack) (Pisces: Galaxiidae). Mol. Ecol. 2013, 22, 1820–1835. [Google Scholar] [CrossRef]
  50. Verity, R.; Nichols, R.A. Estimating the Number of Subpopulations (K) in Structured Populations. Genetics 2016, 203, 1827–1839. [Google Scholar] [CrossRef] [Green Version]
  51. Burnham, K.P.; Anderson, D.R. Practical Use of the Information-Theoretic Approach. In Model Selection and Inference: A Practical Information-Theoretic Approach; Burnham, K.P., Anderson, D.R., Eds.; Springer: New York, NY, USA, 2002; pp. 75–117. ISBN 978-1-4757-2917-7. [Google Scholar]
  52. Barton, K. MuMIn: Multi-Model Inference. 2019. Available online: http://r-forge.r-project.org/projects/mumin/ (accessed on 10 April 2023).
  53. Grueber, C.E.; Nakagawa, S.; Laws, R.J.; Jamieson, I.G. Multimodel Inference in Ecology and Evolution: Challenges and Solutions. J. Evol. Biol. 2011, 24, 699–711. [Google Scholar] [CrossRef]
  54. Best, D.J.; Roberts, D.E. Algorithm AS 89: The Upper Tail Probabilities of Spearman’s Rho. J. R. Stat. Soc. Ser. C (Appl. Stat.) 1975, 24, 377–379. [Google Scholar] [CrossRef]
  55. Rousset, F. Genetic Differentiation and Estimation of Gene Flow from F-Statistics under Isolation by Distance. Genetics 1997, 145, 1219–1228. [Google Scholar] [CrossRef]
  56. Mantel, N. The Detection of Disease Clustering and a Generalized Regression Approach. Cancer Res. 1967, 27, 209–220. [Google Scholar]
  57. Legendre, P.; Legendre, L. Numerical Ecology; Elsevier: Amsterdam, The Netherlands, 2012; ISBN 978-0-444-53869-7. [Google Scholar]
  58. Raeymaekers, J.A.M.; Van Houdt, J.K.J.; Larmuseau, M.H.D.; Geldof, S.; Volckaert, F.A.M. Divergent Selection as Revealed by PST and QTL-Based FST in Three-Spined Stickleback (Gasterosteus aculeatus) Populations along a Coastal-Inland Gradient. Mol. Ecol. 2007, 16, 891–905. [Google Scholar] [CrossRef]
  59. Tatarenkov, A.; Healey, C.I.M.; Avise, J.C. Microgeographic Population Structure of Green Swordail Fish: Genetic Differentiation despite Abundant Migration. Mol. Ecol. 2010, 19, 257–268. [Google Scholar] [CrossRef] [Green Version]
  60. Dowling, T.E.; Saltzgiver, M.J.; Marsh, P.C. Genetic Structure within and among Populations of the Endangered Razorback Sucker (Xyrauchen texanus) as Determined by Analysis of Microsatellites. Conserv Genet 2012, 13, 1073–1083. [Google Scholar] [CrossRef]
  61. Heggenes, J.; Røed, K.H. Do Dams Increase Genetic Diversity in Brown Trout (Salmo trutta)? Microgeographic Differentiation in a Fragmented River. Ecol. Freshw. Fish 2006, 15, 366–375. [Google Scholar] [CrossRef]
  62. Carrara, F.; Altermatt, F.; Rodriguez-Iturbe, I.; Rinaldo, A. Dendritic Connectivity Controls Biodiversity Patterns in Experimental Metacommunities. PNAS 2012, 109, 5761–5766. [Google Scholar] [CrossRef] [Green Version]
  63. Frantz, A.C.; Cellina, S.; Krier, A.; Schley, L.; Burke, T. Using Spatial Bayesian Methods to Determine the Genetic Structure of a Continuously Distributed Population: Clusters or Isolation by Distance? J. Appl. Ecol. 2009, 46, 493–505. [Google Scholar] [CrossRef]
  64. Perez, M.F.; Franco, F.F.; Bombonato, J.R.; Bonatelli, I.A.S.; Khan, G.; Romeiro-Brito, M.; Fegies, A.C.; Ribeiro, P.M.; Silva, G.A.R.; Moraes, E.M. Assessing Population Structure in the Face of Isolation by Distance: Are We Neglecting the Problem? Divers. Distrib. 2018, 24, 1883–1889. [Google Scholar] [CrossRef] [Green Version]
Figure 1. Map of the sampling sites in the Central French Pyrenees along the Garonne and Ariège sub-river basins (Ariège Department, southwestern France). The dams and weirs that may impede the migration of brown trout (i.e., >3 m and without a fishway) are illustrated on the map, with, in yellow, those whose height is between 3 and 5 m, in orange, those whose height is between 5 and 10 m and in red, those whose height is >10 m.
Diversity 15 00784 g001
Figure 2. Genetic diversity (Ar) is higher in (a) the most central populations and (b) in populations nearest to the confluence. Allelic richness is scaled to the mean for each marker. The type of marker does not explain the genetic diversity variation along the environmental gradient.
Diversity 15 00784 g002
Figure 3. Genetic differentiation (FST) is lower in populations more central and closer to the confluence. Mean FST score is scaled to the mean for each marker. The type of marker does not affect the variations in genetic differentiation.
Diversity 15 00784 g003
Figure 4. Relationship between pairwise FST and hydrological distances in the SNPs (r = 0.24, p = 0.016), candidate SNPs (r = 0.19, p = 0.045) and MHC marker (r = 0.21, p = 0.030) in brown trout populations.
Diversity 15 00784 g004
Figure 5. Probability of each individual (represented by a histogram bar) being assigned (Q) to the inferred groups. (A) Results from the analysis conducted on SNP genetic marker (N = 318). The orange part corresponds to the Garonne bassin, the purple part corresponds to the Ariège bassin, the yellow part corresponds to the upstream of the Ariège river and the blue part corresponds to the Touyre river. (B) Results from the analysis conducted on functional SNP genetic marker (N = 318). Significant admixture is observed in this genetic marker; however, the Touyre and Arize rivers appear to have a stronger affiliation with the second group. (C) Results from the analysis conducted on functional MHC genetic marker (N = 314). The purple part corresponds to the Garonne bassin, while the orange part corresponds to the Ariège bassin.
Diversity 15 00784 g005
Table 1. Characteristics of sampled sites. Distances from the confluence (km) and centrality were calculated using QGIS software. N represents the number of trout sampled.
PopulationRiverSiteDistance from the Confluence (km)CentralityN
ARABasL’AracBas des gorges117.8−0.51820
ARIPamL’AriègePamiers63.32.35422
ARISavL’AriègeSavignac132.10.03516
ARIVarL’AriègeVarilhes76.82.16320
ARZDurL’ArizeDurban95.8−0.51825
BOUArgLa BouiganeArgein119.9−0.61520
COUPisLa CourbièreAval pisciculturé105.8−0.71120
HERPeyL’HersPeyrat134.3−0.33020
LEZAubLe LezAubert107.8−0.14520
ORIAxL’OriègeAx-les-Thermes135.4−0.61522
SALGirLe SalatSt-Girons104.80.12420
SALTauLe SalatTaurignan-Castet97.91.33513
SAUAriLe SauratArignac106.2−0.81020
SIOTraLe SiosTramezaïgues92.4−0.71220
TOULarLe TouyreLaroque-d’Olmes127.7−0.61520
VICNiaVicdessosNiaux110.4−0.42420
Total16 318
Table 2. Summary of genetic index in SNP markers (N = 142 locus), candidate SNPs (N = 19 locus) and MHC class IIβ gene. Na corresponds to the mean number of alleles over all loci; Ar is the allelic richness adjusted for the sample size of the smallest population (12 individuals); He is the expected heterozygosity and Ho is the observed heterozygosity. FIS corresponds to the inbreeding coefficient. FST is the measure of population genetic differentiation, calculated from the average of the pairwise FST values observed between a population and all other populations. (‘.’ p = 0.05; ‘*’ p < 0.05; ‘**’ p < 0.01; ‘***’ p < 0.001).
SNPsCandidate SNPsMHC ClassIIβ
PopulationNaArHeHoFISFSTNaArHeHoFISFSTNaArHeHoFISFST
ARABas1.511.480.160.160.0270.0671.471.470.160.17−0.0070.0701914.560.930.700.253 **0.060
ARIPam1.691.630.210.22−0.0370.0631.681.620.190.190.0210.0691612.270.910.860.0530.076
ARISav1.721.670.170.18−0.0150.1141.631.600.170.160.0760.0601211.000.901.00−0.1110.088
ARIVar1.691.620.190.20−0.0340.0621.681.630.180.170.1000.0391311.380.910.840.0770.075
ARZDur1.501.450.140.15−0.0130.1301.631.540.160.160.0450.132108.440.840.830.0130.126
BOUArg1.501.480.170.17−0.0050.0811.531.460.140.140.0460.07286.710.700.600.1460.180
COUPis1.601.570.190.190.042.0.0661.581.560.200.180.1050.0851814.790.950.900.0510.068
HERPey1.521.490.150.140.082 **0.1161.531.480.130.14−0.0050.061119.510.870.500.430 ***0.098
LEZAub1.521.500.180.170.047 *0.0641.471.450.160.160.0070.0551713.700.910.500.459 ***0.071
ORIAx1.721.640.170.170.0130.1141.681.610.180.19−0.0340.070118.430.790.760.0360.141
SALGir1.521.500.170.17−0.0060.1371.581.530.170.18−0.0370.1661412.080.910.560.396 ***0.091
SALTau1.481.470.170.170.078 *0.0631.531.520.160.160.0360.0421010.000.860.540.380 **0.070
SAUAri1.621.560.180.170.092 ***0.0601.681.600.150.150.0370.0401914.090.901.00−0.1140.094
SIOTra1.661.610.190.190.047 *0.0831.581.540.170.18−0.0650.0821813.900.910.850.0720.078
TOULar1.561.530.170.170.0400.0601.531.510.160.160.0670.0521512.740.920.95−0.0280.078
VICNia1.521.490.160.160.050 *0.0781.531.510.170.19−0.0550.0541512.900.930.95−0.0230.070
Table 3. Best submodels [Δ corrected Akaike’s information criterion (AICc) < 2] explaining the variation in genetic diversity (Ar) and differentiation (FST) along environmental gradients (distance from the confluence, centrality) considering the type of genetic marker (SNPs, candidate SNPs and MHC).
dfLoglik.AICcΔAICcWeight
Genetic diversity (Ar)
  c + c24−62.957134.80.000.246
  d + d24−63.368135.70.820.163
  d3−64.979136.51.660.107
Genetic differentiation (FST)
  c + c2 + d + d26−60.599135.20.000.319
  c3−65.047136.61.390.159
Loglik. Log-likelihood, c centrality, d distance from the confluence.
Table 4. Model-averaged coefficients of best submodels (ΔAICc < 2) explaining the variation in genetic diversity (Ar) and differentiation (FST) along environmental gradients (distance from the confluence, centrality).
Estimate ± SeCIRI
Genetic diversity (Ar)
   Centrality−0.41 ± 0.32−1.05, 0.230.48
   Centrality20.42 ± 0.190.03, 0.810.48
   Distance from confluence−0.18 ± 0.15−0.49, 0.120.52
   Distance from confluence20.20 ± 0.11−0.03, 0.420.32
Genetic differentiation (FST)
   Centrality0.08 ± 0.35−0.62, 0.791
   Centrality2−0.90 ± 0.32−1.54, −0.260.67
   Distance from confluence−0.51 ± 0.26−1.04, 0.020.67
   Distance from confluence20.53 ± 0.200.12, 0.940.67
Parameter estimates are given ± adjusted SE; CI—95%Confidence interval, RI—relative importance of each parameter.
Disclaimer/Publisher’s Note: The statements, opinions and data contained in all publications are solely those of the individual author(s) and contributor(s) and not of MDPI and/or the editor(s). MDPI and/or the editor(s) disclaim responsibility for any injury to people or property resulting from any ideas, methods, instructions or products referred to in the content.

