Article

Effects of Freshwater Inflow during the Rainy Season on the Benthic Polychaete Community in the Geum River Estuary, South Korea

Ocean Climate Response & Ecosystem Research Department, KIOST, 385, Haeyang-ro, Yeongdo-gu, Busan 49111, Republic of Korea
*
Author to whom correspondence should be addressed.
Submission received: 7 February 2024 / Revised: 29 February 2024 / Accepted: 12 March 2024 / Published: 16 March 2024
(This article belongs to the Special Issue Dynamics of Marine Communities)

Abstract

:
In the estuaries of Korea, the freshwater inflow increases rapidly due to the Changma (Korean summer rainy season). To elucidate the effect of this massive freshwater inflow on the benthic polychaete community, a survey was conducted before, during, and after the rainy season. Comparing the environmental characteristics before and after the rainy season, the salinity and dissolved oxygen decreased, the sand content of sediment was significantly reduced, and silt increased. The number of species decreased sharply, and this change was more considerable at sites closer to the estuary. Loimia sp. and Pseudopotamilla sp., the dominant species before the rainy season, were not found after the rainy season. The massive freshwater inflow during the rainy season has been a tremendous stress on the benthic environment and significantly alters the species composition and distribution of benthic polychaetes.

1. Introduction

Changma, a primary rainy season in Korea, is one of many regional subcomponents of the East Asian summer monsoon. The primary rainy period has its climatological onset in mid-June and ends in mid-July [1,2,3,4,5]. The secondary rainy period is strongly associated with typhoon activity in late August. As a component of the East Asian summer monsoon system, Changma’s characteristics are affected by changes in surface temperature and sea-level pressure in the mid-latitudes [3]. During the rainy season, more freshwater flows into the estuaries, significantly changing the water’s properties [6]. During the rainy season, river water carries clay and organic matter of terrestrial origin and increases nitrate and phosphate concentrations [7].
Estuaries, where a river meets the sea, are highly productive compared to other environments [8]. Around an estuary, freshwater ecosystems, seawater ecosystems, and brackish ecosystems co-exist; diverse biota inhabit these regions, which are characterized by sharp environmental gradients [9]. The Yellow Sea has a shallow intertidal zone, and benthic animals in the intertidal zone use nutrients from both the land and the ocean [10]. Several studies have shown that nutrient supply in the Yellow Sea depends on the seasonal abundance of benthic producers, feeding patterns, consumer preferences, and the frequency of freshwater flooding [11,12].
The construction of the estuary dam in the Geum River Estuary in 1994 resulted in an industrialized and artificially modified coastal ecosystem, dividing the original brackish estuarine environment into an upper freshwater reservoir and a lower estuary [13]. After construction, primary production increased rapidly [14]. In summer, the water level rises due to torrential rains and is subsequently discharged (>80%), with an estimated 6.4 × 10⁹ tons of freshwater flowing into the Yellow Sea annually through the estuary dam [15].
The relatively long lifespan, low mobility, and regional variation of macrobenthos make them an ideal group for investigation reflecting anthropogenic and natural gradients in marine ecosystems [16]. Polychaetes are one of the most abundant and diverse groups of macrobenthos, or bottom-dwelling organisms, and have highly diverse feeding modes and reproductive processes [17,18,19]. In addition, this taxon shows resistance to various negative factors, including ecosystem disturbance and organic matter pollution [20]. Polychaete communities exhibit a dynamic response to heavy metal contamination by increasing resistant taxa, decreasing body size, and decreasing density [16].
Feeding guilds of polychaetes are based on various characteristics and can be assessed regarding three main traits: major mode, motility pattern, and morphology. Polychaetes exhibit a variety of feeding modes, including carnivore, herbivore, and filter feeding [17,21]. These feeding modes are associated with different ecological niches, and their distribution can be used to elucidate the ecological characteristics [22,23,24].
The recolonization of marine benthic habitats has been considered relatively rapid and can range from days to months and years [25]. Seasonal changes influence the recolonization and succession of benthic fauna, and the importance of natural factors such as temperature and precipitation in estuary environments has emerged [25,26]. The Shannon–Wiener Diversity Index, AZTI Marine Biodiversity Index (AMBI), and Multivariate AMBI (M-AMBI) are all measures of community diversity that can be used to assess the temporal and spatial variation of benthic communities, and the disturbance of benthic surrounding habitats [27,28,29]. Also, biological indexes are used to identify changes in organisms in the benthic environment. These indices are helpful in decision making because they integrate complex scientific data to produce clear and concise interpretations [30,31].
To evaluate the effects of massive freshwater inflows on benthic ecosystems, we investigated changes in the density, species diversity, and community structure of benthic polychaetes before, during, and after the rainy season. The relationship between benthic polychaetes and heavy metals in sediments was identified and evaluated using ecological indices.

2. Materials and Methods

2.1. Study Area

We surveyed eight sites in the Geum River Estuary of the Yellow Sea (Figure 1). The average water depth at sites K1-5 is 14 m, K6 is 20 m, K7 is 30 m, and K8 is 40 m. The survey was conducted in June, July, and September 2020, i.e., before, during, and after the rainy season. The rainy season began on 24 June and ended on 16 August 2020, making it the longest rainy season since 1974 (54 days). The central part of the survey area recorded 851.7 mm of precipitation, which was 233.6% higher than the average of 364.6 mm. During that period, three typhoons (Jangmi, Bavi, and Maysak) affected the Korean Peninsula (Korea Meteorological Administration, 2020). The characteristic spatial distribution of macrobenthic fauna in the Geum River Area has been reported [32], and the relationship between the spatial distribution of benthic communities and environmental factors were studied in 2014 [33]. Since 2015, seasonal surveys have been conducted for four sites in the Geum River Estuary [34].

2.2. Sample Processing

Benthic samples were collected with two repetitions of the Smith–McIntyre grab (0.1 m2). Samples were sieved through a 1 mm sieve and fixed in 10% formalin solution to preserve biological morphology. The surface sediments were collected separately and frozen at −20 °C for analysis of geochemical properties, including particle size, total organic carbon (TOC), and heavy metals. The remaining benthic animals were transported to the laboratory, where they were identified to the species level using a stereomicroscope.
Water temperature, dissolved oxygen (DO), and salinity were measured using a conductivity, temperature, and depth (CTD) profiler (SBE 19 plus; Sea-Bird Electronics, Bellevue, WA, USA). The particle size distribution of the sediment samples was analyzed using a laser diffraction particle size analyzer (Mastersizer 2000; Malvern PANalytical Ltd., Malvern, UK) after removing inorganic carbon and organic matter with 1 N HCl (Ultra-100; Kanto Chemical, Tokyo, Japan) and 35% hydrogen peroxide (Daejung Chemicals & Metals Co., Siheung-si, Republic of Korea), respectively.
Total organic carbon (TOC) and metal analysis samples were lyophilized, pulverized, and homogenized using a planetary mono mill (Pulverisette 6; Fritsch International, Idar-Oberstein, Germany). After removing inorganic carbon from the pulverized samples with 1 N HCl, TOC was confirmed using an elemental analyzer (Euro EA3028; EuroVector, Milan, Italy). For heavy metal analysis, the sediment samples were placed in a Teflon digestion vessel and then completely decomposed on a hot plate after adding high-purity (Ultra-100; Kanto Chemical, Tokyo, Japan) mixed acids (HF:HNO3:HClO4 = 5:4:1, v/v). The decomposed samples were evaporated to near dryness and diluted with 3% HNO3 (Ultra-100; Kanto Chemical). Heavy metals were determined using inductively coupled plasma mass spectrometry (iCAP-Q ICP-MS; ThermoFisher Scientific, Bremen, Germany) at the Korea Institute of Ocean Science and Technology (KIOST).

2.3. Data Processing

Three ecological indicators were used: Margalef’s index (d), the Shannon–Wiener diversity index (H′), and Hurlbert’s rarefaction index (ES(100)). To compare the stability of the polychaete communities at each site, k-dominance curves were performed. Species densities were converted to m2 units to allow comparison. For similarity and clustering analyses, fourth-root transformed density and Bray–Curtis similarity values were subjected to hierarchical clustering and non-metric multidimensional scaling (nMDS) to identify and visualize community structure. The analysis of similarities (ANOSIM) test was used to assess the relative influence of sites. The similarity profile (SIMPROF) permutation test was used to identify significant differences in polychaete community composition among groups. Analyses were performed using Primer v7 software (Plymouth Marine Laboratory, Plymouth, UK) [35]. One-way analysis of variance (ANOVA) on rank was performed between polychaete species and environmental variables by applying the Tukey test (Sigma Plot 15). Canonical correspondence analysis (CCA) was performed to identify and measure associations between polychaete species and environmental variables (Canoco 4.5 ver, Microcomputer Power, Ithaca, NY, USA).
Based on AMBI guidelines (http://ambi.azti.es (accessed on 26 September 2022)), the benthic indices AZTI’s Marine Biotic Index (AMBI) and multivariate AMBI (M-AMBI) were confirmed using the online AMBI program (version 5.0). The thresholds for the M-AMBI condition are: ‘High’ quality > 0.77; ‘Good’ = 0.53–0.77; ‘Normal’ = 0.38–0.53; ‘Poor’ = 0.20–0.38; and ‘bad’ < 0.20 [36].

2.4. Feeding Guilds

Feeding guilds are groups of organisms that share a similar feeding strategy (Table 1). They are assembled based on three characteristic functions: feeding characteristics, feeding motility patterns, and food contact and ingestion [17,22,37]. Feeding characteristics include morphological structures following food composition, food intake, and particle size [17]. Feeding motility patterns are defined as motility (M), discontinuous motility (D), and fixation (S). Food contact and ingestion are classified as pumping tentacles (T), jawed (J), and pouch-like pharynx (X). These feeding strategies can be classified into 22 biologically relevant feeding guilds [19,22].
The feeding guild concept is a useful tool for understanding the ecology of marine communities. By grouping organisms together based on their feeding strategies, it is possible to identify patterns in the distribution and abundance of organisms that are related to their feeding habits [19,38].

3. Results

3.1. Environmental Variability

The depth range of the survey area was 6–40 m, and the average depth was 19.2 ± 8.3 m. In September, K8 was the deepest site, and K2 was the shallowest (Table 2). The average particle size (Mz) in the survey area was 122.19 ± 89.10, and the lowest value was measured in September, after the rainy season (111.78 ± 85.06) (Table 2). The sand content of sediment was highest (average of 59.3%), followed by silt (38.5%). For clay, the average content was 2.3 ± 1.9%, which tended to decrease from the coast to the open sea. Conversely, the proportion of sand was low near the coast but increased significantly toward the open sea. In July at K8, sand reached its highest level (100%), whereas in September at K3, it had its lowest content (5.2%). In general, when the amount of sand was low, the silt percentage increased significantly, and the clay content increased slightly (Figure 2).
Among heavy metals, Zn had the highest concentration (average of 52.37 ± 35.46 ppm) (Table 2). Cd had the lowest level (average of 0.12 ± 0.07). Zn had its highest average (61.11 ± 44.85 ppm) in September and lowest average (46.79 ± 32.10 ppm) in July. In September, site K1 had the highest recorded Zn content of 131.08 ppm, whereas, in July, K8 showed the lowest value (11.87 ppm). Most heavy metals were abundant along the coast and became sparse toward the open sea. Zn showed the largest such decrease. In addition, although there was no significant difference in the overall level of heavy metals between June and July, it increased in September. In particular, Cu had the largest increase, of 34%, while Zn increased by 22% (Table 2). Overall, heavy metal concentrations were very low and did not have a significant impact on polychaetes in the benthic ecosystem.
Numerous environmental variables changed with the passage of the rainy season (Table 3, Figure 3). Over the entire study period, water temperature decreased toward the open sea, with relatively low temperatures in the bottom layer. Salinity increased toward the open sea, and low-salinity water was distributed in the surface layer due to the inflow of freshwater and relatively high salinity in the bottom layer. The water temperature rose by > 2 °C after the rainy season and increased significantly in the surface layer. Surface salinity decreased by 5.35 psu, while bottom salinity fell by 0.94 psu. DO in the surface layer decreased by 0.33 mg/L after the rainy season, and the bottom layer decreased by 0.51 mg/L. The sand content was greatly reduced among sediment types, while the silt content increased greatly (Table 3, Figure 3).

3.2. Macrobenthos

After the rainy season, the average density of macrobenthos decreased significantly (Table 4). Mollusks showed the greatest change, with a decrease of 54.7%, while polychaetes decreased by 40.7%. In terms of species numbers, the average total of macrobenthos decreased by 6.9 species, while polychaetes decreased by 3.54 species and echinoderms by 0.22 species (Table 4). Species numbers and densities declined significantly at sites K1 and K2, which were strongly influenced by freshwater due to their proximity to estuaries.

3.3. Dominant Species

A total of 97 species of polychaetes belonging to 68 genera and 34 families were observed in the survey areas (Table 5). According to the average density, the most abundant polychaete family was Capitellidae (215 ind/m2), followed by Ampharetidae (132 ind/m2), Terebellidae (125 ind/m2), Spionidae (86 ind/m2), and Sabellidae (76 ind/m2). Regarding the number of species, Spionidae was the most abundant, with 16 species, followed by Glyceridae, with 6 species. A total of 11 families were each represented by a single species (Chrysopetalidae, Lacydoniidae, Maldanidae, Nereididae, Oenonidae, Opheliidae, Orbiniidae, Pectinariidae, Poecilochaetidae, Sternaspidae, and Trichobranchidae). In terms of feeding types, 13 families containing carnivores were observed (Chrysopetalidae, Dorvilleidae, Eunicidae, Glyceridae, Hesionidae, Lacydoniidae, Nephtyidae, Oenonidae, Phyllodocidae, Pilargidae, Polynoidae, Sigalionidae, and Syllidae), along with 6 families containing filter feeders (Chaetopteridae, Flabelligeridae, Oweniidae, Pectinariidae, Sabellidae, and Spionidae), 8 containing subsurface deposit feeders (Capitellidae, Lumbrineridae, Maldanidae, Nereididae, Onuphidae, Opheliidae, Orbiniidae, and Sternaspidae), and 7 containing surface deposit feeders (Ampharetidae, Cirratulidae, Magelonidae, Paraonidae, Poecilochaetidae, Terebellidae, and Trichobranchidae).
The dominant polychaete species were Heteromastus filiformis, Ampharete cf. finmarchica, Loimia sp., Pseudopotamilla sp., Sigambra tentaculata, Chaetozone setosa, Spiophanes bombyx, Nephtys polybranchia, and Cirratulus cirratus (Table 6, Figure 4). The most prevalent species, H. filiformis, had an average density of 210 individuals/m2 and a frequency ratio of 79% for all sites. This species was present before, during, and after the rainy season, and its feeding guild was BDX.

3.4. Ecological Indices

The number of polychaete species was greatest in September at K8, at 36 species, and lowest in July at K1 and September at K2 (7 species each) (Table 7). Density was highest at K1 in June, at 5140, and lowest at K1 in July, at 70. The H′ averaged 1.98 ± 0.58, with its highest value being 3.06 at K7 in September, and its lowest being 1.21 at K1 in July. The d was in the range of 1.19–5.57; like the number of species, it was the lowest at K2 in September and highest at K7 in September (5.57). July at K1 and September at K2 had the same number of species but differed in index values. The J′ averaged 0.67 + 0.17, and ranged from 0.38 to 0.88.
The average AZTI Marine Biotic Index (AMBI) was 2.51 ± 1.26 before the rainy season but rose to 3.01 ± 0.89 thereafter (Table 7). Overall, these values confirm that the environment had deteriorated. Multivariate AMBI (M-AMBI) was 0.64 ± 0.13 before the rainy season and 0.63 ± 0.20 thereafter. After the rainy season, the M-AMBI values at K1 and K2 were 0.34 and 0.36, respectively. Before the rainy season, the status of both sites was ‘Good’, but after the rainy season, the status shifted to ‘Poor’.

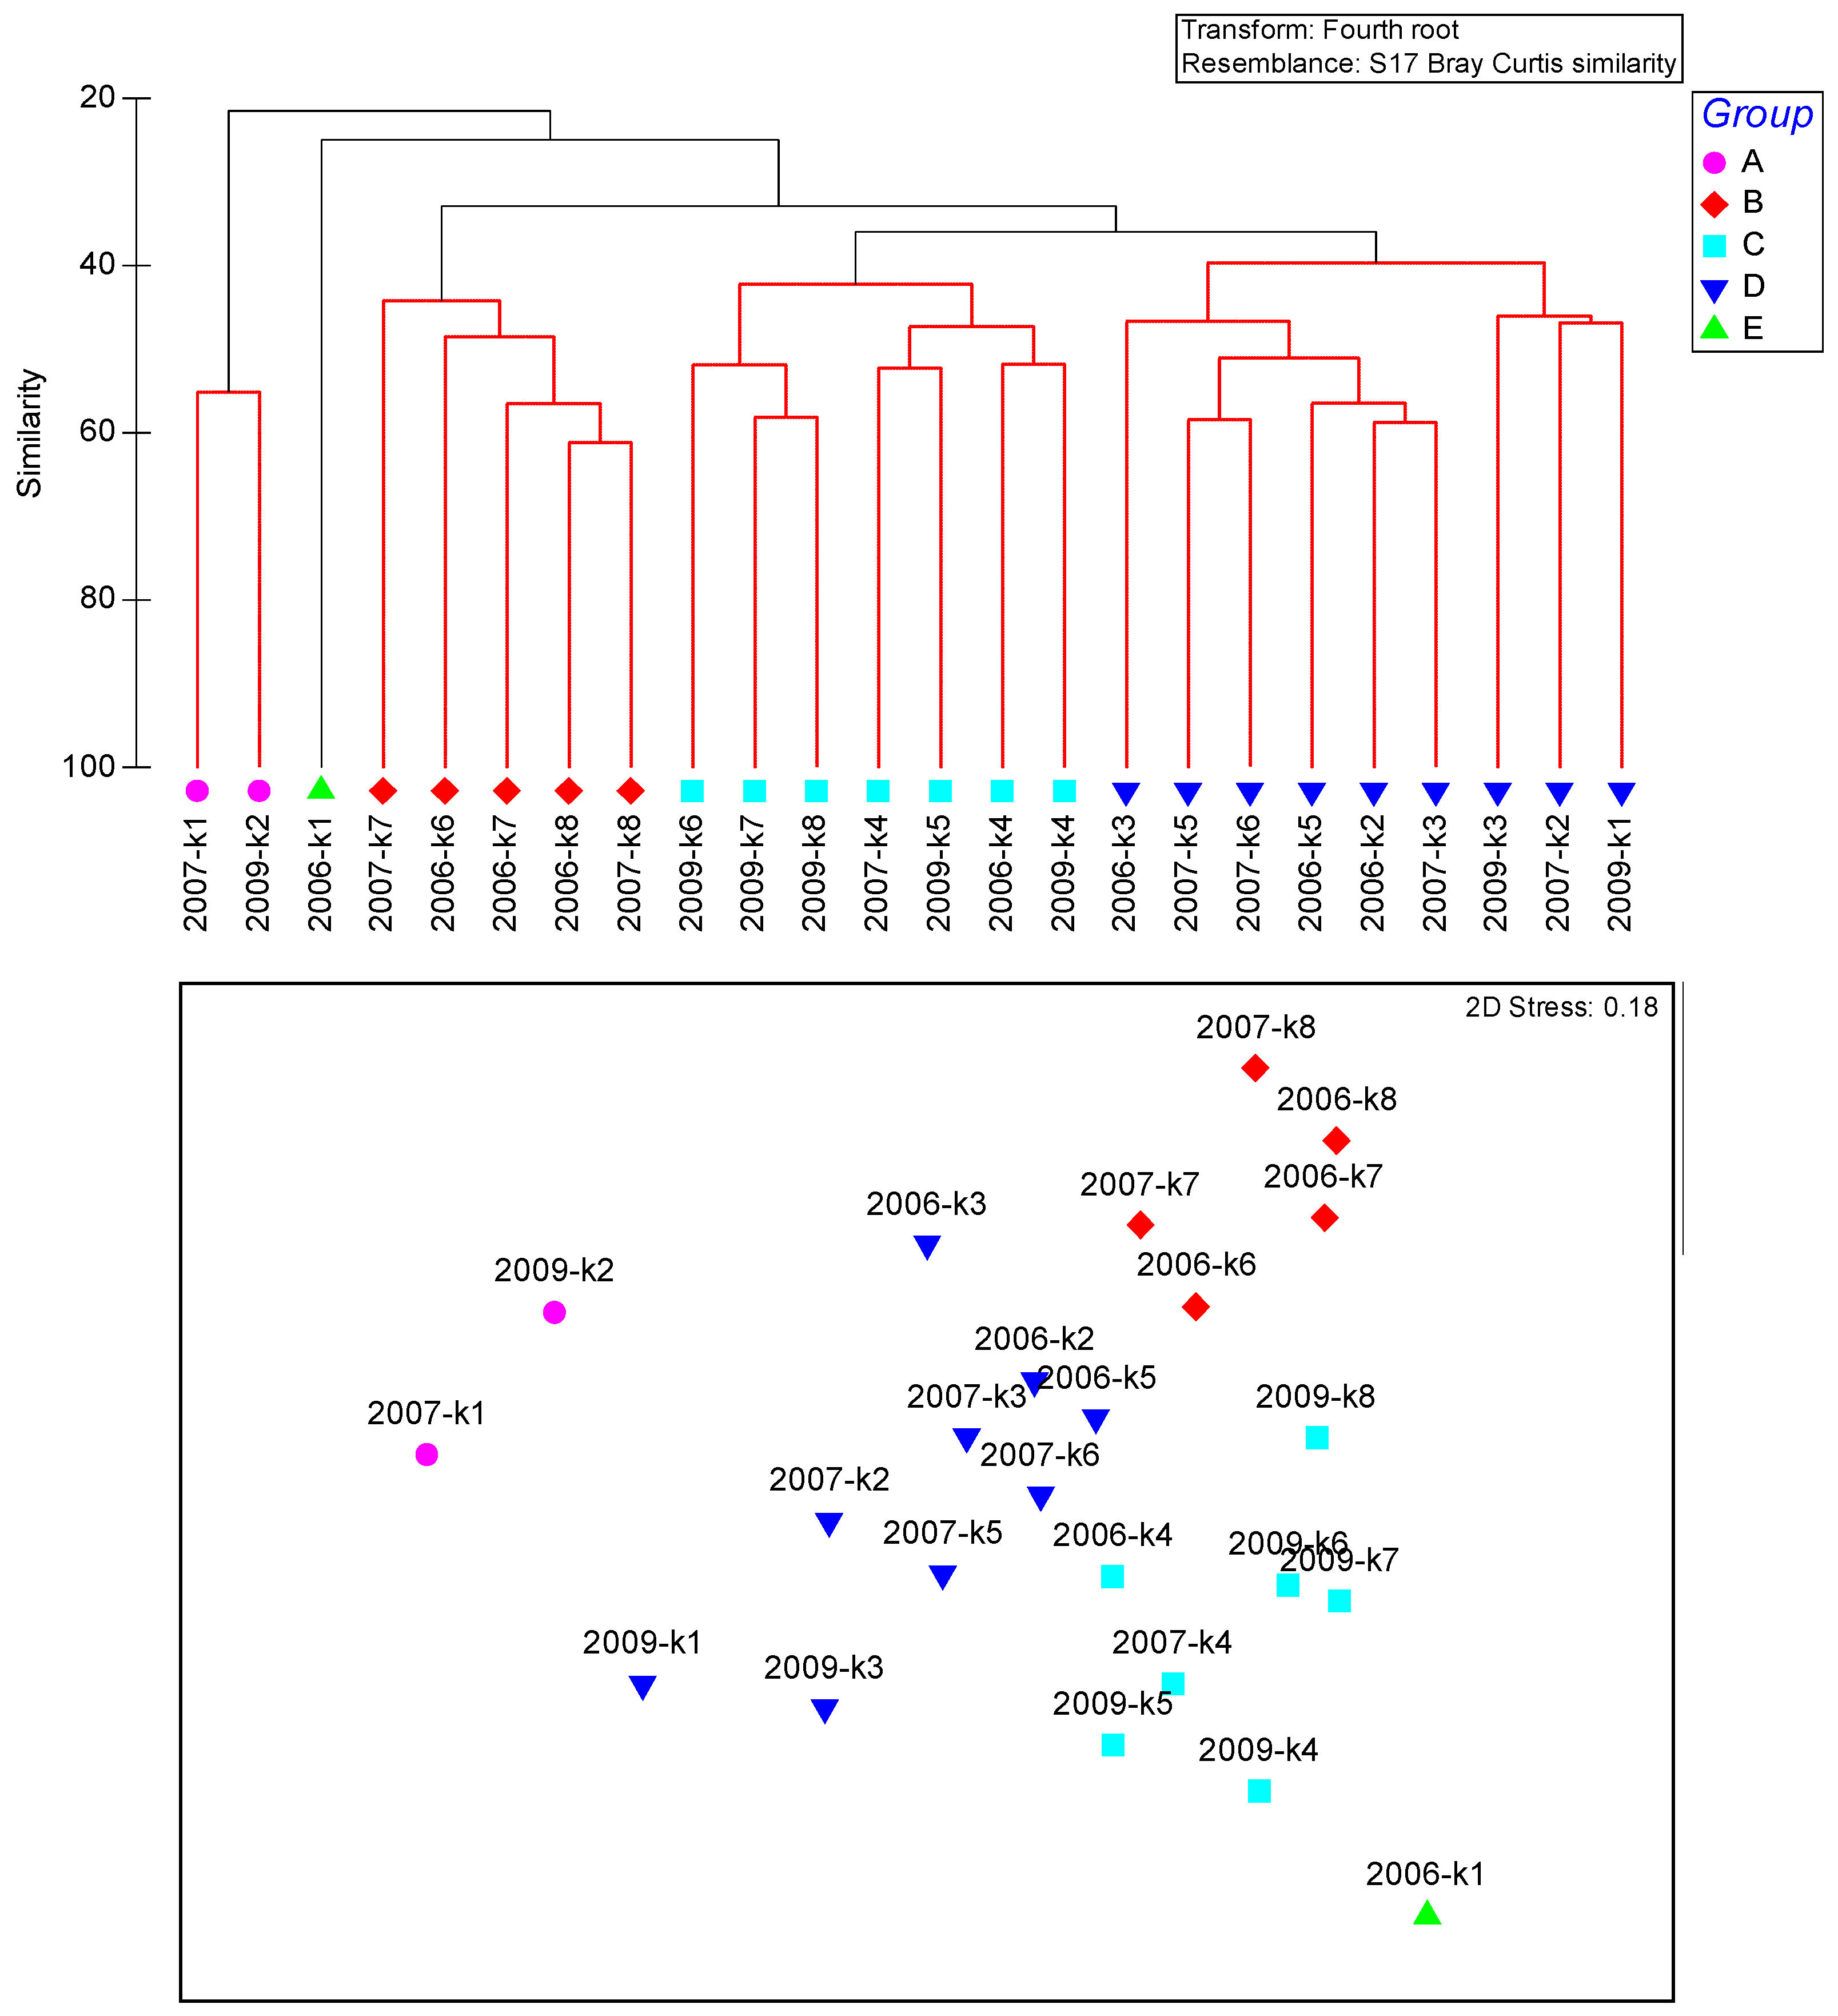
3.5. Polychaete Community Characteristics

Cluster analysis of polychaete density was performed (Figure 5). The SIMPROF test yielded five clusters, and ANOSIM global R-value was 0.753 (p-value; 0.001). Sites K1 and K2, located near the estuary, were grouped, and the outermost sites (K7 and K8) tended to group together. Site K1 formed its own cluster in June.

3.6. Polychaete Species K-Dominance Curve

We investigated the K-dominance curves of sites K1–3, which should be strongly affected by the inflow of freshwater after the rainy season (Status; “poor” or “moderate”) (Table 7, Figure 6). Sites K1 and K2, which are closest to the land, showed an increase in cumulative dominance percentage after the rainy season. Relatively, there was no significant difference in K3 before and after the rainy season. After the rainy season, the dominant polychaetes at K1 were Loimia sp. (50%) and Pseudopotamilla sp. (33%), together accounting for 86% of the total density.

3.7. Environmental Correlation

According to the CCA of the dominant species and environmental parameters, the type of sediment had a significant effect on polychaete species (Table 8, Figure 7). The major dominant species were related to mean grain size (Mz), sand, dissolved oxygen (DO), and water temperature. In particular, Mz and DO had the same tendency, and sand had an opposite tendency to silt and clay. Sites associated with sand were generally located far from the estuary, whereas silt and clay were strongly related to sites near the estuary. Tukey’s test analysis showed that water temperature and salinity could enrich C. cirratus, Loimia sp., and Pseudopotamila sp. among the dominant species (p < 0.05). Sediment average grain size and sand can enrich S. bombyx and A. cf. finmarchica compared to clay (p < 0.05). These patterns were confirmed by Spearman rank correlation analysis (Table 8). The dominant species, H. filiformis, S. tentaculata, C. setosa, and S. bombyx, were correlated with sediment type. In particular, H. filiformis showed a strong negative correlation with sand content. Loimia sp. and Pseudopotamilla sp., S. tentaculata, and H. filiformis showed positive correlations among the dominant species.

4. Discussion

In the survey area, the range of change in salinity, dissolved oxygen, and temperature within a short period of time was very large. The number of species and density of polychaetes after the rainy season differed significantly compared to before the rainy season. Salinity and water temperature are key environmental variables in the life history of marine animals, and they have been found to be the most important environmental variables controlling the diversity and distribution pattern of macrofauna, especially in estuaries [39,40,41]. Yu (2012) suggested that salinity dropped significantly during the monsoon season, and the influence of freshwater could be an essential factor in controlling macrobenthic communities from the Han River to the southern part of Ganghwa Island [41]. Lee (2018) showed that in the estuary of the Geum River, communities are classified by physical disturbance, salinity, and sedimentation [34]. In this survey, the influx of freshwater continued to have an impact through changes in environmental variables after the rainy season.
Jin (2010) reported that the rainy season greatly impacts benthic animals, especially in estuaries, where a large amount of freshwater inflow occurs [42]. Terrestrial soil, heavy metals, and organic matter flow into the sea through the estuary, and local benthic ecosystems undergo tremendous changes. Zhou (2011) stated that disrupted freshwater ecosystems require at least 1–3 months to recover [43]. Kim (2015) reported that abundant organic matter introduced from the land allows organisms to bloom, supporting flourishing phytoplankton that later dies and provides nutrients to the bottom layer [44]. Heavy rainfall during the rainy season refreshes the estuarine ecosystem, but further studies are needed to determine the positive impacts these changes have on the benthic ecosystem.
In the survey area, changes in sedimentation occurred after the rainy season, the sand content decreased, and silt content increased. Gardel (2020) noted that sediments mobilized by high discharge in the rainy season and especially by tidal pumping are deposited in mud pools to form the surrounding tidal flats, and that large freshwater flows associated with heavy rainfall carry fine sediment particles [45]. According to Kang (2010), 1000 tons of water flows into the sea annually through the Geum River, 800 tons of which occur during the rainy season [46]. In addition to fine particles, heavy metals also enter the estuary during this period. The heavy metal content in the survey area was high after the rainy season. Zn, which is the most abundant heavy metal, increased by 24.2% and 30.6%, respectively, on average, after the rainy season compared to measurements before and during the rainy season. More detailed investigations are needed as this process increases the amount of heavy metals present in marine organisms.
The distribution characteristics and feeding combinations of benthic polychaetes inhabiting waters outside Gunsan were investigated. In total, 54 species of polychaetes belonging to 30 families were observed. The dominant species were Sternaspis scutata (10%), Lumbrineris cruzensis (9.7%), N. polybranchia (5.6%), and Praxillella affinis (5.2%). The appearance of these major species differed according to sediment type. S. scutata, L. cruzensis, Goniada maculata, and others appeared mainly on mixed sediments. The feeding combinations of polychaetes were classified into 12 types, among which BMX appeared most frequently (19 sites and 26% of the total occurrences). Each feeding combination preferred particular sedimentary phases; for example, in the sedimentary phase, subsurface sedimentary, motile and non-tactile polychaetes prevailed, characterized by feeding combinations such as BMX and BMJ. On the other hand, in the sandy sedimentary phase, feeding combinations such as FDT and SST, which exhibit filtration activity, stickiness, and tentacles, were dominant
In the survey area, the average density of polychaetes decreased after the end of the rainy season. Some previous studies have reported similar changes [47,48]. This shift shows that a large amount of rainfall affected the benthic ecosystem, which may lead to the development of a new benthic environment [49]. Before the rainy season, K1 had a density of 5120 individuals/m2, which is 106% higher than the next highest site. Interestingly, Loimia sp. appeared in huge numbers at this time but was scarce during and after the rainy season. The genus Loimia belongs to the family Terebellidae, which is commonly found in muddy areas such as the Yellow Sea [50]. Seitz (1995) found that during the summer, Loimia populations showed rapid growth and maturation, as would be expected from an opportunistic species [51]. Clearly, a relationship exists between the rainy season and this genus, and more data on Loimia sp. are needed.
Among dominant polychaete species, H. filiformis, A. cf. finmarchica, and Loimia sp. are deposit feeders [21,52]. H. filiformis prefers deeper sites than the other two species and has a tendency to burrow [21]. This species frequently appears in muddy sediments and is ubiquitous along the Yellow Sea coast (including Ganghwado, the Han River, Taean, Seocheon, Geumgang, and Taehwagang) [53]. In addition, as it can survive well in polluted areas, H. filiformis is used as a pollution indicator species for organic enrichment or contamination in benthic environments [54]. The widespread distribution of these dominant opportunistic species in the Yellow Sea suggests exposure to long-term physical or anthropogenic chemical disturbances [55]. Deposit feeders should be assessed in relation to the surrounding environment, and more data about the mechanisms employed by pollution indicator species and their adaptations to such stress are needed.
The communities of macrobenthic polychaetes were grouped according to distance from the estuary. K7 and K8 are located farthest from the estuary and were grouped together in June and July but were divided into different clusters in August. Prior to the rainy season, S. bombyx showed high density, whereas after the rainy season, it was scarce and replaced by A. cf. finmarchica. The species composition in these regions changed during the rainy season. Jayachandran (2019) stated that the polychaete community showed distinct seasonal patterns and changes in the estuary [56]. In that survey, surface deposit feeders and subsurface deposit feeders predominate the polychaete community before the rainy season, whereas suspension feeders are predominant during other periods. In this investigation of the benthic environment of the estuary, we found that the role of polychaetes is essential and that feeding guilds exhibit major shifts. In future estuarine surveys, the assessment of polychaetes should be strengthened, and feeding guilds should be emphasized.

5. Conclusions

We investigated the changes in the species composition and density of benthic polychaetes between pre-, mid-, and post-rainy season samples collected in the Geumgang Estuary of the Yellow Sea and assessed the impacts of freshwater on the benthic ecosystem of the estuary. Comparing the environmental characteristics before and after the rainy season, salinity and dissolved oxygen decreased, and sediment silt increased. After the rainy season, changes in the existing dominant species occurred due to changes in the benthic environment (sediment type and heavy metals), and the species composition also changed. According to the CCA results for environmental variables, the sediment type had a significant effect. Sand-related sites are predominantly coastal, while silt and clay are closely associated with near-shore sites.

Author Contributions

Conceptualization, O.H.Y. and S.L.K.; methodology, S.L.K.; software, S.L.K.; validation, O.H.Y. and S.L.K.; formal analysis, S.L.K.; investigation, K.-H.O., K.R. and S.L.K.; writing—original draft preparation, O.H.Y. and S.L.K.; writing—review and editing, O.H.Y. and S.L.K.; funding acquisition, O.H.Y. All authors have read and agreed to the published version of the manuscript.

Funding

This study was supported by the grant “Strengthening to analyze and assess marine environmental/ecosystem variabilities in the surrounding seas of Korea” from the Korea Institute of Ocean Science and Technology (PEA0201) and Korea Institute of Marine Science & Technology Promotion (KIMST), funded by the Ministry of Oceans and Fisheries (20210696).

Institutional Review Board Statement

Not applicable.

Informed Consent Statement

Not applicable.

Data Availability Statement

The original contributions presented in the study are included in the article, further inquiries can be directed to the corresponding author.

Conflicts of Interest

The authors declare no conflict of interest.

References

  1. Ho, C.; Kang, I. The variability of precipitation in Korea. J. Korean Meteorol. Soc. 1988, 24, 38–48. [Google Scholar]
  2. Kang, I.S.; Ho, C.H.; Lim, Y.K.; Lau, K.M. Principal modes of climatological seasonal and intraseasonal variations of the Asian summer monsoon. Mon. Weather Rev. 1999, 127, 322–340. [Google Scholar] [CrossRef]
  3. Ho, C.H.; Lee, J.Y.; Ahn, M.H.; Lee, H.S. A sudden change in summer rainfall characteristics in Korea during the late 1970s. Int. J. Climatol. 2003, 23, 117–128. [Google Scholar] [CrossRef]
  4. Seo, K.; Son, J.; Lee, J. A new look at Changma. Atmosphere 2011, 21, 109–121. [Google Scholar]
  5. Lee, J.Y.; Kwon, M.H.; Yun, K.S.; Min, S.K.; Park, I.H.; Ham, Y.G.; Jin, E.K.; Kim, J.H.; Seo, K.H.; Kim, W.M.; et al. The long-term variability of Changma in the East Asian summer monsoon system: A review and revisit. Asia-Pac. J. Atmos. Sci. 2017, 53, 257–272. [Google Scholar] [CrossRef]
  6. Filho, J.S.R.; Aviz, D. Macrobenthic communities of an Amazonian estuary (Guajará Bay, Brazil): Temporal and spatial changes. J. Coast. Res. 2013, 65, 123–128. [Google Scholar] [CrossRef]
  7. Palmer, T.A.; Montagna, P.A.; Pollack, J.B.; Kalke, R.D.; DeYoe, H.R. The role of freshwater inflow in lagoons, rivers, and bays. Hydrobiologia 2011, 667, 49–67. [Google Scholar] [CrossRef]
  8. Costanza, R.; D’Arge, R.; de Groot, R.; Farber, S.; Grasso, M.; Hannon, B.; Limburg, K.; Naeem, S.; O’Neill, R.V.; Paruelo, J.; et al. The value of the world’s ecosystem services and natural capital. Nature 1997, 387, 253–260. [Google Scholar] [CrossRef]
  9. Whitfield, A.K.; Elliott, M.; Basset, A.; Blaber, S.J.M.; West, R.J. Paradigms in estuarine ecology—A review of the Remane diagram with a suggested revised model for estuaries. Estuar. Coast. Shelf Sci. 2012, 97, 78–90. [Google Scholar] [CrossRef]
  10. Dias, E.; Morais, P.; Cotter, A.M.; Antunes, C.; Hoffman, J.C. Estuarine consumers utilize marine, estuarine and terrestrial organic matter and provide connectivity among these food webs. Mar. Ecol. Prog. Ser. 2016, 554, 21–34. [Google Scholar] [CrossRef]
  11. Davenport, J.; Ezgeta-Balić, D.; Peharda, M.; Skejić, S.; Ninčević-Gladan, Ž.; Matijević, S. Size-differential feeding in Pinna nobilis L. (Mollusca: Bivalvia): Exploitation of detritus, phytoplankton and zooplankton. Estuar. Coast. Shelf Sci. 2011, 92, 246–254. [Google Scholar] [CrossRef]
  12. Rossi, F.; Baeta, A.; Marques, J.C. Stable isotopes reveal habitat-related diet shifts in facultative deposit-feeders. J. Sea Res. 2015, 95, 172–179. [Google Scholar] [CrossRef]
  13. Lee, S.-H.; Kwon, H.-K.; Choi, H.-Y.; Yang, J.-S.; Choi, J.-Y. Physical Environment Changes in the Keum River Estuary by the Dyke Gate Operation: II. Salinity Structure and Estuary Type. Korean J. Environ. Biol. 1999, 4, 255–265. [Google Scholar]
  14. Figueroa, S.M.; Lee, G.H.; Shin, H.J. The effect of periodic stratification on floc size distribution and its tidal and vertical variability: Geum Estuary, South Korea. Mar. Geol. 2019, 412, 187–198. [Google Scholar] [CrossRef]
  15. Kim, D.; Hong, S.; Choi, H.; Choi, B.; Kim, J.; Khim, J.S.; Park, H.; Shin, K.H. Multimedia distributions, bioaccumulation, and trophic transfer of microcystins in the Geum River Estuary, Korea: Application of compound-specific isotope analysis of amino acids. Environ. Int. 2019, 133, 105194. [Google Scholar] [CrossRef]
  16. Nunes, M.; Coelho, J.P.; Cardoso, P.G.; Pereira, M.E.; Duarte, A.C.; Pardal, M.A. The macrobenthic community along a mercury contamination in a temperate estuarine system (Ria de Aveiro, Portugal). Sci. Total Environ. 2008, 405, 186–194. [Google Scholar] [CrossRef]
  17. Fauchald, K.; Jumars, P.A. The diet of worms: A study of polychaete feeding guilds. Oceanogr. Mar. Biol. Annu. Rev. 1979, 17, 193–284. [Google Scholar]
  18. Vijapure, T.; Sukumaran, S.; Neetu, S.; Chandel, K. Macrobenthos at marine hotspots along the northwest Indian inner shelf: Patterns and drivers. Mar. Environ. Res. 2019, 144, 111–124. [Google Scholar] [CrossRef]
  19. Domínguez Castanedo, N.; Hernández Alcántara, P.; Solís-Weiss, V.; Granados Barba, A. Distribution of polychaete feeding guilds in sedimentary environments of the Campeche Bank, Southern Gulf of Mexico. Helgol. Mar. Res. 2012, 66, 469–478. [Google Scholar] [CrossRef]
  20. Musale, A.S.; Desai, D.V. Distribution and abundance of macrobenthic polychaetes along the South Indian coast. Environ. Monit. Assess. 2011, 178, 423–436. [Google Scholar] [CrossRef] [PubMed]
  21. Sivadas, S.; Ingole, B.; Nanajkar, M. Benthic polychaetes as good indicators of anthropogenic impact. Indian J. Mar. Sci. 2010, 39, 201–211. [Google Scholar]
  22. Jumars, P.A.; Dorgan, K.M.; Lindsay, S.M. Diet of worms emended: An update of polychaete feeding guilds. Ann. Rev. Mar. Sci. 2015, 7, 497–520. [Google Scholar] [CrossRef] [PubMed]
  23. Magalhães, W.F.; Barros, F. Structural and functional approaches to describe polychaete assemblages: Ecological implications for estuarine ecosystems. Mar. Freshw. Res. 2011, 62, 918–926. [Google Scholar] [CrossRef]
  24. Han, Q.; Jiang, X.; Wang, X. The polychaete feeding guild composition in the Sishili Bay, the northern Yellow Sea, China. J. Mar. Biol. Assoc. UK 2016, 96, 1083–1092. [Google Scholar] [CrossRef]
  25. Carvalho, S.; Pereira, P.; Pereira, F.; de Pablo, H.; Vale, C.; Gaspar, M.B. Factors structuring temporal and spatial dynamics of macrobenthic communities in a eutrophic coastal lagoon (Óbidos lagoon, Portugal). Mar. Environ. Res. 2011, 71, 97–110. [Google Scholar] [CrossRef] [PubMed]
  26. Blanchet, H.; De Montaudouin, X.; Chardy, P.; Bachelet, G. Structuring factors and recent changes in subtidal macrozoobenthic communities of a coastal lagoon, Arcachon Bay (France). Estuar. Coast. Shelf Sci. 2005, 64, 561–576. [Google Scholar] [CrossRef]
  27. Borja, A.; Josefson, A.B.; Miles, A.; Muxika, I.; Olsgard, F.; Phillips, G.; Rodríguez, J.G.; Rygg, B. An approach to the intercalibration of benthic ecological status assessment in the North Atlantic ecoregion, according to the European Water Framework Directive. Mar. Pollut. Bull. 2007, 55, 42–52. [Google Scholar] [CrossRef]
  28. Silva, A.C.F.; Tavares, P.; Shapouri, M.; Stigter, T.Y.; Monteiro, J.P.; Machado, M.; Cancela da Fonseca, L.; Ribeiro, L. Estuarine biodiversity as an indicator of groundwater discharge. Estuar. Coast. Shelf Sci. 2012, 97, 38–43. [Google Scholar] [CrossRef]
  29. Hughes, B.D. The influence of factors other than pollution on the value of Shannon’s diversity index for benthic macro-invertebrates in streams. Water Res. 1978, 12, 359–364. [Google Scholar] [CrossRef]
  30. Labrune, C.; Amouroux, J.M.; Sarda, R.; Dutrieux, E.; Thorin, S.; Rosenberg, R.; Grémare, A. Characterization of the ecological quality of the coastal Gulf of Lions (NW Mediterranean). A comparative approach based on three biotic indices. Mar. Pollut. Bull. 2006, 52, 34–47. [Google Scholar] [CrossRef]
  31. Patrício, J.; Neto, J.M.; Teixeira, H.; Salas, F.; Marques, J.C. The robustness of ecological indicators to detect long-term changes in the macrobenthos of estuarine systems. Mar. Environ. Res. 2009, 68, 25–36. [Google Scholar] [CrossRef]
  32. Choi, J.W.; Koh, C.H. Macrobenthos Community in Keum-Mankyung-Dongjin Estuaries and its adjacent Coastal Region, Korea. J. Korean Soc. Oceanogr. 1994, 29, 304–318. [Google Scholar]
  33. Yoon, S.J.; Hong, S.; Kwon, B.O.; Ryu, J.; Lee, C.H.; Nam, J.; Khim, J.S. Distributions of persistent organic contaminants in sediments and their potential impact on macrobenthic faunal community of the Geum River Estuary and Saemangeum Coast, Korea. Chemosphere 2017, 173, 216–226. [Google Scholar] [CrossRef] [PubMed]
  34. Lee, J.-H.; Ryu, J. Short-term Variations in Spatial Distribution of the Macrozoobenthic Community near the Geum River Estuary, Korea. J. Korean Soc. Mar. Environ. Energy 2018, 21, 368–380. [Google Scholar] [CrossRef]
  35. Clarke, K.R.; Gorley, R.N. PRIMER V6: User Manual/Tutorial; PRIMER-E: Plymouth, UK, 2006. [Google Scholar]
  36. Borja, A.; Tunberg, B.G. Assessing benthic health in stressed subtropical estuaries, eastern Florida, USA using AMBI and M-AMBI. Ecol. Indic. 2011, 11, 295–303. [Google Scholar] [CrossRef]
  37. Rouse, G.W.; Fauchald, K. Cladistics and Polychaetes. Zool. Scr. 1997, 26, 139–204. [Google Scholar] [CrossRef]
  38. Macdonald, T.A.; Burd, B.J.; Macdonald, V.I.; Van Roodselaar, A. Taxonomic and Feeding Guild Classification for the Marine Benthic Macroinvertebrates of the Strait of Georgia, British Columbia Canadian Technical Report of Fisheries and Aquatic Sciences 2874. Can. Tech. Rep. Fish. Aquat. Sci. 2010, 2874, 1–69. [Google Scholar]
  39. Hong, J.; Yoo, J. Salinity and sediment types as sources of variability in the distribution of the benthic macrofauna in Han estuary and Kyonggi Bay, Korea. J. Korean Soc. Oceanogr. 1996, 31, 217–231. [Google Scholar]
  40. Ritter, C.; Montagna, P.A.; Applebaum, S. Short-term succession dynamics of macrobenthos in a salinity-stressed estuary. J. Exp. Mar. Bio. Ecol. 2005, 323, 57–69. [Google Scholar] [CrossRef]
  41. Yu, O.H.; Lee, H.G.; Lee, J.H. Influence of Environmental Variables on the Distribution of Macrobenthos in the Han River Estuary, Korea. Ocean Sci. J. 2012, 47, 519–528. [Google Scholar] [CrossRef]
  42. Jin, X.; Zhang, B.; Xue, Y. The response of the diets of four carnivorous fishes to variations in the Yellow Sea ecosystem. Deep. Res. Part II Top. Stud. Oceanogr. 2010, 57, 996–1000. [Google Scholar] [CrossRef]
  43. Zhou, H.; Zhao, J.; Qing, W.; Feng, Y.; Tang, J. Speleothem-derived Asian Summer Monsoon variations in Central China, 54-46ka. J. Quat. Sci. 2011, 26, 781–790. [Google Scholar] [CrossRef]
  44. Kim, J.-C.; Park, K.-W.; Yoo, K.-D.; Jung, S.-Y. Spatial and Temporal Distribution of Macrobenthos in Intertidal Hard Bottoms in Dokdo Island. Korean J. Environ. Ecol. 2015, 29, 221–227. [Google Scholar] [CrossRef]
  45. Gardel, A.; Anthony, E.J.; dos Santos, V.F.; Huybrechts, N.; Lesourd, S.; Sottolichio, A.; Maury, T.; Jolivet, M. Fluvial sand, Amazon mud, and sediment accommodation in the tropical Maroni River estuary: Controls on the transition from estuary to delta and chenier plain. Reg. Stud. Mar. Sci. 2021, 41, 101548. [Google Scholar] [CrossRef]
  46. Kang, S.-K.; Lee, D.-R.; Moon, J.-W.; Choi, S.-J. Effects of Dams and Water Use on Flow Regime Alteration of the Geum River Basin. J. Korea Water Resour. Assoc. 2010, 43, 325–336. [Google Scholar] [CrossRef]
  47. Soares-Gomes, A.; Mendes, C.L.T.; Tavares, M.; Santi, L. Taxonomic sufficiency of polychaete taxocenes for estuary monitoring. Ecol. Indic. 2012, 15, 149–156. [Google Scholar] [CrossRef]
  48. Tavares, A.S.; Santos Sousa, L.K.; Passos Ribeiro, R.; De Oliveira, V.M.; da Silva De Almeida, Z. Structure of a polychaete community in a mangrove in the northern coast of Brazil [Estructura de la comunidad de poliquetos en un manglar de la costa norte de Brasil]. Acta Biol. Colomb. 2018, 23, 286–294. [Google Scholar] [CrossRef]
  49. Aviz, D.; de Carvalho, I.L.R.; Filho, J.S.R. Cambios espaciales y temporales en las comunidades de macroinvertebrados bentónicos en la zona costera del Amazonas (estuario del guajará, Brasil), causada por los vertidos de efluentes urbanos. Sci. Mar. 2012, 76, 381–390. [Google Scholar] [CrossRef]
  50. Wang, W.; Sui, J.; Kou, Q.; Li, X.Z. Review of the genus Loimia Malmgren, 1866 (Annelida, Terebellidae) from China seas with recognition of two new species based on integrative taxonomy. PeerJ 2020, 2020, e9491. [Google Scholar] [CrossRef]
  51. Seitz, R.D.; Schaffner, L.C. Population ecology and secondary production of the polychaete Loimia medusa (Terebellidae). Mar. Biol. 1995, 121, 701–711. [Google Scholar] [CrossRef]
  52. Pagliosa, P.R. Another diet of worms: The applicability of polychaete feeding guilds as a useful conceptual framework and biological variable. Mar. Ecol. 2005, 26, 246–254. [Google Scholar] [CrossRef]
  53. Choi, H.K.; Yoon, S.M. First record of Heteromastus filiformis (Polychaeta: Capitellidae) from Korean waters, with a taxonomic note on the genus. J. Species Res. 2016, 5, 264–271. [Google Scholar] [CrossRef]
  54. Pearson, T.; Rosenberg, H. Macrobenthic succession in relation to organic enrichment and pollution of the marine environment. Oceanogr. Mar. Biol. Annu. Rev. 1978, 16, 229–311. [Google Scholar]
  55. Park, J.; Song, S.J.; Ryu, J.; Kwon, B.O.; Hong, S.; Bae, H.; Choi, J.W.; Khim, J.S. Macrozoobenthos of Korean tidal flats: A review on species assemblages and distribution. Ocean Coast. Manag. 2014, 102, 483–492. [Google Scholar] [CrossRef]
  56. Jayachandran, P.R.; Bijoy Nandan, S.; Jima, M.; Joseph, P.; Don Xavier, N.D.; Sreedevi, O.K.; Prabhakaran, M.P.; Joseph, K.J. Macrobenthic functional feeding groups in a microtidal monsoonal estuary (Kodungallur–Azhikode estuary, India). Reg. Stud. Mar. Sci. 2019, 25, 100444. [Google Scholar] [CrossRef]
Figure 1. Sampling area in the Geum River Estuary, Yellow Sea of Korea.
Diversity 16 00180 g001
Figure 2. Ternary plot of sediment composition at the sampling sites (X: clay, Y: silt, Z: sand).
Diversity 16 00180 g002
Figure 3. Vertical distributions of water temperature (°C), salinity (psu), and dissolved oxygen (mg/L) at the sampling sites.
Diversity 16 00180 g003
Figure 4. Density (individuals/m2) of polychaete dominant species at the sampling sites (Heteromastus filiformis, Ampharete cf. finmarchica, Loimia sp., Pseudopotamilla sp., Sigambra tentaculata).
Diversity 16 00180 g004
Figure 5. Cluster analysis and multidimensional scaling analysis (MDS) of the fourth-root transformed polychaetes species densities at the sampling sites.
Diversity 16 00180 g005
Figure 6. K-dominance curves of the polychaete densities in pre- and post-rainy seasons at the sampling sites.
Diversity 16 00180 g006
Figure 7. Canonical correspondence analysis (CCA) between the nine most abundant polychaete species and seven environmental variables at the sampling sites.
Diversity 16 00180 g007
Table 1. Polychaete feeding guild according to major mode, motility pattern, and morphological structure.
Major ModeMotility PatternMorphological Structure
Motile (M)Sessile (S)Discretely Motile (D)
Carnivores (C)Unarmed pharynx (X)CMX
Jawed pharynx (J)CMJ CDJ
Herbivores (H)Unarmed pharynx (X)HMX
Jawed pharynx (J)HMJ HDJ
Filter feeders (F)Tentaculate (T) FSTFDT
Pumping (P) FSPFDP
Surface deposit feeders (S)Unarmed pharynx (X)SMX SDX
Jawed pharynx (J)SMJ SDJ
Tentaculate (T)SMT SDT
Burrowers (B)Unarmed pharynx (X)BMXBSXBDX
(Subsurface deposit feeders)Jawed pharynx (J)BMJ
Tentaculate (T)BMT
Table 2. Sediment composition and heavy metal concentration information at the sampling sites (Mz; mean grain size).
MonthSiteMz (µm)Clay (%)Silt
(%)
Sand (%)As (ppm)Cr (ppm)Cu (ppm)Pb (ppm)Zn (ppm)
JuneK119.45.083.511.511.170.322.529.6102.5
JuneK221.84.777.218.19.166.719.127.490.4
JuneK335.83.455.641.09.843.510.025.852.2
JuneK4149.41.017.781.36.534.93.721.632.4
JuneK5132.01.629.269.16.830.25.221.938.1
JuneK6185.90.410.988.77.324.23.221.633.8
JuneK7163.01.020.678.45.221.03.920.226.9
JuneK8278.20.16.293.75.012.32.221.117.6
JulyK140.13.055.341.711.542.911.729.763.0
JulyK217.05.587.96.611.871.026.632.9116.9
JulyK336.43.357.938.87.446.19.520.651.7
JulyK4133.61.424.773.95.733.84.820.732.9
JulyK5140.91.324.873.97.131.24.821.934.9
JulyK6186.20.38.990.97.424.03.022.231.9
JulyK7178.61.017.182.06.222.43.621.031.3
JulyK8320.00.00.0100.04.18.81.721.611.9
SeptemberK123.14.469.825.713.276.531.136.6131.1
SeptemberK218.35.683.810.610.468.823.931.7106.7
SeptemberK316.85.389.55.210.972.422.731.4104.1
SeptemberK4137.71.219.679.14.830.54.321.030.9
SeptemberK5111.92.236.161.76.431.55.821.739.6
SeptemberK6160.20.916.782.46.725.03.522.132.4
SeptemberK7240.30.17.892.15.117.72.519.320.2
SeptemberK8185.91.322.876.05.218.33.419.623.8
Table 3. Environmental variables measured pre-, mid-, and post-rainy season at the sampling sites.
Environmental VariablesPre-Rainy SeasonMid-Rainy SeasonPost-Rainy Season
Surface water temperature (°C)20.26 ± 1.6120.67 ± 0.3023.15 ± 0.75
Bottom water temperature (°C)18.40 ± 2.5519.06 ± 2.4220.89 ± 1.88
Surface salinity (psu)30.38 ± 1.2018.93 ± 8.7225.03 ± 5.25
Bottom salinity (psu)31.19 ± 0.5831.00 ± 0.8030.25 ± 1.20
Surface dissolved oxygen (mg/L)5.50 ± 0.465.63 ± 0.295.17 ± 0.10
Bottom dissolved oxygen (mg/L)5.74 ± 0.605.40 ± 0.245.23 ± 0.15
Sand content (%)60.22 ± 30.2063.47 ± 29.5054.11 ± 32.58
Silt content (%)37.62 ± 28.4034.56 ± 27.7843.28 ± 30.56
Clay content (%)2.16 ± 1.801.97 ± 1.732.61 ± 2.02
Table 4. Macrobenthos taxon density and number of species in pre-, mid-, and post-rainy seasons at the sampling sites.
TaxonPre-Rainy SeasonMid-Rainy SeasonPost-Rainy Season
DensityPolychaete1443.13 ± 1472.961169.50 ± 822.62998.86 ± 985.87
Mollusca1258.75 ± 2011.05798.32 ± 212.64569.49 ± 1236.92
Crustacea725.63 ± 1024.36593.61 ± 401.85545.19 ± 654.95
Echinodermata21.25 ± 44.9150.62 ± 136.53104.76 ± 264.66
Others66.25 ± 56.1048.77 ± 17.3147.64 ± 45.49
Total3515.00 ± 3547.422601.80 ± 1207.832212.22 ± 2279.40
SpeciesPolychaete23.63 ± 4.5620.01 ± 8.2520.09 ± 8.51
Mollusca8.00 ± 4.696.48 ± 2.876.18 ± 4.01
Crustacea11.38 ± 4.959.41 ± 7.0510.35 ± 7.35
Echinodermata1.13 ± 0.781.22 ± 1.651.31 ± 1.22
Others3.00 ± 2.002.61 ± 0.662.47 ± 1.46
Total47.13 ± 14.1139.57 ± 19.4240.26 ± 19.80
Table 5. List of polychaete families, feeding type, number of species, and average density at the sampling sites.
NoFamilyFeeding TypeNumber of SpeciesAverage Density (m2)
1AmpharetidaeSurface deposit feeder4132
2CapitellidaeSubsurface deposit feeder4215
3ChaetopteridaeFilter feeder28
4ChrysopetalidaeCarnivores10.2
5CirratulidaeSurface deposit feeder465
6DorvilleidaeHerbivores26
7EunicidaeCarnivores31
8FlabelligeridaeFilter feeder24
9GlyceridaeCarnivores629
10HesionidaeCarnivores48
11LacydoniidaeCarnivores114
12LumbrineridaeSubsurface deposit feeder26
13MagelonidaeSurface deposit feeder212
14MaldanidaeSubsurface deposit feeder11
15NephtyidaeCarnivores330
16NereididaeSubsurface deposit feeder11
17OenonidaeCarnivores12
18OnuphidaeSubsurface deposit feeder27
19OpheliidaeSubsurface deposit feeder10.4
20OrbiniidaeSubsurface deposit feeder16
21OweniidaeFilter feeder37
22ParaonidaeSurface deposit feeder322
23PectinariidaeFilter feeder11
24PhyllodocidaeCarnivores615
25PilargidaeCarnivores243
26PoecilochaetidaeSurface deposit feeder18
27PolynoidaeCarnivores317
28SabellidaeFilter feeder576
29SigalionidaeCarnivores33
30SpionidaeFilter feeder1686
31SternaspidaeSubsurface deposit feeder114
32SyllidaeCarnivores21
33TerebellidaeSurface deposit feeder3125
34TrichobranchidaeSurface deposit feeder10.4
Table 6. Information about polychaete dominant species in pre-, mid-, and post-rainy seasons at the sampling sites (*—species present, BDX; burrowers–discretely motile–unarmed pharynx, BMJ; burrowers–motile–jawed pharynx, CMJ; carnivores–motile–jawed pharynx, FST; filter feeders–sessile–tentaculate, FDT; filter feeders–discretely motile–tentaculate, SMX; surface deposit feeders–motile–unarmed pharynx, SST; surface deposit feeders–sessile–tentaculate, SMT; surface deposit feeders–motile–tentaculate, SDT; surface deposit feeders–discretely motile–tentaculate).
SpeciesFamilyDensity
(ind./m2)
Frequency
(%)
Pre-Rainy SeasonMid-Rainy SeasonPost-Rainy SeasonFeeding Guilds
Heteromastus filiformisCapitellidae21079***BDX, SMX
Ampharete cf. finmarchicaAmpharetidae12850***SST
Loimia sp.Terebellidae1234* SST
Pseudopotamilla sp.Sabellidae568* FST
Sigambra tentaculataPilargidae4263***CMJ
Chaetozone setosaCirratulidae3688***SMT, SDT
Spiophanes bombyxSpionidae3129***FDT, SDT
Nephtys polybranchiaNephtyidae2679***BMJ
Cirratulus cirratusCirratulidae254* SMT, SDT
Table 7. Ecological indices at the sampling sites (N; density, S; number of species, H′; Shannon–Wiener diversity index, ES(100); Hurlbert’s rarefaction index, AMBI; AZTI Marine Biodiversity Index, M-AMBI; Multivariate AMBI).
MonthSiteNSES(100)H’AMBIM-AMBIStatus
JuneK15140299.41.3390.6590.757Good
JuneK29902515.91.973.7050.593Good
JuneK39201611.31.4224.0680.428Moderate
JuneK414752816.11.8040.8670.787High
JuneK53752421.22.7771.8450.797High
JuneK617352815.11.4384.0470.526Moderate
JuneK733021192.4942.3910.689Good
JuneK85801813.61.7162.5330.552Good
JulyK170771.6733.5000.414Moderate
JulyK23701311.51.4744.0140.411Moderate
JulyK37701612.82.1713.1880.570Good
JulyK4249534151.6251.2700.794High
JulyK540518162.1453.2410.581Good
JulyK618802512.51.2123.9570.481Moderate
JulyK73452119.22.672.6420.693Good
JulyK825598.81.4692.7940.455Moderate
SeptemberK1610107.41.2274.3030.338Poor
SeptemberK2155771.4863.9680.362Poor
SeptemberK34201613.91.7973.8210.486Moderate
SeptemberK414153421.22.5041.5700.873High
SeptemberK54952218.42.5162.4490.710Good
SeptemberK68052620.62.7822.3490.769Good
SeptemberK75353628.63.0622.5050.879High
SeptemberK84902320.12.7673.0820.675Good
Table 8. Spearman rank correlation analysis between environmental factors and polychaete dominant species at the sampling sites (*, p-value < 0.05; ***, p < 0.001; the smaller the p-value, the higher the correlation).
Clay (%)Silt (%)Sand (%)Temperature (°C)Salinity (psu)Dissolved Oxygen (mg/L)Heteromatus filiformisLoimia sp.Pseudopotamilla sp.Sigambra tentaculataChaetozone setosaSpiophanes bombyx
Mean grain size (phi)−0.97 ***−0.97 ***0.97 ***−0.83 ***0.85 ***0.76 ***−0.32−0.26−0.14−0.400.44 *0.73 ***
Clay (%) 0.99 ***−0.99 ***0.78 ***−0.80 ***−0.72 ***0.260.260.100.42 *−0.44 *0.66 ***
Silt (%) −1 ***0.76 ***−0.79 ***−0.71 ***0.260.260.100.44 *−0.45 *−0.65 ***
Sand (%) −0.76 ***0.79 ***0.71 ***−0.26 ***−0.26−0.10−0.44 *0.45 *0.65 ***
Temp (°C) −0.97 ***−0.93 ***0.370.170.110.20−0.26−0.80 ***
Sal (psu) 0.89 ***−0.42 *−0.17−0.14−0.290.340.80 ***
DO (mg/L) −0.37−0.35−0.17−0.130.140.76 ***
Heteromastus filiformis −0.29−0.260.67 ***−0.08−0.49 *
Loimia sp. 0.72 ***−0.23−0.09−0.13
Pseudopotamilla sp. −0.21−0.21−0.19
Sigambra tentaculata −0.30−0.41 *
Chaetozone setosa 0.21
Disclaimer/Publisher’s Note: The statements, opinions and data contained in all publications are solely those of the individual author(s) and contributor(s) and not of MDPI and/or the editor(s). MDPI and/or the editor(s) disclaim responsibility for any injury to people or property resulting from any ideas, methods, instructions or products referred to in the content.

