
Ground Cover Vegetation in Differently Managed Hemiboreal Norway Spruce Stands: Plantation vs. Natural Regeneration

 , ,
, , 
Abstract
:1. Introduction
2. Materials and Methods
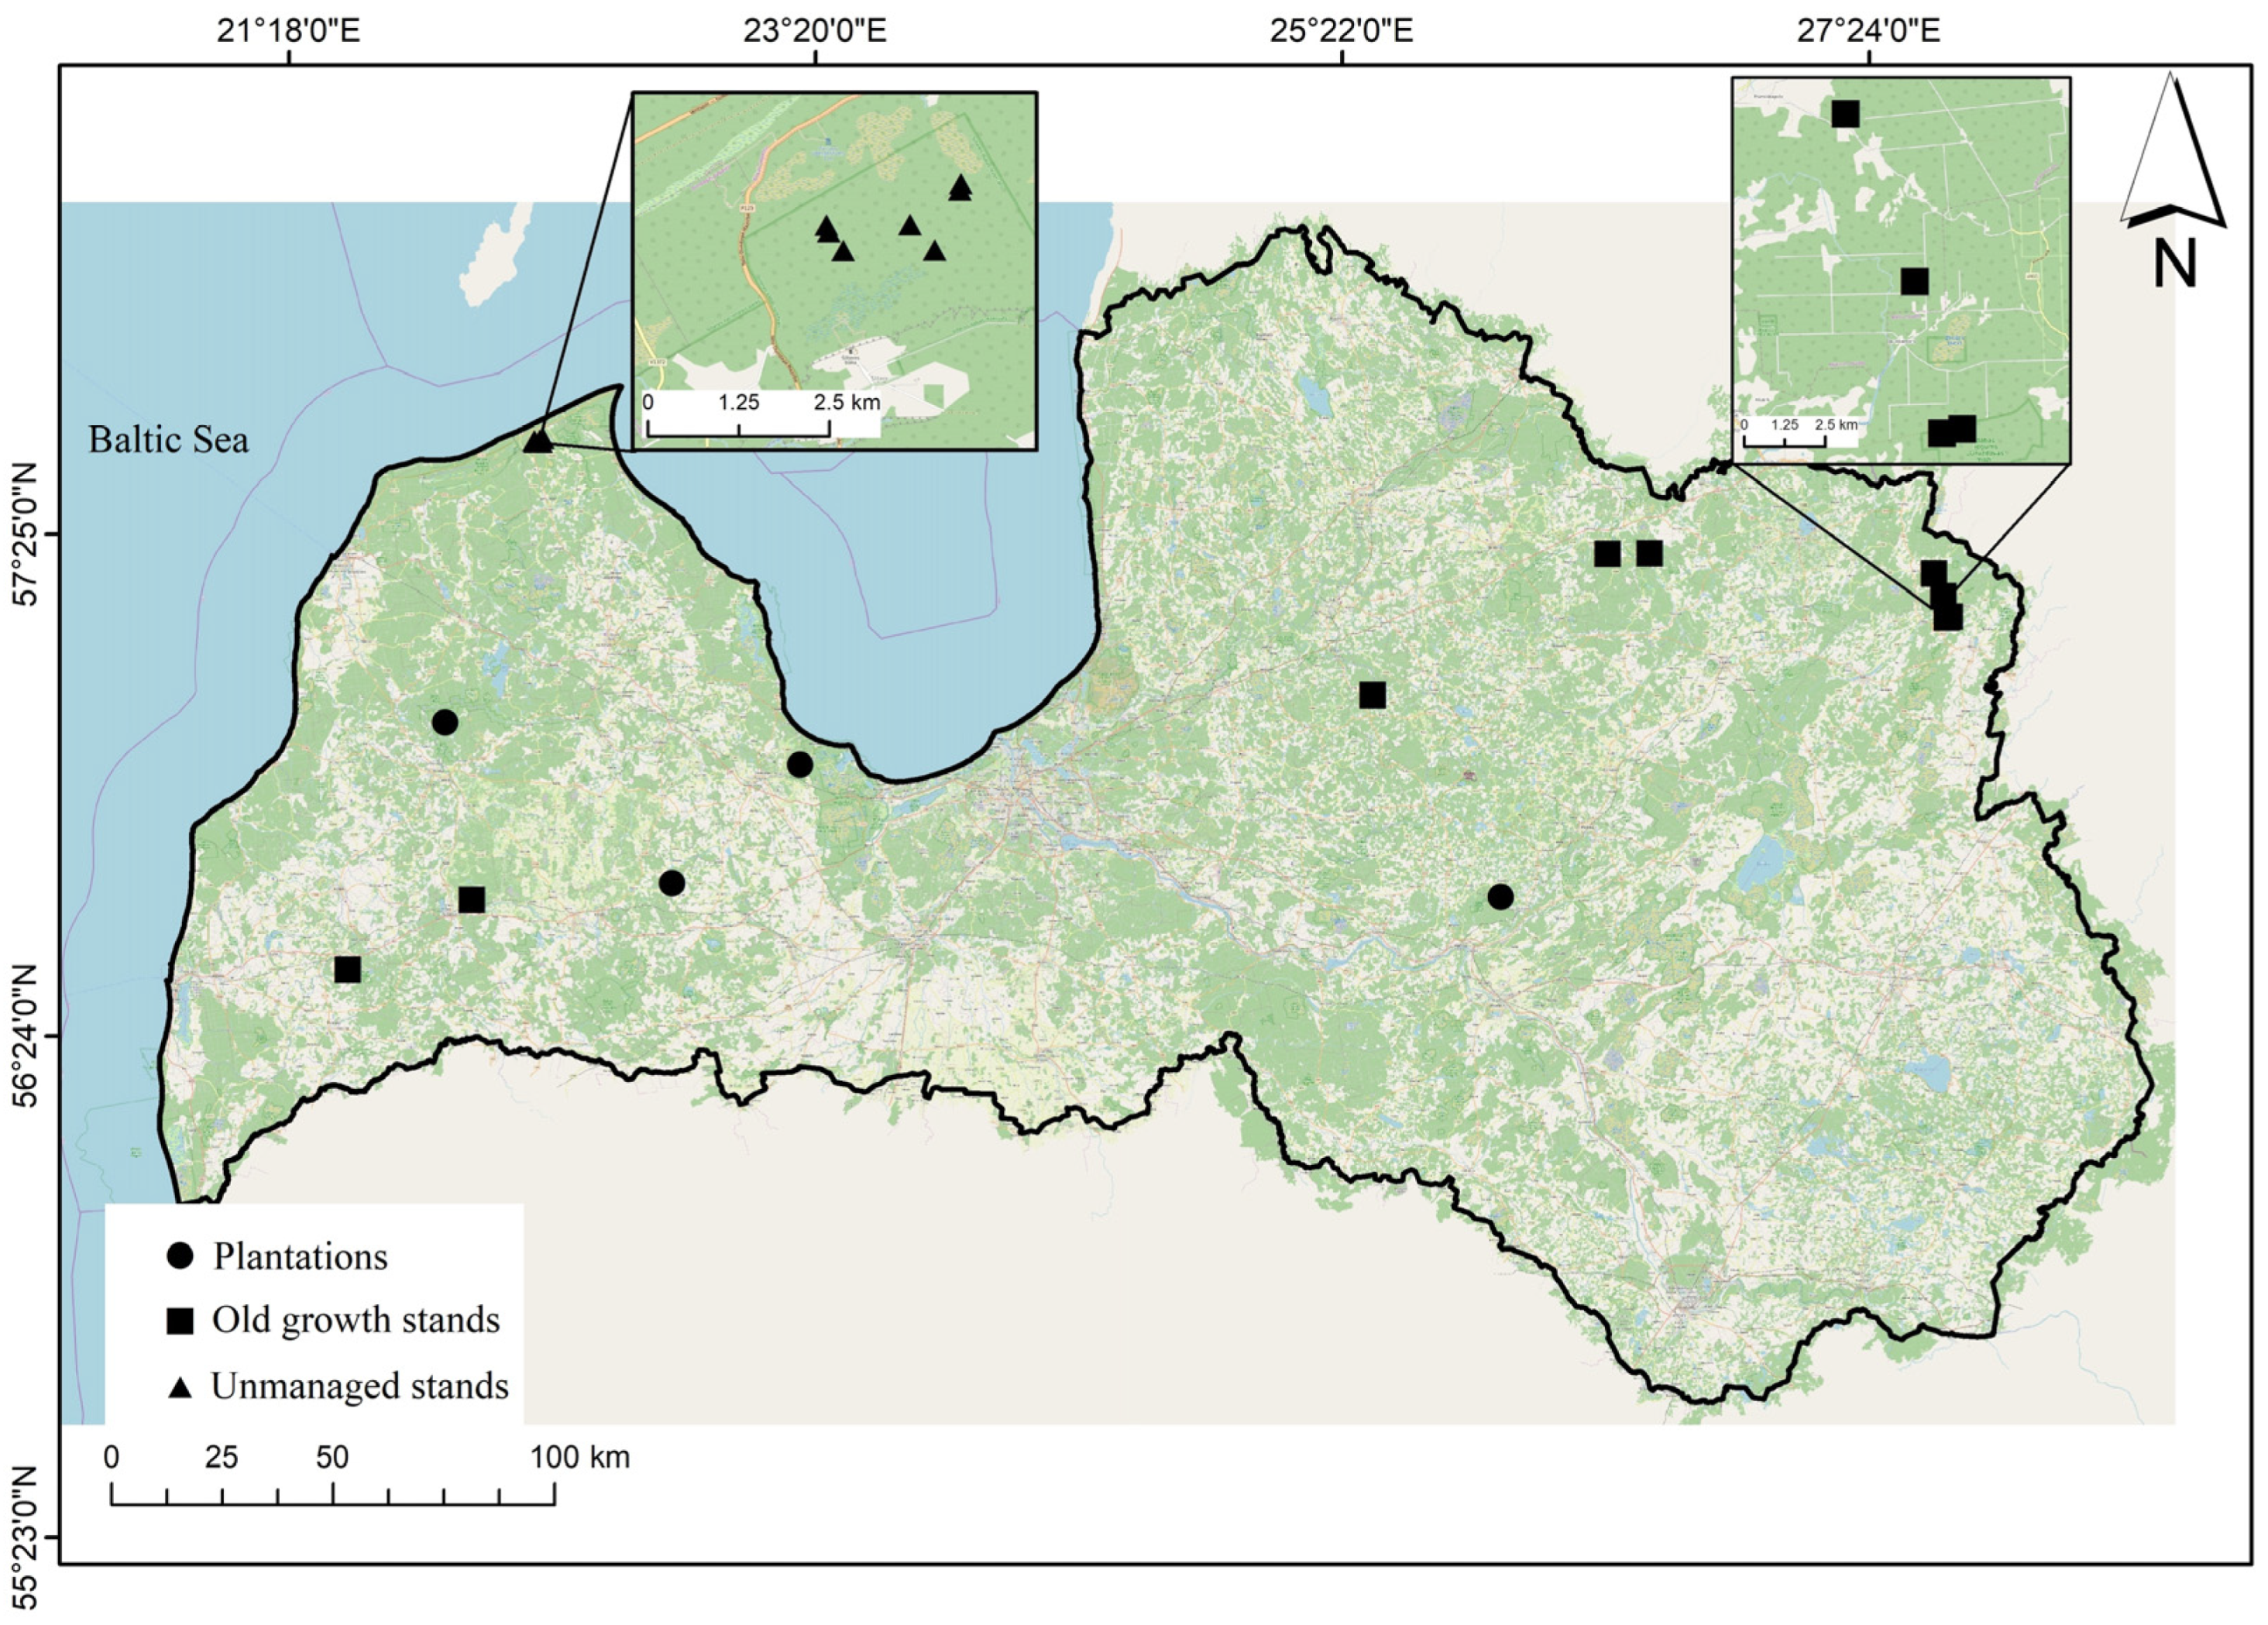
2.1. Study Area and Stand Selection
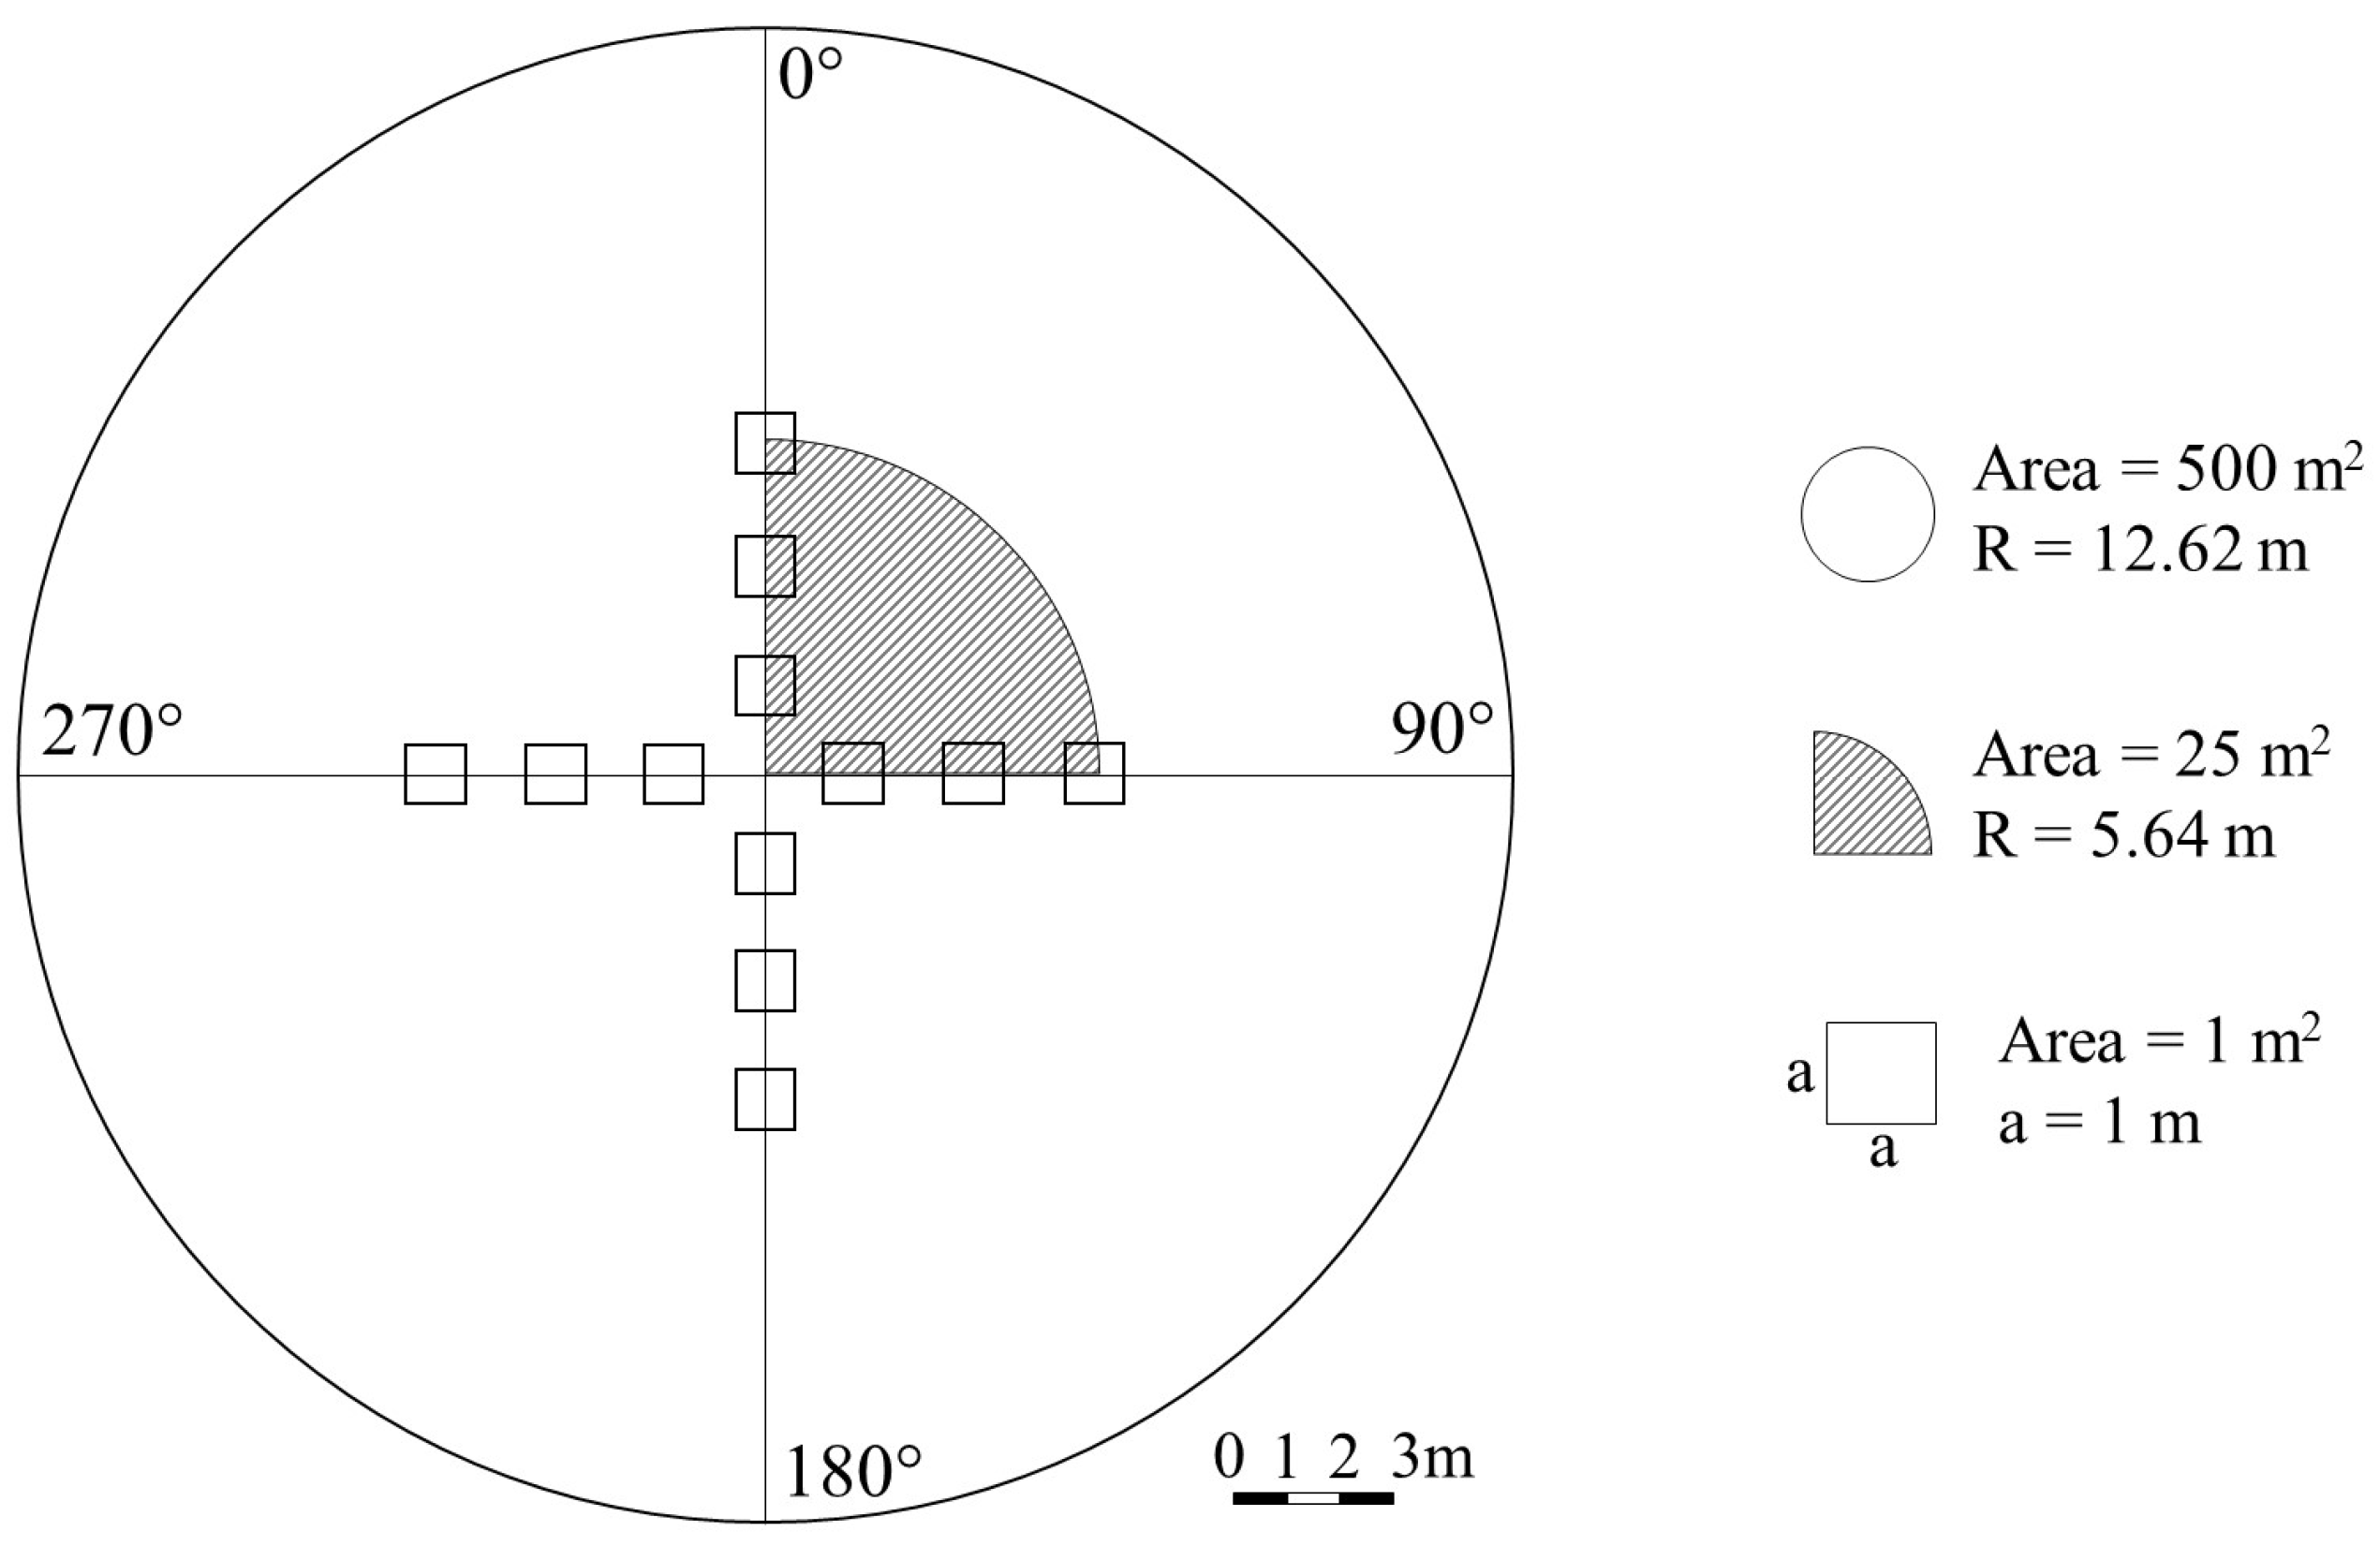
2.2. Measurements
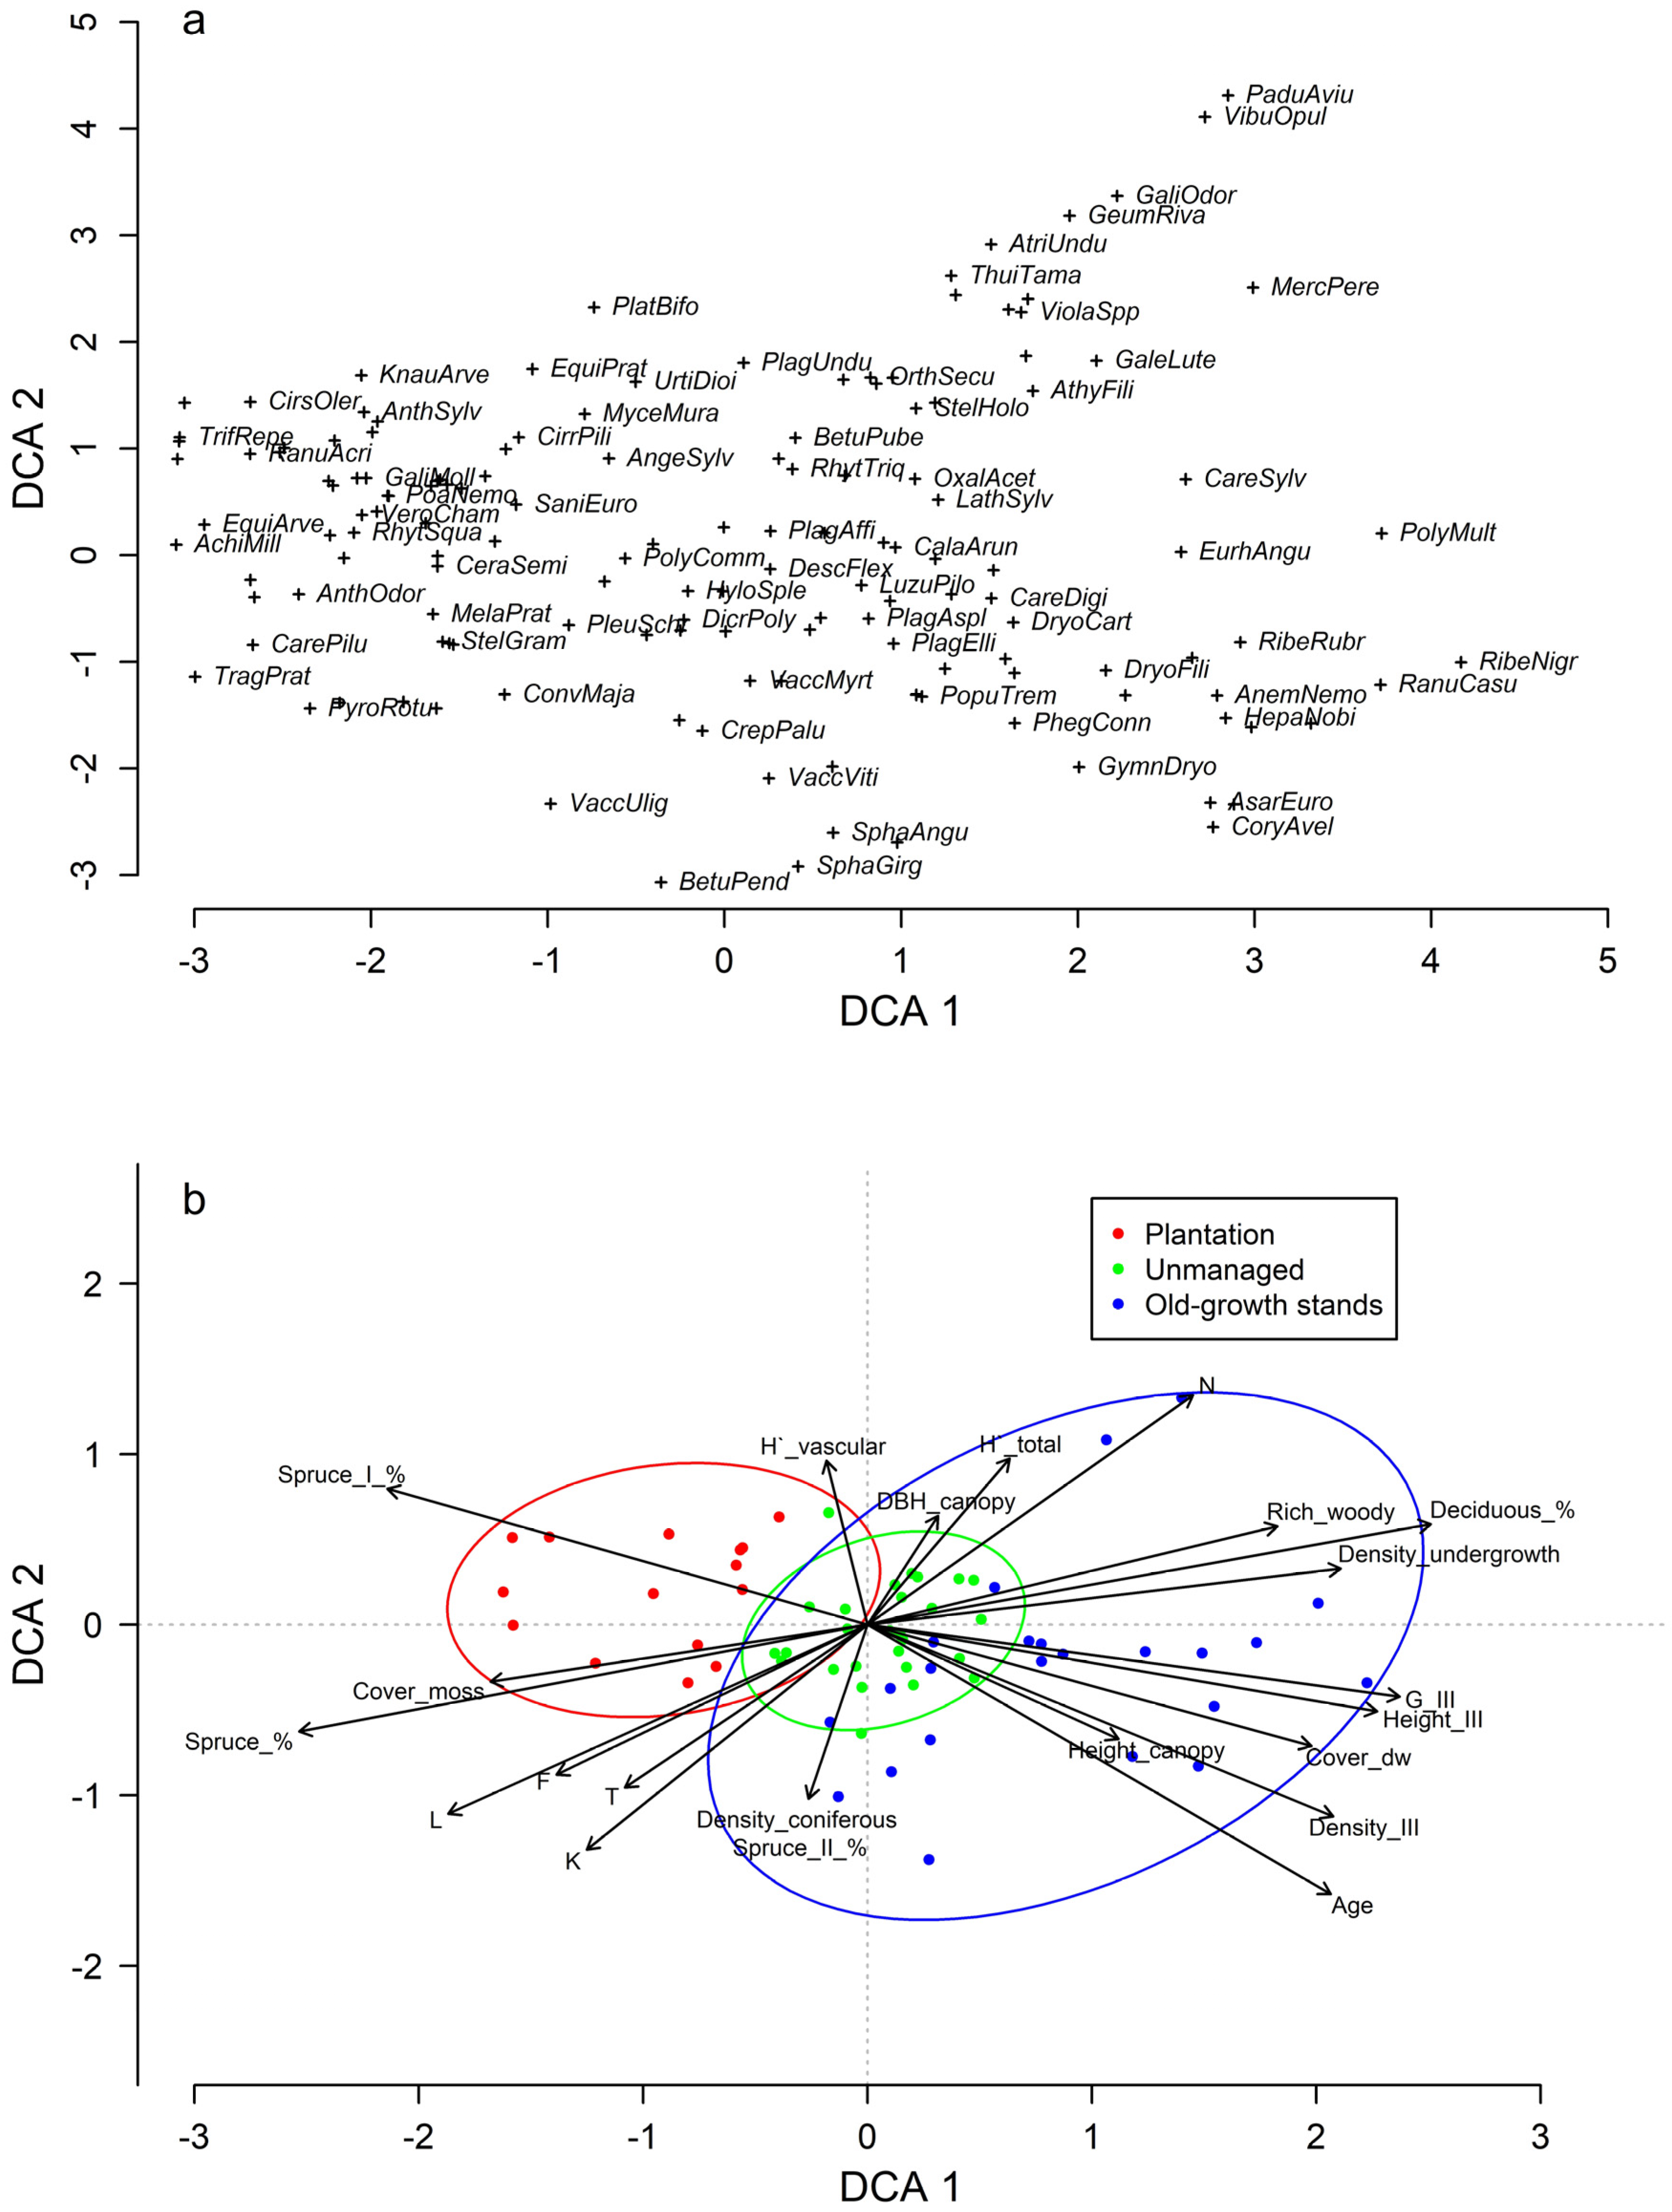
2.3. Data Analysis
3. Results
4. Discussion
5. Conclusions
Author Contributions
Funding
Institutional Review Board Statement
Data Availability Statement
Conflicts of Interest
References
- Carle, J.; Vuorinen, P.; Del Lungo, A. Status and trends in global forest plantation development. For. Prod. J. 2002, 52, 12–23. [Google Scholar]
- Heilmayr, R. Conservation through intensification? The effects of plantations on natural forests. Ecol. Econ. 2014, 105, 204–210. [Google Scholar] [CrossRef]
- Routa, J.; Kilpeläinen, A.; Ikonen, V.P.; Asikainen, A.; Venäläinen, A.; Peltola, H. Effects of intensified silviculture on timber production and its economic profitability in boreal Norway spruce and Scots pine stands under changing climatic conditions. Int. J. For. Res. 2019, 92, 648–658. [Google Scholar] [CrossRef]
- Temperli, C.; Stadelmann, G.; Thürig, E.; Brang, P. Silvicultural strategies for increased timber harvesting in a Central European mountain landscape. Eur. J. For. Res. 2017, 136, 493–509. [Google Scholar] [CrossRef]
- Freer-Smith, P.; Muys, B.; Bozzano, M.; Drössler, L.; Farrelly, N.; Jactel, H.; Korhonen, J.; Minotta, G.; Nijnik, M.; Orazio, C. Plantation Forests in Europe: Challenges and Opportunities; European Forest Institute: Joensu, Finland, 2019; Volume 9, pp. 1–52. [Google Scholar]
- Albert, M.; Nagel, R.V.; Nuske, R.; Sutmöller, J.; Spellmann, H. Tree species selection in the face of drought risk—Uncertainty in forest planning. Forests 2017, 8, 363. [Google Scholar] [CrossRef]
- Jactel, H.; Petit, J.; Desprez-Loustau, M.L.; Delzon, S.; Piou, D.; Battisti, A.; Koricheva, J. Drought effects on damage by forest insects and pathogens: A meta-analysis. Glob. Chang. Biol. 2012, 18, 267–276. [Google Scholar] [CrossRef]
- Krisans, O.; Saleniece, R.; Rust, S.; Elferts, D.; Kapostins, R.; Jansons, A.; Matisons, R. Effect of bark-stripping on mechanical stability of Norway spruce. Forests 2020, 11, 357. [Google Scholar] [CrossRef]
- Seidl, R.; Thom, D.; Kautz, M.; Martin-Benito, D.; Peltoniemi, M.; Vacchiano, G.; Wild, J.; Ascoli, D.; Petr, M.; Honkaniemi, J.; et al. Forest disturbances under climate change. Nat. Clim. Chang. 2017, 7, 395–402. [Google Scholar] [CrossRef] [PubMed]
- Hanewinkel, M.; Cullmann, D.A.; Schelhaas, M.J.; Nabuurs, G.J.; Zimmermann, N.E. Climate change may cause severe loss in the economic value of European forest land. Nat. Clim. Chang. 2013, 3, 203–207. [Google Scholar] [CrossRef]
- Fayet, C.M.; Reilly, K.H.; Van Ham, C.; Verburg, P.H. The potential of European abandoned agricultural lands to contribute to the Green Deal objectives: Policy perspectives. Environ. Sci. Policy 2022, 133, 44–53. [Google Scholar] [CrossRef]
- Strengers, B.J.; Minnen, J.G.; Eickhout, B. The Role of Carbon Plantations in Mitigating Climate Change: Potentials and Costs. Clim. Chang. 2007, 88, 343–366. [Google Scholar] [CrossRef]
- Barlow, J.; Gardner, T.A.; Araujo, I.S.; Ávila-Pires, T.C.; Bonaldo, A.B.; Costa, J.E.; Esposito, M.C.; Ferreira, L.V.; Hawes, J.; Hernandez, M.I.M.; et al. Quantifying the Biodiversity Value of Tropical Primary, Secondary, and Plantation Forests. Proc. Natl. Acad. Sci. USA 2007, 104, 18555–18560. [Google Scholar] [CrossRef] [PubMed]
- Stephens, S.S.; Wagner, M.R. Forest Plantations and Biodiversity: A Fresh Perspective. J. For. 2007, 105, 307–313. [Google Scholar] [CrossRef]
- Burrascano, S.; Keeton, W.S.; Sabatini, F.M.; Blasi, C. Commonality and variability in the structural attributes of moist temperate old-growth forests: A global review. For. Ecol. Manag. 2013, 291, 458–479. [Google Scholar] [CrossRef]
- Roberge, J.-M.; Laudon, H.; Björkman, C.; Ranius, T.; Sandström, C.; Felton, A.; Sténs, A.; Nordin, A.; Granström, A.; Widemo, F.; et al. Socio-ecological implications of modifying rotation lengths in forestry. Ambio 2016, 45, 109–123. [Google Scholar] [CrossRef] [PubMed]
- Zimová, S.; Dobor, L.; Hlásny, T.; Rammer, W.; Seidl, R. Reducing rotation age to address increasing disturbances in Central Europe: Potential and limitations. For. Ecol. Manag. 2020, 475, 118408. [Google Scholar] [CrossRef] [PubMed]
- Ferris, R.; Peace, A.J.; Humphrey, J.W.; Broome, A.C. Relationships between vegetation, site type and stand structure in coniferous plantations in Britain. For. Ecol. Manag. 2000, 136, 35–51. [Google Scholar] [CrossRef]
- Oettel, J.; Lapin, K. Linking forest management and biodiversity indicators to strengthen sustainable forest management in Europe. Ecol. Indic. 2021, 122, 107275. [Google Scholar] [CrossRef]
- Barbier, S.; Gosselin, F.; Balandier, P. Influence of tree species on understory vegetation diversity and mechanisms involved: A critical review for temperate and boreal forests. For. Ecol. Manag. 2008, 254, 1–15. [Google Scholar] [CrossRef]
- Coote, L.; Dietzsch, A.C.; Wilson, M.W.; Graham, C.T.; Fuller, L.; Walsh, A.T.; Irwin, S.; Kelly, D.L.; Mitchell, F.J.G.; Kelly, T.C.; et al. Testing indicators of biodiversity for plantation forests. Ecol. Indic. 2013, 32, 107–115. [Google Scholar] [CrossRef]
- Lassauce, A.; Paillet, Y.; Jactel, H.; Bouget, C. Deadwood as a surrogate for forest biodiversity: Meta-analysis of correlations between deadwood volume and species richness of saproxylic organisms. Ecol. Indic. 2011, 11, 1027–1039. [Google Scholar] [CrossRef]
- Parisi, F.; Lombardi, F.; Sciarretta, A.; Tognetti, R.; Campanaro, A.; Marchetti, M.; Trematerra, P. Spatial patterns of saproxylic beetles in a relic silver fir forest (Central Italy), relationships with forest structure and biodiversity indicators. For. Ecol. Manag. 2016, 381, 217–234. [Google Scholar] [CrossRef]
- Larrieu, L.; Paillet, Y.; Winter, S.; Bütler, R.; Kraus, D.; Krumm, F.; Latchat, T.; Michel, A.K.; Regnery, B.; Vandekerkhove, K. Tree related microhabitats in temperate and Mediterranean European forests: A hierarchical typology for inventory standardization. Ecol. Indic. 2018, 84, 194–207. [Google Scholar] [CrossRef]
- Sever, K.; Nagel, T.A. Patterns of tree microhabitats across a gradient of managed to old-growth conditions: A case study from beech dominated forests of South-Eastern Slovenia. Acta Silvae Ligni 2019, 118, 29–40. [Google Scholar] [CrossRef]
- Bauhus, J.; Puettmann, K.; Messier, C. Silviculture for old-growth attributes. For. Ecol. Manag. 2009, 258, 525–537. [Google Scholar] [CrossRef]
- Commarmot, B.; Bachofen, H.; Bundziak, Y.; Bürgi, A.; Ramp, B.; Shparyk, Y.; Sukhariuk, D.; Viter, R.; Zingg, A. Structures of virgin and managed beech forests in Uholka (Ukraine) and Sihlwald (Switzerland): A comparative study. For. Snow Landsc. Res. 2005, 79, 45–56. [Google Scholar]
- Humphrey, J.W.; Davey, S.; Peace, A.J.; Ferris, R.; Harding, K. Lichens and bryophyte communities of planted and semi-natural forests in Britain: The influence of site type, stand structure and deadwood. Biol. Conserv. 2002, 107, 165–180. [Google Scholar] [CrossRef]
- Paillet, Y.; Bergès, L.; Hjältén, J.; Ódor, P.; Avon, C.; Bernhardt-Römermann, M.; Bijlsma, R.; De Bruyn, L.; Fuhr, M.; Grandin, U.; et al. Biodiversity differences between managed and unmanaged forests: Meta-analysis of species richness in Europe. Conserv. Biol. 2010, 24, 101–112. [Google Scholar] [CrossRef] [PubMed]
- Crites, S.; Dale, M.R. Diversity and abundance of bryophytes, lichens, and fungi in relation to woody substrate and successional stage in aspen mixedwood boreal forests. Can. J. Bot. 1998, 76, 641–651. [Google Scholar] [CrossRef]
- Viljur, M.L.; Abella, S.R.; Adámek, M.; Alencar, J.B.R.; Barber, N.A.; Beudert, B.; Burkle, L.A.; Cagnolo, L.; Campos, B.R.; Chao, A.; et al. The effect of natural disturbances on forest biodiversity: An ecological synthesis. Biol. Rev. 2022, 97, 1930–1947. [Google Scholar] [CrossRef]
- Elofsson, M.; Gustafsson, L. Uncommon vascular plant species in an East-Central Swedish forest area—A comparison between young and old stands. Nord. J. Bot. 2000, 20, 51–60. [Google Scholar] [CrossRef]
- Chernenkova, T.; Kotlov, I.; Belyaeva, N.; Suslova, E.; Morozova, O.; Pesterova, O.; Arkhipova, M. Role of silviculture in the formation of Norway spruce forests along the southern edge of their range in the Central Russian Plain. Forests 2020, 11, 778. [Google Scholar] [CrossRef]
- Mayor, S.J.; Cahill, J.F., Jr.; He, F.; Sólymos, P.; Boutin, S. Regional boreal biodiversity peaks at intermediate human disturbance. Nat. Commun. 2012, 3, 1142. [Google Scholar] [CrossRef] [PubMed]
- Felton, A.; Knight, E.; Wood, J.; Zammit, C.; Lindenmayer, D. A meta-analysis of fauna and flora species richness and abundance in plantations and pasture lands. Biol. Conserv. 2010, 143, 545–554. [Google Scholar] [CrossRef]
- Felton, A.M.; Wam, H.K.; Stolter, C.; Mathisen, K.M.; Wallgren, M. The complexity of interacting nutritional drivers behind food selection, a review of northern cervids. Ecosphere 2018, 9, e02230. [Google Scholar] [CrossRef]
- Hart, S.A.; Chen, H.Y.H. Understory vegetation dynamics of North American boreal forests. Crit. Rev. Plant Sci. 2006, 25, 381–397. [Google Scholar] [CrossRef]
- Chavez, V.; Macdonald, S.E. Partitioning vascular understory diversity in mixedwood boreal forests: The importance of mixed canopies for diversity conservation. For. Ecol. Manag. 2012, 271, 19–26. [Google Scholar] [CrossRef]
- Nilsson, M.C.; Wardle, D.A. Understory vegetation as a forest ecosystem driver: Evidence from the northern Swedish boreal forest. Front. Ecol. Environ. 2005, 3, 421–428. [Google Scholar] [CrossRef]
- O’Brien, M.J.; O’Hara, K.L.; Erbilgin, N.; Wood, D.L. Overstory and shrub effects on natural regeneration processes in native Pinus radiata stands. For. Ecol. Manag. 2007, 240, 178–185. [Google Scholar] [CrossRef]
- Kuuluvainen, T.; Angelstam, P.; Frelich, L.; Jõgiste, K.; Koivula, M.; Kubota, Y.; Lafleur, B.; Macdonald, E. Natural disturbance-based forest management: Moving beyond retention and continuous-cover forestry. Front. For. Glob. Chang. 2021, 4, 629020. [Google Scholar] [CrossRef]
- Kutnar, L.; Nagel, T.A.; Kermavnar, J. Effects of disturbance on understory vegetation across Slovenian forest ecosystems. Forests 2019, 10, 1048. [Google Scholar] [CrossRef]
- Mausolf, K.; Härdtle, W.; Jansen, K.; Delory, B.M.; Hertel, D.; Leuschner, C.; Temperton, V.M.; von Oheimb, G.; Fichtner, A. Legacy effects of land-use modulate tree growth responses to climate extremes. Oecologia 2018, 187, 825–837. [Google Scholar] [CrossRef]
- Biber, P.; Borges, J.G.; Moshammer, R.; Barreiro, S.; Botequim, B.; Brodrechtová, Y.; Brukas, V.; Chirici, G.; Cordero-Debets, R.; Corrigan, E.; et al. How sensitive are ecosystem services in European forest landscapes to silvicultural treatment? Forests 2015, 6, 1666–1695. [Google Scholar] [CrossRef]
- Brockerhoff, E.G.; Jactel, H.; Parrotta, J.A.; Quine, C.P.; Sayer, J. Plantation forests and biodiversity: Oxymoron or opportunity? Biodivers. Conserv. 2008, 17, 925–951. [Google Scholar] [CrossRef]
- Castelli, J.P.; Casper, B.B.; Sullivan, J.J.; Latham, R.E. Early understory succession following catastrophic wind damage in a deciduous forest. Can. J. For. Res. 1999, 29, 1997–2002. [Google Scholar] [CrossRef]
- Lain, E.J.; Haney, A.; Burris, J.M.; Burton, J. Response of vegetation and birds to severe wind disturbance and salvage logging in a southern boreal forest. For. Ecol. Manag. 2008, 256, 863–871. [Google Scholar] [CrossRef]
- Alvey, A.A. Promoting and preserving biodiversity in the urban forest. Urban For. Urban Green. 2006, 5, 195–201. [Google Scholar] [CrossRef]
- Pesola, L.; Cheng, X.; Sanesi, G.; Colangelo, G.; Elia, M.; Lafortezza, R. Linking above-ground biomass and biodiversity to stand development in urban forest areas: A case study in Northern Italy. Landsc. Urban Plan. 2017, 157, 90–97. [Google Scholar] [CrossRef]
- Jaeger, J.A.; Soukup, T.; Schwick, C.; Madriñán, L.F.; Kienast, F. Landscape fragmentation in Europe. In European Landscape Dynamics, 1st ed.; Feranec, J., Soukup, T., Hazeu, G., Jaffrain, G., Eds.; CRC Press: Boca Raton, FL, USA, 2016; pp. 157–198. [Google Scholar]
- Ahti, T.; Hämet-Ahti, L.; Jalas, J. Vegetation zones and their sections in northwestern Europe. Ann. Bot. Fenn. 1968, 5, 169–211. [Google Scholar]
- Petrokas, R.; Baliuckas, V.; Manton, M. Successional categorization of European hemi-boreal forest tree species. Plants 2020, 9, 1381. [Google Scholar] [CrossRef]
- Kottek, M.; Grieser, J.; Beck, C.; Rudolf, B.; Rubel, F. World map of the Köppen-Geiger climate classification updated. Meteorol. Z. 2006, 15, 259–263. [Google Scholar] [CrossRef]
- Avotniece, Z.; Rodinov, V.; Lizuma, L.; Briede, A.; Kļaviņš, M. Trends in frequency of extreme climate events in Latvia. Baltica 2010, 23, 135–148. [Google Scholar]
- Bāders, E.; Silamiķele, I.; Polyachenko, O.; Kiviste, A.; Jõgiste, K.; Jansons, Ā. Long-term effects of salvage logging on stand composition in seminatural spruce forests. Eur. J. For. Res. 2020, 139, 17–27. [Google Scholar] [CrossRef]
- Bāders, E.; Senhofa, S.; Purina, L.; Jansons, A. Natural Succession of Norway Spruce Stands in Hemiboreal Forests: Case Study in Slitere National Park, Latvia. Balt. For. 2017, 23, 522–528. [Google Scholar]
- Liepa, I. Tree Growth Study; LUA: Jelgava, Latvia, 1996; 123p. [Google Scholar]
- Ellenberg, H.; Weber, H.E.; Düll, R.; Wirth, V.; Werner, W.; Paulissen, D. Zeigerwerte von Pflanzen in Mitteleuropa, 2nd ed.; Scripta Geobotanica: Göttingen, Germany, 1992; pp. 1–248. [Google Scholar]
- Clarck, K.R. Non-parametric multivariate analyses of changes in community structure. Aust. J. Ecol. 1993, 18, 117–143. [Google Scholar] [CrossRef]
- Correa-Metrio, A.; Dechnik, Y.; Lozano-García, S.; Caballero, M. Detrended correspondence analysis: A useful tool to quantify ecological changes from fossil data sets. Bol. Soc. Geol. Mex. 2014, 66, 135–143. [Google Scholar] [CrossRef]
- R Core Team. R: A Language and Environment for Statistical Computing; R Foundation for Statistical Computing: Vienna, Austria, 2022; Available online: https://www.R-project.org/ (accessed on 16 January 2024).
- Bates, D.; Maechler, M.; Bolker, B.; Walker, S. Fitting Linear Mixed-Effects Models Using lme4. J. Stat. Softw. 2015, 67, 18637. [Google Scholar] [CrossRef]
- Oksanen, J.; Simpson, G.; Blanchet, F.; Kindt, R.; Legendre, P.; Minchi, P.R.; O’Hara, R.B.; Solymos, P.; Stevens, M.H.H.; Szoecs, E.; et al. _vegan: Community Ecology Package_. R Package Version 2.6-4. 2022. Available online: https://CRAN.R-project.org/package=vegan (accessed on 15 January 2024).
- Heinken, T.; Diekmann, M.; Liira, J.; Orczewska, A.; Schmidt, M.; Brunet, J.; Chytrý, M.; Chabrerie, O.; Decocq, G.; De Frenne, P.; et al. The European forest plant species list (EuForPlant): Concept and applications. J. Veg. Sci. 2022, 33, e13132. [Google Scholar] [CrossRef]
- Bušs, K. Forest Ecology and Typology; Silava: Rīga, Latvia, 1981; 68p. [Google Scholar]
- Marozas, V.; Racinskas, J.; Bartkevicius, E. Dynamics of ground vegetation after surface fires in hemiboreal Pinus sylvestris forests. For. Ecol. Manag. 2007, 250, 47–55. [Google Scholar] [CrossRef]
- Aubin, I.; Messier, C.; Bouchard, A. Can plantations develop understory biological and physical attributes of naturally regenerated forests? Biol. Conserv. 2008, 141, 2461–2476. [Google Scholar] [CrossRef]
- Hermy, M.; Verheyen, K. Legacies of the past in the present-day forest biodiversity: A review of past land-use effects on forest plant species composition and diversity. Ecol. Res. 2007, 22, 361–371. [Google Scholar] [CrossRef]
- Petrokas, R. Forest climax phenomenon: An invariance of scale. Forests 2020, 11, 56. [Google Scholar] [CrossRef]
- Taylor, A.R. Concepts, Theories and Models of Succession in the Boreal Forest of Central Canada. Ph.D. Thesis, Lakehead University, Thunder Bay, ON, Canada, 2009. [Google Scholar]
- Busby, J.R.; Bliss, L.C.; Hamilton, C.D. Microclimate control of growth rates and habitats of the boreal forest mosses, Tomenthypnum nitens and Hylocomium splendens. Ecol. Monogr. 1978, 48, 95–110. [Google Scholar] [CrossRef]
- Lõhmus, A.; Remm, L. Disentangling the effects of seminatural forestry on an ecosystem good: Bilberry (Vaccinium myrtillus) in Estonia. For. Ecol. Manag. 2017, 404, 75–83. [Google Scholar] [CrossRef]
- Timoshok, E.E. The ecology of bilberry (Vaccinium myrtillus L.) and cowberry (Vaccinium vitis-idaea L.) in Western Siberia. Russ. J. Ecol. 2000, 31, 8–13. [Google Scholar] [CrossRef]
- Gravel, D.; Canham, C.D.; Beaudet, M.; Messier, C. Shade tolerance, canopy gaps and mechanisms of coexistence of forest trees. Oikos 2010, 119, 475–484. [Google Scholar] [CrossRef]
- Lienard, J.; Florescu, I.; Strigul, N. An appraisal of the classic forest succession paradigm with the shade tolerance index. PLoS ONE 2015, 10, e0117138. [Google Scholar] [CrossRef]
- Diekmann, M. Deciduous forest vegetation in boreo-nemoral Scandinavia. Acta Phytogeogr. Suec. 1994, 80, 1–116. [Google Scholar]
- Hitchcock, C.L.; Cronquist, A.; Ownbey, M.; Thompson, J.W. Vascular Plants of the Pacific Northwest. Vascular Plants of the Pacific Northwest; University of Washington Press: Seattle, WA, USA, 1969; 914p. [Google Scholar]
- Ćosović, M.; Bugalho, M.N.; Thom, D.; Borges, J.G. Stand structural characteristics are the most practical biodiversity indicators for forest management planning in Europe. Forests 2020, 11, 343. [Google Scholar] [CrossRef]
- Kovács, B.; Tinya, F.; Ódor, P. Stand structural drivers of microclimate in mature temperate mixed forests. Agric. For. Meteorol. 2017, 234, 11–21. [Google Scholar] [CrossRef]
- Boch, S.; Prati, D.; Müller, J.; Socher, S.; Baumbach, H.; Buscot, F.; Gockel, S.; Hemp, A.; Hessenmöller, D.; Kalko, E.K.; et al. High plant species richness indicates management-related disturbances rather than the conservation status of forests. Basic Appl. Ecol. 2013, 14, 496–505. [Google Scholar] [CrossRef]
- French, L.J.; Smith, G.F.; Kelly, D.L.; Mitchell, F.J.; O’Donoghue, S.; Iremonger, S.F.; McKee, A.M. Ground flora communities in temperate oceanic plantation forests and the influence of silvicultural, geographic and edaphic factors. For. Ecol. Manag. 2008, 255, 476–494. [Google Scholar] [CrossRef]
- Petersson, L.; Holmström, E.; Lindbladh, M.; Felton, A. Tree species impact on understory vegetation: Vascular plant communities of Scots pine and Norway spruce managed stands in northern Europe. For. Ecol. Manag. 2019, 448, 330–345. [Google Scholar] [CrossRef]
- Coroi, M.; Skeffington, M.S.; Giller, P.; Smith, C.; Gormally, M.; O’Donovan, G. Vegetation diversity and stand structure in streamside forests in the south of Ireland. For. Ecol. Manag. 2004, 202, 39–57. [Google Scholar] [CrossRef]
- Fang, Z.; Bao, W.; Yan, X.; Liu, X. Understory structure and vascular plant diversity in naturally regenerated deciduous forests and spruce plantations on similar clear-cuts: Implications for forest regeneration strategy selection. Forests 2014, 5, 715–743. [Google Scholar] [CrossRef]
- Hedwall, P.O.; Holmström, E.; Lindbladh, M.; Felton, A. Concealed by darkness: How stand density can override the biodiversity benefits of mixed forests. Ecosphere 2019, 10, e02835. [Google Scholar] [CrossRef]
- Esteso-Martínez, J.; Gil-Pelegrín, E. Frost resistance of seeds in Mediterranean oaks and the role of litter in the thermal protection of acorns. Ann. For. Sci. 2004, 61, 481–486. [Google Scholar] [CrossRef]
- Graae, B.J.; Heskjær, V.S. A comparison of understorey vegetation between untouched and managed deciduous forest in Denmark. For. Ecol. Manag. 1997, 96, 111–123. [Google Scholar] [CrossRef]
- Saetre, P.; Saetre, L.S.; Brandtberg, P.O.; Lundkvist, H.; Bengtsson, J. Ground vegetation composition and heterogene-ity in pure Norway spruce and mixed Norway spruce–birch stands. Can. J. For. Res. 1997, 27, 2034–2042. [Google Scholar] [CrossRef]
- Andringa, J.I.; Zuo, J.; Berg, M.P.; Klein, R.; van’t Veer, J.; de Geus, R.; de Beaumont, M.; Goudzwaard, L.; van Hal, J.; Broekman, R.; et al. Combining tree species and decay stages to increase invertebrate diversity in dead wood. For. Ecol. Manag. 2019, 441, 80–88. [Google Scholar] [CrossRef]
- Dittrich, S.; Jacob, M.; Bade, C.; Leuschner, C.; Hauck, M. The significance of deadwood for total bryophyte, lichen, and vascular plant diversity in an old-growth spruce forest. Plant Ecol. 2014, 215, 1123–1137. [Google Scholar] [CrossRef]
- Fries, C.; Johansson, O.; Pettersson, B.; Simonsson, P. Silvicultural models to maintain and restore natural stand structures in Swedish boreal forests. For. Ecol. Manag. 1997, 94, 89–103. [Google Scholar] [CrossRef]
- Smith, G.F.; Gittings, T.; Wilson, M.; French, L.; Oxbrough, A. Identifying practical indicators of biodiversity for stand-level management of plantation forests. In Plantation Forests and Biodiversity: Oxymoron or Opportunity? Biodiversity and Conservation; Springer: Dordrecht, The Netherlands, 2007; Volume 9, pp. 67–91. [Google Scholar] [CrossRef]
- Matisone, I.; Jansone, D.; Jaunslaviete, I.; Matisons, R.; Liepiņa, A.A.; Jansons, Ā. Stand Structure Beats Age for Ground Cover Vegetation in Ageing Hemiboreal Scots Pine and Norway Spruce Stands. Sustainability 2023, 15, 7594. [Google Scholar] [CrossRef]
- Olsson, B.A.; Bergholm, J.; Alavi, G.; Persson, T. Effects of long-term N fertilization on nitrate leaching and vegetation responses in a spruce stand after severe wind damage. For. Ecol. Manag. 2022, 520, 120422. [Google Scholar] [CrossRef]
- Royer-Tardif, S.; Bauhus, J.; Doyon, F.; Nolet, P.; Thiffault, N.; Aubin, I. Revisiting the functional zoning concept un-der climate change to expand the portfolio of adaptation options. Forests 2021, 12, 273. [Google Scholar] [CrossRef]
- Johnson, E.A. Vegetation organization and dynamics of lichen woodland communities in the Northwest Territories, Canada. Ecology 1981, 62, 200–215. [Google Scholar] [CrossRef]
- Klinka, K.; Krajina, V.J.; Ceska, A.; Scagel, A.M. Indicator Plants of Coastal British Columbia; University of British Columbia Press: Vancouver, BC, Canada, 1989; 288p. [Google Scholar]
- Porley, R.; Hodgetts, N. Mosses and Liverworts; HarperCollins: London, UK, 2005; 495p. [Google Scholar]
- Packham, J.R. Biological Flora of the British Isles. No. 141. Oxalis acetosella L. J. Ecol. 1978, 66, 669–693. [Google Scholar] [CrossRef]
- Flinn, K.M.; Marks, P.L. Agricultural legacies in forest environments: Tree communities, soil properties, and light availability. Ecol. Appl. 2007, 17, 452–463. [Google Scholar] [CrossRef] [PubMed]
- Buchholz, S.; Kelm, V.; Ghanem, S.J. Mono-specific forest plantations are valuable bat habitats: Implications for wind energy development. Eur. J. Wildl. Res. 2021, 67, 1. [Google Scholar] [CrossRef]
- Nixon, D.J.; Stephens, W.; Tyrrel, S.F.; Brierley, E.D.R. The potential for short rotation energy forestry on restored landfill caps. Bioresour. Technol. 2001, 77, 237–245. [Google Scholar] [CrossRef]


| Plantations | Unmanaged | Old-Growth | Total | |
|---|---|---|---|---|
| No. of stands | 4 | 7 | 9 | 20 |
| No. of forest inventory and Vegetation plots (grids) | 15 | 28 | 24 | 67 |
| Stand age (mean, years) | 26–62 (45) | (53) | 172–194 (186) | |
| Total DBH (cm) | 33.6 ± 1.5 a | 15.6 ± 0.5 b | 16.7 ± 0.8 b | |
| Canopy DBH (cm) | 38.6 ± 1.3 a | 21.1 ± 0.5 b | 36.2 ± 1.4 a | |
| Total H (m) | 20.8 ± 1.5 a | 17.2 ± 0.3 b | 14.9 ± 0.6 c | |
| Canopy H (m) | 23.3 ± 0.9 a | 22.9 ± 0.7 a | 26.8 ± 0.7 b | |
| Total density (trees ha−1) | 273.3 ± 19.6 a | 1879.3 ± 116.1 b | 970.0 ± 72.2 c | |
| Canopy density (trees ha−1) | 222.7 ± 15.7 a | 825.0 ± 35.9 b | 232.5 ± 19.4 a | |
| Standing volume (m3 ha−1) | 264.8 ± 25.3 a | 428.0 ± 18.1 b | 371.8 ± 29.1 b | |
| Deadwood volume (m3 ha−1) | 5.9 ± 3.3 a | 43.4 ± 9.0 b | 62.1 ± 8.7 c | |
| Proportion of spruce (%) | 98.7 ± 0.9 a | 62.3 ± 3.49 b | 52.8 ± 6.2 b | |
| Management Type | Ground Flora | Vascular | Woody | Bryophyte | |
|---|---|---|---|---|---|
| Mean ± CI | Mean ± CI | Mean ± CI | Mean ± CI | ||
| Number of species | PL | 31.3 ± 1.1 a | 21.3 ± 1.2 a | 2.2 ± 1.4 a | 7.7 ± 1.2 a |
| UM | 17.8 ± 1.2 b | 8.2 ± 1.3 b | 2.4 ± 1.3 a | 7.2 ± 1.1 a | |
| OG | 23.5 ± 1.1 c | 12.9 ± 1.2 c | 3.6 ± 1.2 b | 6.9 ± 1.2 a | |
| Relative projective cover (%) | PL | 134.7 ± 14.1 a | 54.8 ± 10.2 a | 1.6 ± 1.8 a | 78.4 ± 16.9 a |
| UM | 40.4 ± 51.2 ab | 12.8 ± 23.9 b | 0.8 ± 4.1 a | 26.8 ± 41.3 a | |
| OG | 87.9 ± 13.9 b | 34.6 ± 9.3 b | 2.1 ± 1.7 a | 52.30 ± 15.5 a | |
| Shannon–Wiener index | PL | 2.8 ± 0.2 a | 2.6 ± 0.2 a | 1.1 ± 0.2 a | 0.9 ± 0.2 a |
| UM | 2.5 ± 0.1 b | 1.7 ± 0.2 b | 1.4 ± 0.1 b | 0.8 ± 0.2 a | |
| OG | 2.6 ± 0.1 ab | 2.0 ± 0.2 c | 1.2 ± 0.2 ab | 0.8 ± 0.2 a |
| Plantation | Unmanaged | Old-Growth | ||||||
| Species | Cover | Occurrence | Species | Cover | Occurrence | Species | Cover | Occurrence |
| Vascular | ||||||||
| Anthoxanthum odoratum | 10.91 | 66.67 | Vaccinium myrtillus | 6.56 | 82.14 | Oxalis acetosella | 10.64 | 91.67 |
| Veronica chamaedrys | 8.74 | 93.33 | Oxalis acetosella | 5.02 | 89.29 | Vaccinium myrtillus | 6.84 | 58.33 |
| Oxalis acetosella | 7.63 | 60.00 | Calamagrostis arundinacea | 3.57 | 64.29 | Calamagrostis arundinacea | 5.21 | 75.00 |
| Melampyrum pratense | 7.54 | 93.33 | Maianthemum bifolium | 2.16 | 89.29 | Anemone nemorosa | 4.26 | 45.83 |
| Equisetum pratense | 6.58 | 53.33 | Deschampsia flexuosa | 1.55 | 25.00 | Mercurialis perennis | 2.90 | 29.17 |
| Poa nemoralis | 6.31 | 60.00 | Carex digitata | 0.97 | 35.71 | Galeobdolon luteum | 2.80 | 58.33 |
| Dactylis glomerata | 4.92 | 73.33 | Dryopteris carthusiana | 0.89 | 46.43 | Dryopteris carthusiana | 2.69 | 70.83 |
| Mycelis muralis | 2.32 | 66.67 | Luzula pilosa | 0.83 | 32.14 | Luzula pilosa | 2.39 | 83.33 |
| Hypericum perforatum | 2.07 | 66.67 | Equisetum sylvaticum | 0.65 | 39.29 | Vaccinium vitis-idaea | 2.03 | 33.33 |
| Galium mollugo | 1.99 | 73.33 | Trientalis europaea | 0.56 | 35.71 | Carex digitata | 1.98 | 54.17 |
| Solidago virgaurea | 1.99 | 80.00 | Gymnocarpium dryopteris | 0.53 | 25.00 | Maianthemum bifolium | 1.84 | 70.83 |
| Woody | ||||||||
| Picea abies | 3.43 | 60.00 | Picea abies | 1.21 | 75.00 | Corylus avellana | 5.54 | 37.50 |
| Sorbus aucuparia | 0.57 | 26.67 | Populus tremula | 0.84 | 60.71 | Sorbus aucuparia | 1.95 | 79.17 |
| Frangula alnus | 0.47 | 33.33 | Sorbus aucuparia | 0.84 | 46.43 | Picea abies | 1.18 | 29.17 |
| Acer platanoides | 0.40 | 40.00 | Acer platanoides | 0.18 | 14.29 | Ribes rubrum | 1.10 | 37.50 |
| Corylus avellana | 0.37 | 26.67 | Fraxinus excelsior | 0.11 | 7.14 | Populus tremula | 0.67 | 29.17 |
| Bryophytes | ||||||||
| Rhytidiadelphus squarrosus | 43.49 | 100.00 | Hylocomium splendens | 12.07 | 96.43 | Hylocomium splendens | 19.00 | 79.17 |
| Pleurozium schreberi | 27.58 | 86.67 | Cirriphyllum piliferum | 9.47 | 100.00 | Eurhynchium angustirete | 15.45 | 75.00 |
| Hylocomium splendens | 23.20 | 86.67 | Rhytidiadelphus triquetrus | 8.29 | 82.14 | Pleurozium schreberi | 8.89 | 58.33 |
| Cirriphyllum piliferum | 22.62 | 80.00 | Pleurozium schreberi | 8.05 | 78.57 | Rhytidiadelphus triquetrus | 8.13 | 58.33 |
| Rhytidiadelphus triquetrus | 10.50 | 46.67 | Dicranum polysetum | 4.25 | 100.00 | Plagiochila asplenioides | 7.11 | 70.83 |
| Plagiomnium undulatum | 5.12 | 53.33 | Plagiochila asplenioides | 3.56 | 60.71 | Sphagnum angustifolium | 5.98 | 25.00 |
| Polytrichum commune | 4.48 | 20.00 | Polytrichum commune | 3.13 | 57.14 | Sphagnum girgensohnii | 4.46 | 12.50 |
| Plagiomnium affine | 3.38 | 73.33 | Aulacomnium androgynum | 1.58 | 35.71 | Dicranum polysetum | 2.77 | 45.83 |
| Plagiomnium ellipticum | 2.49 | 46.67 | Dicranum majus | 1.44 | 28.57 | Polytrichum commune | 2.45 | 37.50 |
| Dicranum polysetum | 2.40 | 60.00 | Plagiomnium undulatum | 0.82 | 28.57 | Plagiomnium ellipticum | 2.40 | 45.83 |
| DCA1 | |||
|---|---|---|---|
| Fixed effects | |||
| χ2 | p-value | ||
| Proportion of spruce in stand | 7.4 | 0.007 | |
| Light | 19.7 | <0.001 | |
| Temperature | 14.2 | <0.001 | |
| Height of understorey | 7.8 | 0.005 | |
| Cover of deadwood (on the ground) | 17.5 | <0.001 | |
| Model performance | |||
| R2, marginal | 0.78 | ||
| R2, conditional | 0.92 | ||
| DCA2 | |||
| Fixed effects | |||
| χ2 | p-value | ||
| Nitrogen | 10.5 | 0.001 | |
| Stand age | 9.6 | 0.001 | |
| Model performance | |||
| R2, marginal | 0.23 | ||
| R2, conditional | 0.64 | ||
Disclaimer/Publisher’s Note: The statements, opinions and data contained in all publications are solely those of the individual author(s) and contributor(s) and not of MDPI and/or the editor(s). MDPI and/or the editor(s) disclaim responsibility for any injury to people or property resulting from any ideas, methods, instructions or products referred to in the content. |
© 2024 by the authors. Licensee MDPI, Basel, Switzerland. This article is an open access article distributed under the terms and conditions of the Creative Commons Attribution (CC BY) license (https://creativecommons.org/licenses/by/4.0/).
Share and Cite
Matisone, I.; Katrevičs, J.; Jansone, D.; Jaunslaviete, I.; Matisons, R.; Liepiņa, A.A.; Jansons, Ā. Ground Cover Vegetation in Differently Managed Hemiboreal Norway Spruce Stands: Plantation vs. Natural Regeneration. Diversity 2024, 16, 203. https://0-doi-org.brum.beds.ac.uk/10.3390/d16040203
Matisone I, Katrevičs J, Jansone D, Jaunslaviete I, Matisons R, Liepiņa AA, Jansons Ā. Ground Cover Vegetation in Differently Managed Hemiboreal Norway Spruce Stands: Plantation vs. Natural Regeneration. Diversity. 2024; 16(4):203. https://0-doi-org.brum.beds.ac.uk/10.3390/d16040203
Chicago/Turabian StyleMatisone, Ilze, Juris Katrevičs, Diāna Jansone, Ieva Jaunslaviete, Roberts Matisons, Agnese Anta Liepiņa, and Āris Jansons. 2024. "Ground Cover Vegetation in Differently Managed Hemiboreal Norway Spruce Stands: Plantation vs. Natural Regeneration" Diversity 16, no. 4: 203. https://0-doi-org.brum.beds.ac.uk/10.3390/d16040203