
Conservation Challenges Imposed by Evolutionary History and Habitat Suitability Shifts of Endangered Freshwater Mussels under a Global Climate Change Scenario
 , , , , , and
Abstract
:1. Introduction
2. Methods
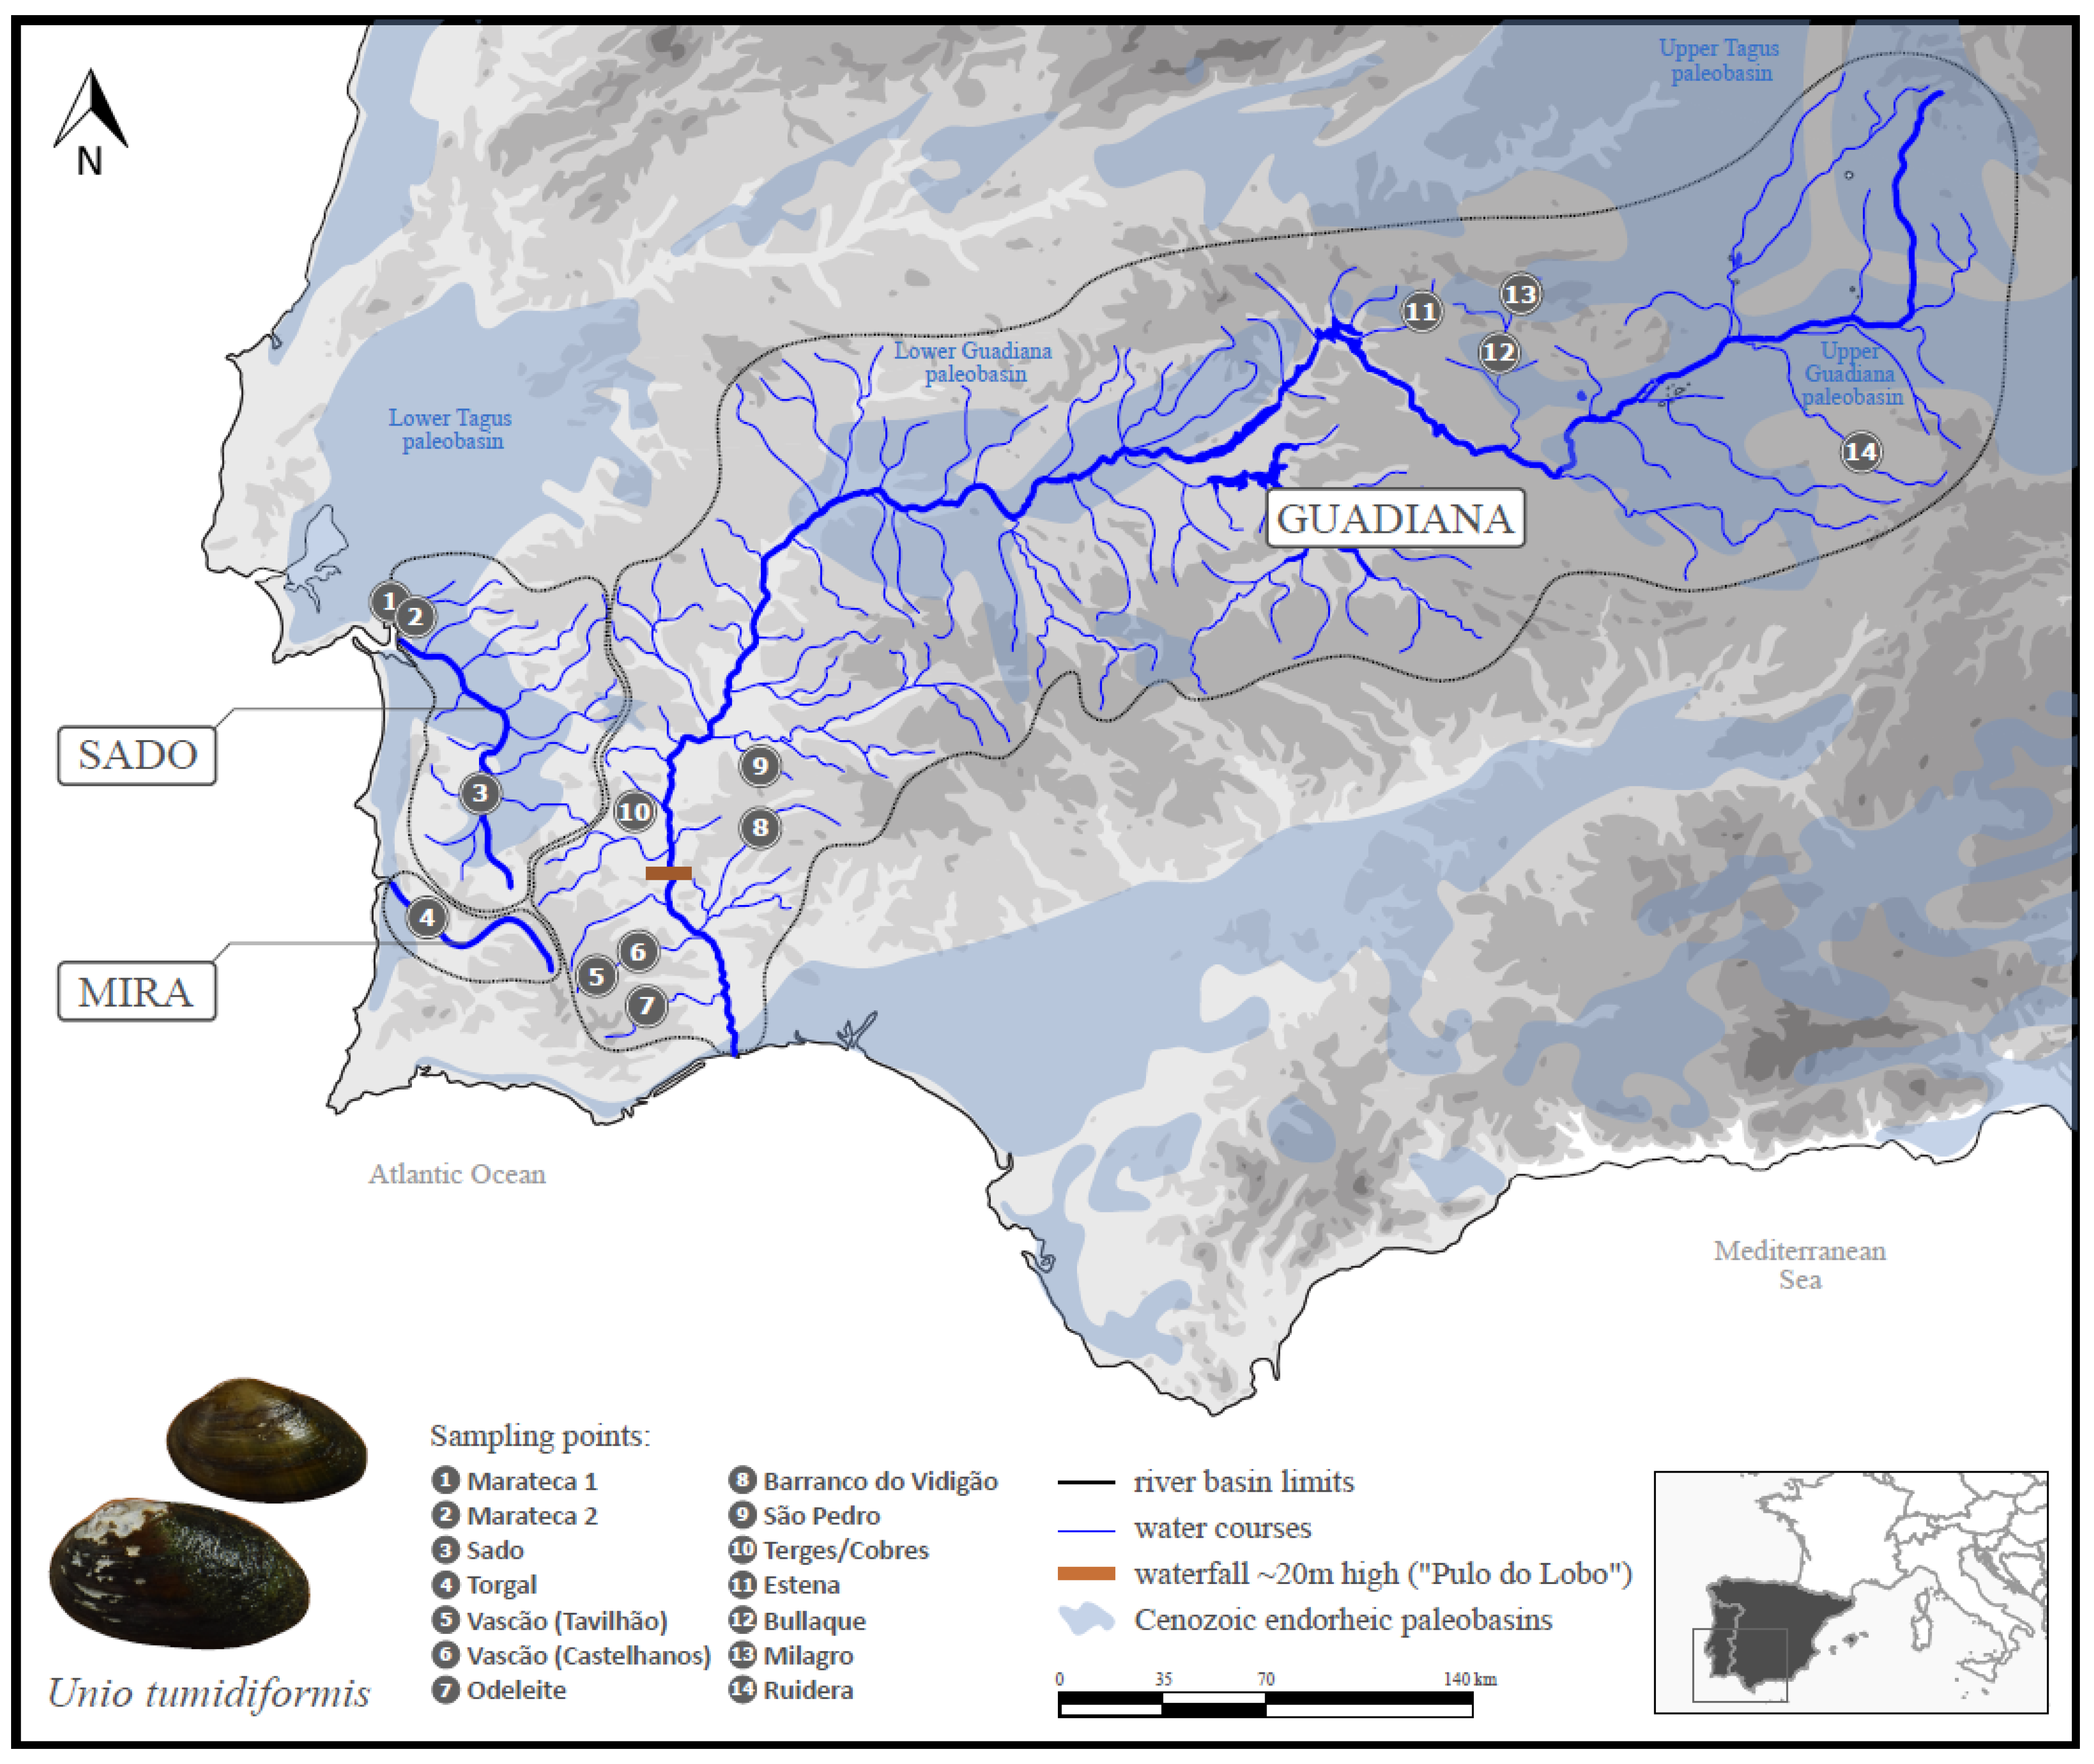
2.1. Sampling
2.2. DNA Extraction and Genotyping by Sequencing
2.3. Genetic Diversity and Genetic Structure Analyses
2.4. Ecological Niche Modeling and Habitat Suitability
3. Results
3.1. Genetic Diversity and Genetic Structure
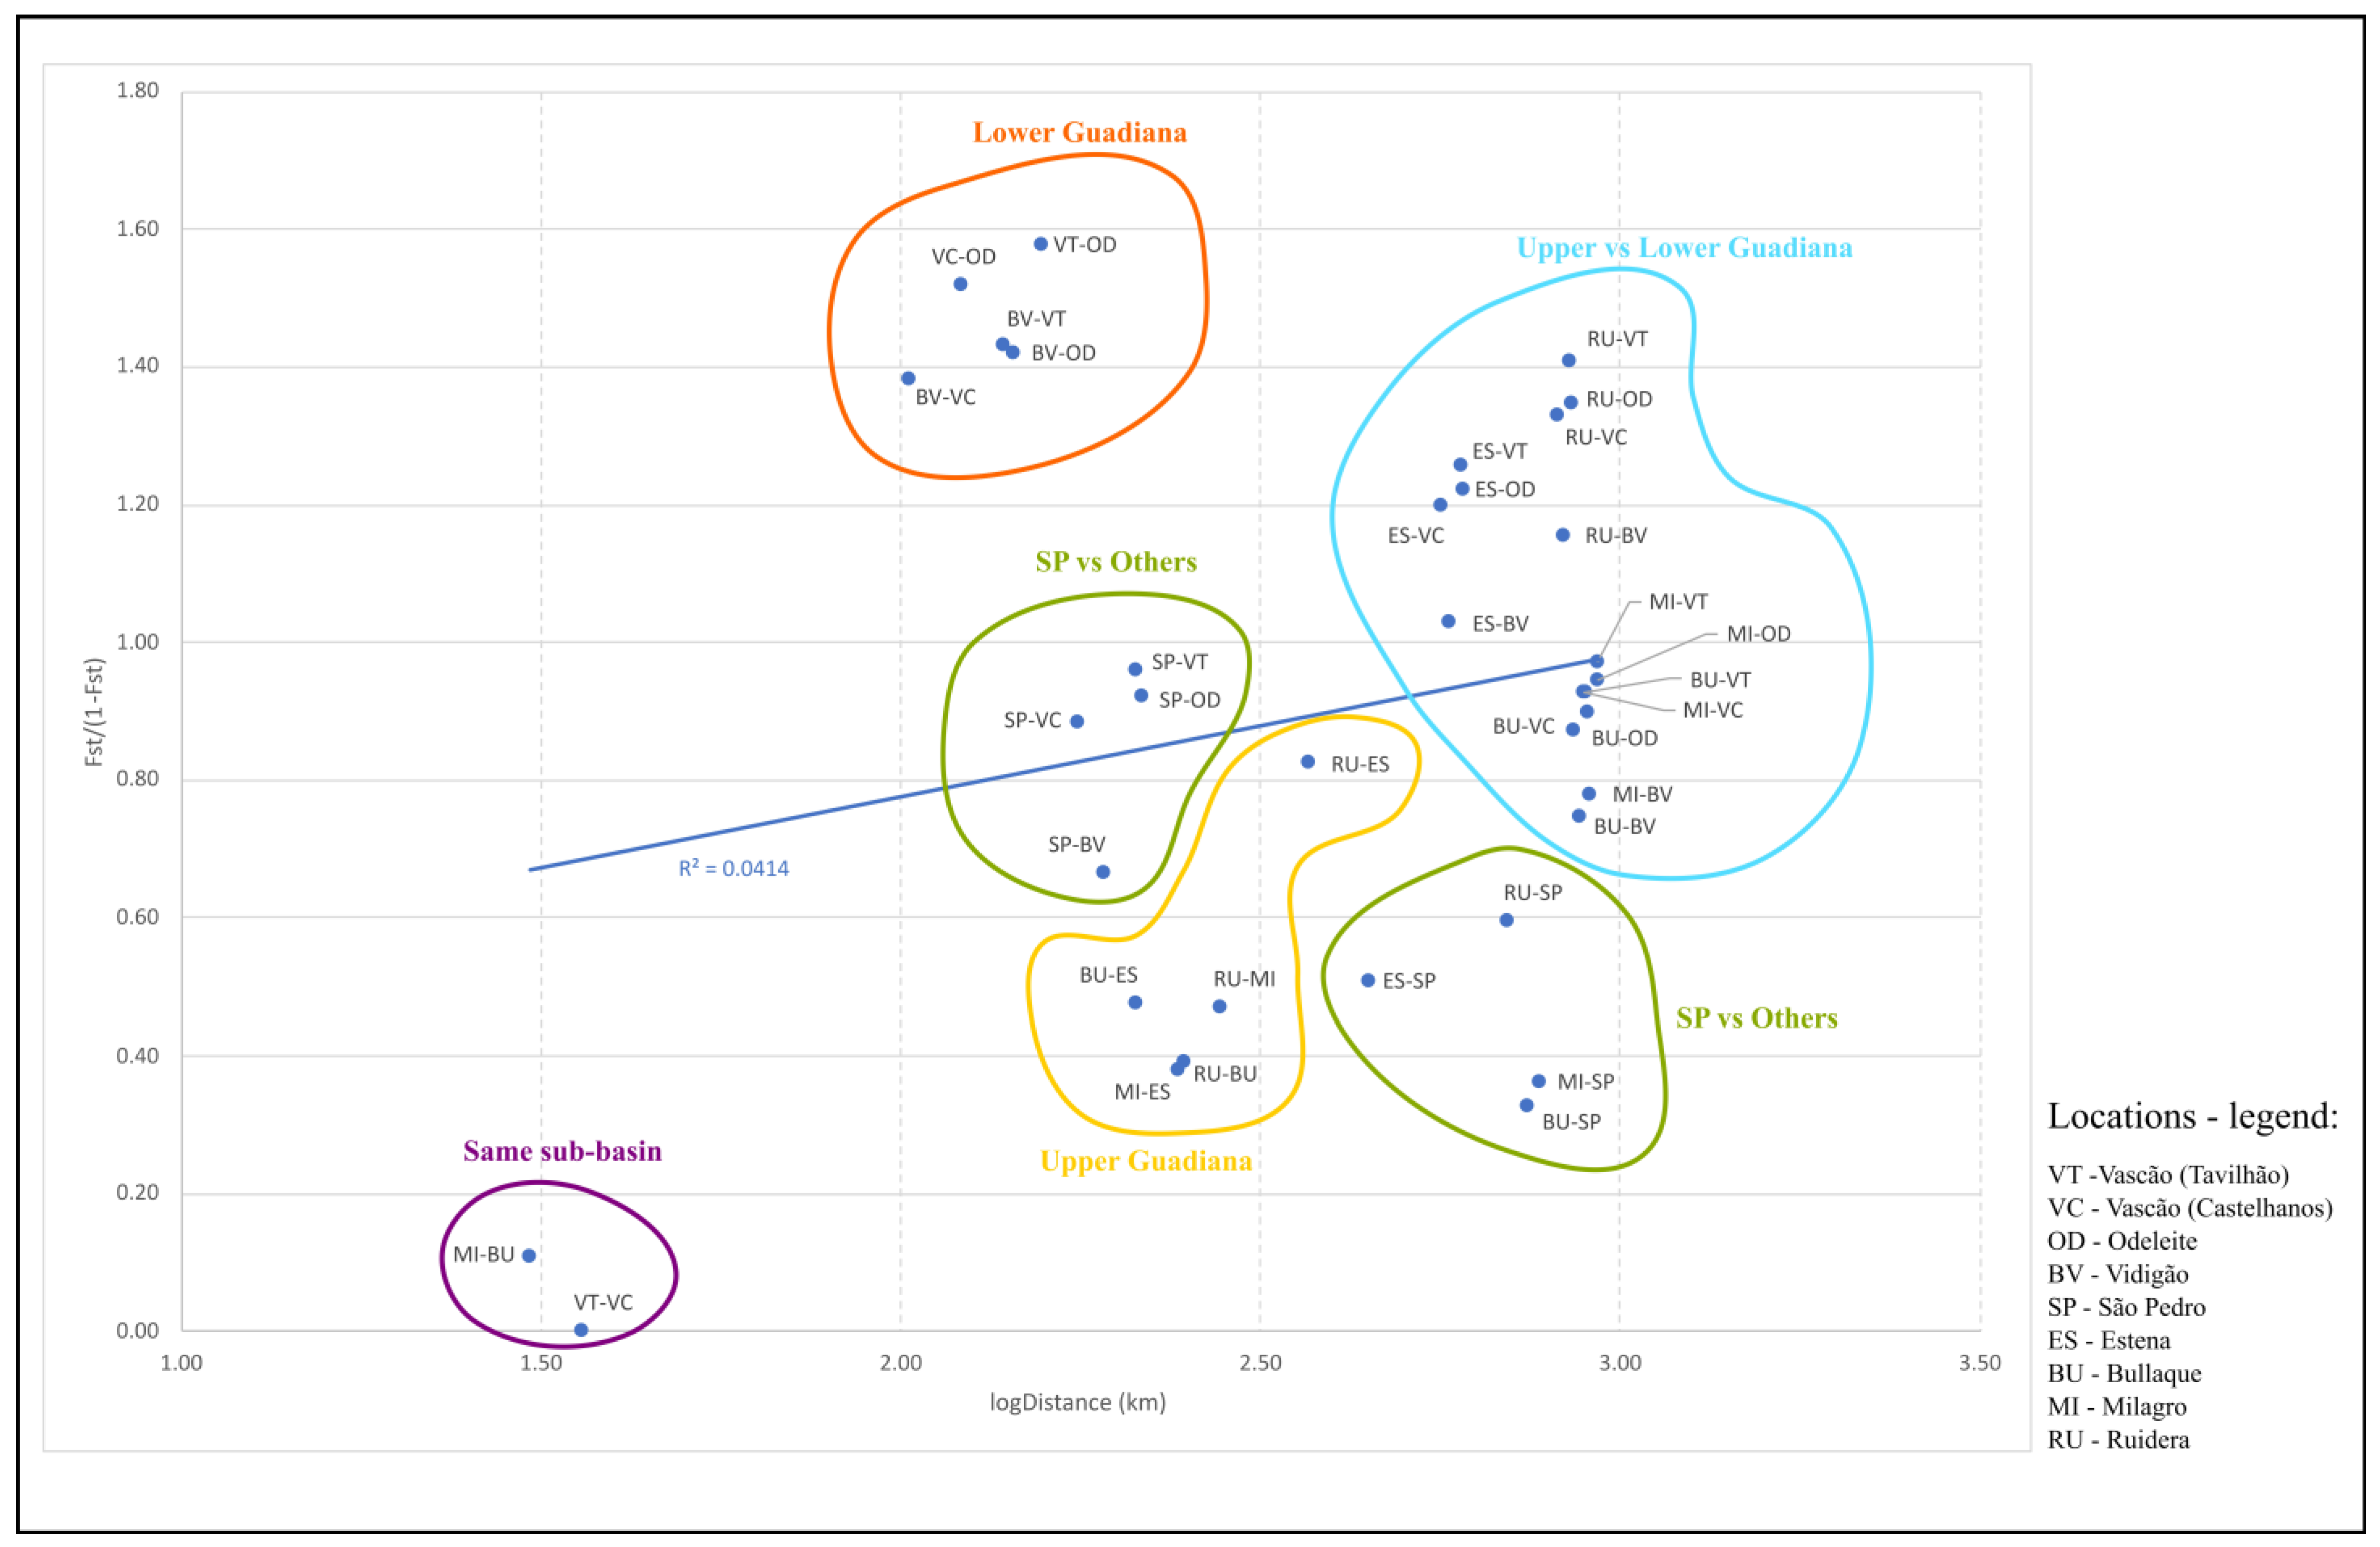
3.2. Association between Genetic Differentiation and Geographic Distances
3.3. Ecological Niche Modeling and Habitat Suitability
4. Discussion
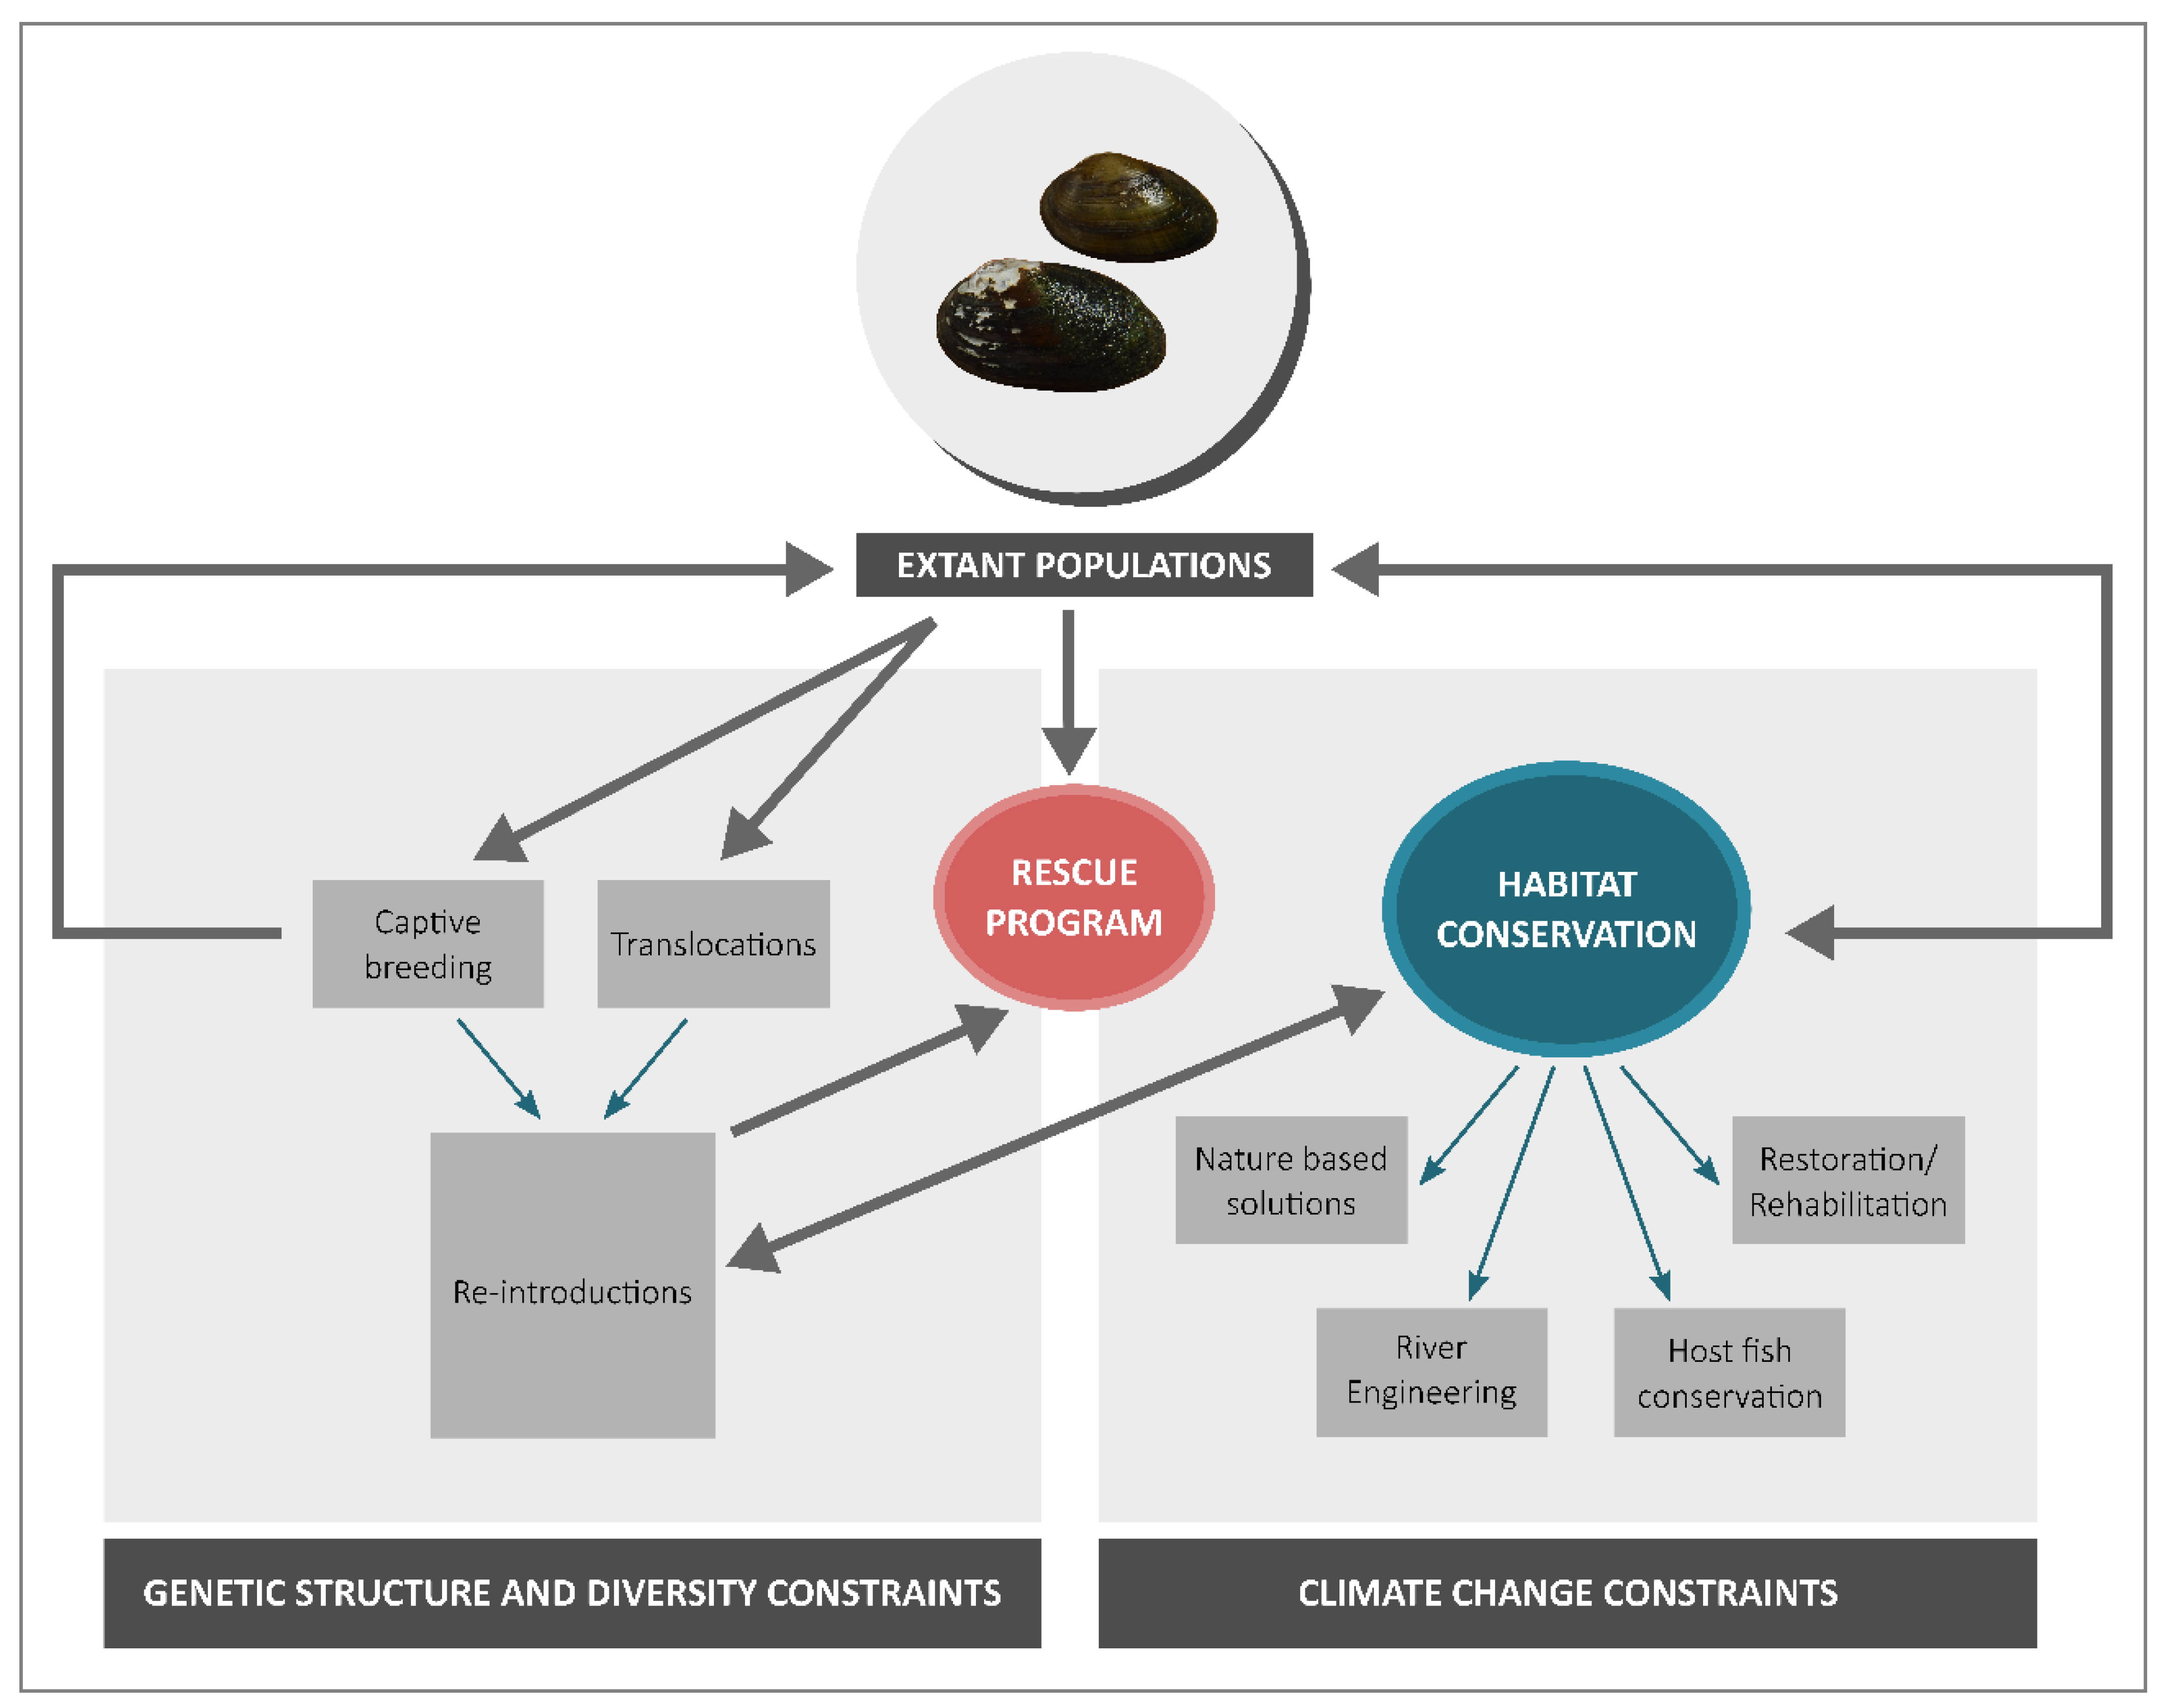
5. Implications for Conservation
Supplementary Materials
Author Contributions
Funding
Data Availability Statement
Acknowledgments
Conflicts of Interest
References
- Harte, J.; Ostling, A.; Green, J.; Kinzig, A. Climate change and extinction risk. Nature 2004, 430, 34. [Google Scholar] [CrossRef] [PubMed]
- Bellard, C.; Bertelsmeier, C.; Leadley, P.; Thuiller, W.; Courchamp, F. Impacts of climate change on the future of biodiversity. Ecol. Lett. 2012, 15, 365–377. [Google Scholar] [CrossRef]
- Pettorelli, N.; Graham, N.A.J.; Seddon, N.; Maria da Cunha Bustamante, M.; Lowton, M.J.; Sutherland, W.J.; Koldewey, H.J.; Prentice, H.C.; Barlow, J. Time to integrate global climate change and biodiversity science-policy agendas. J. Appl. Ecol. 2021, 58, 2384–2393. [Google Scholar] [CrossRef]
- Inoue, K.; Berg, D.J. Predicting the effects of climate change on population connectivity and genetic diversity of an imperiled freshwater mussel, Cumberlandia monodonta (Bivalvia: Margaritiferidae), in riverine systems. Glob. Chang. Biol. 2017, 23, 94–107. [Google Scholar] [CrossRef] [PubMed]
- Kappes, H.; Haase, P. Slow, but steady: Dispersal of freshwater molluscs. Aquat. Sci. 2012, 74, 1–14. [Google Scholar] [CrossRef]
- Lange, M.A. Climate Change in the Mediterranean: Environmental Impacts and Extreme Events; Energy, Environment and Water Research Center, The Cyprus Institute IEMed Mediterranean; Yearbook: Barcelona, Spain, 2020. [Google Scholar]
- Reis, J.; Araujo, R. Life history of the freshwater mussel Unio tumidiformis (Bivalvia: Unionidae) in a temporary Mediterranean-type stream. Invertebr. Biol. 2016, 135, 31–45. [Google Scholar] [CrossRef]
- Gasith, A.; Resh, V.H. Streams in Mediterranean climate regions: Abiotic influences and biotic responses to predictable seasonal events. Annu. Rev. Ecol. Evol. Syst. 1999, 30, 51–81. [Google Scholar] [CrossRef]
- Barceló, D.; Sabater, S. Water quality and assessment under scarcity: Prospects and challenges in Mediterranean watersheds. J. Hydrol. 2010, 383, 1–4. [Google Scholar] [CrossRef]
- Sarremejane, R.; Stubbington, R.; England, J.; Sefton, C.E.M.; Eastman, M.; Parry, S.; Ruhi, A. Drought effects on invertebrate metapopulation dynamics and quasi-extinction risk in an intermittent river network. Glob. Chang. Biol. 2021, 27, 4024–4039. [Google Scholar] [CrossRef] [PubMed]
- Ferrier, S.; Ninan, K.N.; Leadley, P.; Alkemade, R.; Acosta, L.A.; Akçakaya, H.R.; Brotons, L.; Cheung, W.W.L.; Christensen, V.; Harhash, K.A.; et al. (Eds.) IPBES—The Methodological Assessment Report on Scenarios and Models of Biodiversity and Ecosystem Services; Secretariat of the Intergovernmental Science-Policy Platform on Biodiversity and Ecosystem Services: Bonn, Germany, 2016; 348p. [Google Scholar]
- Lopes-Lima, M.; Riccardi, N.; Urbanska, M.; Köhler, F.; Vinarski, M.; Bogan, A.E.; Sousa, R. Major shortfalls impairing knowledge and conservation of freshwater molluscs. Hydrobiologia 2021, 848, 2831–2867. [Google Scholar] [CrossRef]
- Spielman, D.; Brook, B.W.; Frankham, R. Most species are not driven to extinction before genetic factors impact them. Proc. Natl. Acad. Sci. USA 2004, 101, 15261–15264. [Google Scholar] [CrossRef] [PubMed]
- Kyriazis, C.C.; Wayne, R.K.; Lohmueller, K.E. Strongly deleterious mutations are a primary determinant of extinction risk due to inbreeding depression. Evol. Lett. 2021, 5, 33–43. [Google Scholar] [CrossRef] [PubMed]
- Hedrick, P.W. Genetics of Populations; Jones & Bartlett Learning: Burlington, NJ, USA, 2011; 675p. [Google Scholar]
- Hohenlohe, P.A.; Funk, W.C.; Rajora, O.P. Population genomics for wildlife conservation and management. Mol. Ecol. 2021, 30, 62–82. [Google Scholar] [CrossRef] [PubMed]
- Helyar, S.J.; Hemmer-Hansen, J.; Bekkevold, D.; Taylor, M.I.; Ogden, R.; Limborg, M.T.; Cariani, A.; Maes, G.E.; Diopere, E.; Carvalho, G.R.; et al. Application of SNPs for population genetics of nonmodel organisms: New opportunities and challenges. Mol. Ecol. Resour. 2011, 11, 123–136. [Google Scholar] [CrossRef] [PubMed]
- Lemopoulos, A.; Prokkola, J.M.; Uusi-Heikkilä, S.; Vasemägi, A.; Huusko, A.; Hyvärinen, P.; Koljonen, M.L.; Koskiniemi, J.; Vainikka, A. Comparing RADseq and microsatellites for estimating genetic diversity and relatedness—Implications for brown trout conservation. Ecol. Evol. 2019, 9, 2106–2120. [Google Scholar] [CrossRef] [PubMed]
- Perea, S.; Mendes, S.L.; Sousa-Santos, C.; Ondina, P.; Amaro, R.; Castro, J.; San-Miguel, E.; Lima, C.S.; Garcia, M.; Velasquez, V.; et al. Applying genomic approaches to delineate conservation strategies using the freshwater mussel Margaritifera margaritifera in the Iberian Peninsula as a model. Sci. Rep. 2022, 12, 16894. [Google Scholar] [CrossRef]
- Reis, J.; Araujo, R. Redescription of Unio tumidiformis Castro, 1885 (Bivalvia, Unionidae), an endemism from the south-western Iberian Peninsula. J. Nat. Hist. 2009, 43, 1929–1945. [Google Scholar] [CrossRef]
- Council of the European Communities Council Directive 92/43/EEC of 21 May 1992 on the conservation of natural habitats and of wild fauna and flora. Off. J. Eur. Communities 1992, L206, 7–50.
- Boieiro, M.; Ceia, H.; Caramujo, M.J.; Cardoso, P.; Garcia Pereira, P.; Pires, D.; Reis, J.; Rego, C. (Eds.) Livro Vermelho dos Invertebrados de Portugal Continental; Fciências.ID e ICNF I.P.: Lisboa, Portugal, 2023; 468p. [Google Scholar]
- Lopes-Lima, M.; Reis, J.; Alvarez, M.G.; Anastácio, P.M.; Banha, F.; Beja, P.; Castro, P.; Gama, M.; Gil, M.G.; Gomes-dos-Santos, A.; et al. The silent extinction of freshwater mussels in Portugal. Biol. Conserv. 2023, 285, 110244. [Google Scholar] [CrossRef]
- Barnhart, M.C.; Haag, W.R.; Roston, W.N. Adaptations to host infection and larval parasitism in Unionoida. J. N. Am. Benthol. Soc. 2008, 27, 370–394. [Google Scholar] [CrossRef]
- Reis, J.; Collares-Pereira, M.J.; Araujo, R. Host specificity and metamorphosis of the glochidium of the freshwater mussel Unio tumidiformis (Bivalvia: Unionidae). Folia Parasitol. 2014, 61, 81–89. [Google Scholar] [CrossRef]
- Schwalb, A.N.; Morris, T.J.; Cottenie, K. Dispersal abilities of riverine freshwater mussels influence metacommunity structure. Freshw. Biol. 2015, 60, 911–921. [Google Scholar] [CrossRef]
- Wacker, S.; Larsen, B.M.; Karlsson, S.; Hindar, K. Host specificity drives genetic structure in a freshwater mussel. Sci. Rep. 2019, 18, 10409. [Google Scholar] [CrossRef] [PubMed]
- Fullerton, A.H.; Burnett, K.M.; Steel, E.A.; Flitcroft, R.L.; Pess, G.R.; Feist, B.E.; Torgersen, C.E.; Miller, D.J.; Sanderson, B.L. Hydrological connectivity for riverine fish: Measurement challenges and research opportunities. Freshw. Biol. 2010, 55, 2215–2237. [Google Scholar] [CrossRef]
- Olden, J.D.; Kennard, M.J.; Leprieur, F.; Tedesco, P.A.; Winemiller, K.O.; García-Berthou, E. Conservation biogeography of freshwater fishes: Recent progress and future challenges. Divers. Distrib. 2010, 16, 496–513. [Google Scholar] [CrossRef]
- Schwalb, A.N.; Cottenie, K.; Poos, M.S.; Ackerman, J.D. Dispersal limitation of unionid mussels and implications for their conservation. Freshw. Biol. 2011, 56, 1509–1518. [Google Scholar] [CrossRef]
- Modesto, V.; Ilarri, M.; Souza, A.T.; Lopes-Lima, M.; Douda, K.; Clavero, M.; Sousa, R. Fish and mussels: Importance of fish for freshwater mussel conservation. Fish Fish. 2018, 19, 244–259. [Google Scholar] [CrossRef]
- da Silva, J.P.; Gonçalves, D.V.; Lopes-Lima, M.; Anastácio, P.M.; Banha, F.; Frimpong, E.; Gama, M.; Miranda, R.; Reis, J.; Filipe, A.F.; et al. Predicting climatic threats to an endangered freshwater mussel in Europe: The need to account for fish hosts. Freshw. Biol. 2022, 67, 842–856. [Google Scholar] [CrossRef]
- Chong, J.P.; Roe, K.J. A comparison of genetic diversity and population structure of the endangered scaleshell mussel (Leptodea leptodon), the fragile papershell (Leptodea fragilis) and their host-fish the freshwater drum (Aplodinotus grunniens). Conserv. Genet. 2018, 19, 425–443. [Google Scholar] [CrossRef]
- Strayer, D.L.; Smith, D.R. A Guide to Sampling Freshwater Mussel Populations; American Fisheries Society: Bethesda, MD, USA, 2003; 103p. [Google Scholar]
- Elshire, R.J.; Glaubitz, J.C.; Sun, Q.; Poland, J.A.; Kawamoto, K.; Buckler, E.S.; Mitchell, S.E. A Robust, Simple Genotyping-by-Sequencing (GBS) Approach for High Diversity Species. PLoS ONE 2011, 6, e19379. [Google Scholar] [CrossRef] [PubMed]
- Ewels, P.; Magnusson, M.; Lundin, S.; Käller, M. MultiQC: Summarize analysis results for multiple tools and samples in a single report. Bioinformatics 2016, 32, 3047–3048. [Google Scholar] [CrossRef] [PubMed]
- Rochette, N.C.; Rivera-Colón, A.G.; Catchen, J.M. Stacks 2: Analytical methods for paired-end sequencing improve RADseq based population genomics. Mol. Ecol. 2019, 28, 4737–4754. [Google Scholar] [CrossRef] [PubMed]
- Bolger, A.M.; Lohse, M.; Usadel, B. Trimmomatic: A flexible trimmer for Illumina sequence data. Bioinformatics 2014, 30, 214–2120. [Google Scholar] [CrossRef] [PubMed]
- Paris, J.R.; Stevens, J.R.; Catcher, J.M. Lost in parameter space: A road map for stacks. Methods Ecol. Evol. 2017, 8, 1360–1373. [Google Scholar] [CrossRef]
- Limin, F.; Niu, B.; Zhu, Z.; Wu, S.; Li, W. CD-HIT: Accelerated for clustering the next-generation sequencing data. Bioinformatics 2012, 28, 3150–3152. [Google Scholar]
- Li, H. Aligning sequence reads, clone sequences and assembly contigs with BWA-MEM. arXiv 2013, arXiv:1303.3997v2. [Google Scholar]
- Li, H.; Handsaker, B.; Wysoker, A.; Fennell, T.; Ruan, J.; Homer, N.; Marth, G.; Abecasis, G.; Durbin, R.; Genome Project Data Processing Subgroup. The Sequence Alignment/Map Format and SAMtools. Bioinformatics 2009, 25, 2078–2079. [Google Scholar] [CrossRef] [PubMed]
- Garrison, E.; Marth, G. Haplotype-based variant detection from short-read sequencing. arXiv 2012, arXiv:1207.3907v2. [Google Scholar]
- Danecek, P.; Auton, A.; Abecasis, G.; Albers, C.A.; Banks, E.; DePristo, M.A.; Handsaker, R.E.; Lunter, G.; Marth, G.T.; Sherry, S.T.; et al. The variant call format and VCFtools. Bioinformatics 2011, 27, 2156–2158. [Google Scholar] [CrossRef] [PubMed]
- Rise, W.R. Analyzing tables of statistical tests. Evolution 1989, 43, 223–225. [Google Scholar]
- Weir, B.S.; Cockerham, C.C. Estimating F-Statistics for the analysis of population structure. J. Storage 1984, 38, 1358–1370. [Google Scholar]
- Excoffier, L.; Lischer, H.E.L. Arlequin suite ver 3.5: A new series of programs to perform population genetics analyses under Linux and Windows. Mol. Ecol. Resour. 2010, 10, 564–567. [Google Scholar] [CrossRef] [PubMed]
- Frichot, E.; François, O. LEA: An R Package for Landscape and Ecological Association Studies. Methods Ecol. Evol. 2015, 6, 925–929. [Google Scholar] [CrossRef]
- Santos, J.M.; Godinho, F.N.; Ferreira, M.T. Microhabitat use by Iberian nase Chondrostoma polylepis and Iberian chub Squalius carolitertii in three small streams, north-west Portugal. Ecol. Freshw. Fish. 2004, 13, 223–230. [Google Scholar] [CrossRef]
- Bradie, J.; Leung, B. A quantitative synthesis of the importance of variables used in MaxEnt species distribution models. J. Biogeogr. 2017, 44, 1344–1361. [Google Scholar] [CrossRef]
- Gama, M.; Crespo, D.; Dolbeth, M.; Anastácio, P.M. Ensemble forecasting of Corbicula fluminea worldwide distribution: Projections of the impact of climate change. Aquat. Conserv. Mar. Freshw. Ecosyst. 2017, 27, 675–684. [Google Scholar] [CrossRef]
- Thuiller, W.; Lafourcade, B.; Engler, R.; Araújo, M.B. BIOMOD—A platform for ensemble forecasting of species distributions. Ecography, 2009; 32, 369–373. [Google Scholar]
- Araújo, M.B.; New, M. Ensemble forecasting of species distributions. Trends Ecol. Evol. 2007, 22, 42–47. [Google Scholar] [CrossRef] [PubMed]
- Allouche, O.; Tsoar, A.; Kadmon, R. Assessing the accuracy of species distribution models: Prevalence, kappa and the true skill statistic (TSS). J. Appl. Ecol. 2006, 43, 1223–1232. [Google Scholar] [CrossRef]
- Coetzee, B.W.T.; Robertson, M.P.; Erasmus, B.F.N.; Van Rensburg, B.J.; Thuiller, W. Ensemble models predict Important Bird Areas in southern Africa will become less effective for conserving endemic birds under climate change. Glob. Ecol. Biogeogr. 2009, 18, 701–710. [Google Scholar] [CrossRef]
- Liu, C.; Berry, P.M.; Dawson, T.P.; Pearson, R.G. Selecting thresholds of occurrence in the prediction of species distributions. Ecography 2005, 28, 385–393. [Google Scholar] [CrossRef]
- Sousa-Santos, C.; Jesus, T.; Fernandes, C.; Robalo, J.I.; Coelho, M.M. Fish diversification at the pace of geomorphological changes: Evolutionary history of western Iberian Leuciscinae (Teleostei: Leuciscidae) inferred from multilocus sequence data. Mol. Phylogenet. Evol. 2019, 133, 263–285. [Google Scholar] [CrossRef] [PubMed]
- Buj, I.; Ćaleta, M.; Marčić, Z.; Šanda, R.; Vukić, J.; Mrakovčić, M. Different Histories, Different Destinies—Impact of Evolutionary History and Population Genetic Structure on Extinction Risk of the Adriatic Spined Loaches (Genus Cobitis; Cypriniformes, Actinopterygii). PLoS ONE 2015, 10, e0131580. [Google Scholar] [CrossRef] [PubMed]
- Sabater, S.; Elosegi, A.; Feio, M.J.; Gómez, R.; Graça, M.A.S.; Muñoz, I.; Pardo, I.; Romaní, A.M. The Iberian rivers. In Rivers of Europe, 2nd ed.; Tockner, K., Zarfl, C., Robinson, C.T., Eds.; Elsevier: Amsterdam, The Netherlands, 2021; pp. 181–224. [Google Scholar]
- Moreno-Rueda, G.; Pleguezuelos, J.M.; Pizarro, M.; Montori, A. Northward shifts of the distributions of Spanish reptiles in association with climate change. Conserv. Biol. 2012, 26, 278–283. [Google Scholar] [CrossRef] [PubMed]
- da Silva, J.; Sousa, R.; Vasconcelos Gonçalves, D.; Miranda, R.; Reis, J.; Teixeira, A.; Varandas, S.; Lopes-Lima, M.; Filipa Filipe, A. Streams in the Mediterranean Region are not for mussels: Predicting extinctions and range contractions under future climate change. Sci. Total Environ. 2023, 883, 163689. [Google Scholar] [CrossRef] [PubMed]
- Bonada, N.; Cañedo-Argüelles, M.; Gallart, F.; von Schiller, D.; Fortuño, P.; Latron, J.; Llorens, P.; Múrria, C.; Soria, M.; Vinyoles, D.; et al. Conservation and Management of Isolated Pools in Temporary Rivers. Water 2020, 12, 2870. [Google Scholar] [CrossRef]
- Sousa, R.; Halabowski, D.; Labecka, A.M.; Douda, K.; Aksenova, O.; Bespalaya, Y.; Bolotov, I.; Geist, J.; Jones, H.A.; Konopleva, E.; et al. The role of anthropogenic habitats in freshwater mussel conservation. Glob. Chang. Biol. 2021, 27, 2298–2314. [Google Scholar] [CrossRef] [PubMed]
- Zamora-Marín, J.M.; Ilg, C.; Demierre, E.; Bonnet, N.; Wezel, A.; Robin, J.; Vallod, D.; Calvo, J.F.; Oliva-Paterna, F.J.; Oertli, B. Contribution of artificial waterbodies to biodiversity: A glass half empty or half full? Sci. Total Environ. 2021, 753, 141987. [Google Scholar] [CrossRef] [PubMed]
- IUCN/SSC. Guidelines for Reintroductions and Other Conservation Translocations; Version 1.0; IUCN Species Survival Commission: Gland, Switzerland, 2013; viiii + 57p. [Google Scholar]


| Torgal | Sado | Marateca | Ruidera | Bullaque | Estena | Ardila | Chança | Vascão | Odeleite | |
|---|---|---|---|---|---|---|---|---|---|---|
| Torgal | - | 0.630 | 0.743 * | 0.563 | 0.364 * | 0.574 | 0.565 | 0.597 | 0.664 * | 0.628 |
| Sado | - | 0.252 | 0.474 | 0.329 | 0.450 | 0.325 | 0.548 | 0.594 | 0.561 | |
| Marateca | - | 0.643 * | 0.500 * | 0.628 * | 0.647 | 0.686 * | 0.703 * | 0.703 * | ||
| Ruidera | - | 0.214 * | 0.383 | 0.300 | 0.479 | 0.532 * | 0.522 | |||
| Bullaque | - | 0.140 | 0.072 | 0.140 | 0.355 * | 0.393 * | ||||
| Estena | - | 0.297 | 0.441 | 0.507 * | 0.476 | |||||
| Ardila | - | 0.348 | 0.496 | 0.402 | ||||||
| Chança | - | 0.567 * | 0.558 | |||||||
| Vascão | - | 0.581 * | ||||||||
| Odeleite | - |
| Species | Timeframe | SSP | Suitable (%) | Unsuitable (%) | % Reduction |
|---|---|---|---|---|---|
| U. tumidiformis | Present | 7.17 | 92.83 | ||
| 2021–2040 | 245 | 0.11 | 99.89 | 99 | |
| 2021–2040 | 585 | 0.06 | 99.94 | 99 | |
| Squalius | Present | 87.07 | 12.93 | ||
| 2021–2040 | 245 | 81.37 | 18.63 | 19 | |
| 2021–2040 | 585 | 79.40 | 20.60 | 21 | |
| 2041–2060 | 245 | 67.30 | 32.70 | 33 | |
| 2061–2080 | 245 | 58.54 | 41.46 | 42 | |
| 2081–2100 | 245 | 79.16 | 20.84 | 21 |
Disclaimer/Publisher’s Note: The statements, opinions and data contained in all publications are solely those of the individual author(s) and contributor(s) and not of MDPI and/or the editor(s). MDPI and/or the editor(s) disclaim responsibility for any injury to people or property resulting from any ideas, methods, instructions or products referred to in the content. |
© 2024 by the authors. Licensee MDPI, Basel, Switzerland. This article is an open access article distributed under the terms and conditions of the Creative Commons Attribution (CC BY) license (https://creativecommons.org/licenses/by/4.0/).
Share and Cite
Reis, J.; Perea, S.; Gama, M.; Mendes, S.L.; Sousa, V.C.; Lima, C.; Banha, F.; Gil, M.; Alvarez, M.G.; Anastácio, P.; et al. Conservation Challenges Imposed by Evolutionary History and Habitat Suitability Shifts of Endangered Freshwater Mussels under a Global Climate Change Scenario. Diversity 2024, 16, 209. https://0-doi-org.brum.beds.ac.uk/10.3390/d16040209
Reis J, Perea S, Gama M, Mendes SL, Sousa VC, Lima C, Banha F, Gil M, Alvarez MG, Anastácio P, et al. Conservation Challenges Imposed by Evolutionary History and Habitat Suitability Shifts of Endangered Freshwater Mussels under a Global Climate Change Scenario. Diversity. 2024; 16(4):209. https://0-doi-org.brum.beds.ac.uk/10.3390/d16040209
Chicago/Turabian StyleReis, Joaquim, Silvia Perea, Mafalda Gama, Sofia L. Mendes, Vitor C. Sousa, Cristina Lima, Filipe Banha, Maria Gil, Maria Garcia Alvarez, Pedro Anastácio, and et al. 2024. "Conservation Challenges Imposed by Evolutionary History and Habitat Suitability Shifts of Endangered Freshwater Mussels under a Global Climate Change Scenario" Diversity 16, no. 4: 209. https://0-doi-org.brum.beds.ac.uk/10.3390/d16040209