
Correlating the Integral Sensing Properties of Zeolites with Molecular Processes by Combining Broadband Impedance and DRIFT Spectroscopy—A New Approach for Bridging the Scales

 , , and
Abstract
:
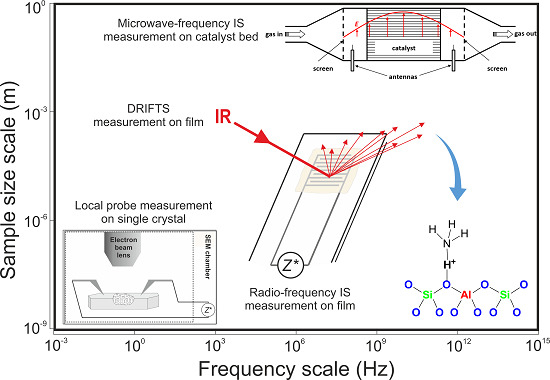
1. Introduction

2. Instrument Development
2.1. Low-Frequency Impedance Spectroscopy


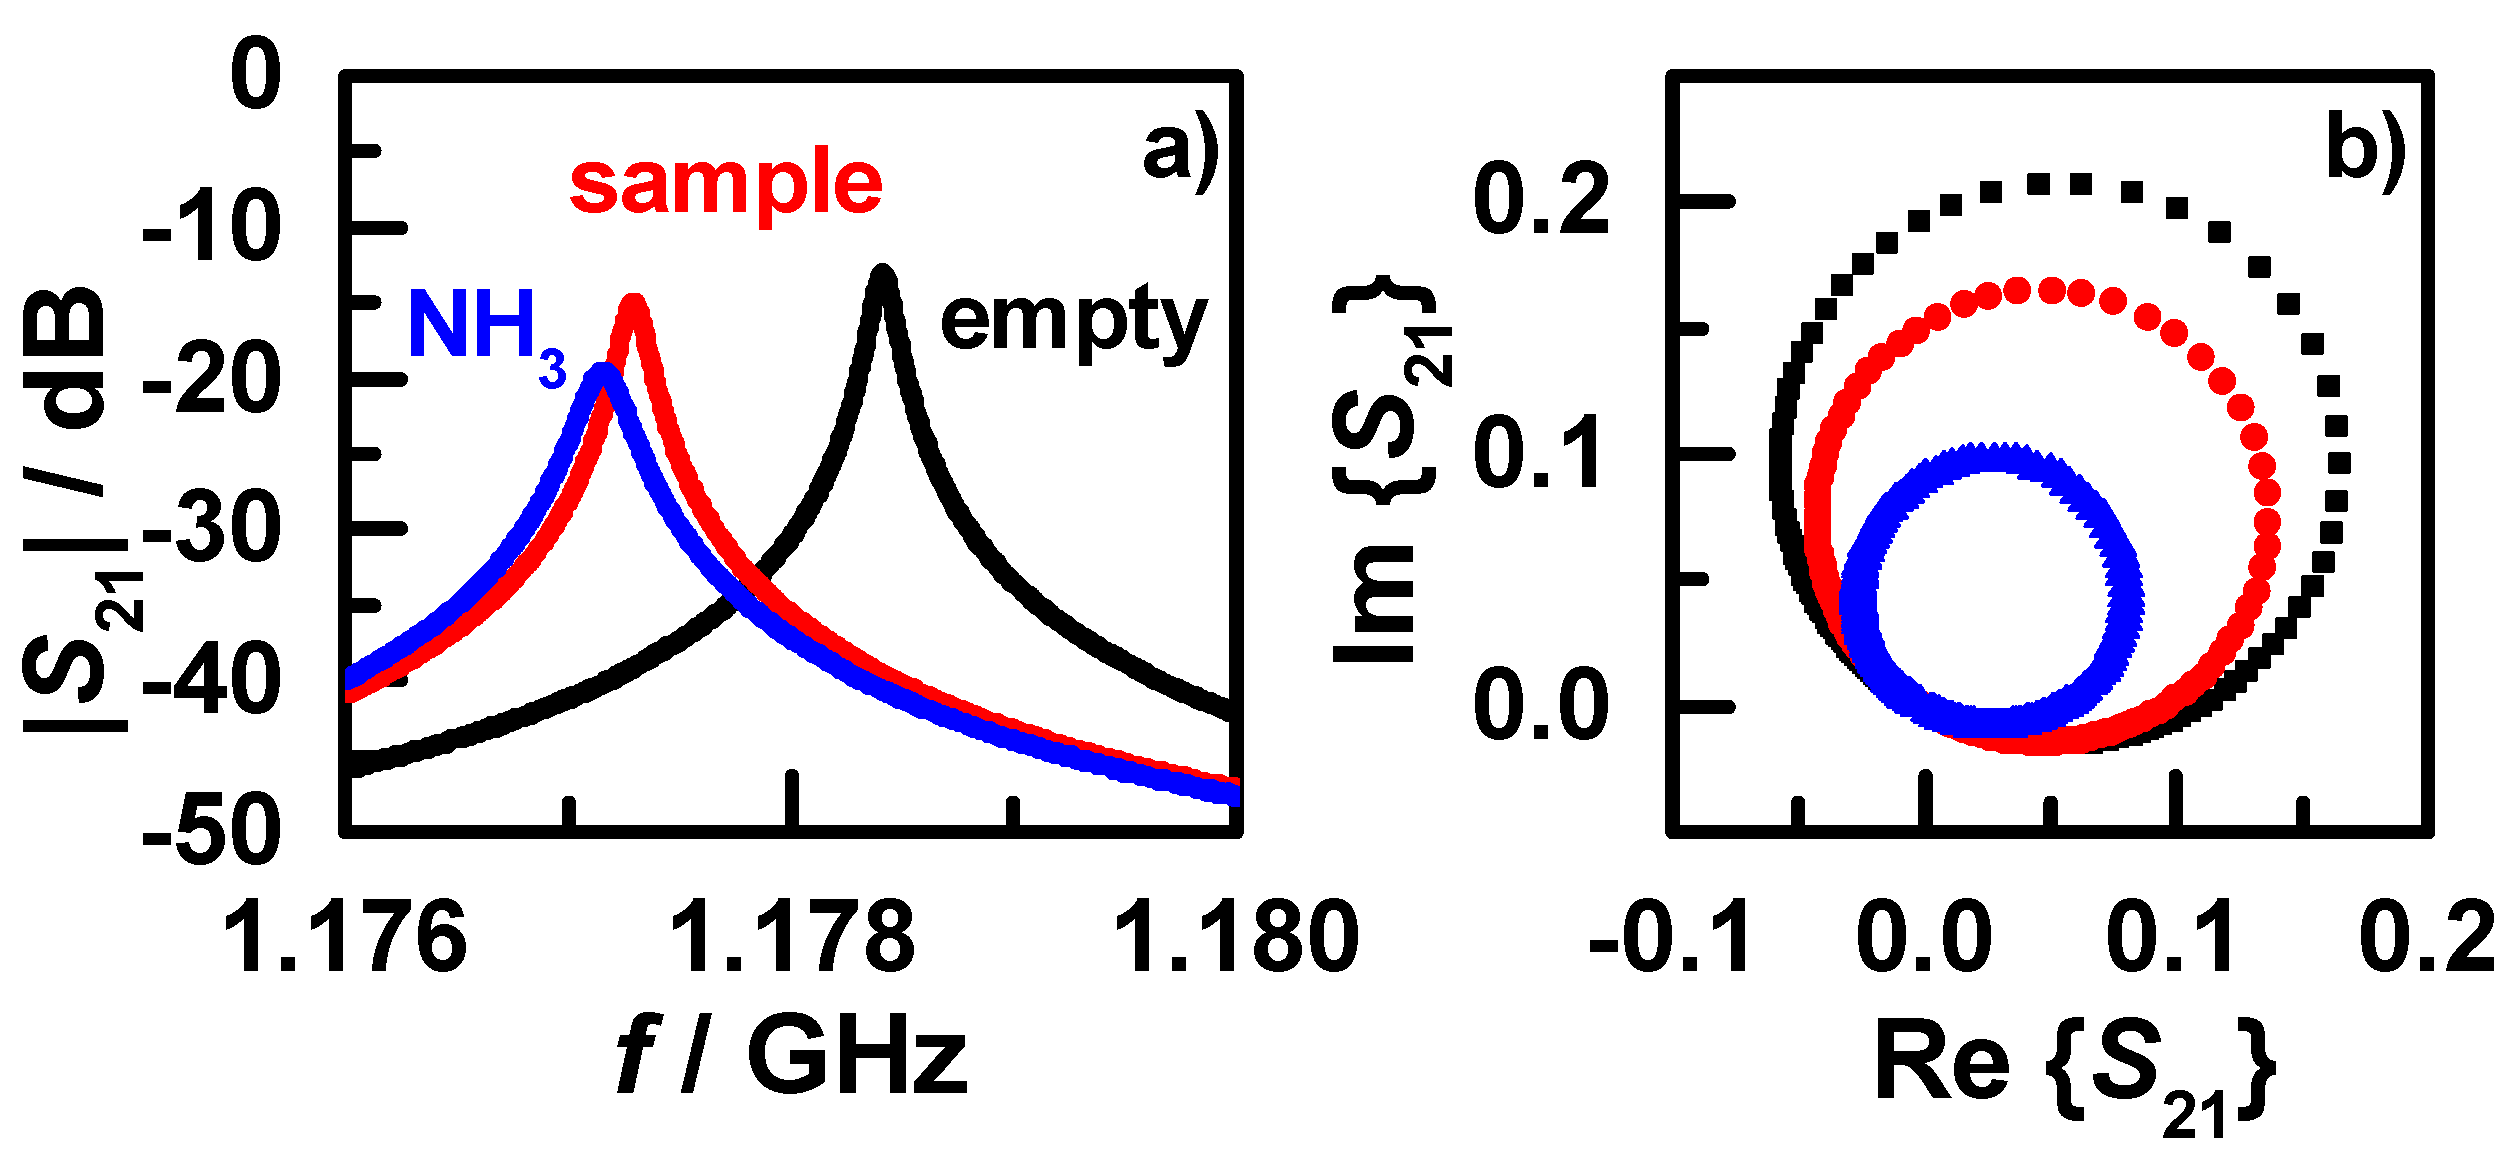
2.2. High-Frequency Impedance Spectroscopy


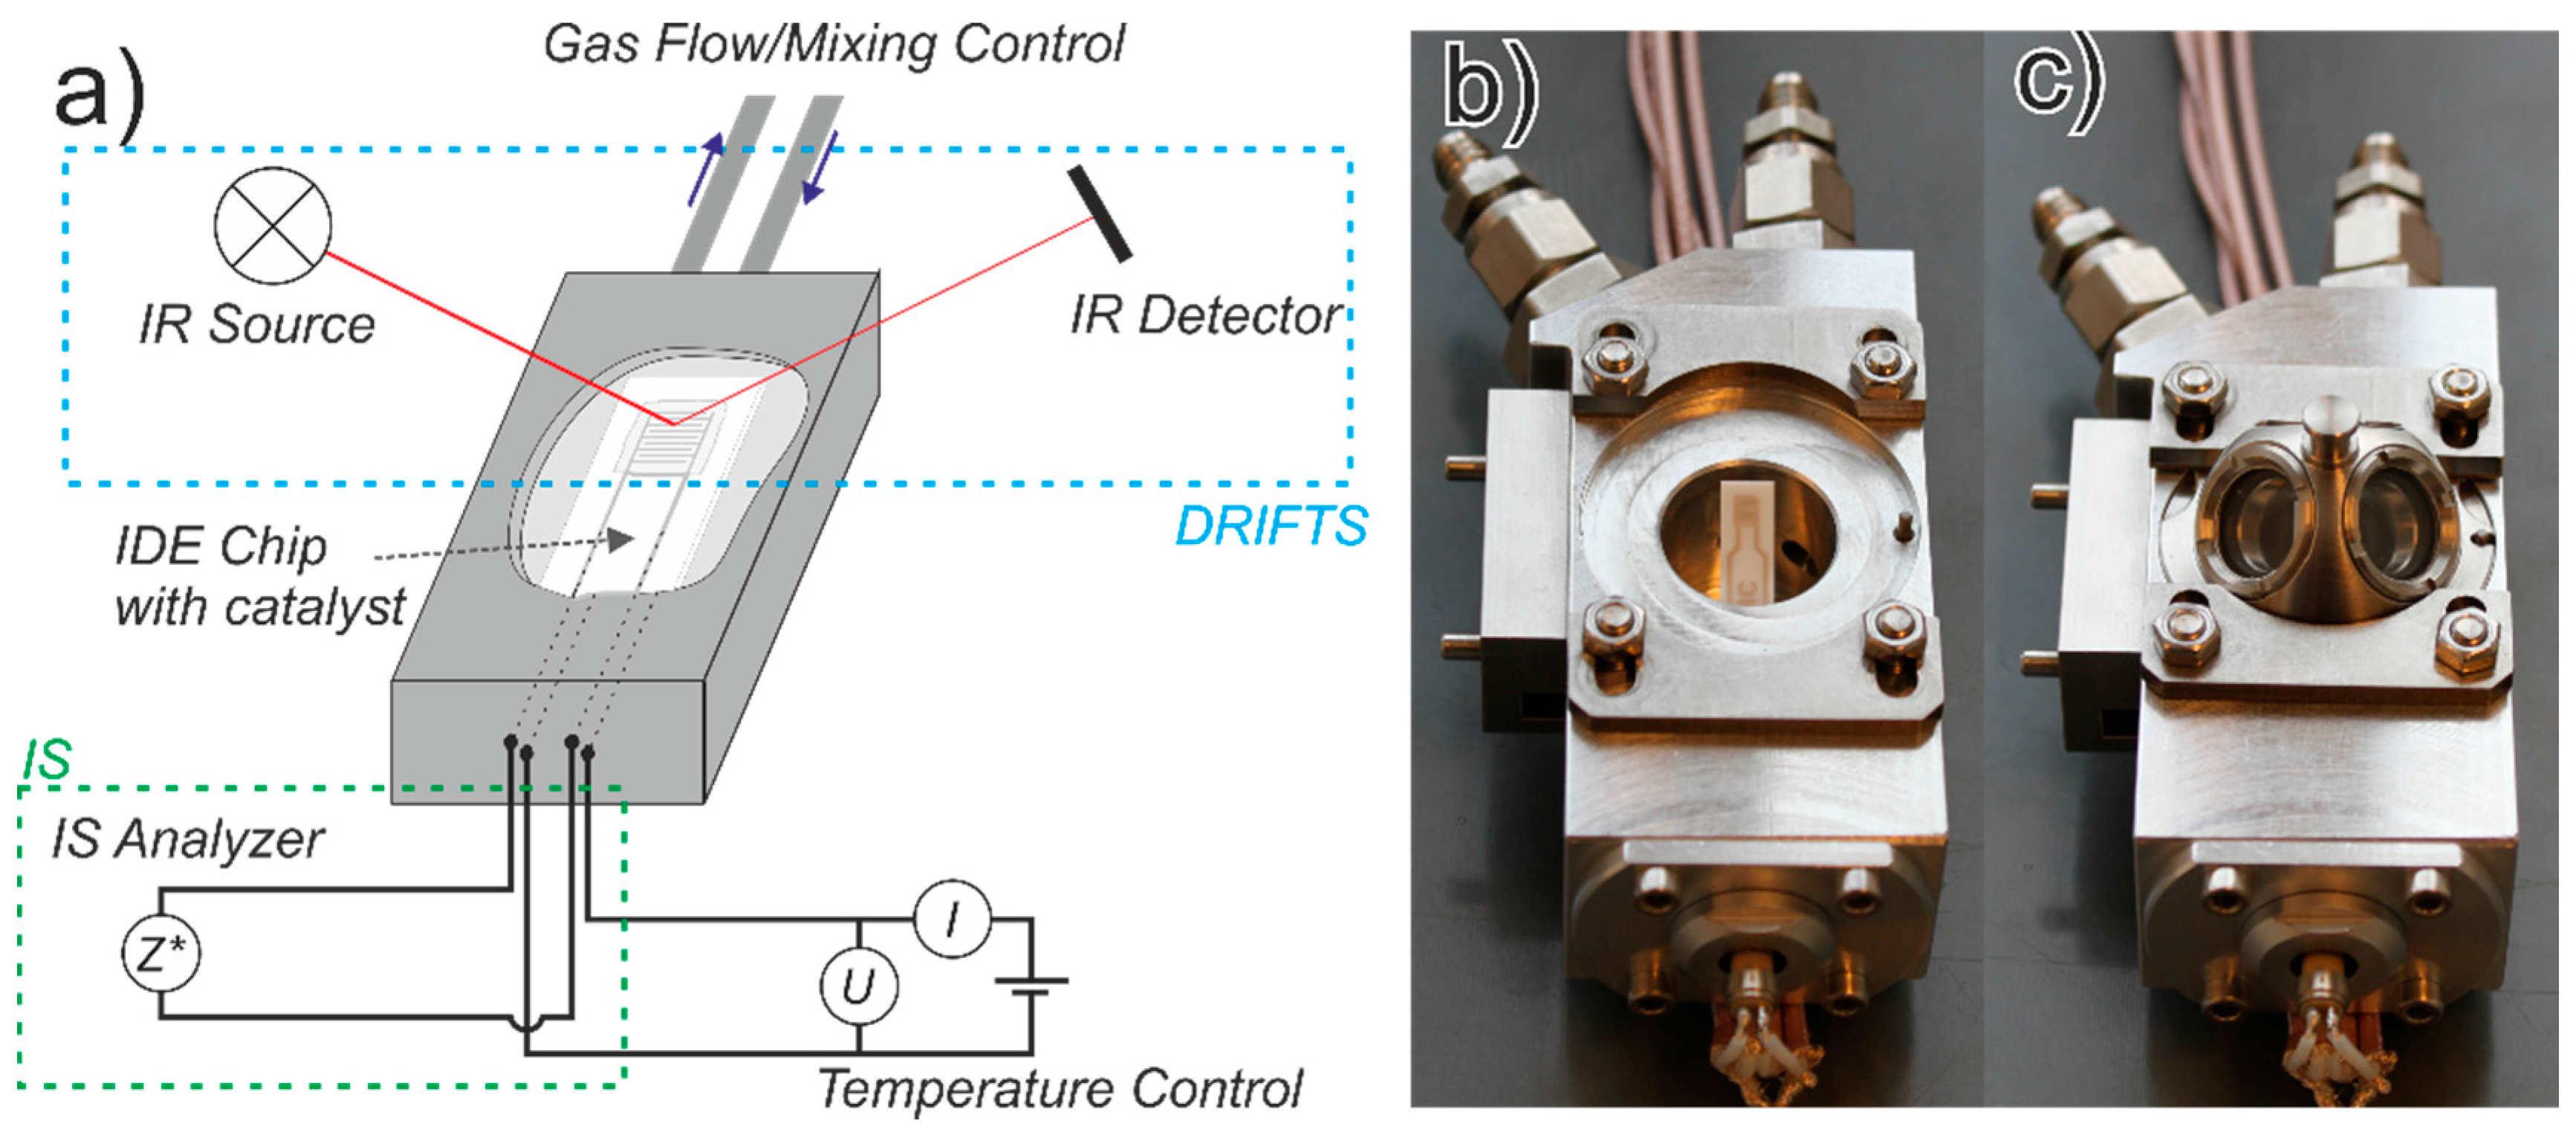
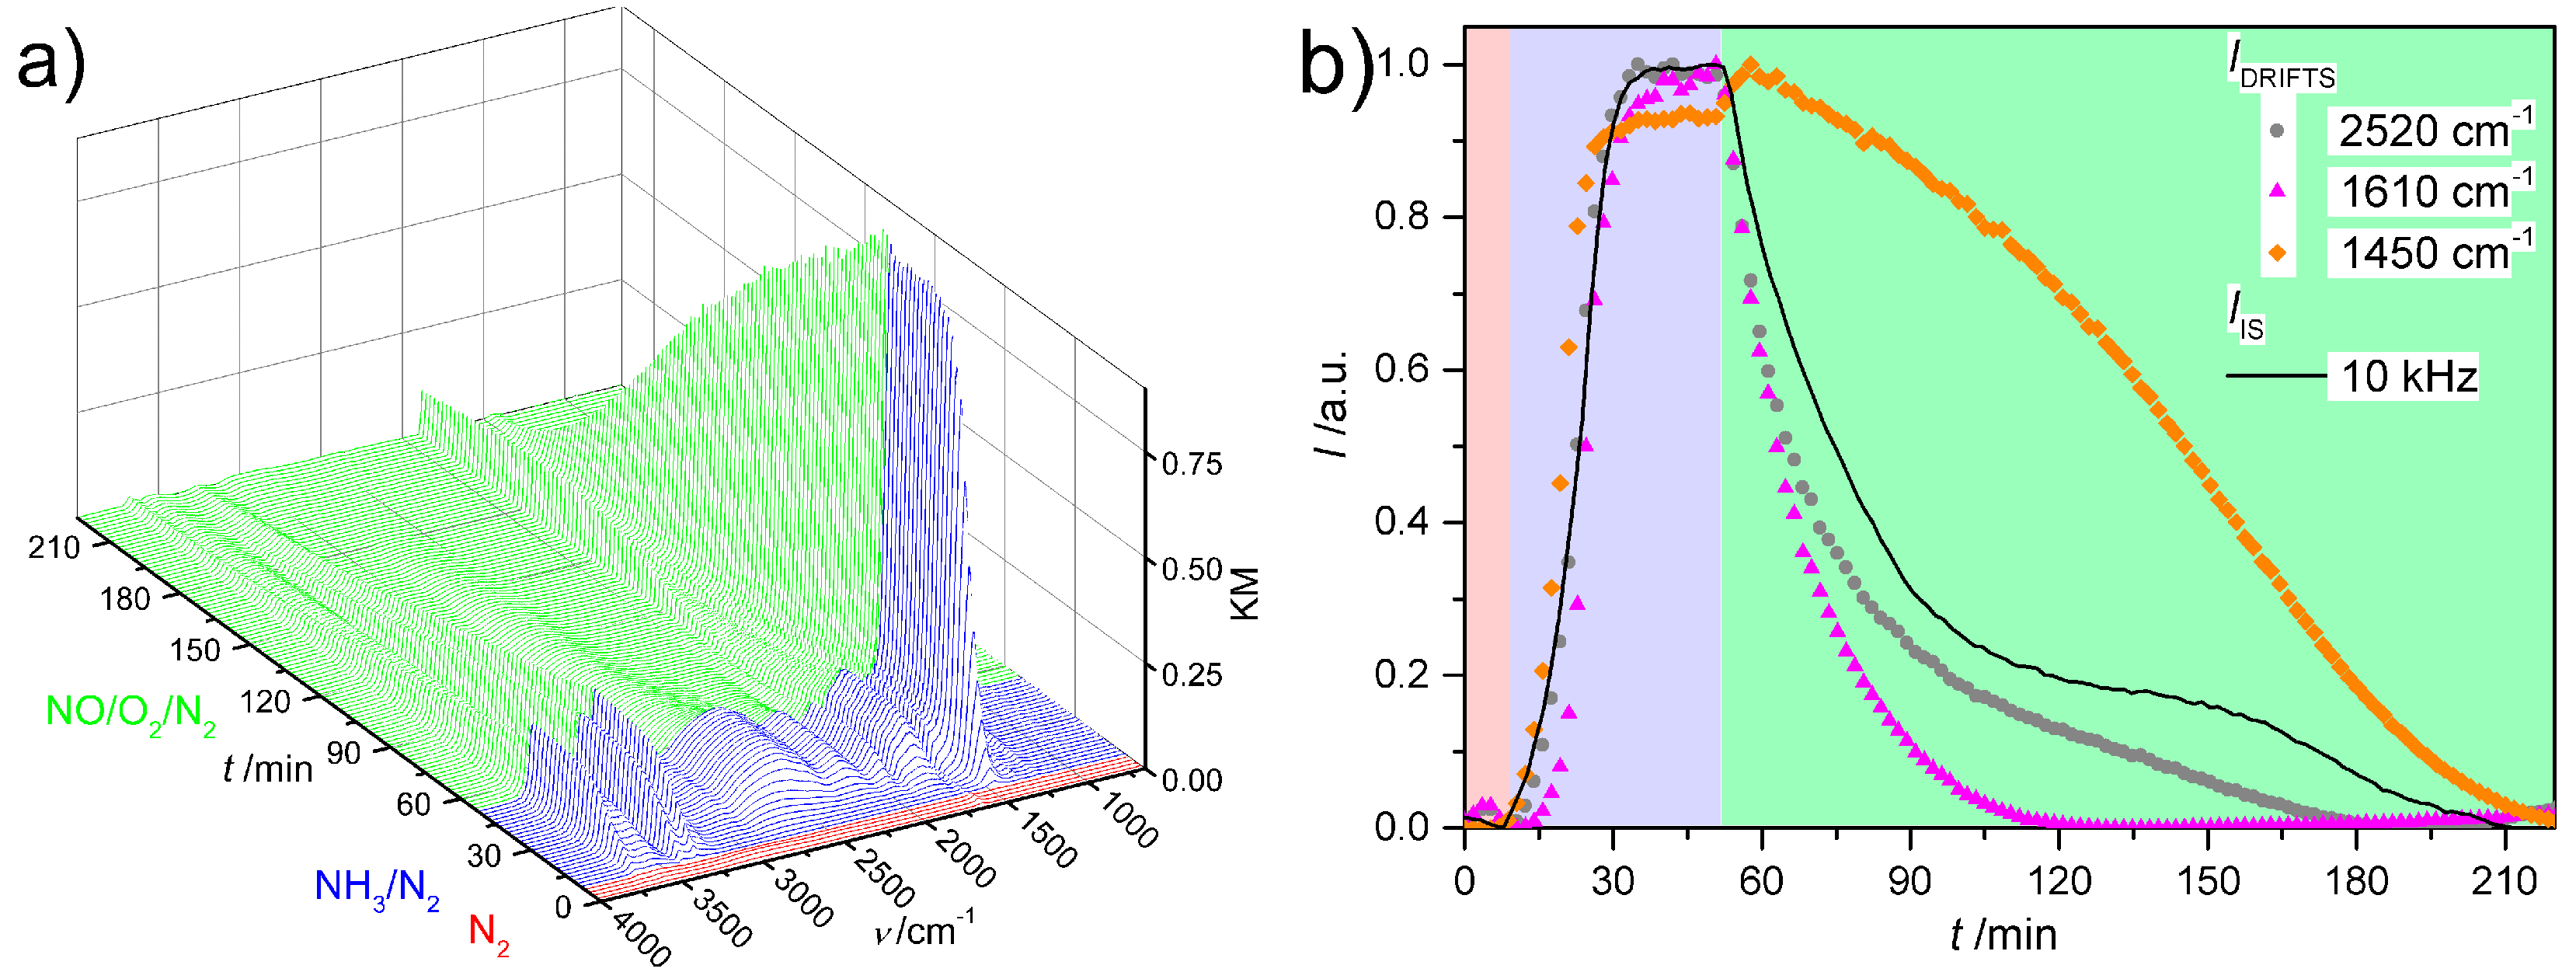
2.3. DRIFT Spectroscopy in Combination with Low-Frequency Impedance Spectroscopy

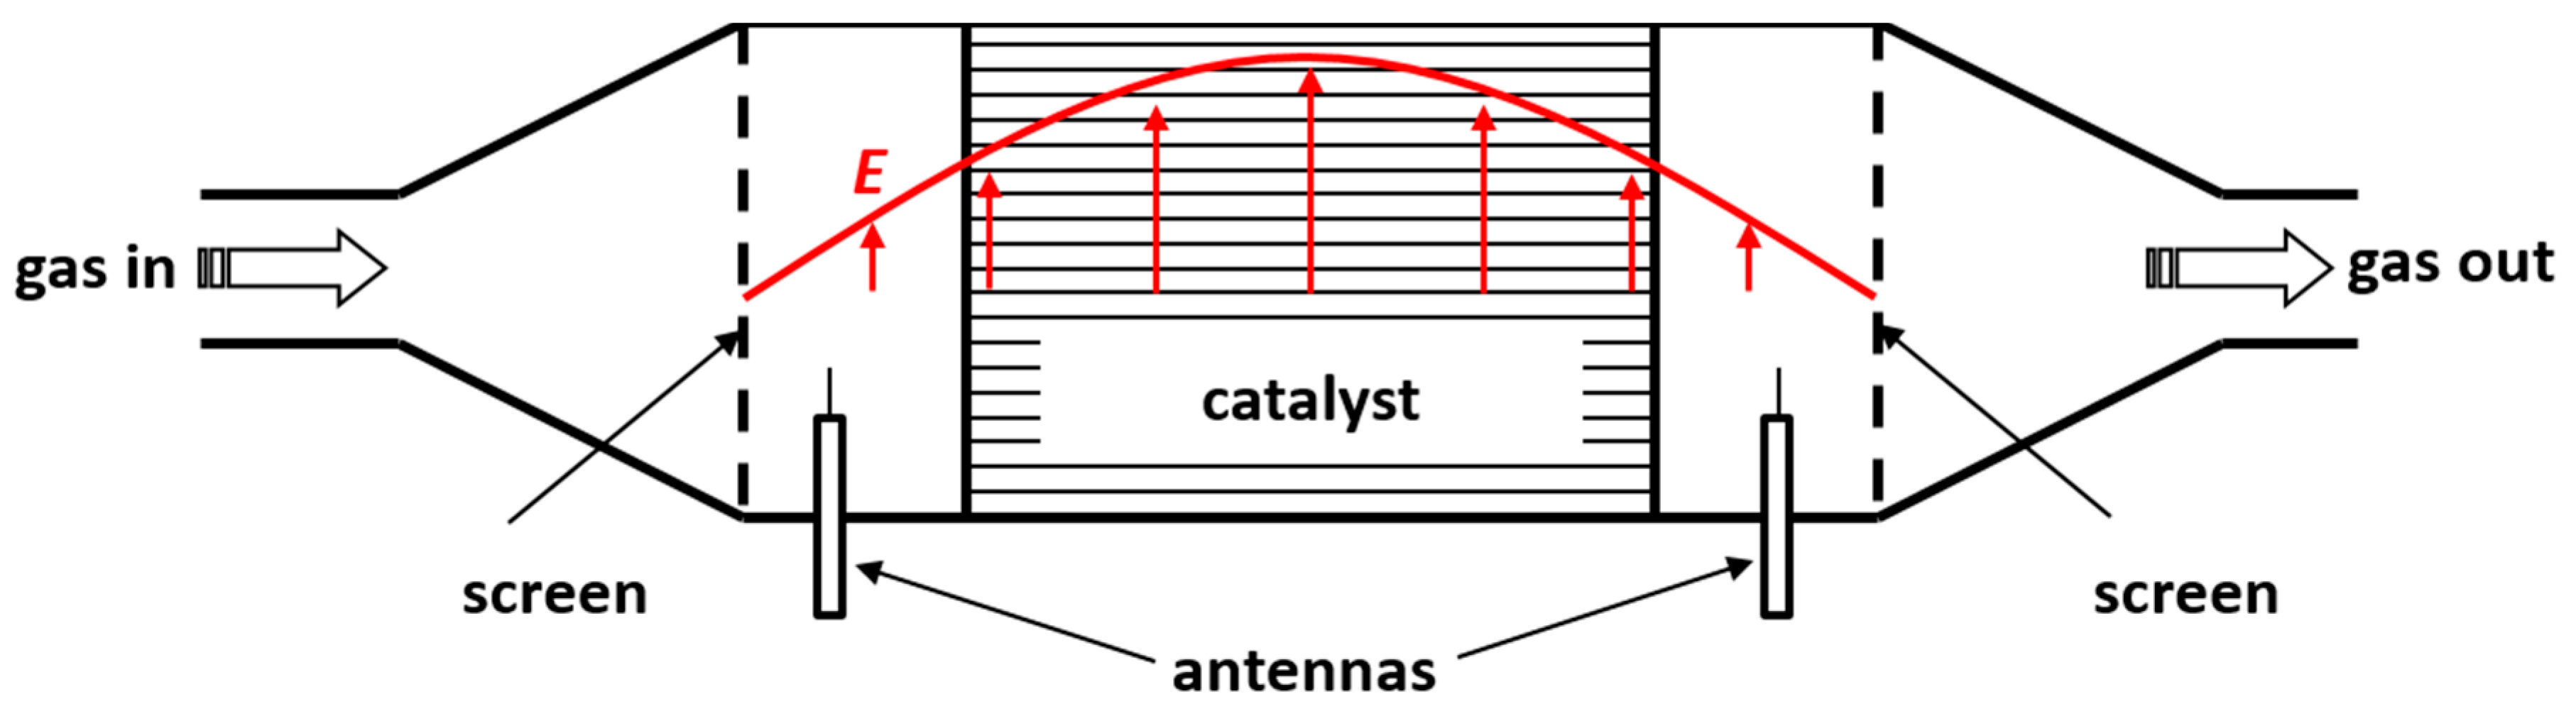
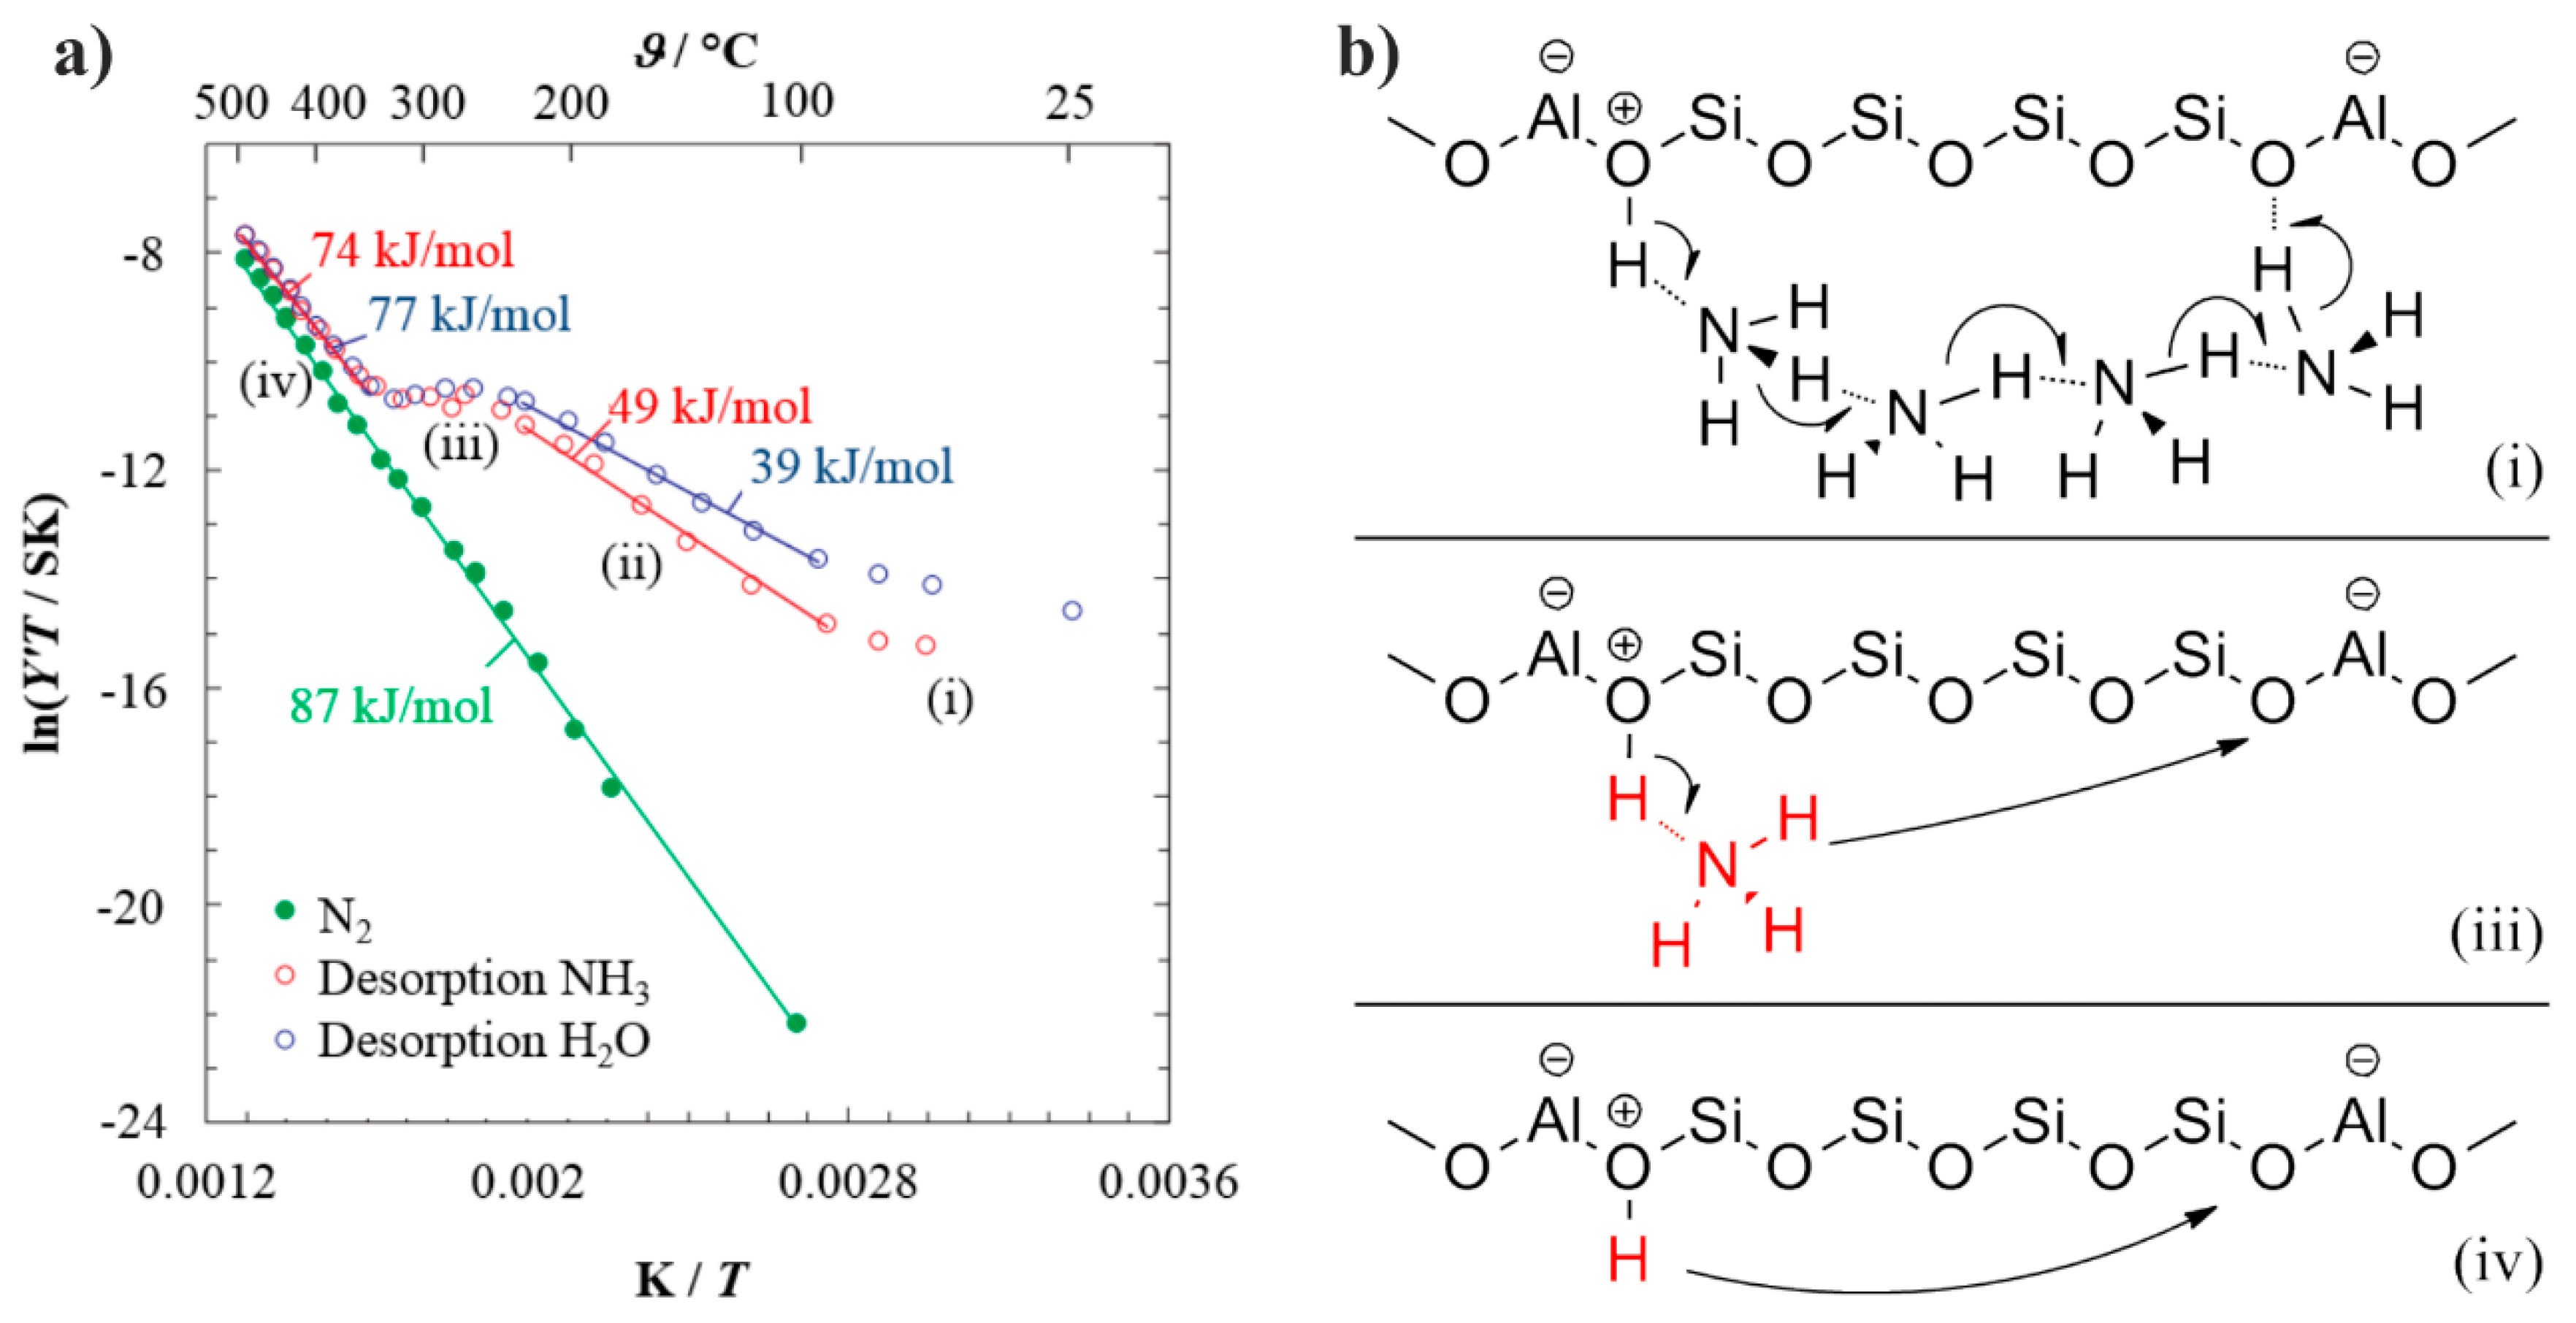
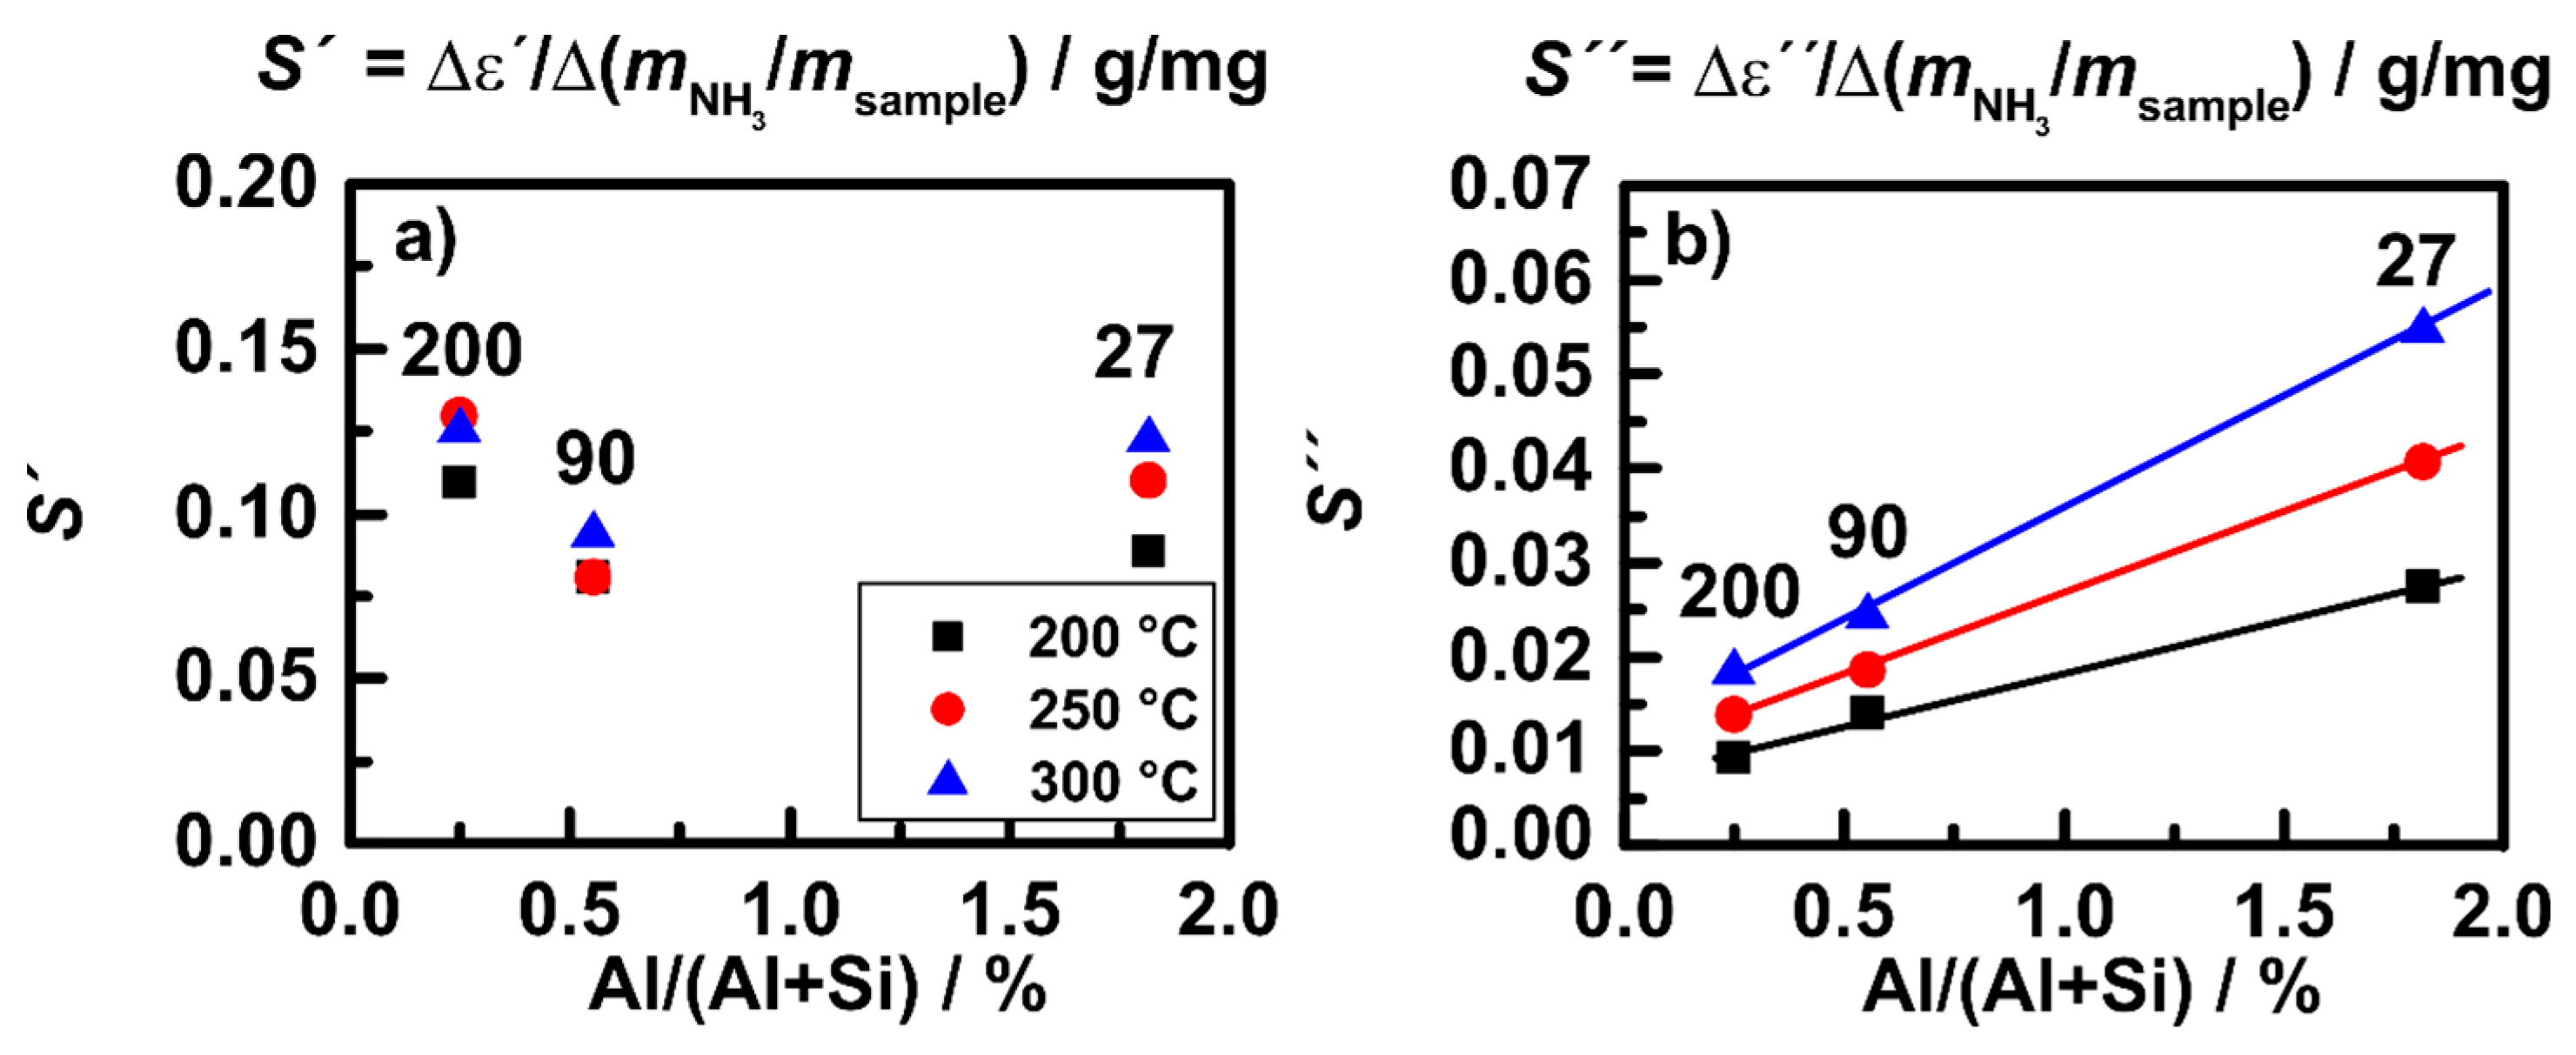
3. Development of Zeolite-Based, Impedimetric Sensors for Automotive Exhaust Gases


4. Future Directions

5. Conclusions
Acknowledgments
Conflicts of Interest
References
- Database of Zeolite Structures. Available online: www.iza-structure.org/databases (accessed on 6 November 2015).
- Laberty-Robert, C.; Valle, K.; Pereira, F.; Sanchez, C. Design and properties of functional hybrid organic-inorganic membranes for fuel cells. Chem. Soc. Rev. 2011, 40, 961–1005. [Google Scholar] [CrossRef] [PubMed]
- Wales, D.J.; Grand, J.; Ting, V.P.; Burke, R.D.; Edler, K.J.; Bowen, C.R.; Mintova, S.; Burrows, A.D. Gas sensing using porous materials for automotive applications. Chem. Soc. Rev. 2015, 44, 4290–4321. [Google Scholar] [CrossRef] [PubMed] [Green Version]
- Zheng, Y.; Li, X.; Dutta, P.K. Exploitation of unique properties of zeolites in the development of gas sensors. Sensors 2012, 12, 5170–5194. [Google Scholar] [CrossRef] [PubMed]
- Habib, E.T. Handbook of Heterogeneous Catalysis, 2nd ed.; Ertl, G., Knozinger, H., Schüth, F., Weitkamp, J., Eds.; Wiley-VCH: Weiheim, Germany, 2008; pp. 2741–2778. [Google Scholar]
- Yeung, K.L.; Han, W. Zeolites and mesoporous materials in fuel cell applications. Catal. Today 2014, 236, 182–205. [Google Scholar] [CrossRef]
- Sahner, K.; Hagen, G.; Schönauer, D.; Reis, S.; Moos, R. Zeolites—Versatile materials for gas sensors. Solid State Ion. 2008, 179, 2416–2423. [Google Scholar] [CrossRef]
- Hagen, G.; Moos, R. Planar zeolite-based potentiometric gas sensors. Sens. Lett. 2011, 9, 110–113. [Google Scholar] [CrossRef]
- Dubbe, A.; Moos, R. Potentiometric hydrocarbon gas sensing characteristics of sodium ion conducting zeolite ZSM-5. Sens. Actuators B Chem. 2008, 130, 546–550. [Google Scholar] [CrossRef]
- Reiß, S.; Hagen, G.; Moos, R. Zeolite-based impedimetric gas sensor device in low-cost technology for hydrocarbon gas detection. Sensors 2008, 8, 7904–7916. [Google Scholar] [CrossRef]
- Hagen, G.; Dubbe, A.; Rettig, F.; Jerger, A.; Birkhofer, T.; Müller, R.; Plog, C.; Moos, R. Selective impedance based gas sensors for hydrocarbons using ZSM-5 zeolite films with chromium(III) oxide interface. Sens. Actuators B Chem. 2006, 119, 441–448. [Google Scholar] [CrossRef]
- Hagen, G.; Dubbe, A.; Fischerauer, G.; Moos, R. Thick-film impedance based hydrocarbon detection based on chromium(III) oxide/zeolite interfaces. Sens. Actuators B Chem. 2006, 118, 73–77. [Google Scholar] [CrossRef]
- Kubinski, D.; Visser, J. Sensor and method for determining the ammonia loading of a zeolite SCR catalyst. Sens. Actuators B Chem. 2008, 130, 425–429. [Google Scholar] [CrossRef]
- Franke, M.; Simon, U. Characteristics of proton hopping in zeolite H-ZSM5. Phys. Status Solidi B 2000, 218, 287–290. [Google Scholar] [CrossRef]
- Simon, U.; Flesch, U.; Maunz, W.; Müller, R.; Plog, C. The effect of NH3 on the ionic conductivity of dehydrated zeolites Na beta and H beta. Microporous Mesoporous Mater. 1998, 21, 111–116. [Google Scholar] [CrossRef]
- Franke, M.E.; Sierka, M.; Simon, U.; Sauer, J. Translational proton motion in zeolite H-ZSM-5. Energy barriers and jump rates from DFT calculations. Phys. Chem. Chem. Phys. 2002, 4, 5207–5216. [Google Scholar] [CrossRef]
- Dubbe, A.; Hagen, G.; Moos, R. Impedance spectroscopy of Na+ conducting zeolite ZSM-5. Solid State Ion. 2006, 177, 2321–2323. [Google Scholar] [CrossRef]
- Franke, M.E.; Simon, U.; Moos, R.; Knezevic, A.; Müller, R.; Plog, C. Development and working principle of an ammonia gas sensor based on a refined model for solvate supported proton transport in zeolites. Phys. Chem. Chem. Phys. 2003, 5, 5195–5198. [Google Scholar] [CrossRef]
- Franke, M.E.; Simon, U. Solvate supported proton transport in zeolites. Chem. Phys. Chem. 2004, 5, 465–472. [Google Scholar] [CrossRef] [PubMed]
- Dietrich, M.; Rauch, D.; Porch, A.; Moos, R. A laboratory test setup for in situ measurements of the dielectric properties of catalyst powder samples under reaction conditions by microwave cavity perturbation: Set up and initial tests. Sensors 2014, 14, 16856–16868. [Google Scholar] [CrossRef] [PubMed]
- Rodriguez-Gonzalez, L.; Rodriguez-Castellon, E.; Jimenez-Lopez, A.; Simon, U. Correlation of TPD and impedance measurements on the desorption of NH3 from zeolite H-ZSM-5. Solid State Ion. 2008, 179, 1968–1973. [Google Scholar] [CrossRef]
- Moos, R.; Wedemann, M.; Spörl, M.; Reiß, S.; Fischerauer, G. Direct catalyst monitoring by electrical means: An overview on promising novel principles. Top. Catal. 2009, 52, 2035–2040. [Google Scholar] [CrossRef]
- Moos, R.; Beulertz, G.; Reiß, S.; Hagen, G.; Fischerauer, G.; Votsmeier, M.; Gieshoff, J. Overview: Status of the microwave-based automotive catalyst state diagnosis. Top. Catal. 2013, 56, 358–364. [Google Scholar] [CrossRef]
- Reiß, S.; Schönauer, D.; Hagen, G.; Fischerauer, G.; Moos, R. Monitoring the ammonia loading of zeolite-based ammonia SCR catalysts by a microwave method. Chem. Eng. Technol. 2011, 34, 791–796. [Google Scholar] [CrossRef]
- Simons, T.; Simon, U. Zeolite H-ZSM-5: A microporous proton conductor for the in situ monitoring of DeNOx-SCR. MRS Proceed. 2011, 1330. [Google Scholar] [CrossRef]
- Simons, T.; Simon, U. Zeolites as nanoporous, gas-sensitive materials for in situ monitoring of DeNOx-SCR. Beilstein J. Nanotechnol. 2012, 3, 667–673. [Google Scholar] [CrossRef] [PubMed]
- Rauch, D.; Kubinski, D.; Simon, U.; Moos, R. Detection of the ammonia loading of a Cu Chabazite SCR catalyst by a radio frequency-based method. Sens. Actuators B Chem. 2014, 205, 88–93. [Google Scholar] [CrossRef]
- Rodríguez-González, L.; Simon, U. NH3-TPD measurements using a zeolite-based sensor. Meas. Sci. Technol. 2010, 21. [Google Scholar] [CrossRef]
- Lezcano-Gonzalez, I.; Deka, U.; Arstad, B.; van Yperen-De Deyne, A.; Hemelsoet, K.; Waroquier, M.; van Speybroeck, V.; Weckhuysen, B.M.; Beale, A.M. Determining the storage, availability and reactivity of NH3 within Cu-chabazite-based ammonia selective catalytic reduction systems. Phys. Chem. Chem. Phys. 2014, 16, 1639–1650. [Google Scholar] [CrossRef] [PubMed]
- Dietrich, M.; Rauch, D.; Simon, U.; Porch, A.; Moos, R. Ammonia storage studies on H-ZSM-5 zeolites by microwave cavity perturbation: Correlation of dielectric properties and ammonia storage. J. Sens. Sens. Syst. 2015, 4, 263–269. [Google Scholar] [CrossRef]
- Rauch, D.; Kubinski, D.; Cavataio, G.; Upadhyay, D.; Moos, R. Ammonia loading detection of zeolite SCR catalysts using a radio frequency based method. SAE Int. J. Engines 2015, 8, 1126–1135. [Google Scholar] [CrossRef]
- Rabinowitsch, E.; Wood, W. Electrical conduction in zeolites. Zeitschrift für Elektrochemie und Angewandte Physikalische Chemie 1933, 39, 562–566. (In German) [Google Scholar]
- Freeman, D.C., Jr.; Stamires, D.N. Electrical conductivity of synthetic crystalline zeolites. J. Chem. Phys. 1961, 35, 799–806. [Google Scholar] [CrossRef]
- Stamires, D.N. Properties of the zeolite, faujasite, substitutional series: A review with new data. Clays Clay Miner. 1973, 21, 379–389. [Google Scholar] [CrossRef]
- Jansen, F.J.; Schoonheydt, R.A. Electrical properties of crystalline synthetic zeolites types X and Y, exchanged with monovalent cations. J. Chem. Soc. Perkin Trans. 1973, 69, 1338–1355. [Google Scholar] [CrossRef]
- Schoonheydt, R.A.; De Wilde, W.; Velghe, F. Conductivity and dielectric dispersions of hydrated and partially hydrated synthetic faujasites. J. Phys. Chem. 1976, 80, 511–518. [Google Scholar] [CrossRef]
- Macdonald, J.R.; Johnson, W.B. Impedance Spectroscopy Theory, Experiment, and Applications; Barsoukov, E., Macdonald, J.R., Eds.; John Wiley& Sons: Hoboken, NJ, USA, 2005; pp. 1–27. [Google Scholar]
- Hibino, T.; Akimoto, T.; Iwahara, H. Protonic conduction of mordenite-type zeolite. Solid State Ion. 1993, 67, 71–76. [Google Scholar] [CrossRef]
- Simon, U.; Flesch, U. Cation-cation interaction in dehydrated zeolites X and Y monitored by modulus spectroscopy. J. Porous Mater. 1999, 6, 33–40. [Google Scholar] [CrossRef]
- Simon, U.; Franke, M.E. Electrical properties of nanoscaled host/guest compounds. Microporous Mesoporous Mater. 2000, 41, 1–36. [Google Scholar] [CrossRef]
- Sierka, M.; Sauer, J. Proton mobility in chabazite, faujasite, and ZSM-5 zeolite catalysts: Comparison based on ab initio calculations. J. Phys. Chem. B 2001, 105, 1603–1613. [Google Scholar] [CrossRef]
- Franke, M.E. Impedance Spectroscopic and Quantum Chemical Investigation of Host/Guest Interactions in H-Form Zeolites. Ph.D. Thesis, RWTH Aachen University: Aachen, Germany, 2002. [Google Scholar]
- Franke, M.E.; Simon, U. Proton mobility in H-ZSM 5 studied by impedance spectroscopy. Solid State Ion. 1999, 119, 311–316. [Google Scholar] [CrossRef]
- Franke, M.E.; Simon, U. Characteristics of proton hopping in Zeolite H-ZSM-5. Phys. Stat. Sol. B 2000, 287, 287–290. [Google Scholar] [CrossRef]
- Rodriguez-Gonzalez, L. Development of a New Method for the Impedance Sensing of the Temperature-Programmed Desorption of Ammonia in H-Form Zeolites. Ph.D. Thesis, RWTH Aachen University, Aachen, Germany, 2007. [Google Scholar]
- Rodríguez-González, L.; Hermes, F.; Bertmer, M.; Rodríguez-Castellon, E.; Jimenez-Lopez, A.; Simon, U. The acid properties of H-ZSM-5 as studied by NH3-TPD and 27Al-MAS-NMR spectroscopy. Appl. Catal. A 2007, 328, 174–182. [Google Scholar] [CrossRef]
- Moos, R.; Müller, R.; Plog, C.; Knezevic, A.; Leye, H.; Irion, E.; Braun, T.; Marquardt, K.-J.; Binder, K. Selective ammonia exhaust gas sensor for automotive applications. Sens. Actuators B Chem. 2002, 83, 181–189. [Google Scholar] [CrossRef]
- Anderson, P.A.; Armstrong, A.R.; Barker, P.D.; Edmondson, M.J.; Edwards, P.P.; Porch, A. Rubidium doped zeolite RHO: Structure and microwave conductivity of a metallic zeolite. Dalton Trans. 2004, 19, 3122–3128. [Google Scholar] [CrossRef] [PubMed]
- Anderson, P.A.; Armstrong, A.R.; Porch, A.; Edwards, P.P.; Woodall, L.J. Structure and electronic properties of potassium-loaded zeolite L. J. Phys. Chem. B 1997, 101, 9892–9900. [Google Scholar] [CrossRef]
- Eichelbaum, M.; Stosser, R.; Karpov, A.; Dobner, C.K.; Rosowski, F.; Trunschke, A.; Schlögl, R. The microwave cavity perturbation technique for contact-free and in situ electrical conductivity measurements in catalysis and materials science. Phys. Chem. Chem. Phys. 2012, 14, 1302–1312. [Google Scholar] [CrossRef] [PubMed]
- Heine, C.; Girgsdies, F.; Trunschke, A.; Schlögl, R.; Eichelbaum, M. The model oxidation catalyst α-V2O5: Insights from contactless in situ microwave permittivity and conductivity measurements. Appl. Phys. A 2013, 112, 289–296. [Google Scholar] [CrossRef]
- Chen, L.F.; Ong, C.K.; Neo, C.P.; Varadan, V.V.; Varadan, V.K. Microwave Electronics, Measurement and Materials Characterization; John Wiley & Sons: New York, NY, USA, 2004. [Google Scholar]
- Porch, A.; Slocombe, D.; Beutler, J.; Edwards, P.; Aldawsari, A.; Xiao, T.; Kuznetsov, V.; Almegren, H.; Aldrees, S.; Almaqati, N. Microwave treatment in oil refining. Appl. Petrochem. Res. 2012, 2, 37–44. [Google Scholar] [CrossRef]
- Inoue, R.; Miwa, K.; Kitano, H.; Maeda, A.; Odate, Y.; Tanabe, E. Highly accurate and real-time determination of resonant characteristics: Complex linear regression of the transmission coefficient. IEEE Trans. Microw. Theory Technol. 2004, 52, 2163–2168. [Google Scholar] [CrossRef]
- Leong, K.; Mazierska, J. Precise measurements of the Q factor of dielectric resonators in the transmission mode-accounting for noise, crosstalk, delay of uncalibrated lines, coupling loss, and coupling reactance. IEEE Trans. Microw. Theory Technol. 2002, 50, 2115–2127. [Google Scholar] [CrossRef]
- Moos, R. Microwave-Based Catalyst State Diagnosis—State of the Art and Future Perspectives. SAE Int. J. Engines 2015, 8, 1240–1245. [Google Scholar] [CrossRef]
- Sappok, A.; Bromberg, L.; Parks, J.E.; Prikhodko, V. Loading and Regeneration Analysis of a Diesel Particulate Filter with a Radio Frequency-Based Sensor. SAE Tech. Pap. 2010. [Google Scholar] [CrossRef]
- Sappok, A.; Bromberg, L. Radio frequency diesel particulate filter soot and ash level sensors: Enabling adaptive controls for heavy-duty diesel applications. SAE Int. J. Commer. Veh. 2014, 7, 468–477. [Google Scholar] [CrossRef]
- Feulner, M.; Hagen, G.; Piontkowski, A.; Müller, A.; Fischerauer, G.; Brüggemann, D.; Moos, R. In-operation monitoring of the soot load of diesel particulate filters: Initial tests. Top. Catal. 2013, 56, 483–488. [Google Scholar] [CrossRef]
- Reiß, S.; Wedemann, M.; Spörl, M.; Fischerauer, G.; Moos, R. Effects of H2O, CO2, CO, and flow rates on the RF-based monitoring of three-way catalysts. Sens. Lett. 2011, 9, 316–320. [Google Scholar] [CrossRef]
- Beulertz, G.; Fritsch, M.; Fischerauer, G.; Herbst, F.; Gieshoff, J.; Votsmeier, M.; Hagen, G.; Moos, R. Microwave cavity perturbation as a tool for laboratory in situ measurement of the oxidation state of three way catalysts. Top. Catal. 2013, 56, 405–409. [Google Scholar] [CrossRef]
- Beulertz, G.; Votsmeier, M.; Moos, R. Effect of propene, propane, and methane on conversion and oxidation state of three-way catalysts: A microwave cavity perturbation study. Appl. Catal. B 2015, 165, 369–377. [Google Scholar] [CrossRef]
- Dietrich, M.; Jahn, C.; Lanzerath, P.; Moos, R. Microwave based oxidation state and soot loading determination on gasoline particulate filters with three-way catalyst coating for homogenously operated gasoline engines. Sensors 2015, 15, 21971–21988. [Google Scholar] [CrossRef] [PubMed]
- Fremerey, P.; Reiß, S.; Geupel, A.; Fischerauer, G.; Moos, R. Determination of the NOx loading of an automotive lean NOx trap by directly monitoring the electrical properties of the catalyst material itself. Sensors 2011, 11, 8261–8280. [Google Scholar] [CrossRef] [PubMed]
- Nanjundaswamy, H.; Nagaraju, V.; Wu, Y.; Koehler, E.; Sappok, A.; Ragaller, P.; Bromberg, L. Advanced RF particulate filter sensing and controls for efficient aftertreatment management and reduced fuel consumption. SAE Tech. Pap. 2015. [Google Scholar] [CrossRef]
- Zaera, F. New advances in the use of infrared absorption spectroscopy for the characterization of heterogeneous catalytic reactions. Chem. Soc. Rev. 2014, 43, 7624–7663. [Google Scholar] [CrossRef] [PubMed]
- Simons, T.; Chen, P.; Rauch, D.; Moos, R.; Simon, U. Sensing catalytic conversion: simultaneous DRIFT and impedance spectroscopy for in situ monitoring of DeNOx-SCR on zeolites. Sens. Actuators B Chem. 2015. [Google Scholar] [CrossRef]
- Simon, U.; Sanders, D.; Jockel, J.; Heppel, C.; Brinz, T. Design strategies for multielectrode arrays applicable for high-throughput impedance spectroscopy on novel gas sensor materials. J. Comb. Chem. 2002, 4, 511–515. [Google Scholar] [CrossRef] [PubMed]
- Neumeier, S.; Echterhof, T.; Bölling, R.; Pfeifer, H.; Simon, U. Zeolite based trace humidity sensor for high temperature applications in hydrogen atmosphere. Sens. Actuators B Chem. 2008, 134, 171–174. [Google Scholar] [CrossRef]
- Zhao, Y.; Hu, J.; Hua, L.; Shuai, S.; Wang, J. Ammonia storage and slip in a urea selective catalytic reduction catalyst under steady and transient conditions. Ind. Eng. Chem. Res. 2011, 50, 11863–11871. [Google Scholar] [CrossRef]
- Simons, T. Impedence spectroscopy as a method for the in situ monitoring of DeNOx-SCR reaction on zeolites and related materials; Apprimus-Verlag: Aachen, Germany, 2015. (In German) [Google Scholar]
- He, Z.; Phan, H.; Liu, J.; Nguyen, T.Q.; Tan, T.T. Understanding TiO2 size-dependent electron transport properties of a graphene-TiO2 photoanode in dye-sensitized solar cells using conducting atomic force microscopy. Adv. Mater. 2013, 25, 6900–6904. [Google Scholar] [CrossRef] [PubMed]
- Serrano-Ramon, L.; Cordoba, R.; Rodriguez, L.A.; Magen, C.; Snoeck, E.; Gatel, C.; Serrano, I.; Ibarra, M.R.; de Teresa, J.M. Ultrasmall functional ferromagnetic nanostructures grown by focused electron-beam-induced deposition. ACS Nano 2011, 5, 7781–7787. [Google Scholar] [CrossRef] [PubMed]
- Saltzmann, T.; Bornhofft, M.; Mayer, J.; Simon, U. Shape without structure: An intriguing formation mechanism in the solvothermal synthesis of the phase-change material Sb2Te3. Angew. Chem. Int. Ed. 2015, 54, 6632–6636. [Google Scholar] [CrossRef] [PubMed]
- Timper, J.; Gutsmiedl, K.; Wirges, C.; Broda, J.; Noyong, M.; Mayer, J.; Carell, T.; Simon, U. Surface “click” reaction of DNA followed by directed metalization for the construction of contactable conducting nanostructures. Angew. Chem. Int. Ed. 2012, 51, 7586–7588. [Google Scholar] [CrossRef] [PubMed]
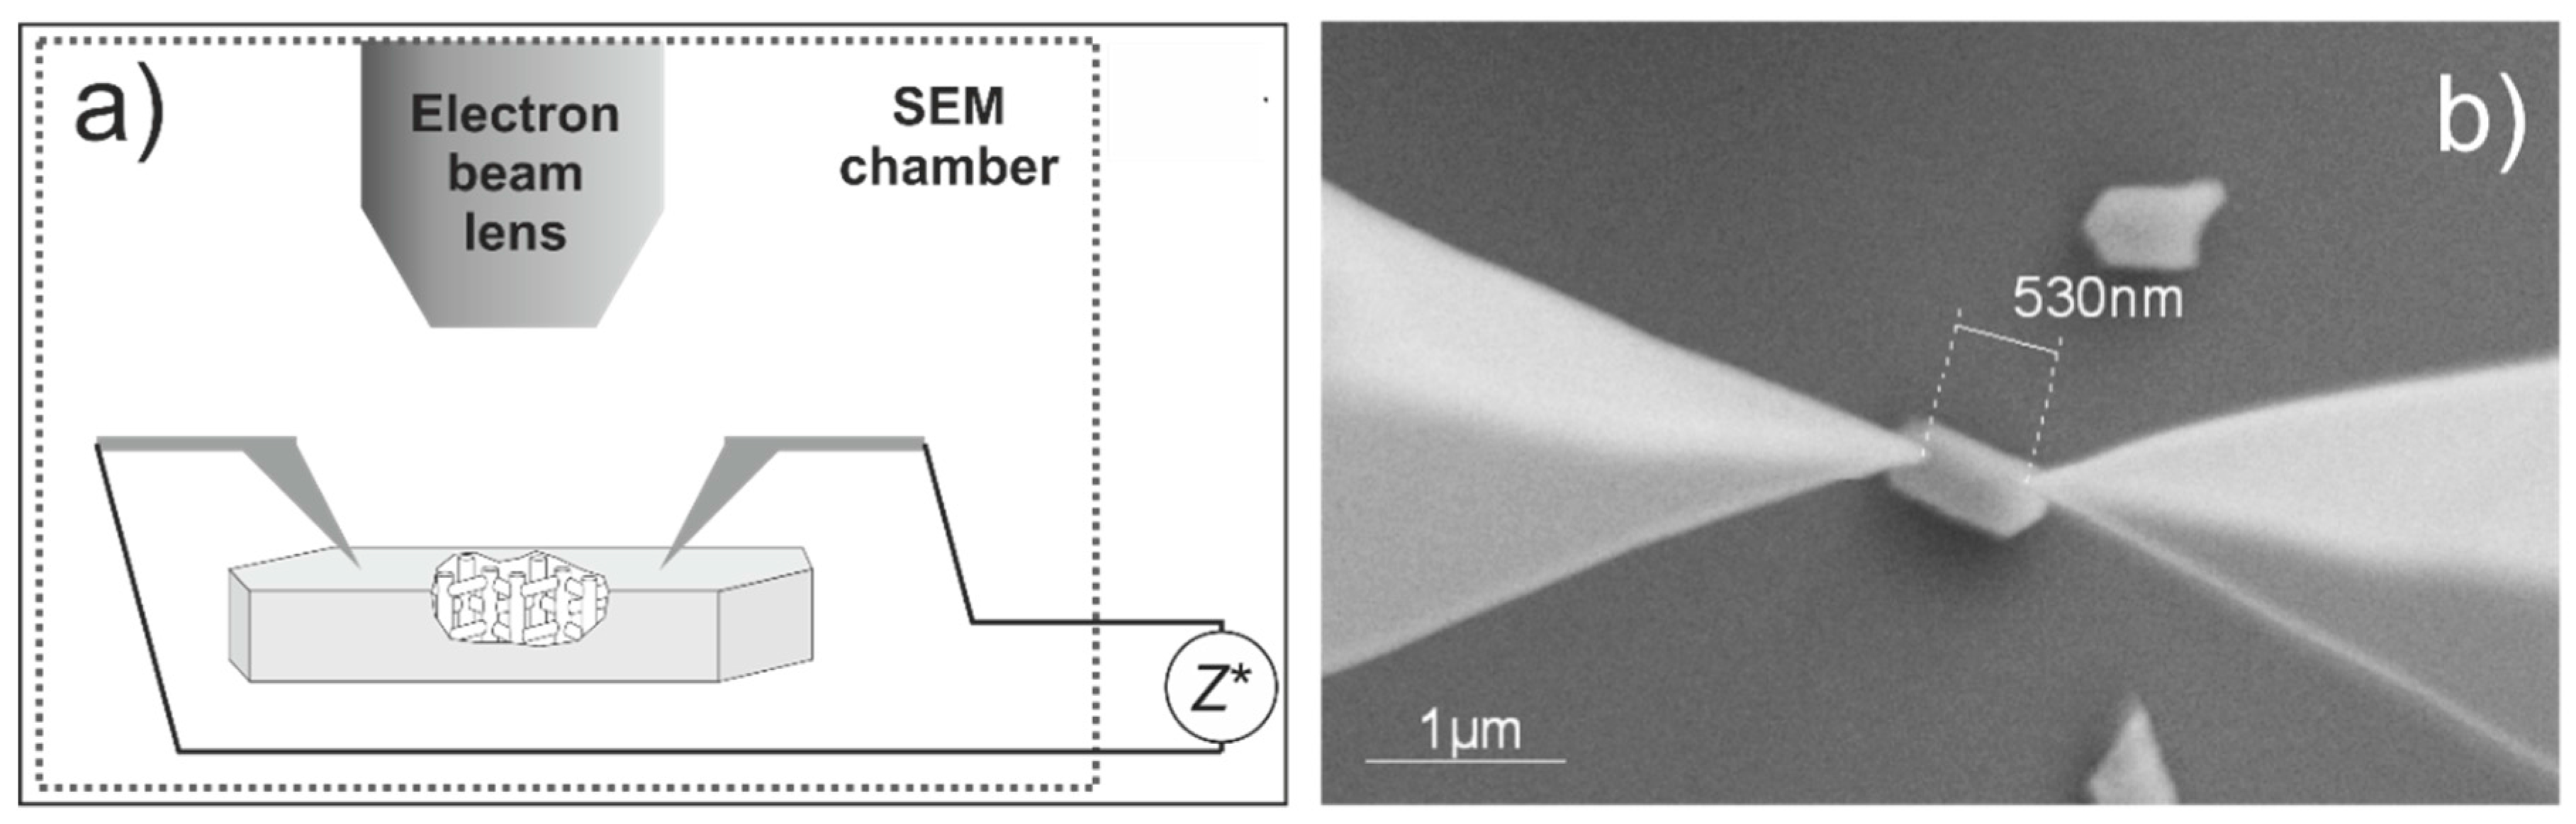
- Noyong, M.; Blech, K.; Rosenberger, A.; Klocke, V.; Simon, U. In situ nanomanipulation system for electrical measurements in SEM. Meas. Sci. Technol. 2007, 18, N84–N89. [Google Scholar] [CrossRef]
- Schmidt, D.O.; Hoffmann-Eifert, S.; Zhang, H.; Torre, C.; Besmehn, A.; Noyong, M.; Waser, R.; Simon, U. Resistive switching of individual, chemically synthesized TiO2 nanoparticles. Small 2015. [Google Scholar] [CrossRef] [PubMed]
- Hanft, D.; Exner, J.; Schubert, M.; Stöcker, T.; Fuierer, P.; Moos, R. An overview of the aerosol deposition method: Process fundamentals and new trends in materials applications. J. Ceram. Sci. Technol. 2015, 6, 147–182. [Google Scholar]
© 2015 by the authors; licensee MDPI, Basel, Switzerland. This article is an open access article distributed under the terms and conditions of the Creative Commons Attribution license (http://creativecommons.org/licenses/by/4.0/).
Share and Cite
Chen, P.; Schönebaum, S.; Simons, T.; Rauch, D.; Dietrich, M.; Moos, R.; Simon, U. Correlating the Integral Sensing Properties of Zeolites with Molecular Processes by Combining Broadband Impedance and DRIFT Spectroscopy—A New Approach for Bridging the Scales. Sensors 2015, 15, 28915-28941. https://0-doi-org.brum.beds.ac.uk/10.3390/s151128915
Chen P, Schönebaum S, Simons T, Rauch D, Dietrich M, Moos R, Simon U. Correlating the Integral Sensing Properties of Zeolites with Molecular Processes by Combining Broadband Impedance and DRIFT Spectroscopy—A New Approach for Bridging the Scales. Sensors. 2015; 15(11):28915-28941. https://0-doi-org.brum.beds.ac.uk/10.3390/s151128915
Chicago/Turabian StyleChen, Peirong, Simon Schönebaum, Thomas Simons, Dieter Rauch, Markus Dietrich, Ralf Moos, and Ulrich Simon. 2015. "Correlating the Integral Sensing Properties of Zeolites with Molecular Processes by Combining Broadband Impedance and DRIFT Spectroscopy—A New Approach for Bridging the Scales" Sensors 15, no. 11: 28915-28941. https://0-doi-org.brum.beds.ac.uk/10.3390/s151128915