
Electronic Tongue Response to Chemicals in Orange Juice that Change Concentration in Relation to Harvest Maturity and Citrus Greening or Huanglongbing (HLB) Disease

 ,
,
Abstract
:1. Introduction
2. Materials and Methods
2.1. Chemicals
2.2. Base Orange Juice
2.3. Field Orange Juice
2.4. Sugar, Acid and Salt Spiking of Orange Juice
2.5. Secondary Metabolite Spiking of Orange Juice
2.6. Electronic Tongue Analysis
2.7. Determination of the Chemical Composition of Base Juice
2.8. Sensory Analysis
3. Results and Discussion

| Compound | Average Concentration | Standard Deviation |
|---|---|---|
| g/100 mL juice | ||
| Sucrose | 4 | 0.1 |
| Citric Acid | 1.2 | 0.2 |
| Potassium | 0.18 | 0.04 |
| µg/mL juice | ||
| Nomilin | 0.2 | 0.1 |
| Limonin | 1.7 | 0.4 |
| Limonin Glucoside | 155.4 | 5.9 |
| Hesperidin | 268.8 | 27.2 |
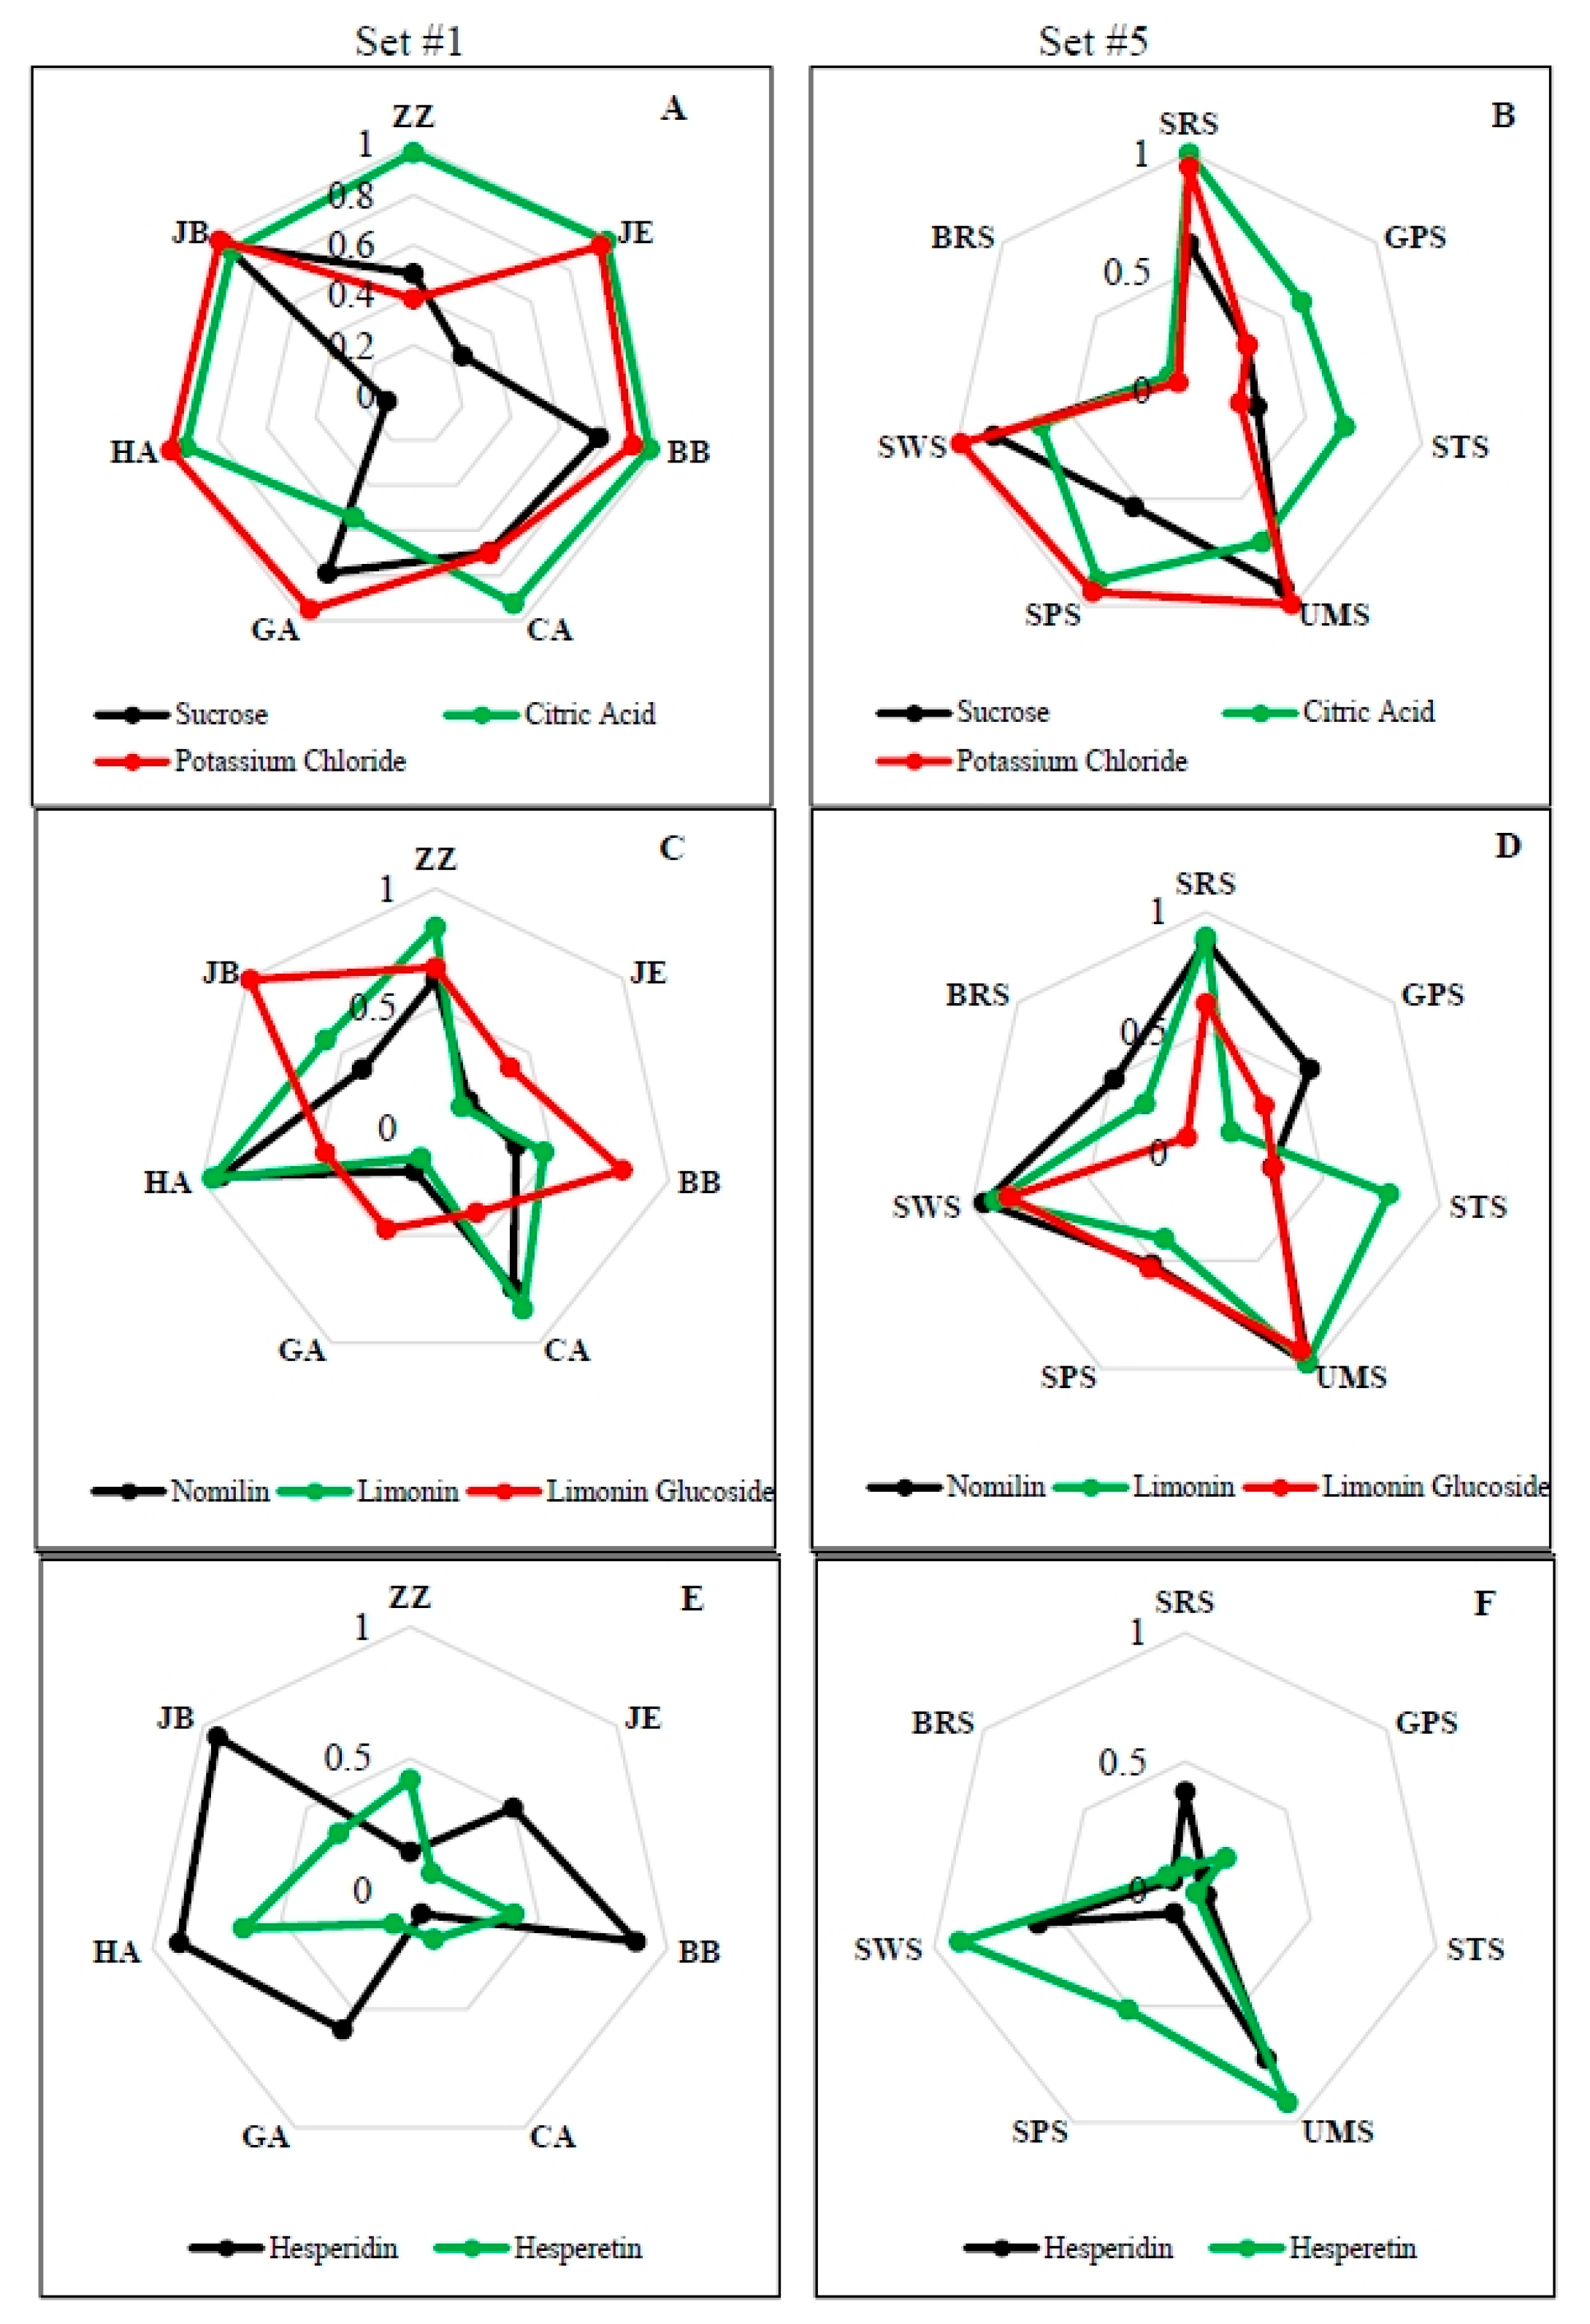
3.1. E-Tongue Analysis of Orange Juice Spiked with Sugars, Acids and Salt

| Sucrose | Citric Acid | Potassium Chloride | ||||||
| Base Juice | Spiked Juices | Distances SS#1/#5 | Base Juice | Spiked Juices | Distances SS#1/#5 | Base Juice | Spiked Juices | Distances SS#1/#5 |
| 0 | 0.2 | 35/176 | 0 | 0.1 | 134/68 | 0 | 0.1 | 101/86 |
| 0 | 0.4 | 49/152 | 0 | 0.2 | 143/135 | 0 | 0.2 | 127/124 |
| 0 | 0.6 | 73/180 | 0 | 0.4 | 131/171 | 0 | 0.3 | 147/169 |
| 0 | 1 | 45/170 | 0 | 0.6 | 117/226 | 0 | 0.4 | 157/254 |
| 0 | 2 | 58/154 | 0 | 0.8 | 117/264 | 0 | 0.5 | 162/232 |
| 0 | 3 | 78/185 | 0 | 1 | 131/321 | 0 | 1 | 169/380 |
| 0 | 4 | 26/146 | 0 | 2 | 196/382 | 0 | 2 | 182/549 |
| 0 | 5 | 56/186 | 0 | 3 | 272/494 | 0 | 3 | 204/684 |
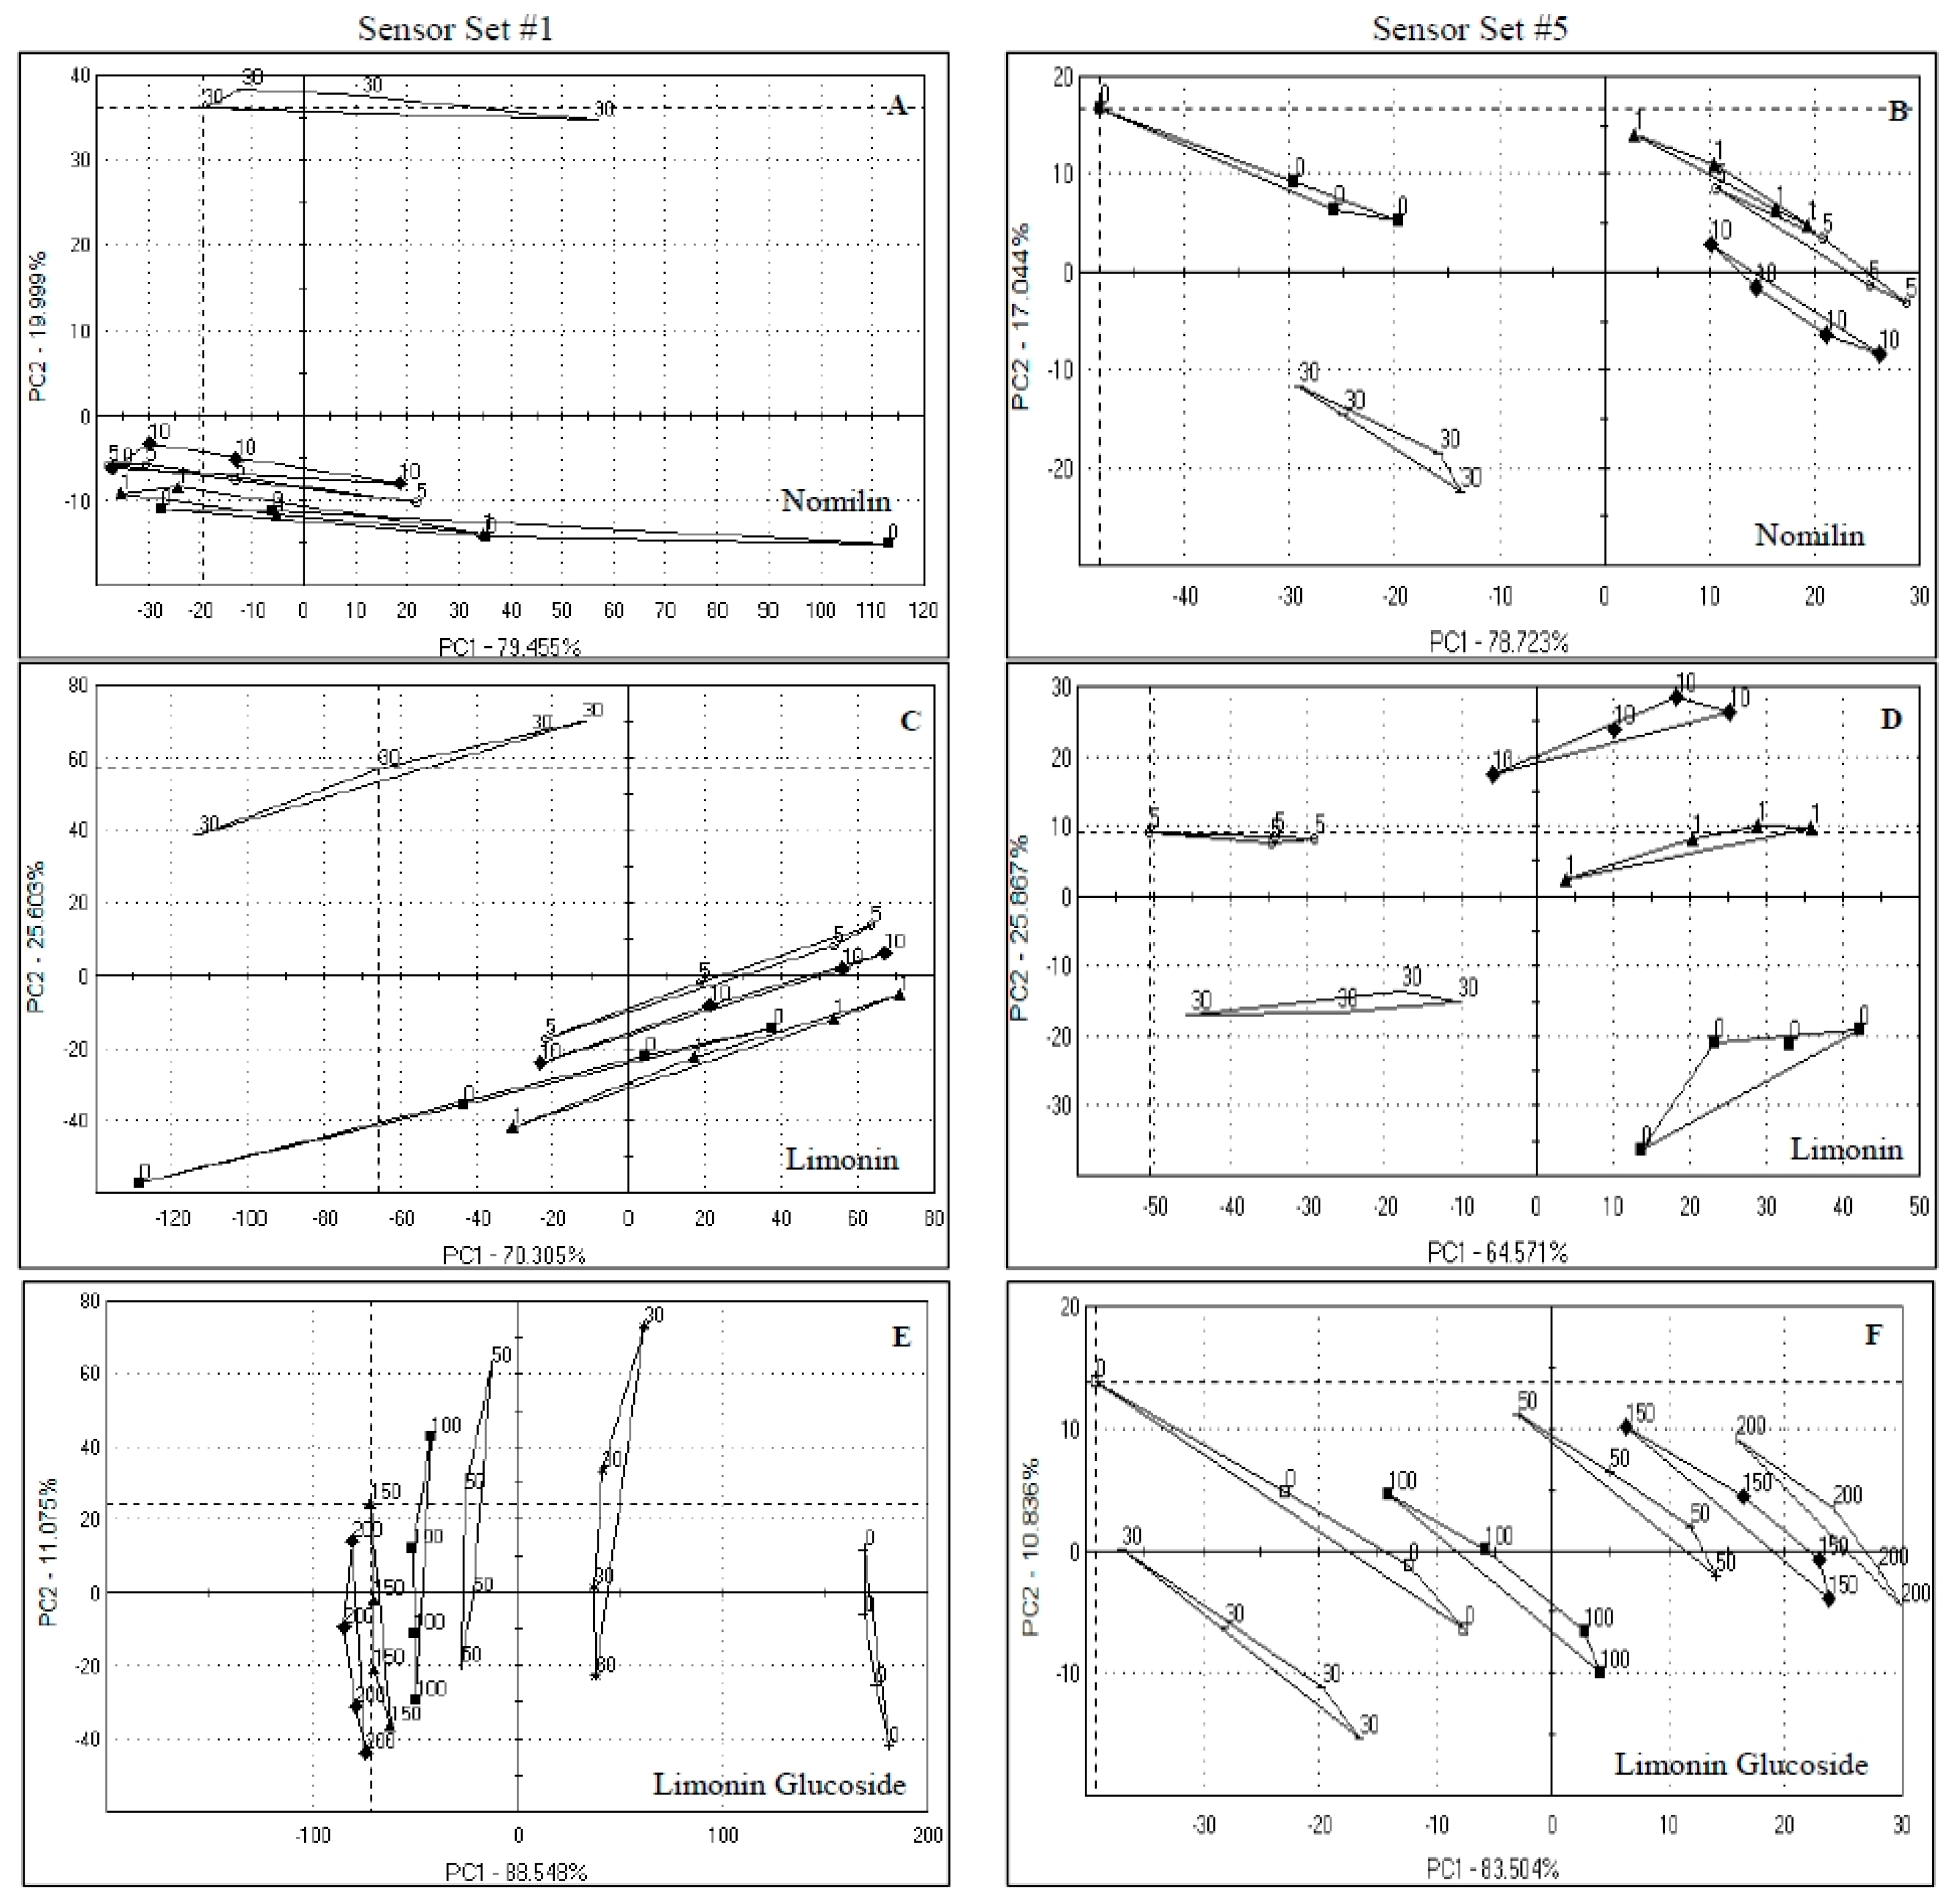
| Nomilin | Limonin | Limonin Glucoside | ||||||
| Group 1 | Group 2 | Distances | Group 1 | Group 2 | Distances | Group 1 | Group 2 | Distances |
| 0 | 1 | 37/43 | 0 | 1 | 66/33 | 0 | 30 | 135/18 |
| 0 | 5 | 44/53 | 0 | 5 | 75/73 | 0 | 50 | 198/29 |
| 0 | 10 | 45/51 | 0 | 10 | 71/51 | 0 | 100 | 229/21 |
| 0 | 30 | 53/29 | 0 | 30 | 94/55 | 0 | 150 | 242/39 |
| - | - | - | - | - | - | 0 | 200 | 253/46 |
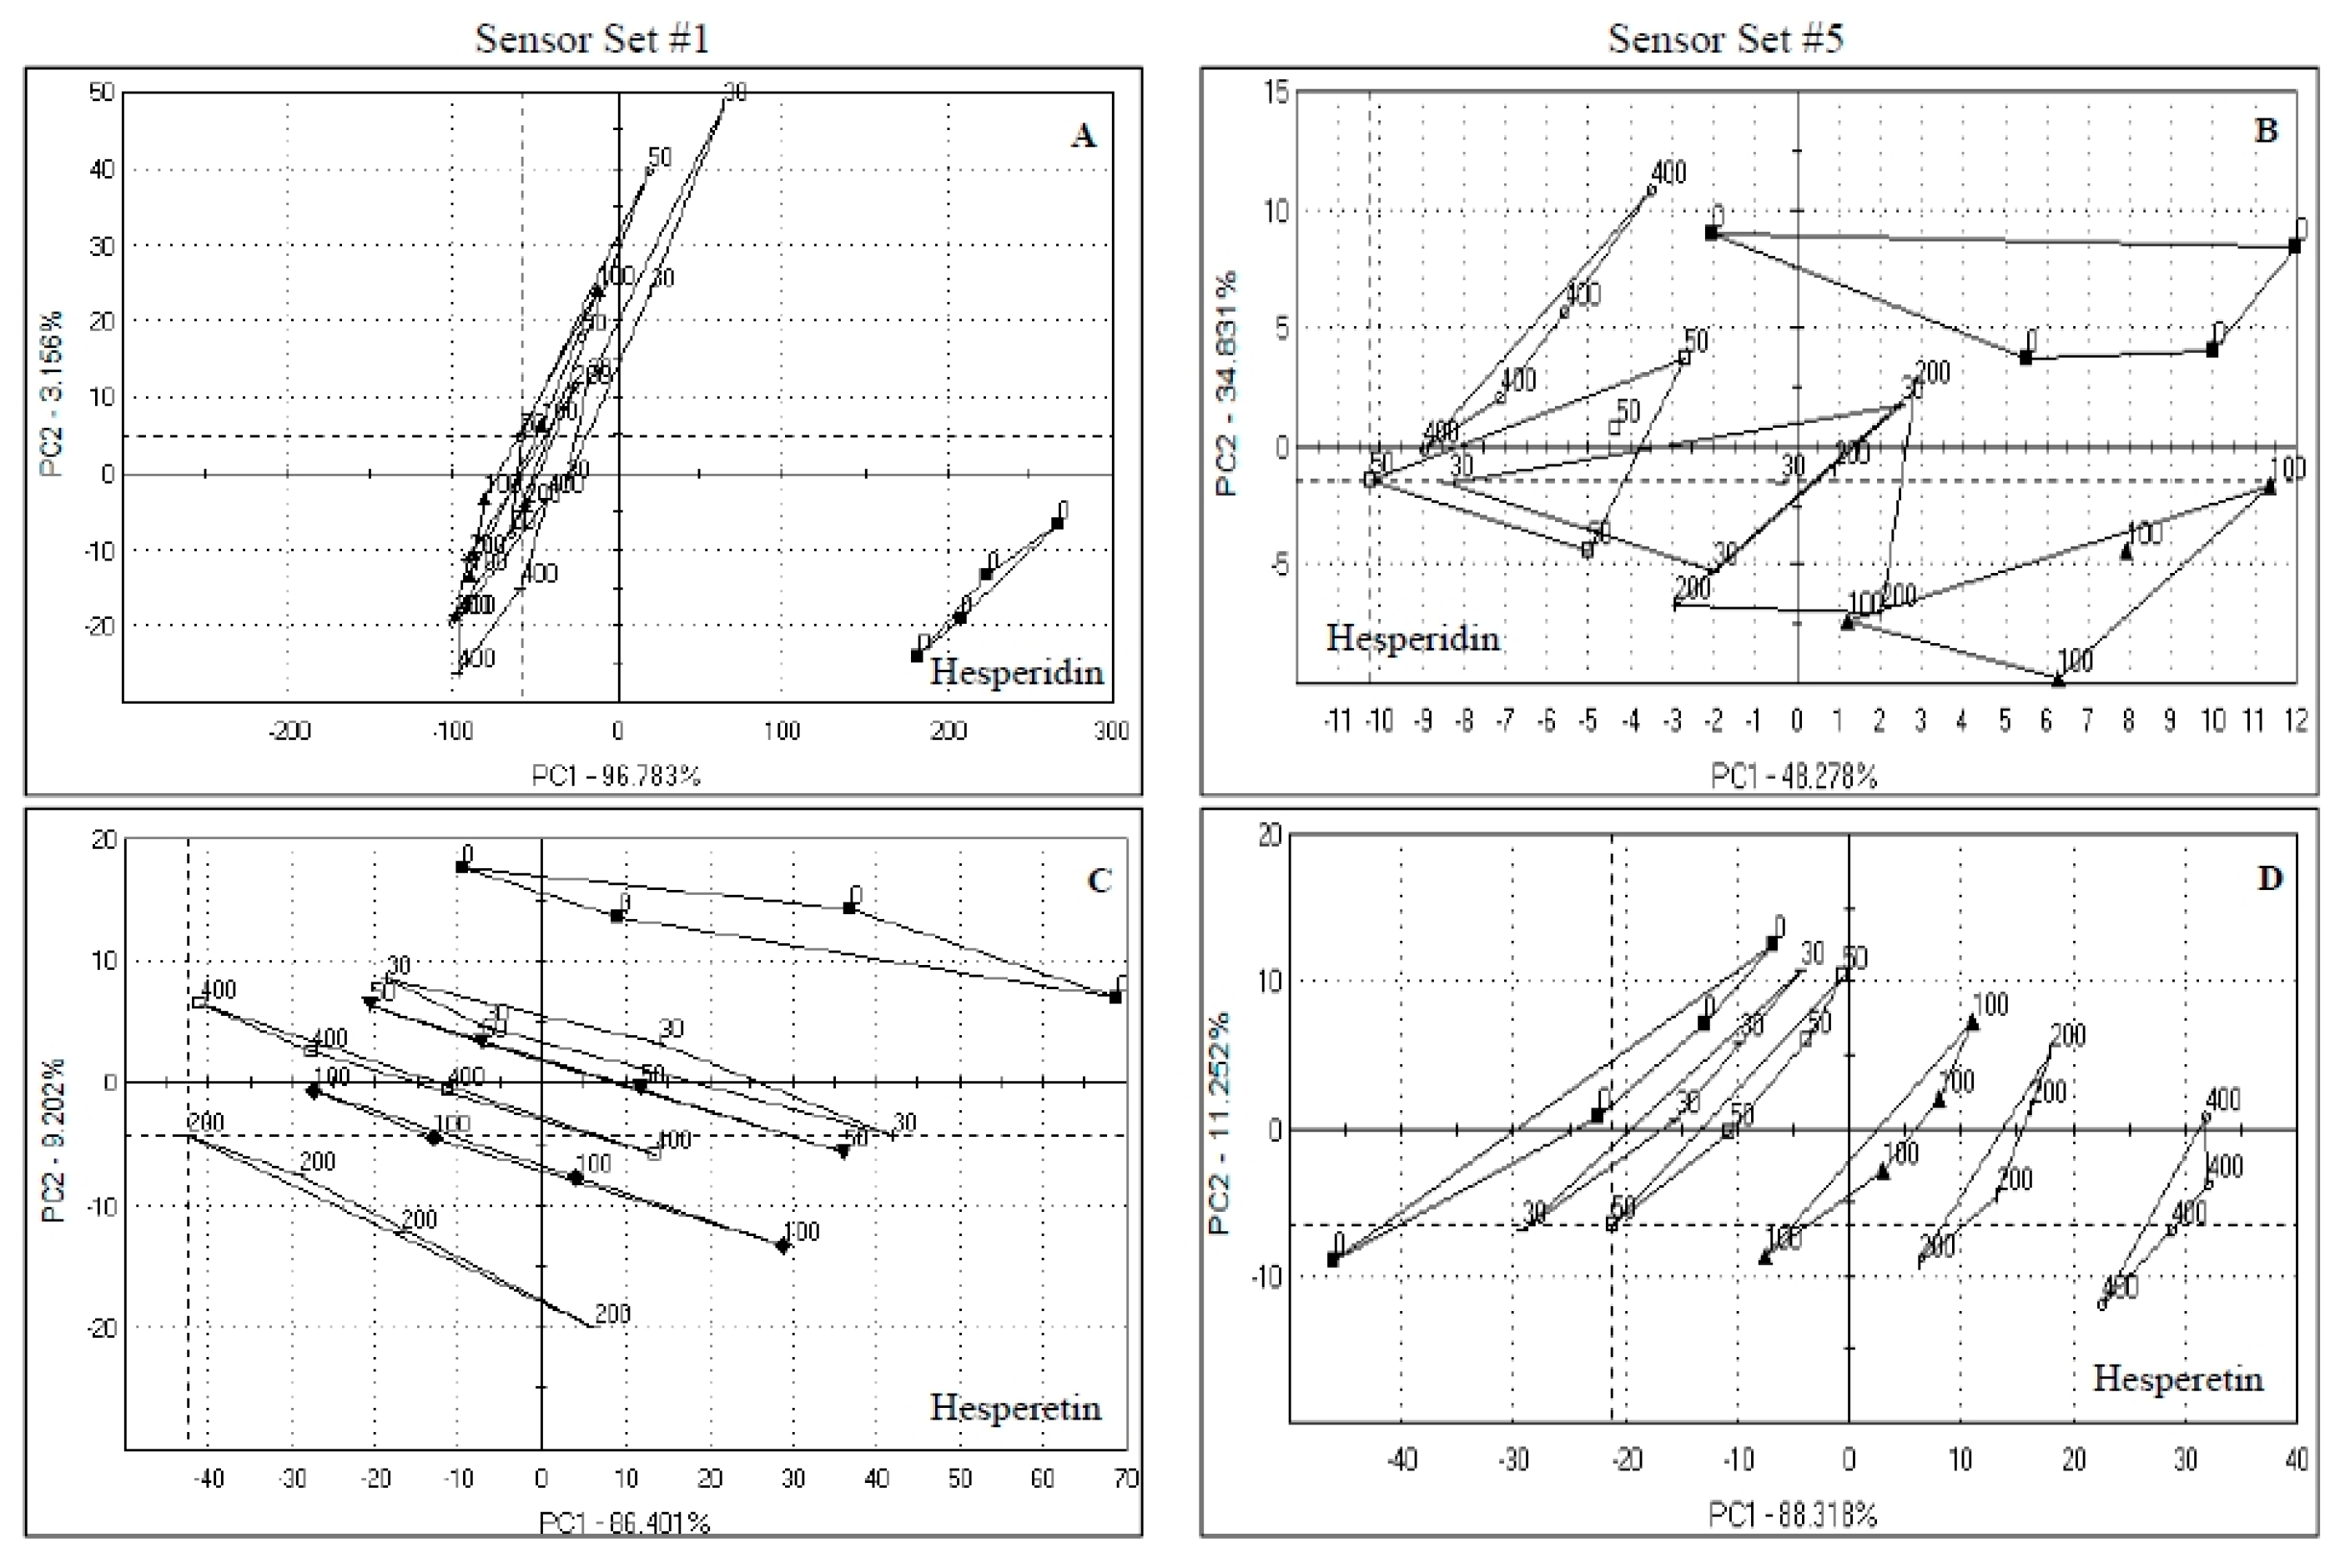
| Hesperidin | Hesperetin | |||||||
| Base Juice | Spiked Juices | Distances SS#1/#5 | Spiked Juices | Distances SS#1/#5 | ||||
| 0 | 30 | 214/12 | 0 | 30 | 21/7 | |||
| 0 | 50 | 253/15 | 0 | 50 | 25/13 | |||
| 0 | 100 | 277/13 | 0 | 100 | 36/26 | |||
| 0 | 200 | 288/12 | 0 | 200 | 53/36 | |||
| 0 | 400 | 293/15 | 0 | 400 | 46/52 | |||

3.2. E-Tongue Analysis of Orange Juice Spiked with Limonoids

3.3. E-Tongue Analysis of Orange Juice Spiked with Flavonoids

3.4. E-Tongue Analysis of Orange Juices Affected by Harvest Maturity and HLB Disease


4. Conclusions
Note
Author Contributions
Conflicts of Interest
References
- FDOC. Florida Citrus Outlook 2014–15 Season. Available online: https://fdocgrower.app.box.com/shared/2n5zfo2cur/1/76190650/22178980651/1 (accessed on 15 September 2015).
- Plotto, A.; Baldwin, E.; McCollum, G.; Manthey, J.; Narciso, J.; Irey, M. Effect of Liberibacter infection (Huanglongbing or “Greening” Disease) of citrus on orange juice flavor quality by sensory evaluation. J. Food Sci. 2010, 75, S220–S230. [Google Scholar] [CrossRef] [PubMed]
- Raithore, S.; Dea, S.; Plotto, A.; Bai, J.; Manthey, J.; Narciso, J.; Irey, M.; Baldwin, E. Effect of blending Huanglongbing (HLB) disease affected orange juice with juice from healthy orange on flavor quality. LWT Food Sci. Technol. 2015, 62, 868–874. [Google Scholar] [CrossRef]
- Baldwin, E.; Plotto, A.; Manthey, J.; McCollum, G.; Bai, J.; Irey, M.; Cameron, R.; Luzio, G. Effect of Liberibacter infection (Huanglongbing disease) of citrus on orange fruit physiology and fruit/fruit juice quality: Chemical and physical analyses. J. Agric. Food Chem. 2010, 58, 1247–1262. [Google Scholar] [CrossRef] [PubMed]
- Dagulo, L.; Danyluk, M.D.; Spann, T.M.; Valim, M.F.; Goodrich-Schneider, R.; Sims, C.; Rouseff, R. Chemical characterization of orange juice from trees infected with citrus greening (Huanglongbing). J. Food Sci. 2010, 75, C199–C207. [Google Scholar] [CrossRef] [PubMed]
- Plotto, A. Effect of nutritional treatments on Huanlongbing infected citrus flavor quality by sensory evaluation. Unpublished data.
- Legin, A.; Rudnitskaya, A.; Lvova, L.; Vlasov, Y.; Di Natale, C.; D’Amico, A. Evaluation of Italian wine by the electronic tongue: Recognition, quantitative analysis and correlation with human sensory perception. Anal. Chim. Acta 2003, 484, 33–44. [Google Scholar] [CrossRef]
- Rudnitskaya, A.P.E.; Kirsanov, D.; Lammertyn, J.; Nicolai, B.; Saison, D.; Delvaux, F.R.; Delvaus, F.; Legin, A. Instrumental measurement of beer taste attribues using an electronic tongue. Anal. Chim. Acta 2009, 646, 111–118. [Google Scholar] [CrossRef] [PubMed]
- Beullens, K.; Kirsanov, D.; Irudayaraj, J.; Rudnitskaya, A.; Legin, A.; Nicolaï, B.M.; Lammertyn, J. The electronic tongue and atr–ftir for rapid detection of sugars and acids in tomatoes. Sens. Actuators B Chem. 2006, 116, 107–115. [Google Scholar] [CrossRef]
- Dias, L.A.; Peres, A.M.; Veloso, A.C.A.; Reis, F.S.; Vilas-Boas, M.; Machado, A.A.S.C. An electronic tongue taste evaluation: Identification of goat milk adulteration with bovine milk. Sens. Actuators B Chem. 2009, 136, 209–217. [Google Scholar] [CrossRef]
- Liu, M.W.J.; Li, D.; Wang, M. Electronic tongue coupled with physicochemical analysis for the recognition of orange beverages. J. Food Qual. 2012, 35, 429–441. [Google Scholar] [CrossRef]
- Lindemann, B. Receptors and transduction in taste. Nature 2001, 412, 219–225. [Google Scholar] [CrossRef] [PubMed]
- Vlasov, Y.L.A.; Rudnitskaya, R.; Natale, C.D.; D’Amico, A. Nonspecific sensor arrays (“Electronic tongue”) for chemical analysis of liquids. Pure Appl. Chem. 2005, 77, 1965–1983. [Google Scholar] [CrossRef]
- Legin, A.; Rudnitskaya, A.; Vlasov, Y.; Di Natale, C.; Davide, F.; D’Amico, A. Tasting of beverages using an electronic tongue. Sens. Actuators B Chem. 1997, 44, 291–296. [Google Scholar] [CrossRef]
- Gutiérrez, J.M.; Haddi, Z.; Amari, A.; Bouchikhi, B.; Mimendia, A.; Cetó, X.; del Valle, M. Hybrid electronic tongue based on multisensor data fusion for discrimination of beers. Sens. Actuators B Chem. 2013, 177, 998–996. [Google Scholar] [CrossRef]
- Bueno, L.; de Araujo, W.; Salles, M.; Kussuda, M.; Paixão, T. Voltammetric electronic tongue for discrimination of milk adulterated with urea, formaldehyde and melamine. Chemosensors 2014, 2, 251–266. [Google Scholar] [CrossRef]
- Ciosek, P.M.R.; Dybko, A.; Wroblewski, W. Potentiometric electronic tongue based on integrated array of microelectrodes. Sens. Actuators B Chem. 2007, 127, 8–14. [Google Scholar] [CrossRef]
- Ding, F.L.B.; Deng, X.; Wang, Z.; Xie, Z.; Fang, Y.; Xu, J. Delayed bitterness of six sweet oranges (Citrus sinensis osbeck). J. Huazhong Agric. Univ. 2010, 29, 497–501. [Google Scholar]
- Baldwin, E.A.; Bai, J.; Plotto, A.; Dea, S. Electronic noses and tongues: Applications for the food and pharmaceutical industries. Sensors 2011, 11, 4744–4766. [Google Scholar] [CrossRef] [PubMed]
- Jagoueix, S.; Bove, J.M.; Garnier, M. Pcr detection of the two “Candidatus” Liberibacter species associated with greening disease of citrus. Mol. Cell. Probes 1996, 10, 43–50. [Google Scholar] [CrossRef] [PubMed]
- Bai, J.; Baldwin, E.; Liao, H.L.; Zhao, W.; Kostenyuk, I.; Burns, J.; Irey, M. Extraction of DNA from orange juice, and detection of bacterium Candidatus Liberibacter asiaticus by real-time PCR. J. Agric. Food Chem. 2013, 61, 9939–9346. [Google Scholar] [CrossRef] [PubMed]
- Dea, S.; Plotto, A.; Manthey, J.A.; Raithore, S.; Irey, M.; Baldwin, E. Interactions and thresholds of limonin and nomilin in bitterness perception in orange juice and other matrices. J. Sens. Stud. 2013, 28, 311–323. [Google Scholar] [CrossRef]
- Baldwin, E.; Bai, J.; Plotto, A.; Manthey, J.; Narciso, J.; Dea, S.; Irey, M. Effect of nutritional spray regimes on orange juice flavor quality and juice Liberibacter (CLas) DNA detection. Proc. Fla. State Hortic. Soc. 2012, 125, 239–242. [Google Scholar]
- Havekotte, M.; Hofmann, T.; Rakofsky, T.; Nagle, C.; Morello, M.; Jordan, R. Control of Flavor Characteristics of Fruit Juice. European Patent Application EP2494874 A1, 5 September 2012. [Google Scholar]
- Grosso, G.; Galvano, F.; Mistretta, A.; Marventano, S.; Nolfo, F.; Calabrese, G.; Buscemi, S.; Drago, F.; Veronesi, U.; Scuderi, A. Red orange: Experimental models and epidemiological evidence of its benefits on human health. Oxidative Med. Cell. Longev. 2013, 2013. [Google Scholar] [CrossRef] [PubMed]
- Ejaz, S.; Ejaz, A.; Matsuda, K.; Lim, C.W. Limonoids as cancer chemopreventive agents. J. Sci. Food Agric. 2006, 86, 339–345. [Google Scholar] [CrossRef]
- Yu, J.; Wang, L.; Walzem, R.L.; Miller, E.G.; Pike, L.M.; Patil, B.S. Antioxidant activity of citrus limonoids, flavonoids, and coumarins. J. Agric. Food Chem. 2005, 53, 2009–2014. [Google Scholar] [CrossRef] [PubMed]
- Endo, T.K.M.; Shimada, T.; Moriguchi, T.; Hidaka, T.; Matsumoto, R.; Hasegawa, S.; Omura, M. Modification of limonoid metabolism in suspension cell culture of citrus. Plant Biotechnol. 2002, 19, 397–403. [Google Scholar] [CrossRef]
- Jungsakulrujirek, S.; Noomhorm, A. Effect of harvesting time and fruit size on titratable acidity, soluble solid and distribution of limonin in thai tangerine juice. Int. J. Food Sci. Technol. 1998, 33, 367–374. [Google Scholar] [CrossRef]
- Bai, J.; Baldwin, E.; Plotto, A.; Manthey, J.A.; McCollum, G.; Irey, M. Influence of harvest time on quality of “Valencia” oranges and juice. Proc. Fla. State Hortic. Soc. 2009, 122, 308–342. [Google Scholar]
- Hodgson, R.W. Horticultural varieties of citrus. In The Citrus Industry; Reuther, W., Webber, H.J., Batchelor, L.D., Eds.; University of Calilfornia, Division of Agricultural Sciences: Berkeley, CA, USA, 1967; Volume 1, pp. 431–591. [Google Scholar]
- Hasegawa, S.; Bennett, R.D.; Verdon, C.P. Limonoids in citrus seeds: Origin and relative concentration. J. Agric. Food Chem. 1980, 28, 922–925. [Google Scholar] [CrossRef]
© 2015 by the authors; licensee MDPI, Basel, Switzerland. This article is an open access article distributed under the terms and conditions of the Creative Commons by Attribution (CC-BY) license (http://creativecommons.org/licenses/by/4.0/).
Share and Cite
Raithore, S.; Bai, J.; Plotto, A.; Manthey, J.; Irey, M.; Baldwin, E. Electronic Tongue Response to Chemicals in Orange Juice that Change Concentration in Relation to Harvest Maturity and Citrus Greening or Huanglongbing (HLB) Disease. Sensors 2015, 15, 30062-30075. https://0-doi-org.brum.beds.ac.uk/10.3390/s151229787
Raithore S, Bai J, Plotto A, Manthey J, Irey M, Baldwin E. Electronic Tongue Response to Chemicals in Orange Juice that Change Concentration in Relation to Harvest Maturity and Citrus Greening or Huanglongbing (HLB) Disease. Sensors. 2015; 15(12):30062-30075. https://0-doi-org.brum.beds.ac.uk/10.3390/s151229787
Chicago/Turabian StyleRaithore, Smita, Jinhe Bai, Anne Plotto, John Manthey, Mike Irey, and Elizabeth Baldwin. 2015. "Electronic Tongue Response to Chemicals in Orange Juice that Change Concentration in Relation to Harvest Maturity and Citrus Greening or Huanglongbing (HLB) Disease" Sensors 15, no. 12: 30062-30075. https://0-doi-org.brum.beds.ac.uk/10.3390/s151229787