1. Introduction
As deteriorating civil infrastructure has received considerable public attention, structural health monitoring (SHM) has become widely employed to maintain the structures sound construction and prevent catastrophic collapses. Data acquisition in traditional SHM systems is based on wired sensors connected to a centralized data collection repository. All sensor data is aggregated at this central repository, where all data processing takes place to extract structural features and information. The centralized data acquisition and processing approach in the wired sensor network is the common practice in traditional SHM systems; however, high cost and installation difficulties [
1] have prevented the SHM from wider adoption in large-scale civil structures. For instance, to install a wired connection-based SHM system on the Golden Gate Bridge, miles of cables would be required to connect the central base station to a dense array of sensor nodes distributed along the deck, towers, and cables; installation would be both costly and time-consuming, and maintenance of the system would be challenging.
Wireless sensor networks (WSNs) provide a promising alternative to the traditional SHM approach. Wireless sensors commonly refer to sensors that are small, inexpensive, capable of wireless communication, and have on-board processing capabilities [
2]. In the last decades, many academic and commercial wireless sensors have been developed. Significant efforts have been devoted to various issues in WSNs, including data acquisition, processing, and damage detection. The majority of wireless sensor research has focused on emulation of traditional wired sensor networks employing centralized data acquisition and processing [
3,
4,
5]. Such approaches have proven to be intractable because transferring all sensor data quickly saturates the limited bandwidth in wireless communication and thus causes severe network congestion. Indeed, decentralized data processing schemes are considered to be essential to ensure the scalability of WSNs required to enable a dense array of sensors deployed on full-scale civil structures.
One of the main decentralized data processing approaches is the coordinated processing on hierarchical networks [
6]. Nagayama and Spencer [
7] implemented the coordinated processing using NExT/ERA (Natural Excitation Technique/Eigensystem Realization Algorithm) [
8,
9] on their WSN for damage detection. Furthermore, frequency-domain decomposition (FDD) [
10] and random decrement technique (RDT) [
11] have also been used for system identification purposes in WSNs. Sadhu
et al. [
12] used the blind source separation technique for decentralized modal identification of a pony truss pedestrian bridge using a WSN. Wu
et al. [
13] realized a decentralized WSN using a Hilbert-Huang transform for structural health monitoring of an in-lab cable-stayed bridge model. More decentralized approaches have been intensively studied, being proven to be efficient from both computation and wireless communication perspectives [
14,
15,
16].
Stochastic subspace identification (SSI) technique has the potential to enhance the ability for decentralized system identification. In particular, SSI with the canonical variate algorithm (CVA) weighting (SSI/CVA) normalizes the natural modes in terms of energy; thus, less excited modes can be better identified [
17]. In the comparative study of various system identification methods, Yi and Yun [
18] have shown the SSI/CVA estimates dynamic properties more accurately than peak picking, FDD, and NExT/ERA with a single reference.
This study presents a decentralized system identification using the SSI/CVA. The approach is implemented on the Imote2-based WSN and experimentally verified on a 5-story shear building model. In addition, the proposed SSI-based decentralized system identification is compared to the NExT/ERA-based one in terms of the accuracy and data transmission. Note that, hereinafter, the SSI/CVA is referred to as SSI for simplicity.
2. Decentralized System Identification in WSN
Decentralized in-network data processing has been introduced to resolve the problems in the traditional centralized data acquisition and processing in WSNs such as data inundation and network congestion. In decentralized data processing, each sensor in the network participates in processing measured data to extract meaningful information such as dynamic properties (i.e., natural frequencies, damping factors, and mode shapes) and damage identification results. As the extracted information is much smaller than the raw sensor data in size, collecting this information only can reduce wireless data transmission.
2.1. Decentralized Data Processing Schemes
One of the decentralized approaches uses independent processing [
19,
20,
21,
22,
23,
24,
25,
26] as shown in
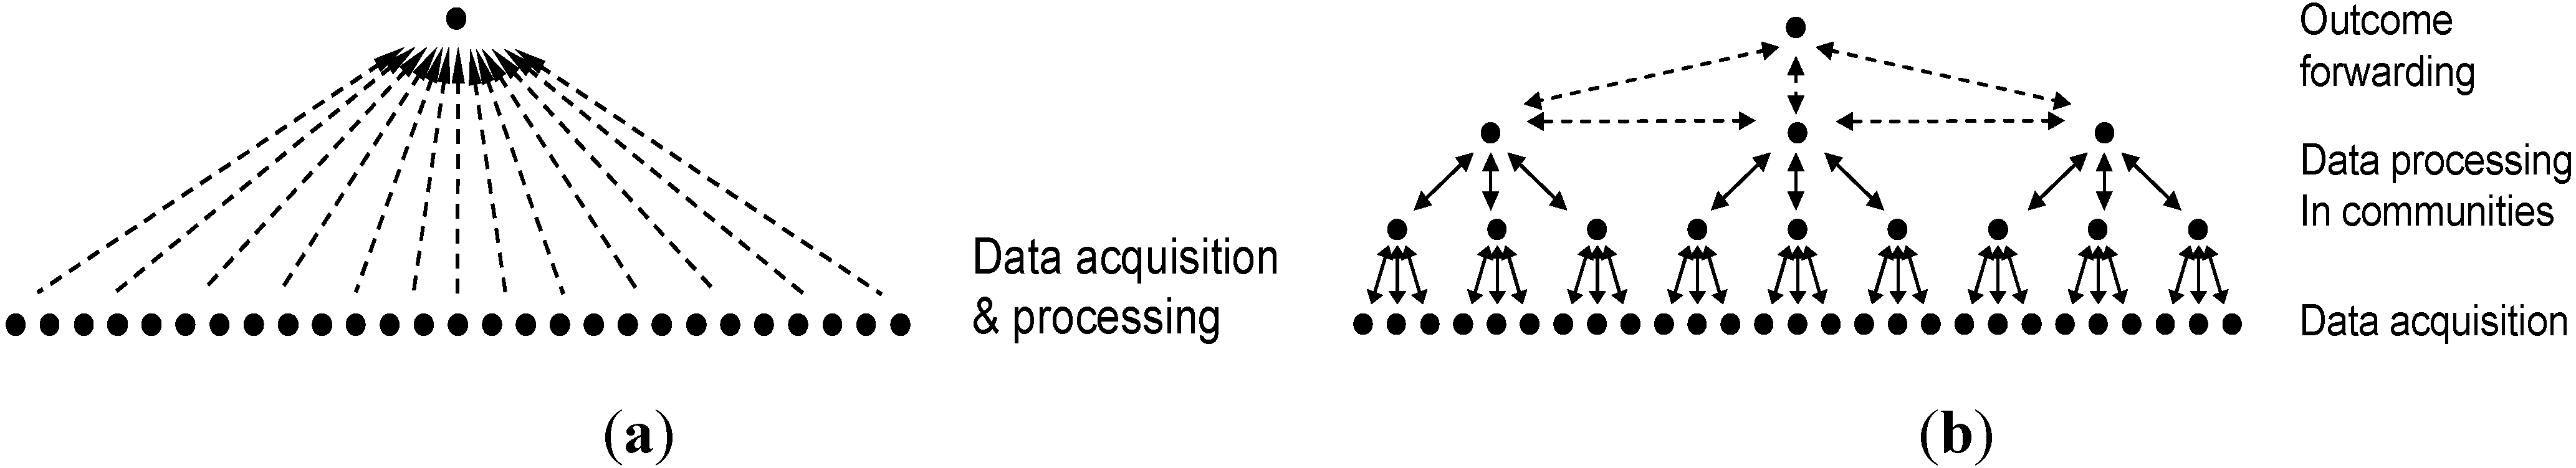
Figure 1. Each of the sensor node processes measured data independently without communicating with other sensor nodes. The processed data, typically fast Fourier transform (FFT) or signature analysis, is then sent to the base station. The total amount of data transferred over the radio in the network is quite small. Although sensor networks based on this processing scheme are scalable, important spatial information (e.g., mode shape) cannot be extracted.
Figure 1.
Data acquisition and processing schemes [
7]. (
a) Decentralized independent processing; (
b) Decentralized coordinated processing.
Figure 1.
Data acquisition and processing schemes [
7]. (
a) Decentralized independent processing; (
b) Decentralized coordinated processing.
The decentralized approach proposed by Gao
et al. [
6] employs a coordinated computing strategy, often called distributed computing strategy (DCS), as shown in
Figure 1b, which has the ability to capture local spatial information. The sensor network in this scheme is divided into hierarchical communities, in which sensor nodes within each community communicate with each other in processing data; communication between communities is conducted through each community’s cluster-head. Nagayama and Spencer [
7] implemented the DCS logic in a WSN employing Imote2 wireless sensors. NExT/ERA was implemented in the network for the community-wide data processing to identify modal properties of the local community.
2.2. Stochastic Subspace Identification
This study explores the use of SSI in the community-wide data processing in WSNs. For completeness, SSI is briefly reviewed. Consider a discrete time stochastic state space model:
where
and
are uncorrelated zero mean white noise vectors,
is the
state vector, and
is the
output vector . The correlation function
of the output sequence can be expressed as:
where
. The block Hankel matrix
with
block rows and
block columns, composed of the correlation function
, can be decomposed as:
where
and
.
and
are the observability and extended controllability matrices, respectively. The weighted block Hankel matrix calculated by pre- and post-multiplying weighting matrices
and
becomes:
One possible solution to Equation (4) is
Then, the system matrices
and
can be readily obtained using Equation (3) with the known observability matrix
in Equation (5). The system matrix
can be calculated by solving the following equation.
where
and
.
The system matrix
is simply the first m rows of
. Depending on the weighting matrices, SSI is called balanced realization (BR) if no weighting matrices are employed, or CVA if the weighting matrices
and
are defined as:
where
and
.
To form the weighting matrices, the correlation function is a square matrix with all combinations of measured signals used in calculating . As opposed to NExT/ERA that requires correlation functions with respect to a single signal, the use of SSI in WSNs causes more data transmission than NExT/ERA-based system identification. More details are discussed in the following sections.
3. Decentralized Network
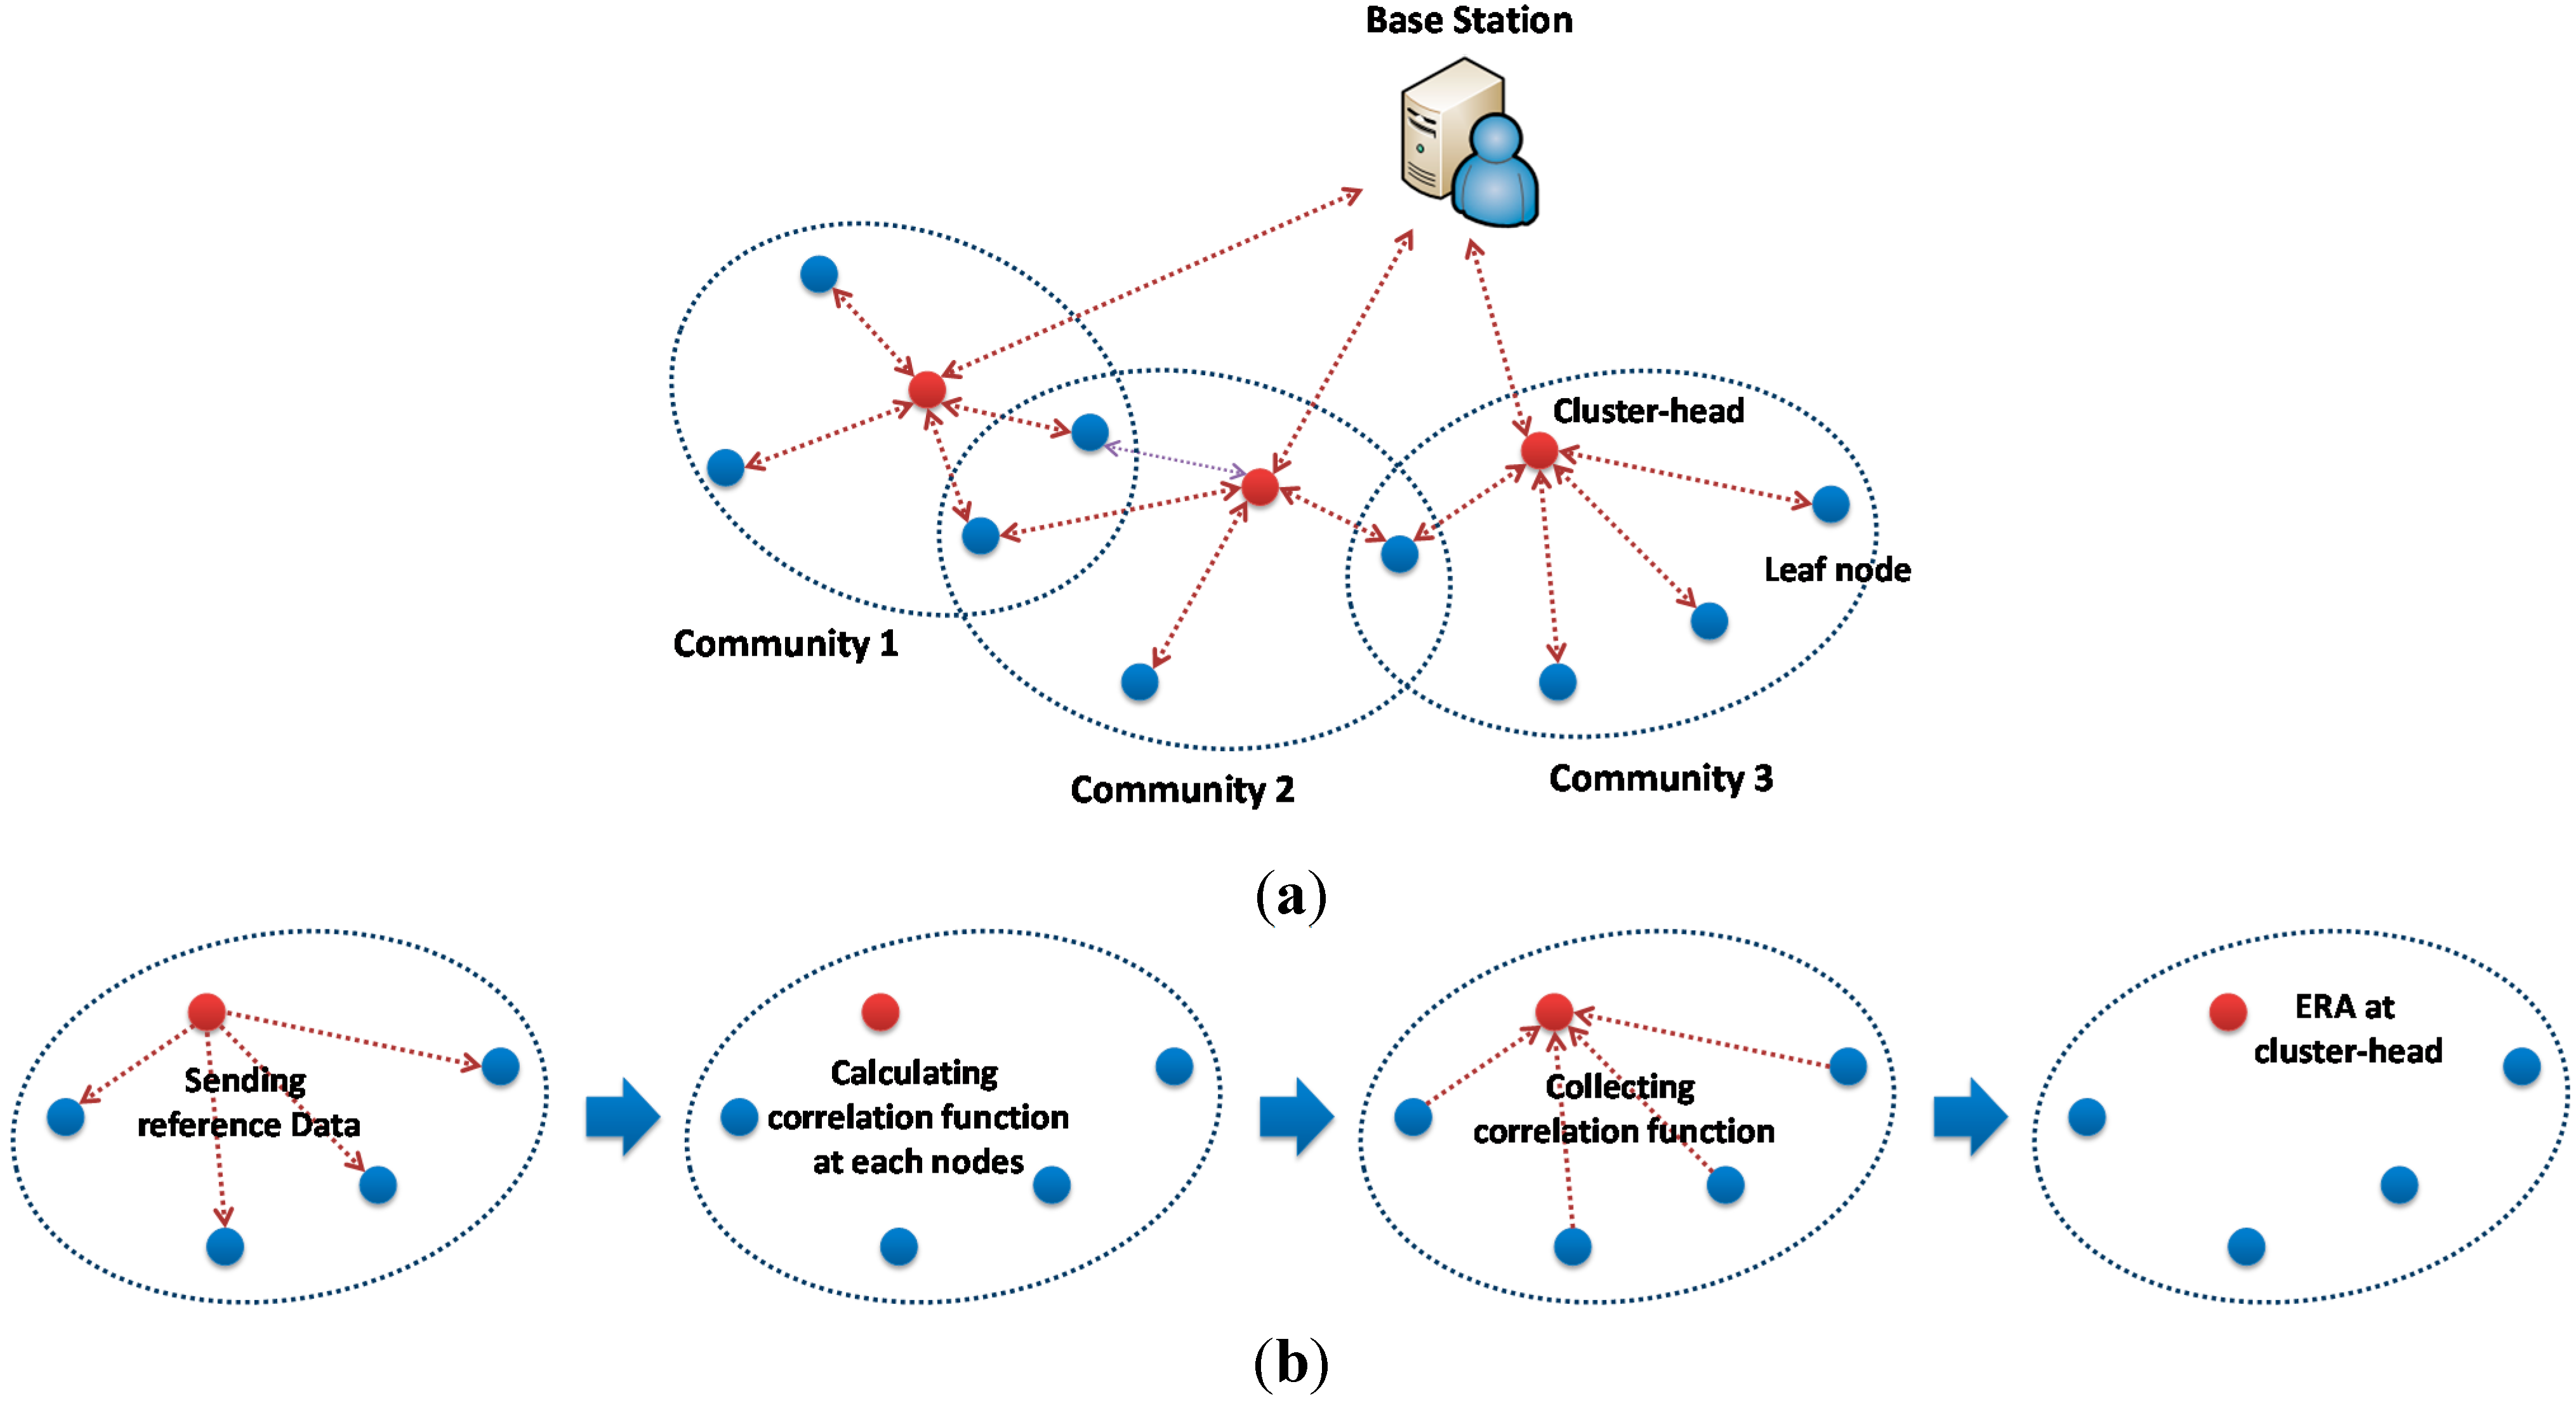
Organizing data transmission and processing appropriately is important to effectively implement SSI for community-wide data processing. Nagayama and Spencer [
7] proposed a NExT-based data processing approach (see
Figure 2a,b). In this scheme, the whole sensor network is divided into local sensor communities, each of which consists of one cluster-head and multiple leaf nodes. The sensor network initially conducts synchronized sensing and, subsequently, the local sensor communities start processing the data. In each sensor community, the cluster-head sends a time history of sensor data to all leaf nodes in the community as the reference information. Each leaf node and the cluster-head calculate correlation functions between their own measured data and the received/sent reference data. The correlation functions are subsequently collected at the cluster-head. Jang
et al. [
27] used the collected correlation functions in ERA to obtain the modal properties for damage detection. Because the correlation function is generally much shorter than the raw sensor data, the total amount of wireless data transmission can be significantly reduced.
Figure 2.
Decentralized coordinated processing. (a) Network topology; (b) Community-wide data processing: decentralized; (c) Community-wide data processing: centralized.
Figure 2.
Decentralized coordinated processing. (a) Network topology; (b) Community-wide data processing: decentralized; (c) Community-wide data processing: centralized.
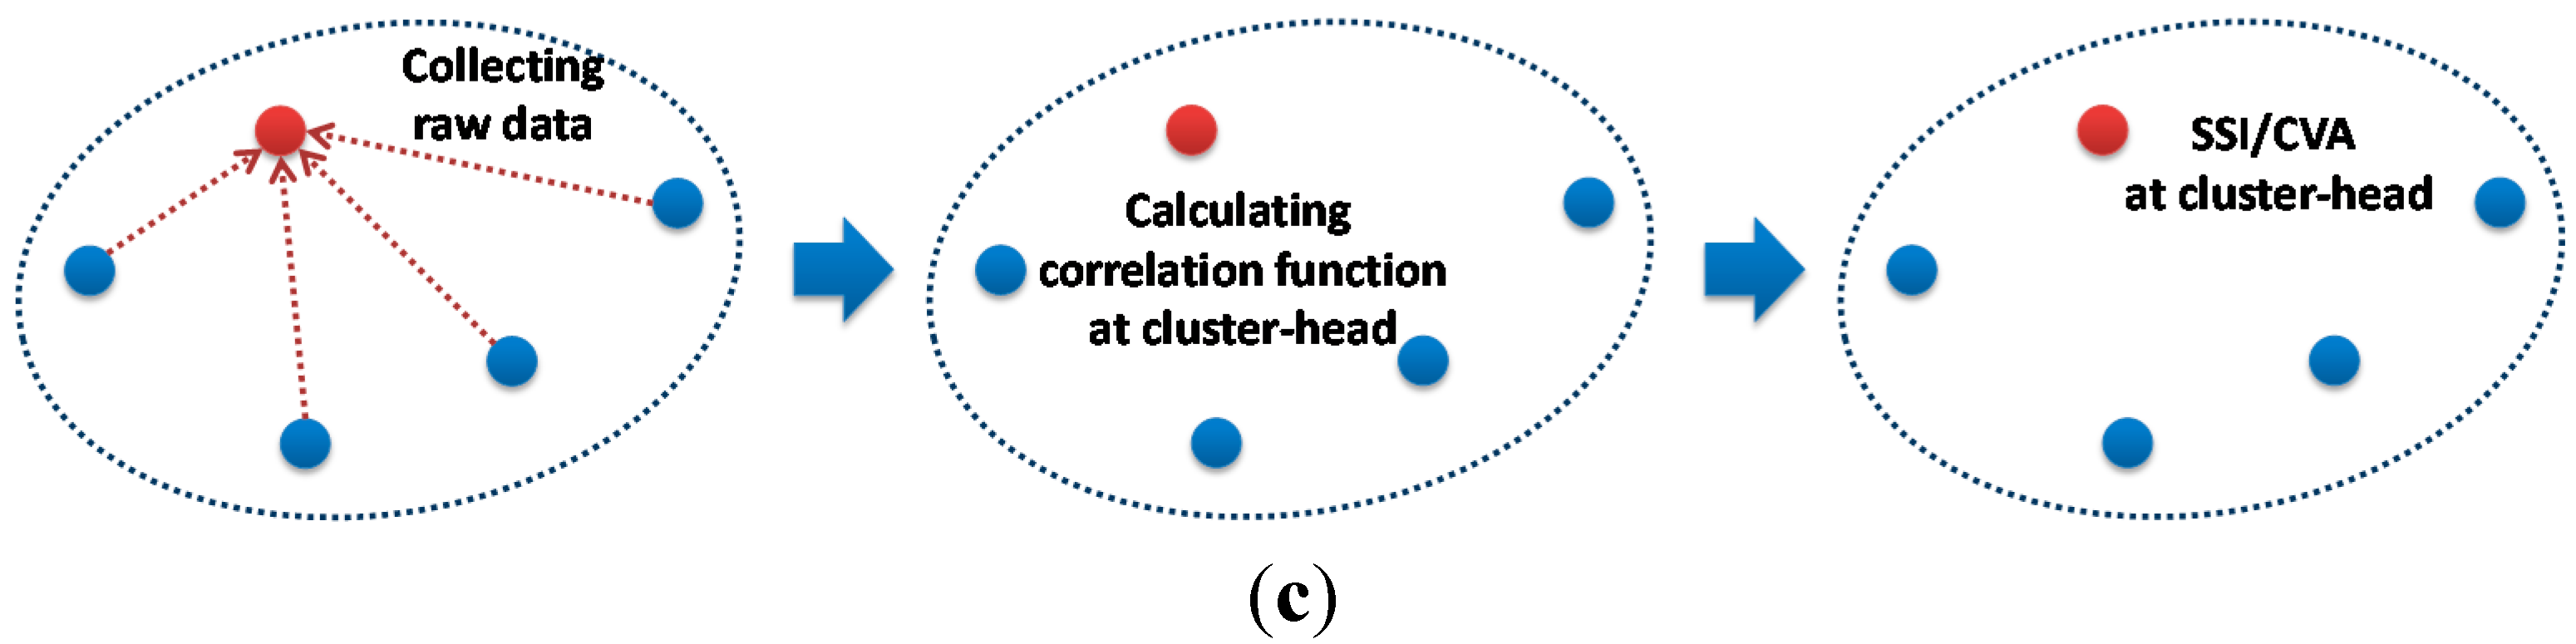
This approach requires the reference signal transmitted from the cluster-head, which is however inefficient for SSI in terms of wireless communication. Because a full correlation function matrix is necessary for SSI as described previously, all sensor nodes should send measured data as reference signals to other sensor nodes as well as correlation functions to the cluster-head after the calculation. Alternatively, this study employs the community-wide centralized data collection and processing approach (see
Figure 2c).
The centralized community-wide data processing simply collects all sensor data from leaf nodes and processes the data. The full correlation function matrix is estimated and used as the input of SSI. Although the cluster-head spends much more power on the calculation and, thus, the battery drains quickly in the particular node, this problem can be easily solved by selecting different cluster-heads based on the battery level whenever running the community-wide data processing. While the network-wide centralized data collection is not scalable and is, thus, undesirable for dense sensor networks, the hierarchical network with the community-wide centralized approach is still scalable if the size of each community is kept small and independent related to the size of the total network.
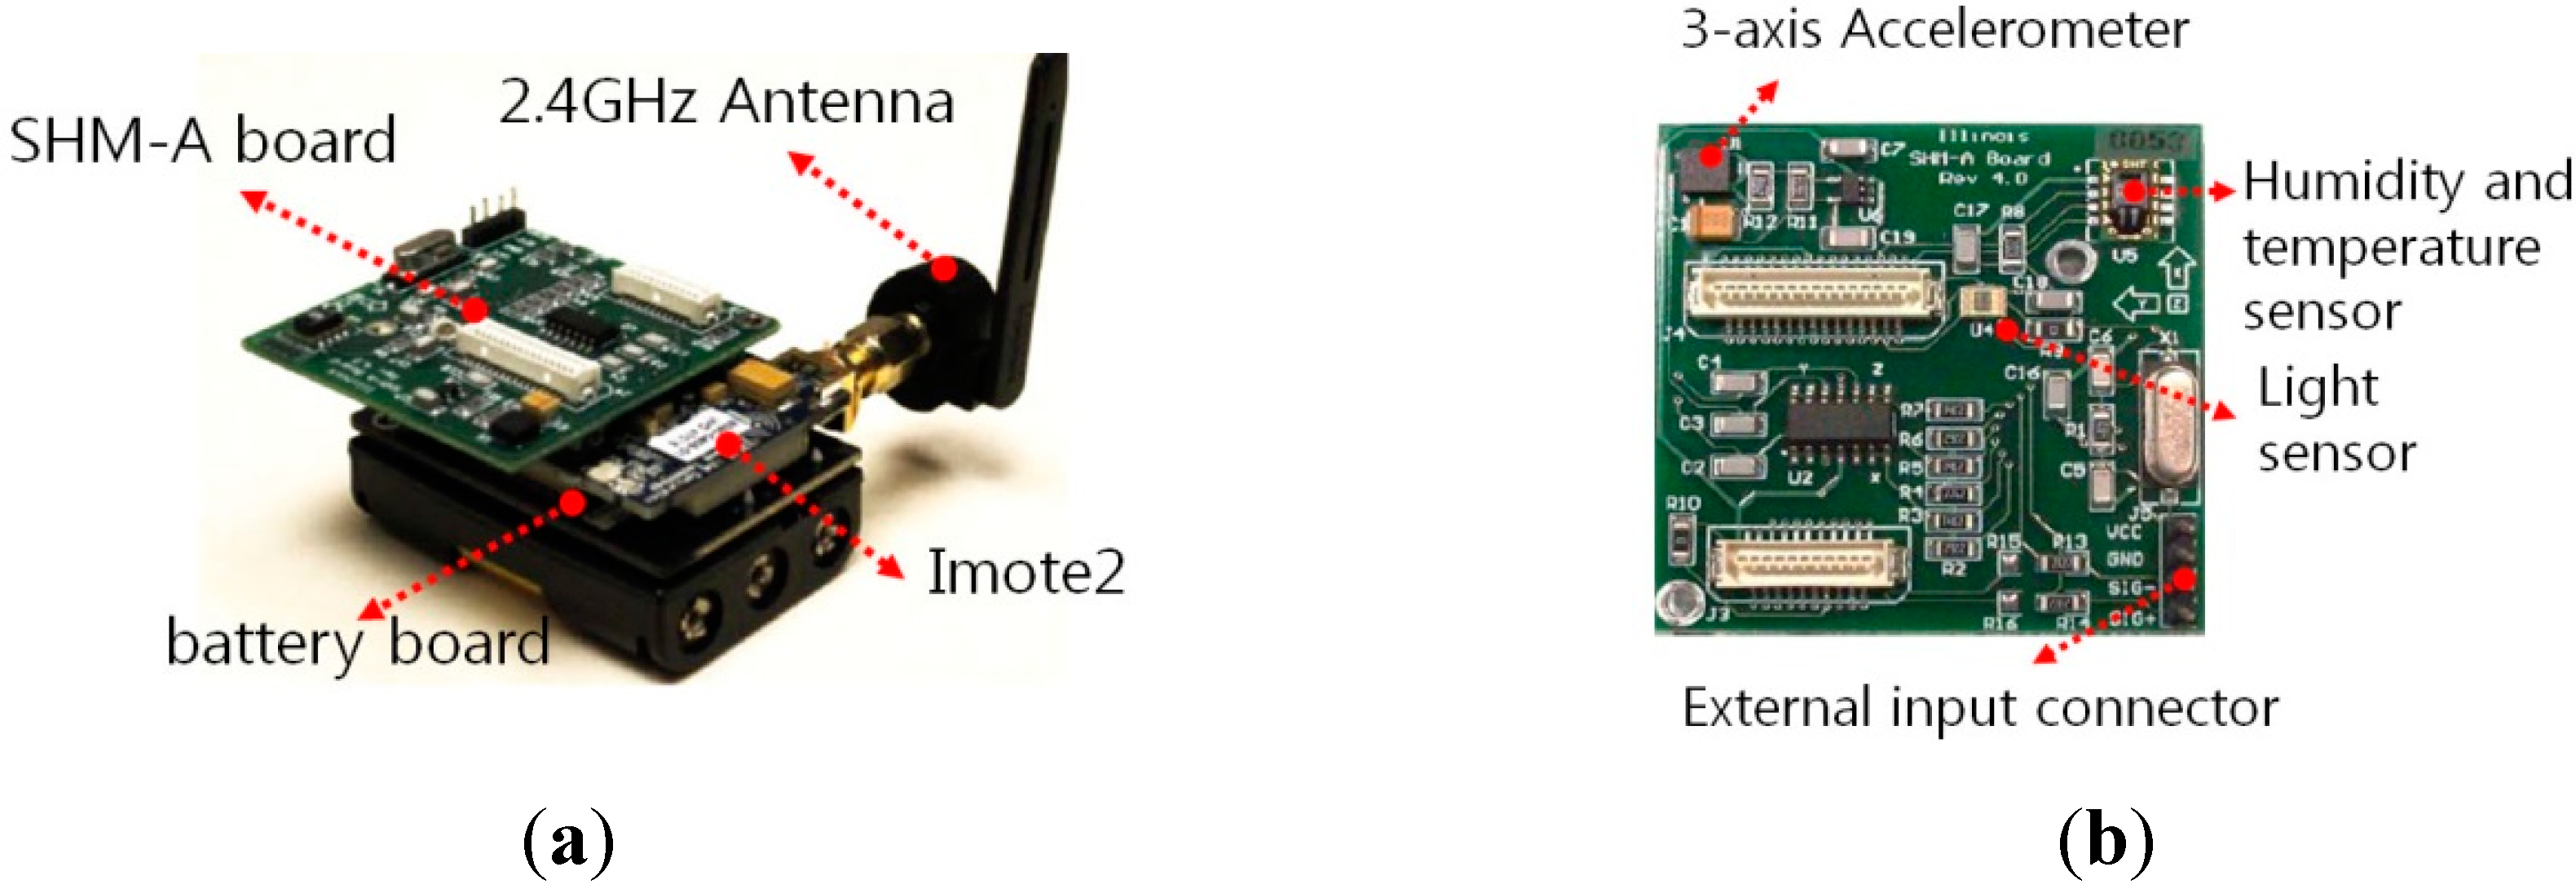
4. Implementation
The decentralized data processing scheme employing SSI is implemented on the Imote2-based sensor network. As SSI is computationally demanding, the hardware performance of the sensor platform is crucial. This section describes a brief overview of the Imote2 sensor platform and the implementation of the proposed approach on the sensor network using Imote2.
4.2. Implementation on Imote2
The decentralized system identification using SSI on the Imote2-based sensor network is implemented using the Illinois SHM Project (ISHMP) [
29] services a toolsuite. The toolsuite is developed by the University of Illinois at Urbana-Champaign to provide open source middleware services and applications that implement essential components in WSNs such as time synchronization, synchronized sensing, reliable wireless communication, and a wide variety of numerical libraries. These fundamental components can be used as building blocks in developing new WSN applications, dramatically reducing the time and effort necessary for the development. More detailed information regarding the ISHMP Services Toolsuite can be found in [
30].
The WSN application,
SSI-based Decentralized System Identification (SDSI), is developed using the ISHMP Services Toolsuite. SDSI performs SSI to identify system information (
i.e., state space representation and modal properties) in each local sensor community, implementing the community-wide centralized data collection and processing. Software components of the toolsuite used in the development include:
Time Synchronization to synchronize local clocks in each sensor node
Unified Sensing for measuring acceleration
SensingUnit that is a high-level service that utilizes Time Synchronization and Unified Sensing services to perform network-wide sensing
ReliableComm for reliable wireless communication
RemoteCommand for sensor nodes to interact with each other in a way that command messages are conveyed to receiver nodes that perform designated tasks such as sensing and computing.
Note that the italics denote names of software components in the ISHMP Services Toolsuite. As these basic components are provided by the ISHMP Services Toolsuite, the development is focused on implementing the community-wide data collection, estimation of the full correlation function matrix, and SSI.
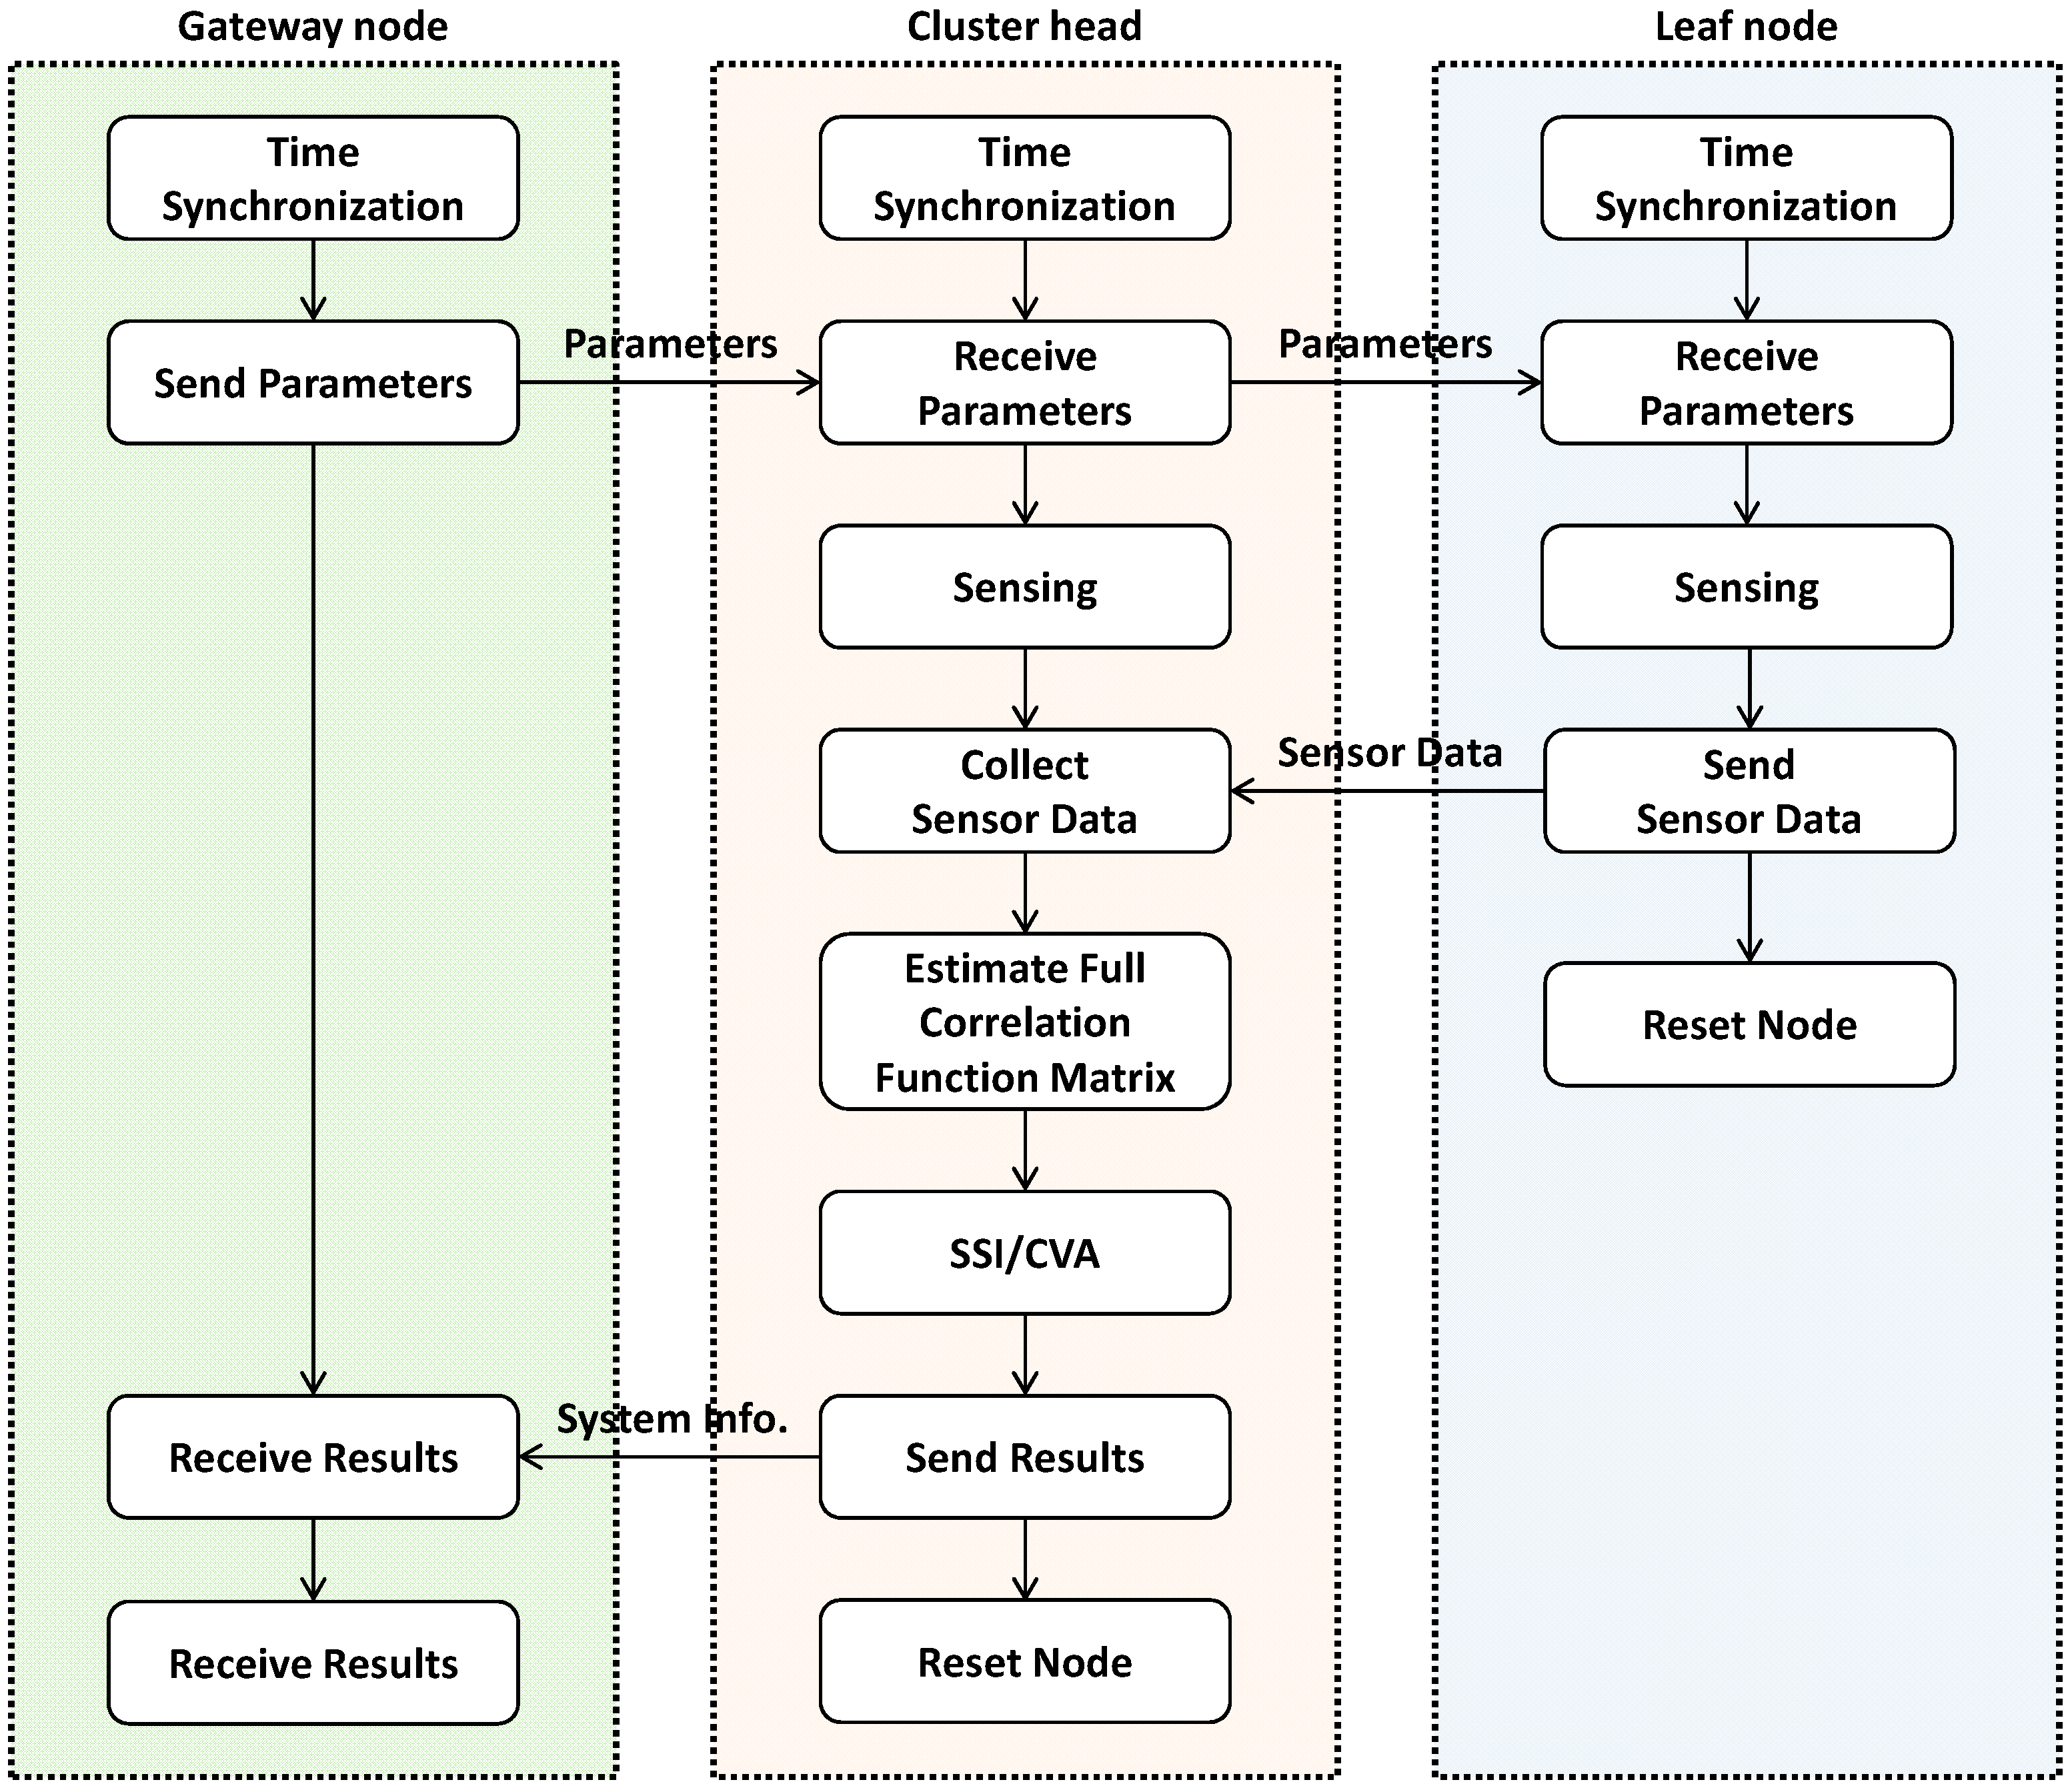
The flowchart in
Figure 4 shows how the network is organized for SDSI to produce system identification results from each sensor community. The WSN consists of three types of nodes: (1) a gateway node that is attached to the base station computer and controls the operation of the WSN; (2) cluster-heads that estimate correlation function and system information of their local sensor communities; and (3) leaf nodes that provide sensor data to the cluster-head. As shown in
Figure 4, the WSN conducts the network-wide time synchronization and, subsequently, the gateway node disseminates parameters such as the sampling frequency and sensor topology. With received parameters, sensor nodes (
i.e., cluster-heads and leaf nodes) measure acceleration data, which are all centrally collected at the cluster-heads in each community. The cluster-heads use the collected data to estimate the full correlation function matrices that are used in SSI. The calculated system information of each community is sent to the gateway node and the base station where the network administrators and developers can access the collected information.
Figure 4.
Flowchart of SDSI.
Figure 4.
Flowchart of SDSI.
As such, the developed SDSI is able to estimate the system information as the form of the state space representation and modal properties in each sensor community. Due to the decentralized nature of SDSI, the output spatial information is not complete but the collection of partial information from different communities. This partial information can be combined together if overlapping nodes between communities are present [
31].
5. Experimental Validation
The performance of SDSI is experimentally investigated using the 5-story shear building model. From the random vibration testing, modal properties are estimated using the decentralized in-network processing of SDSI and compared to those obtained based on the centralized data collection and processing. This section describes the experimental setup and system identification results from SDSI.
5.1. Experimental Setup
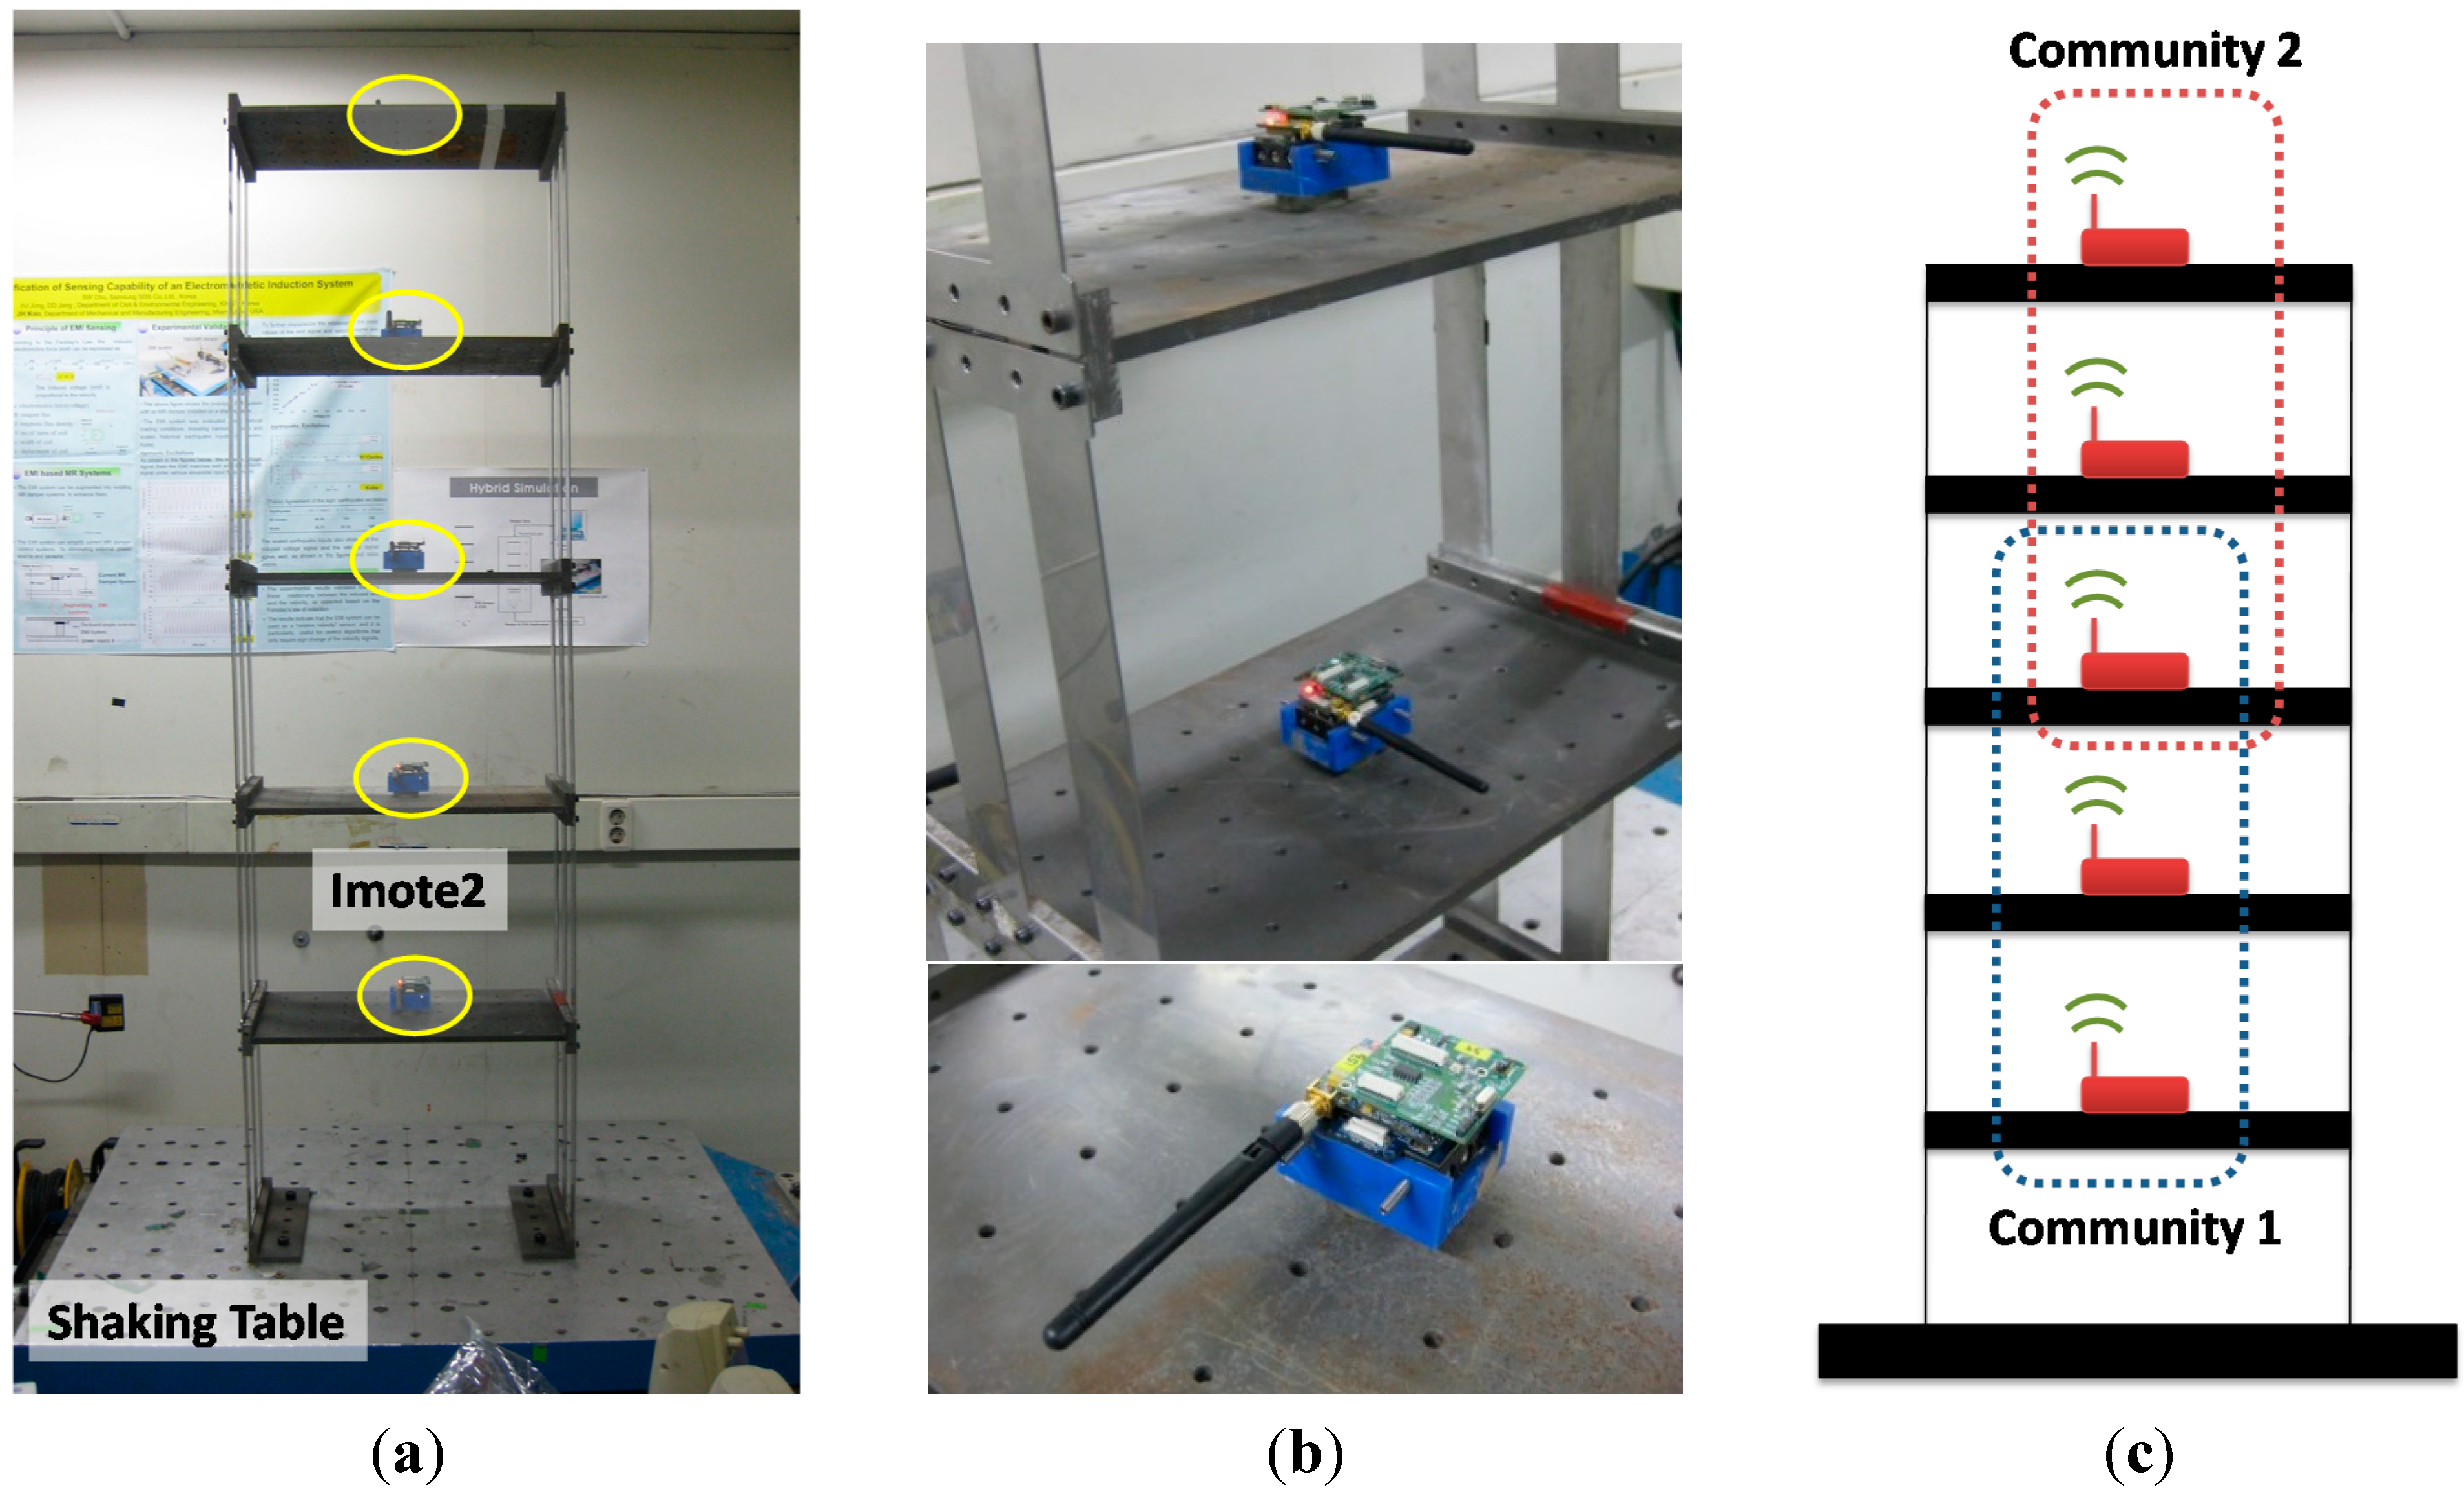
The test bed is the shear building model with 6 Imote2 sensor nodes on each floor (see
Figure 5). The shear building is flexible in the horizontal direction while relatively rigid in the transverse direction; thus, bending modes in the transverse direction and torsional modes are not expected in the low frequency region. The shaking table in
Figure 5a is used to horizontally excite the test bed with a band-limited white noise on the interval 0–15 Hz so that the horizontal bending modes are well excited. The Imote2 sensor nodes shown in
Figure 5b measure horizontal accelerations with a sampling rate of 50 Hz associated with a 20 Hz cutoff frequency, which is sufficient to capture the lower five modes. Note that the ISM400 sensor board supports up to 280 Hz for sampling. Each acceleration signal is 10,752 points in length, allowing 20 times of averaging with the number of FFT of 1024 and 50% overlap between spectral windows.
Figure 5.
Experimental setup. (a) Shear building; (b) Installed Imote2; (c) Network topology.
Figure 5.
Experimental setup. (a) Shear building; (b) Installed Imote2; (c) Network topology.
Two local sensor communities are considered as shown in
Figure 5c to apply the decentralized in-network data processing using SDSI. Each sensor network has three sensor nodes and shares the node in the 3rd floor. Due to this overlapping node, local mode shapes from communities 1 and 2 can be combined to produce the global mode shapes. Nodes in the 1st and 5th floors are designated to cluster-heads. The experiment is conducted following the procedure shown in
Figure 6.
Figure 6.
Flowchart of the experiment.
Figure 6.
Flowchart of the experiment.
5.2. Experimental Results
The SDSI is used to perform decentralized in-network data processing using SSI in the random vibration testing. As designed, the network of Imote2 sensors measures horizontal acceleration, estimates correlation functions, and applies SSI. Local modal properties from two cluster-heads are collected at the base station and assembled to yield global modal properties. The natural frequencies of the whole system can be reasonably determined as the mean values of the natural frequencies from two local communities, as the natural frequency is in general a global property. Local mode shapes can be connected to each other, as two local communities share a sensor node.
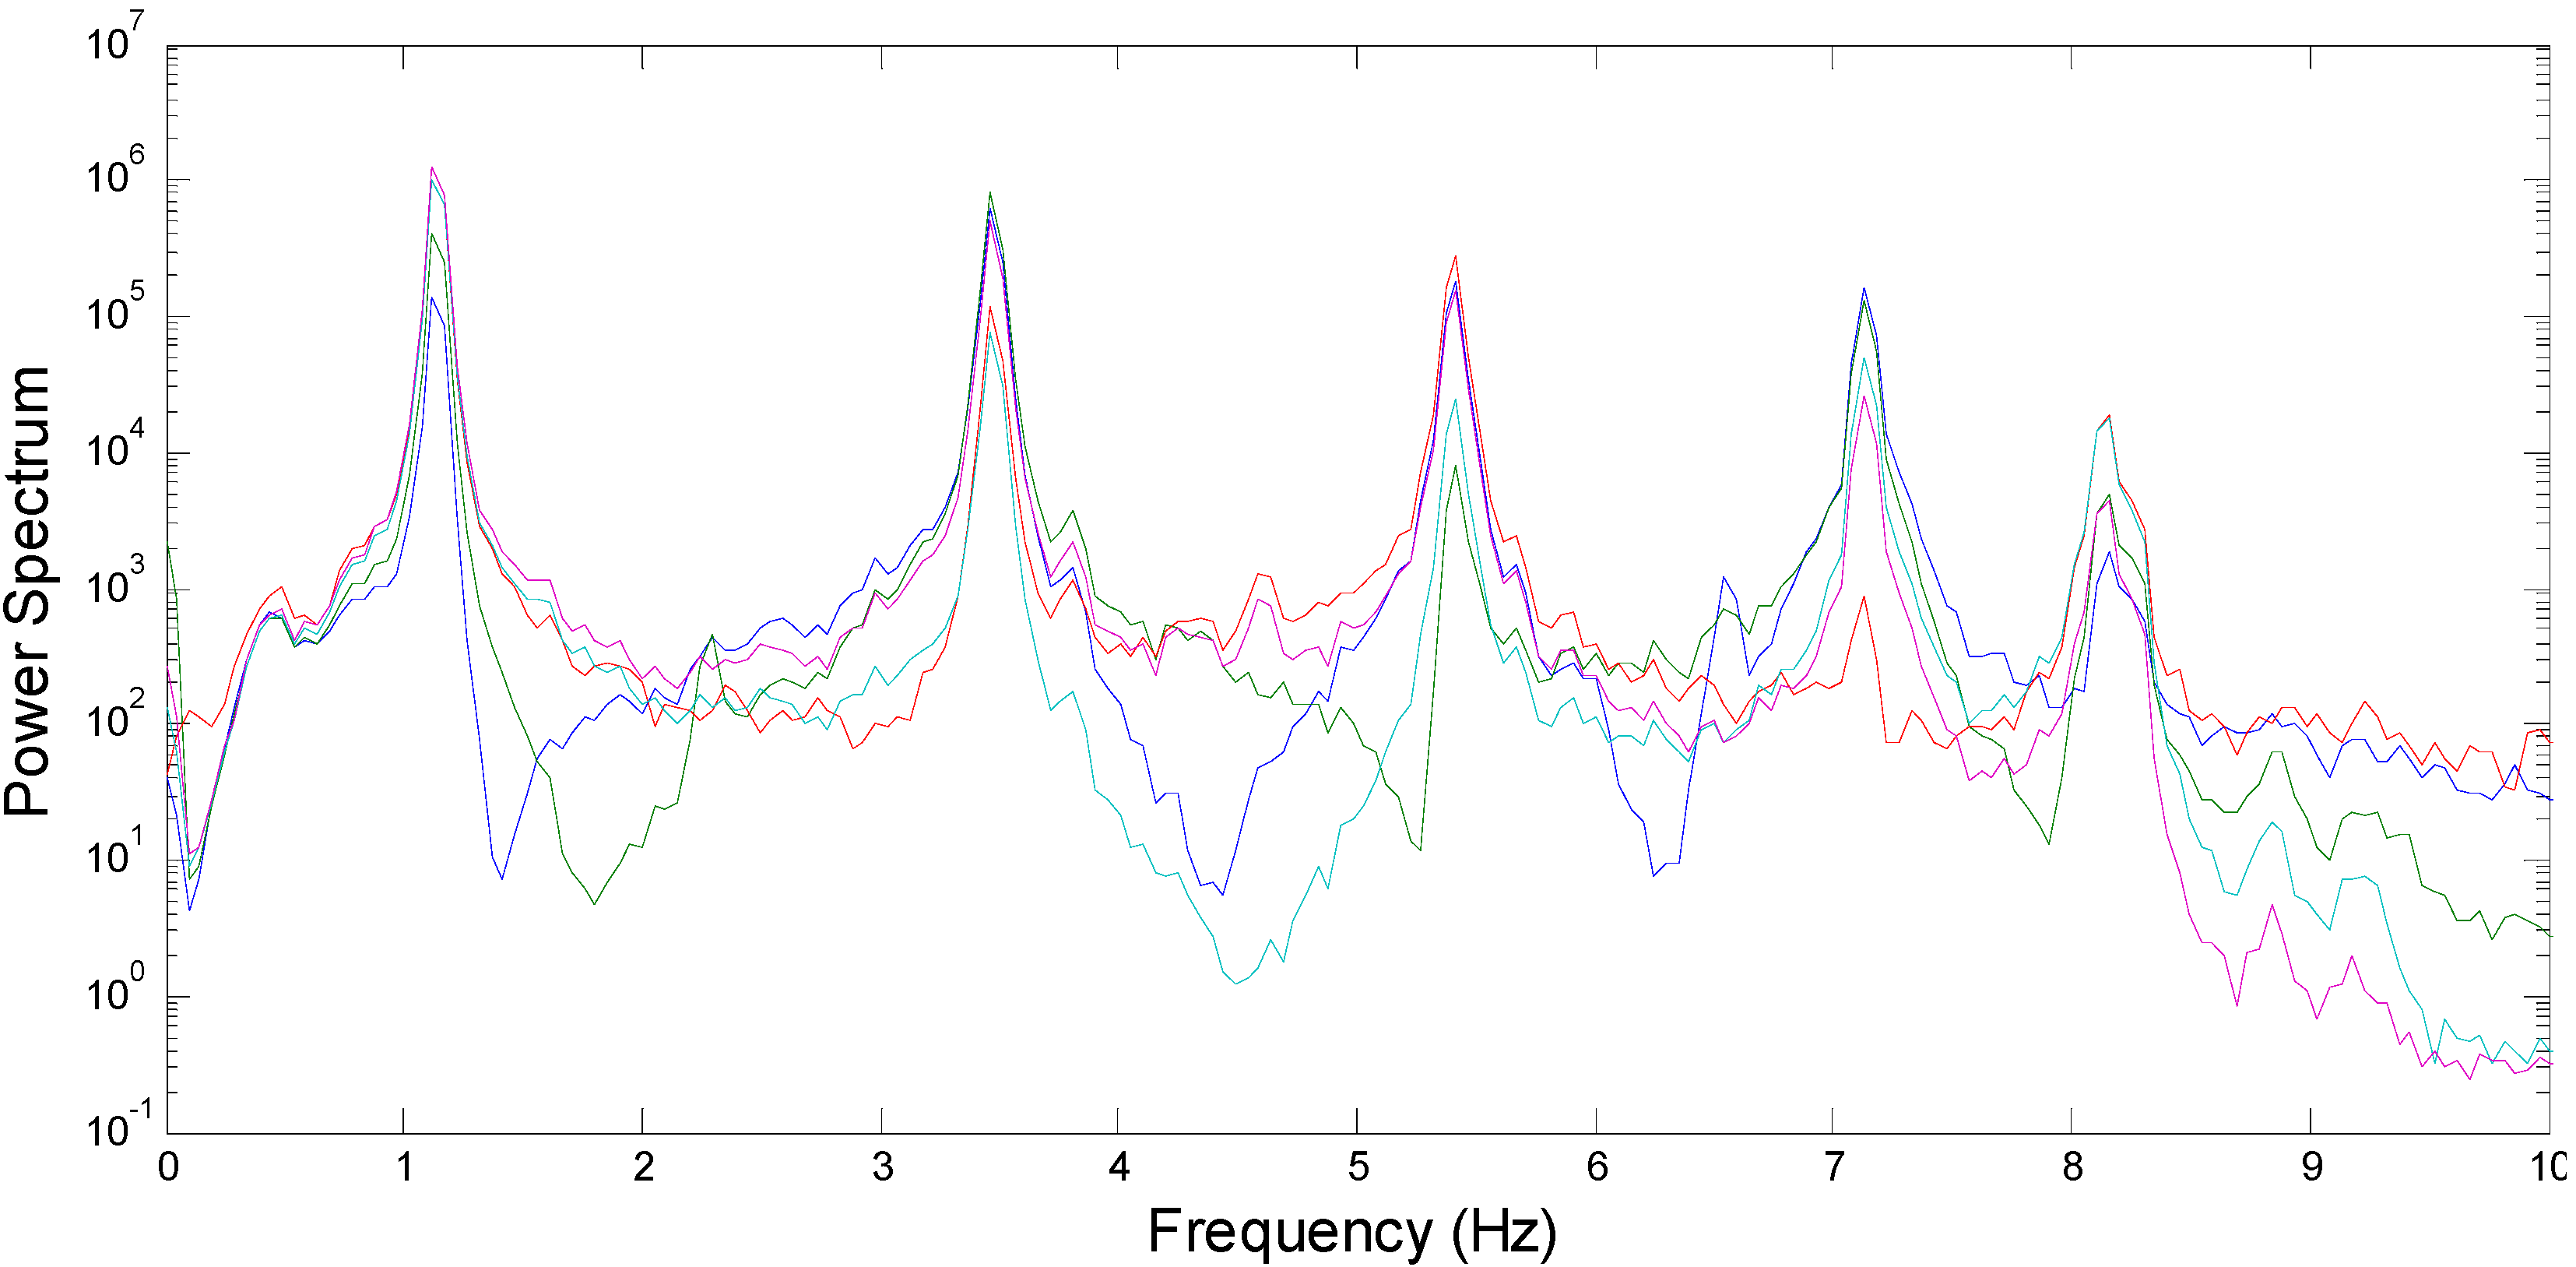
To verify the results obtained from the decentralized data processing, the centralized approach is employed as the reference information: all measured acceleration time histories are collected at the base station and used to calculate the modal properties using MATLAB. In addition, the power spectra of the collected accelerations shown in
Figure 7 commonly have five peaks expected to correspond to five bending modes in the horizontal directions.
Figure 7.
Power spectra of measured acceleration responses.
Figure 7.
Power spectra of measured acceleration responses.
To quantitatively evaluate the accuracy with respect to the reference, the difference ratio
in Equation (8) for natural frequencies and the modal assurance criterion (MAC) [
32] in Equation (9) for mode shapes are selected as accuracy measures.
Note that
and MAC close to 0 and 1, respectively, represent the accurate estimation. Using
and MAC, the modal properties estimated from the WSN using the in-network data processing are compared to those calculated on the PC in the centralized way as shown in
Table 1.
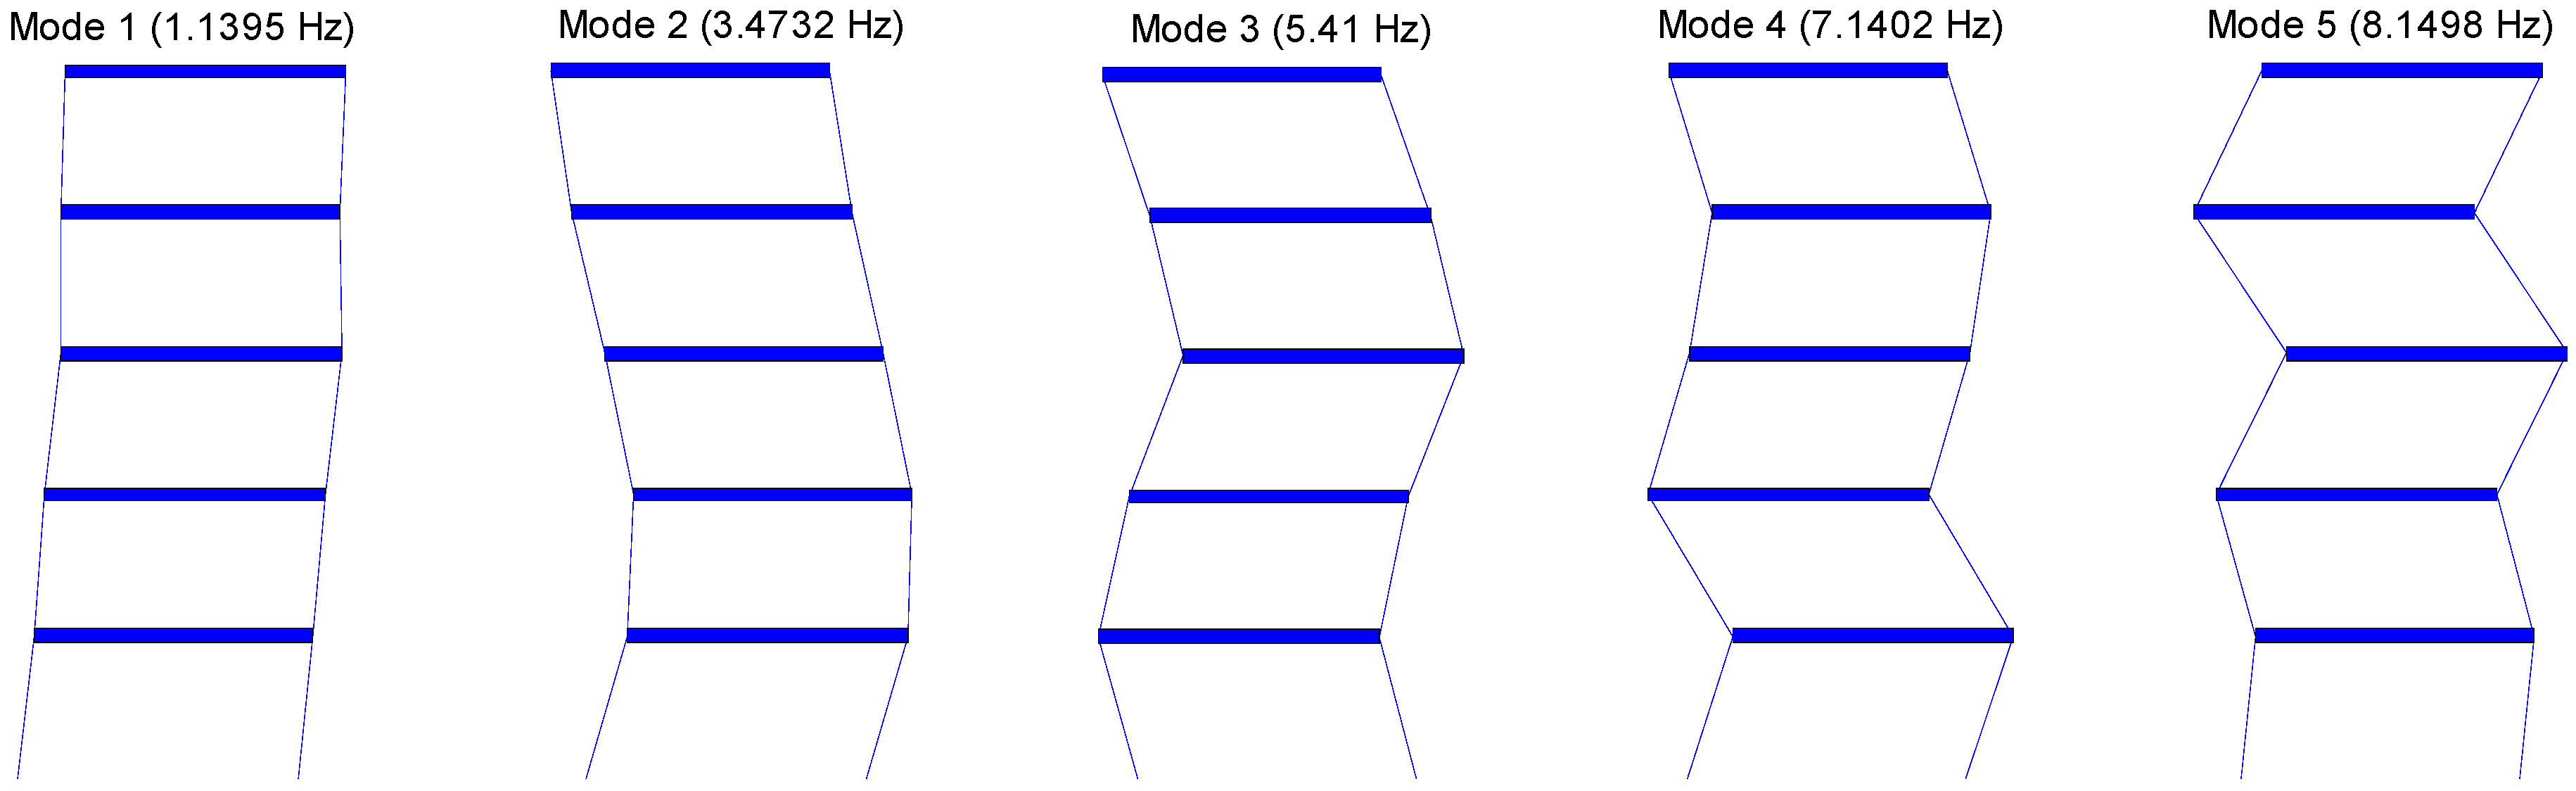
is less than 0.2% and MAC is close to 1 for all modes; SDSI is able to consistently produce accurate system identification results. Additionally, the combined global mode shapes based on the SDSI results are shown in
Figure 8. As such, the decentralized system identification using SSI is successfully implemented on the WSN employing the Imote2 sensor nodes.
Table 1.
Comparison of modal properties from centralized and decentralized data processing schemes.
Table 1.
Comparison of modal properties from centralized and decentralized data processing schemes.
| Mode Order | Natural Frequency | Mode Shape |
|---|
| Centralized () | Decentralized () | | MAC |
|---|
| 1 | 1.139 | 1.140 | 0.02 | 1.00 |
| 2 | 3.474 | 3.473 | 0.02 | 1.00 |
| 3 | 5.407 | 5.410 | 0.06 | 0.99 |
| 4 | 7.134 | 7.140 | 0.09 | 0.99 |
| 5 | 8.135 | 8.150 | 0.19 | 0.99 |
Figure 8.
Identified natural frequencies and corresponding mode shapes.
Figure 8.
Identified natural frequencies and corresponding mode shapes.
6. Conclusions
This study presented the decentralized system identification using SSI for WSNs. The proposed approach is based on the hierarchical network that consists of local sensor communities. Once structural responses are measured by the network-wide synchronized sensing as the first step, each sensor community starts the community-wide data processing: the cluster-head centrally collects sensor data from all leaf nodes in their community and estimates the full correlation functions matrices that are subsequently used as the input to SSI. The calculated local system information from each community is sent to the base station to obtain the global information. This process is implemented on the Imote2-based WSN using the ISHMP Services Toolsuite.
The decentralized system identification with SSI and its implementation on the WSN were experimentally verified using the 5-story shear building model. A total of five Imote2 sensors were placed on each floor and measured acceleration responses due to the base excitation. The network is divided into two local sensor communities, each of which has three Imote2 sensor nodes and shares one node with the other community. The identification results from the WSN and the centralized approach are close to each other with Ef less than 0.2% and MAC of 1 or 0.99, showing the validity of the proposed approach.
Acknowledgments
This work was supported by the 2011 Research Fund (1.110021.01) of UNIST (Ulsan National Institute of Science and Technology).
Author Contributions
S. Cho developed the decentralized model, computer code, and sensor design; J.-W. Park performed the experiments and analyzed the data; S.-H. Sim supervised the interpretation of results and improved the paper.
Conflicts of Interest
The authors declare no conflict of interest.
References
- Lynch, J.P.; Sundararajan, A.; Law, K.H.; Kiremidjian, A.S.; Carryer, E.; Sohn, H.; Farrar, C. Field Validation of a Wireless Structural Monitoring System on the Alamosa Canyon Bridge. In Proceedings of the SPIE 5057: Smart Structures and Materials, San Diego, CA, USA, 2–6 March 2003; pp. 267–278.
- Spencer, B.F., Jr.; Ruiz-Sandoval, M.; Kurata, N. Smart sensing technology: Opportunities and challenges. Struct. Control Health Monit. 2004, 11, 349–368. [Google Scholar] [CrossRef]
- Cho, S.; Giles, R.K.; Spencer, B.F., Jr. System identification of a historic swing truss bridge using a wireless sensor network employing orientation correction. Struct. Control Health Monit. 2015, 22, 255–272. [Google Scholar] [CrossRef]
- Jang, S.; Dahal, S.; Li, J. Rapid full-scale expansion joint monitoring using wireless hybrid sensor. Smart Struct. Syst. 2013, 12, 415–426. [Google Scholar] [CrossRef]
- Shoukry, S.N.; Luo, Y.; Riad, M.Y.; William, G.W. Bridge load testing and rating: a case study through wireless sensing technology. Smart Struct. Syst. 2013, 12, 661–678. [Google Scholar] [CrossRef]
- Gao, Y.; Spencer, B.F., Jr.; Ruiz-Sandoval, M. Distributed computing strategy for structural health monitoring. Struct. Control Health Monit. 2005, 43, 488–507. [Google Scholar]
- Nagayama, T.; Spencer, B.F., Jr. Structural Health Monitoring Using Wireless Sensors; Newmark Structural Engineering Laboratory (NSEL) Report Series; University of Illinois at Urbana-Champaign: Urbana, IL, USA, November 2007. Available online: https://www.ideals.illinois.edu/bitstream/handle/2142/3521/NSEL.Report.001.pdf?sequence=4 (accessed on 7 April 2015).
- James, G.H.; Carne, T.G.; Lauffer, J.P. The Natural Excitation Technique (NExT) for Modal Parameter Extraction from Operating Wind Turbines; Sandia Report, SAND92-1666; Sandia National Laboratories: Albuquerque, NM, USA, February 1993. Available online: http://prod.sandia.gov/techlib/access-control.cgi/1992/921666.pdf (accessed on 7 April 2015).
- Juang, J.N.; Pappa, R.S. An eigensystem realization algorithm for modal parameter identification and model reduction. J. Guid. Control Dyn. 1985, 8, 620–627. [Google Scholar] [CrossRef]
- Brincker, R.; Zhang, L.; Andersen, P. Modal identification of output-only systems using frequency domain decomposition. Smart Mater. Struct. 2001, 10, 441–445. [Google Scholar] [CrossRef]
- Cole, H.A. On-the-analysis of Random Vibrations. In Proceedings of AIAA/ASME 9th Structures, Structural Dynamics and Materials Conference, Palm Springs, CA, USA, 1–3 April 1968; pp. 68–288.
- Sadhu, A.; Narasimhan, S.; Goldback, A. Decentralized modal identification of a pony truss pedestrian bridge using wireless sensors. J. Bridge Eng. 2014, 19, 04014013. [Google Scholar] [CrossRef]
- Wu, N.; Liu, C.; Guo, Y.; Zhang, J. On-board computing for structural health monitoring with smart wireless sensors by modal identification using Hilbert-Huang transform. Math. Probl. Eng. 2013, 2013. [Google Scholar] [CrossRef]
- Park, J.-W.; Sim, S.-H.; Jung, H.-J. Wireless sensor network for decentralized damage detection of building structures. Smart Struct. Syst. 2013, 12, 399–414. [Google Scholar] [CrossRef]
- Hackmann, G.; Sun, F.; Castaneda, N.; Lu, C.; Dyke, S. A holistic approach to decentralized structural damage localization using wireless sensor networks. Comput. Commun. 2012, 36, 29–41. [Google Scholar] [CrossRef]
- Jalsan, K.-E.; Soman, R.N.; Flouri, K.; Kyriakides, M.A.; Feltrin, G.; Onoufriou, T. Layout optimization of wireless sensor networks for structural health monitoring. Smart Struct. Syst. 2014, 14, 39–54. [Google Scholar]
- Hermans, L.; van der Auweraer, H. Modal testing and analysis of structures under operational conditions: Industrial applications. Mech. Syst. Signal Process. 1999, 13, 193–216. [Google Scholar] [CrossRef]
- Yi, J.H.; Yun, C.B. Comparative study on modal identification methods using output-only information. Struct. Eng. Mech. 2004, 17, 445–466. [Google Scholar] [CrossRef]
- Tanner, N.A.; Wait, J.R.; Farrar, C.R.; Sohn, H. Structural health monitoring using modular wireless sensors. J. Intell. Mater. Syst. Struct. 2003, 14, 43–56. [Google Scholar] [CrossRef]
- Caffrey, J.; Govindan, R.; Johnson, E.; Krishnamachari, B.; Masri, S.; Sukhatme, G.; Chintalapudi, K.; Dantu, K.; Rangwala, S.; Sridharan, A.; et al. Networked Sensing for Structural Health Monitoring. In Proceedings of the 4th International Workshop on Structural Control, New York, NY, USA, 10–11 June 2004; pp. 57–66.
- Lynch, J.P.; Sundararajan, A.; Law, K.H.; Kiremidjian, A.S.; Carryer, E. Embedding damage detection algorithms in a wireless sensing unit for operational power efficiency. Smart Mater. Struct. 2004, 13, 800–810. [Google Scholar] [CrossRef]
- Lynch, J.P.; Parra-Montesinos, G.; Canbolat, B.A.; Hou, T.-C. Real-time Damage Prognosis of High-performance Fiber Reinforced Cementitious Composite Structures. In Proceedings of Conference on Advances in Structural Engineering and Mechanics (ASEM’04), Seoul, Korea, 2–4 September 2004.
- Nitta, Y.; Nagayama, T.; Spencer, B.F., Jr.; Nishitani, A. Rapid Damage Assessment for the Structures Utilizing Wireless Sensor MICA2 MOTE. In Proceedings of the 5th International Workshop on Structural Health Monitoring, Stanford, CA, USA, 12–14 September 2005; pp. 283–290.
- Park, J.H. Development of Autonomous Wireless Sensor Nodes for Hybrid Structural Health Monitoring of Large Structures. Ph.D Thesis, Dissertation, Pukyung National University, Busan, Korea, February 2009. [Google Scholar]
- Cho, S.; Lynch, J.P.; Lee, J.-J.; Yun, C.-B. Development of an automated wireless tension force system for cable-stayed bridges. J. Intell. Mater. Syst. Struct. 2010, 21, 361–375. [Google Scholar] [CrossRef]
- Sim, S.; Li, J.; Jo, H.; Park, J.-W.; Cho, S.; Spencer, B.F., Jr.; Jung, H.-J. A wireless smart sensor network for automated monitoring of cable tension. Smart Mater. Struct. 2014, 23. [Google Scholar] [CrossRef]
- Jang, S.; Sim, S.-H.; Jo, H.; Spencer, B.F., Jr. Full-scale experimental validation of decentralized damage identification using wireless smart sensors. Smart Mater. Struct. 2012, 21. [Google Scholar] [CrossRef]
- Rice, J.A.; Spencer, B.F., Jr. Flexible Wireless Sensor Framework for Autonomous Full-Scale Structural Health Monitoring; Newmark Structural Engineering Laboratory (NSEL) Report Series, No. 18; University of Illinois at Urbana-Champaign: Urbana, IL, USA, 1 August 2009. [Google Scholar]
- Illinois Structural Health Monitoring Project. Available online: http://shm.cs.uiuc.edu (accessed on 3 February 2015).
- Rice, J.A.; Mechitov, K.A.; Sim, S.H.; Spencer, B.F., Jr. Enabling framework for structural health monitoring using wireless sensors. Struct. Control Health Monit. 2011, 18, 574–587. [Google Scholar] [CrossRef]
- Sim, S.H.; Spencer, B.F., Jr.; Zhang, M.; Xie, H. Automated decentralized modal analysis using wireless sensors. Struct. Control Health Monit. 2010, 17, 872–894. [Google Scholar] [CrossRef]
- Allemang, R.J.; Brown, D.L. Correlation Coefficient for Modal Vector Analysis. In Proceedings of the International Modal Analysis Conference, Orlando, FL, USA, 8–10 November 1982; pp. 110–116.
© 2015 by the authors; licensee MDPI, Basel, Switzerland. This article is an open access article distributed under the terms and conditions of the Creative Commons Attribution license (http://creativecommons.org/licenses/by/4.0/).


