
Carded Tow Real-Time Color Assessment: A Spectral Camera-Based System


Abstract
:
1. Introduction and Background
- (1)
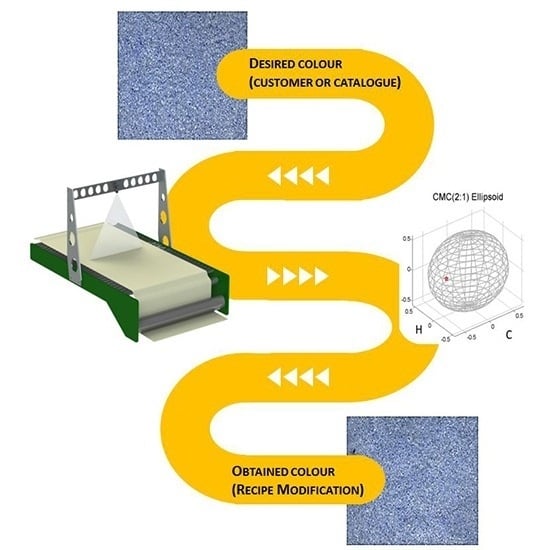
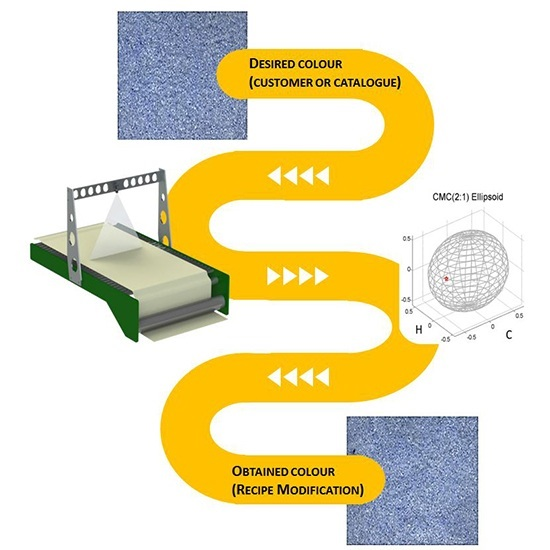
- Often not even raw materials are colored as expected; as a consequence, at a laboratory level, when blending differently colored fibers (even according to well established recipes) the final resulting blend may be very different from the reference (target). As mentioned above, this requires colorists to iterate the fabric blend creation a number of times before reaching the desired color.
- (2)
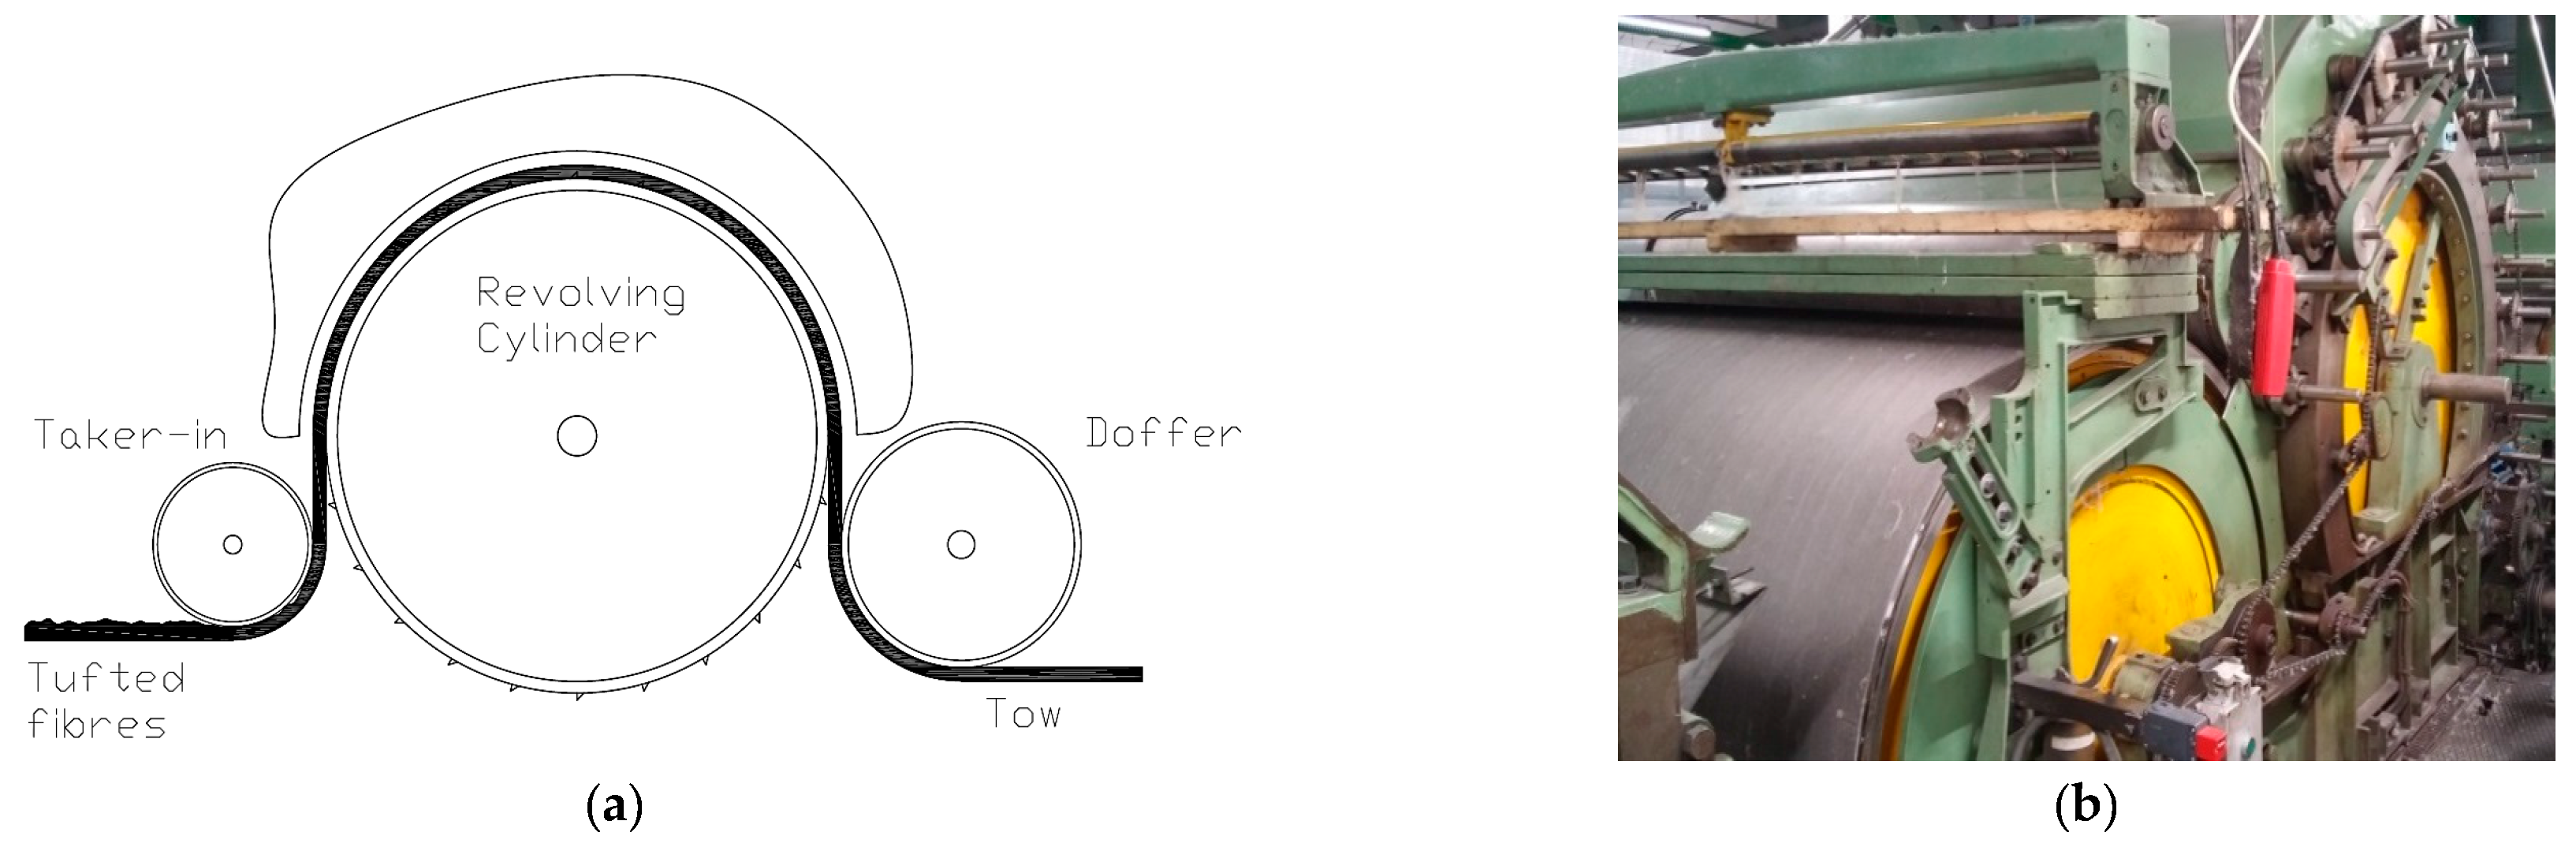
- At an industrial scale, when dealing with carding process it is not possible to guarantee the correspondence between the tow color and of the one of the laboratory carded blend. This is mainly due both to scaling proportions of fibers from the laboratory scale to the industrial one and to the blowing machine itself that commonly removes small fibers together with impurities, thus changing the actual percentage of pre-colored fibers.
- (3)
- At an industrial scale, when dealing with the spinning process, the final product (yarn) has completely different shape from the carded fabric one; as a consequence its color can be considerably different from the lab sample one. Moreover, the yarn travels at high speed (more than 200 m/min) thus making a real-time measurement particularly difficult. In addition, it has to be considered that the yarn undergoes a weaving process finalized to the creation of knitwear; therefore, the weaved fabric color itself could result far to be similar to the reference one, measured on a carded fabric.
2. Materials and Methods
- (1)
- definition of a laboratory setup able to perform repeatable color measurement on both the reference fabric and on the carded blend used for determining the optimal recipe; and
- (2)
- definition of the real-time color measurement system (hardware + software) for assessing quality control of the carded tow.
2.1. Laboratory Testing System
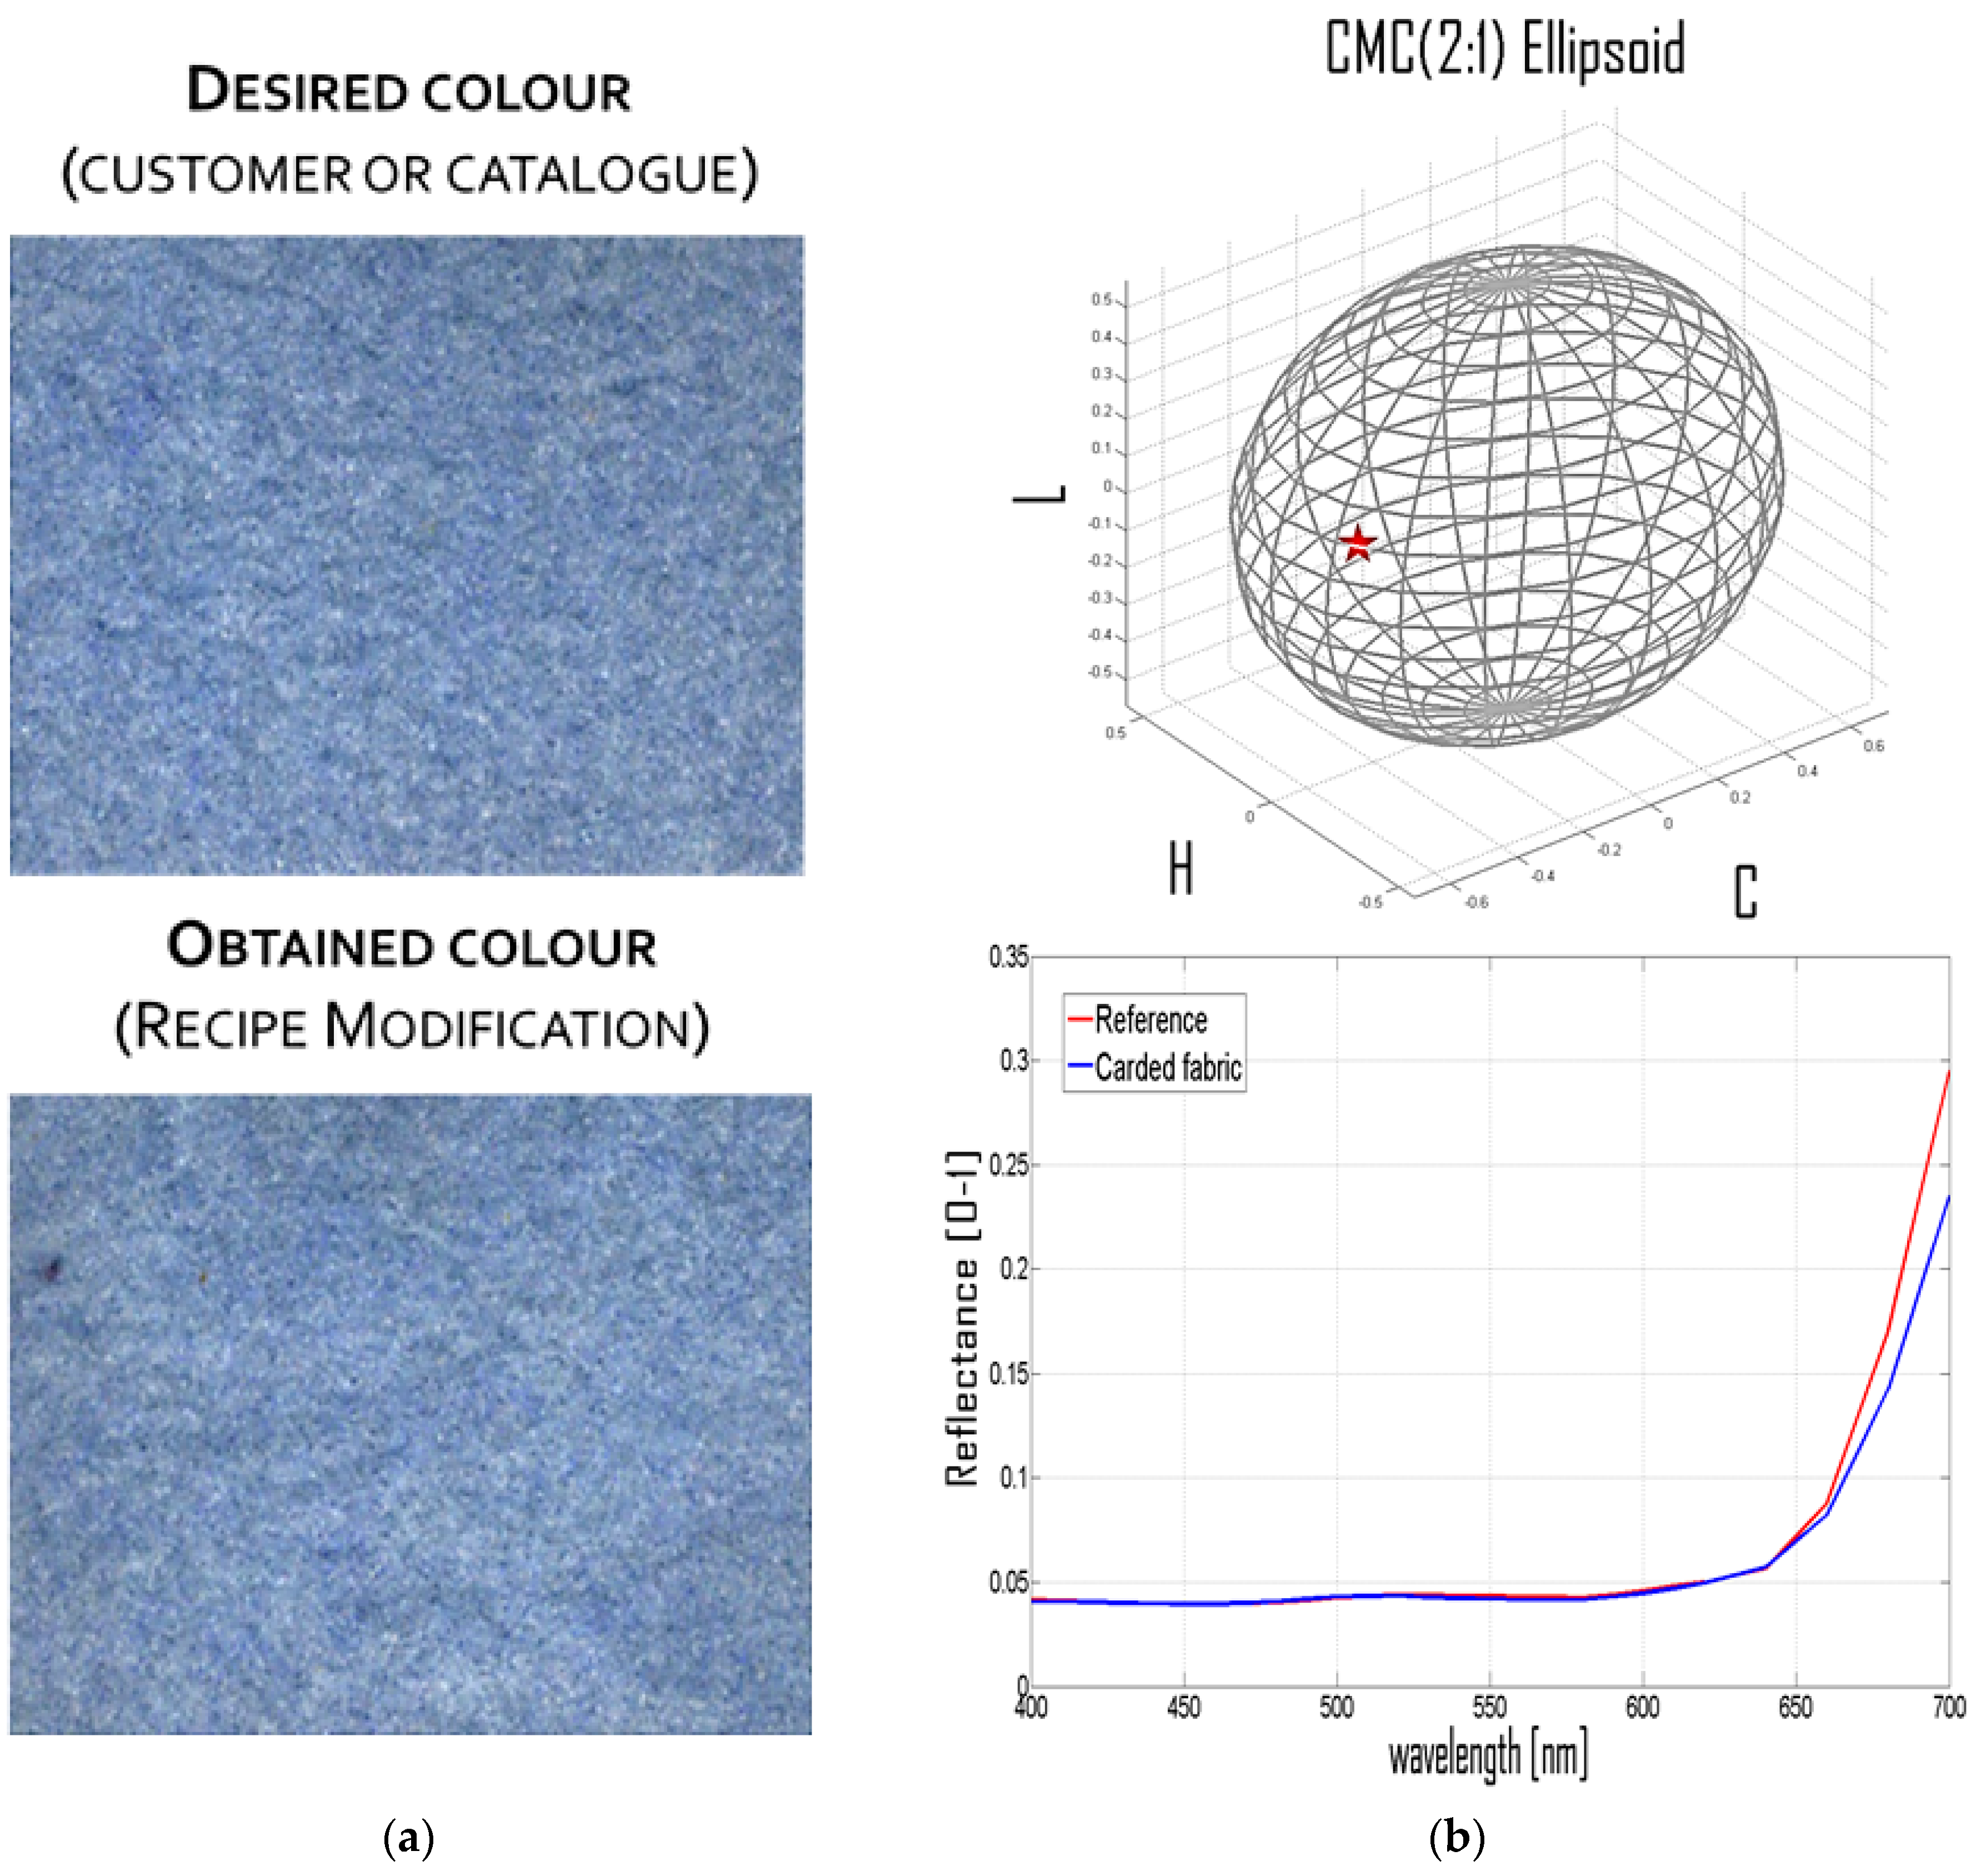
- the spectral response of carded fabric ;
- the spectral response of the reference fabric ; and
- the colorimetric distance between the carded and the reference fabric.
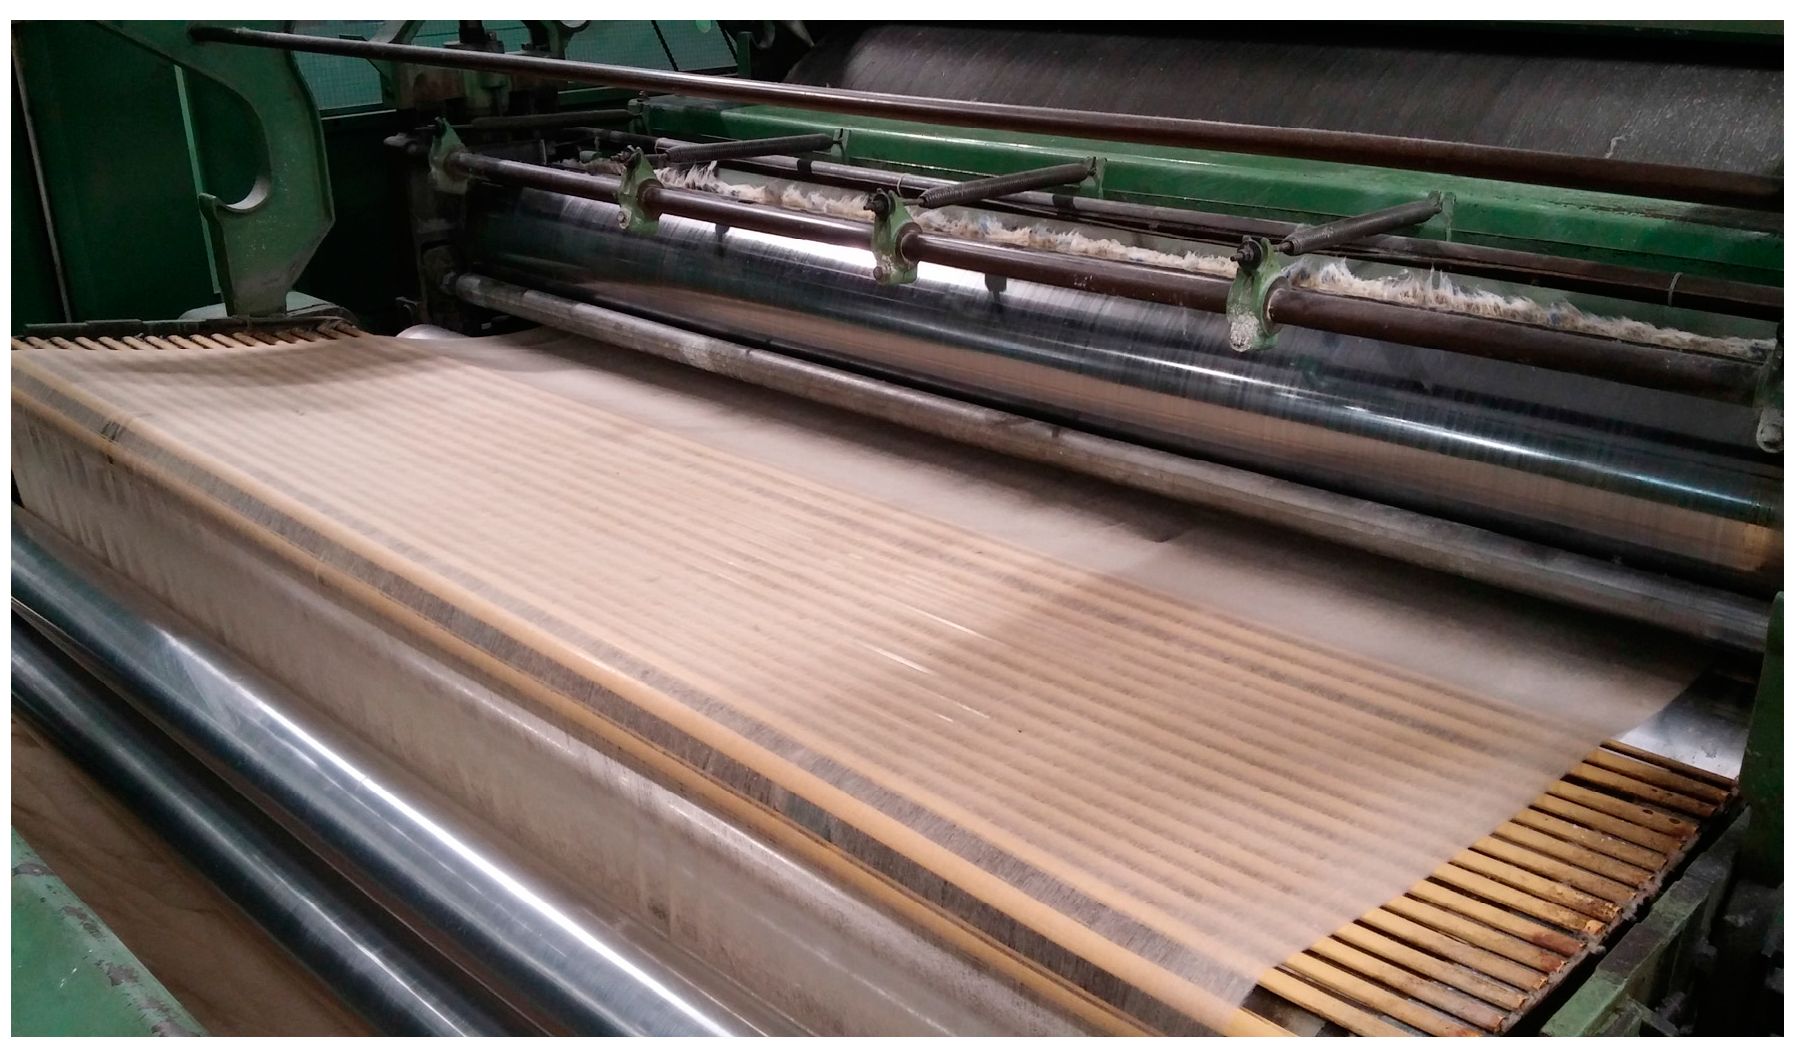
2.2. Real-Time Color Measurement System for Quality Control of a Carded Tow
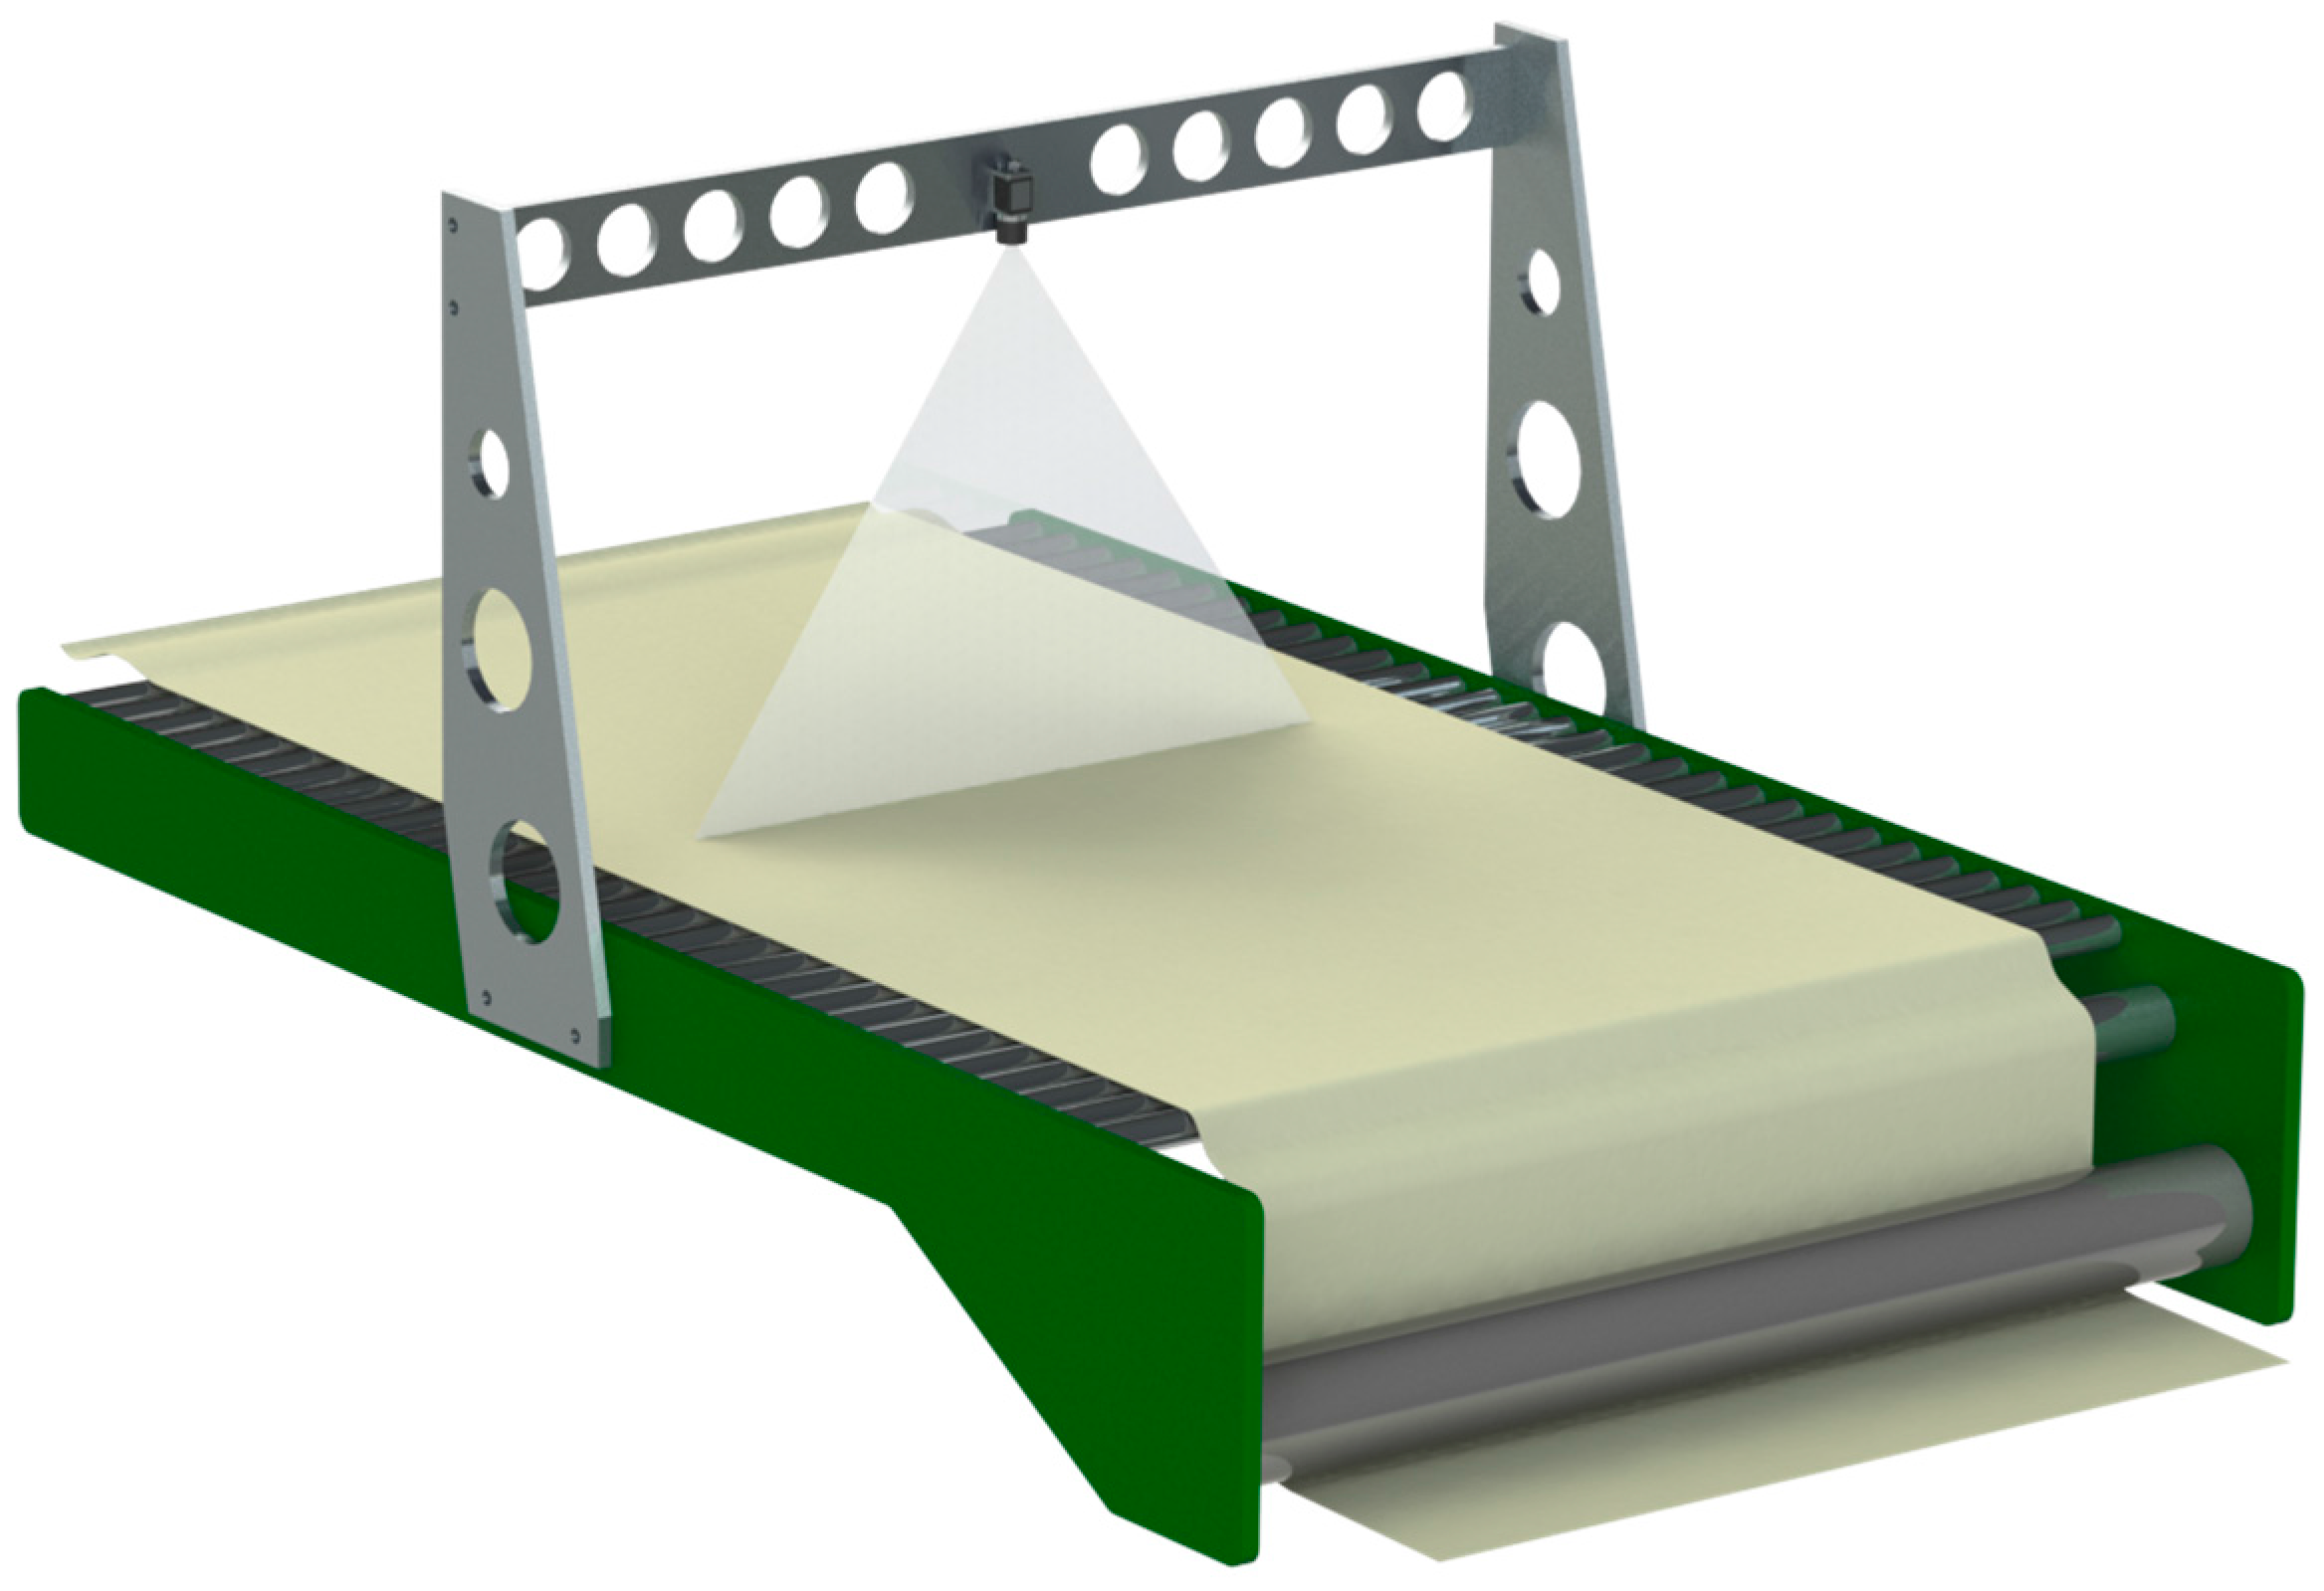
2.2.1. Hardware Setup
- -
- up to 30 fps each frame consisting on a monochrome image of the scene at a resolution of 1600 ppi and spatial resolution (RMS) lower than 9 µm; and
- -
- the reflectance factors in the spectral range 400–1000 nm (with a minimum spectral resolution equal to 2.8 nm) for 1200 points measured in the inspected line. Declared spectral sampling varies in the range 0.72–5.8 nm/pixel and numerical aperture of the VNIR detector is F/2.8.
2.2.2. Software Parameters
- is the difference, in terms of luminance (L) value, between the reference and the sample;
- is the difference, in terms of chroma (C) value, between the reference and the sample;
- is the difference, in terms of hue angle (H), between the reference and the sample;
- , and are the semi-axis of the CMC ellipsoid whose centre is defined by the triplet of LCH values of the reference sample; and
- and are empirical correction factors; for CMC(2:1) distance and .
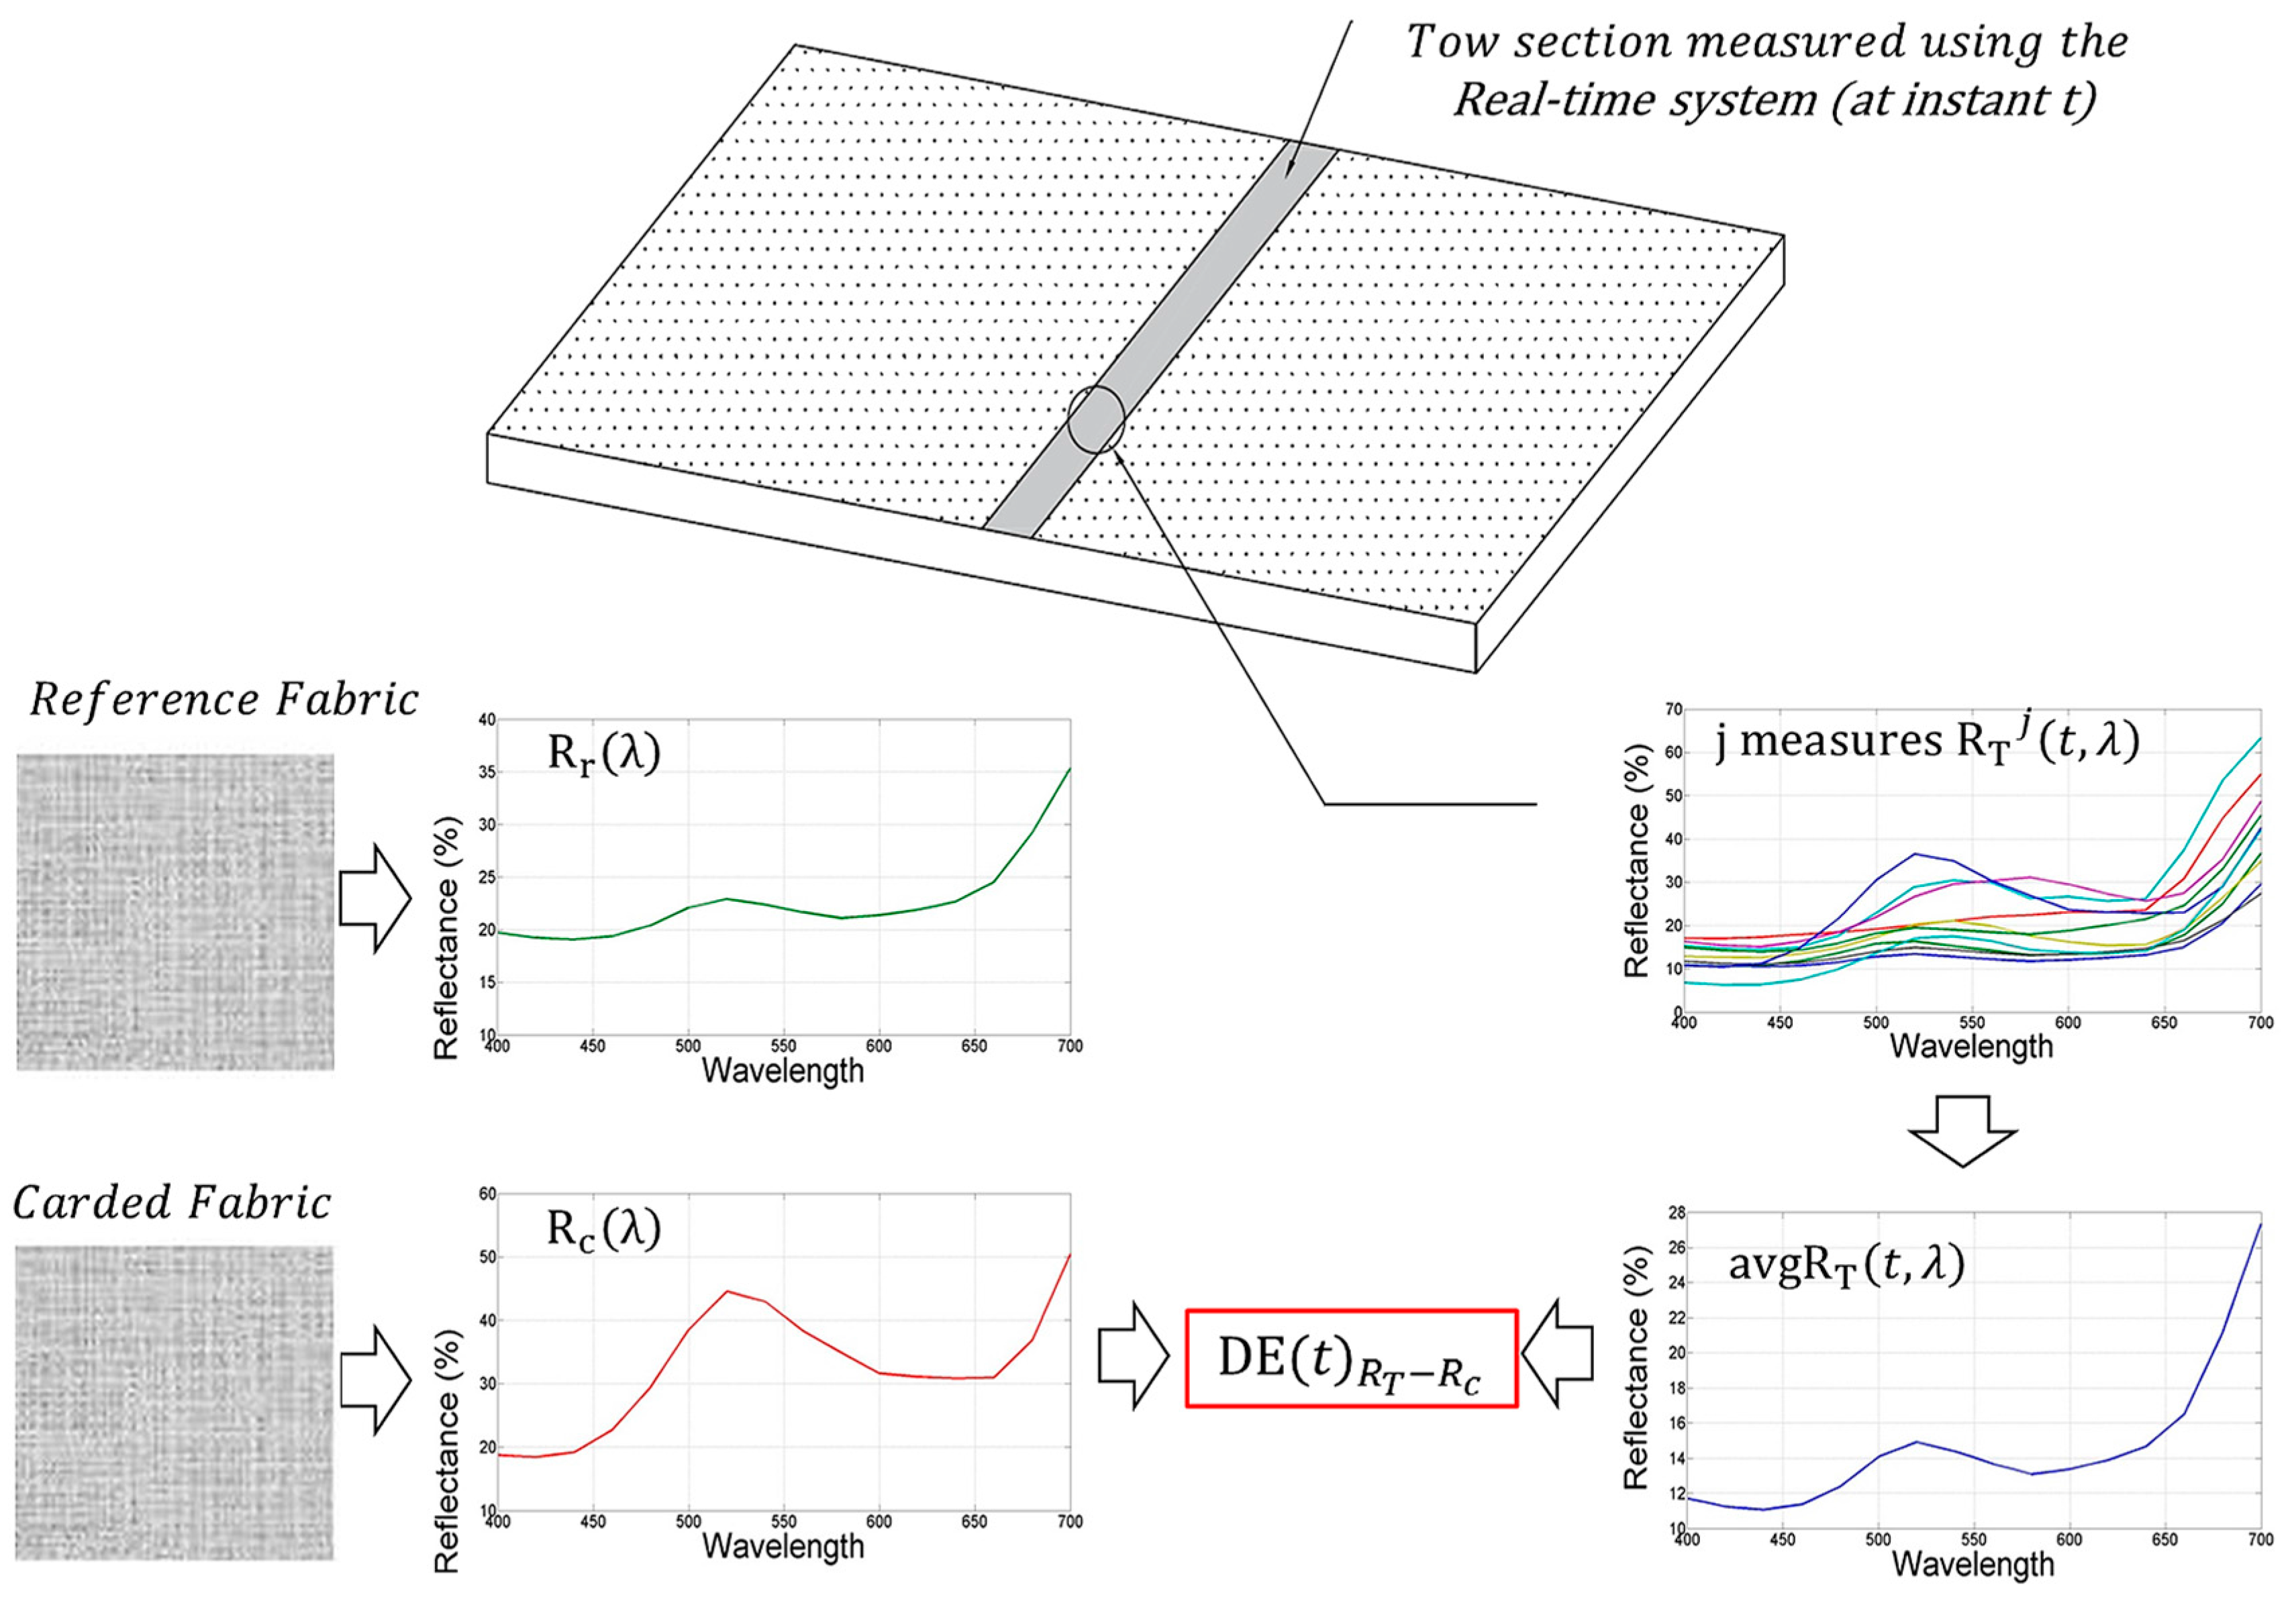
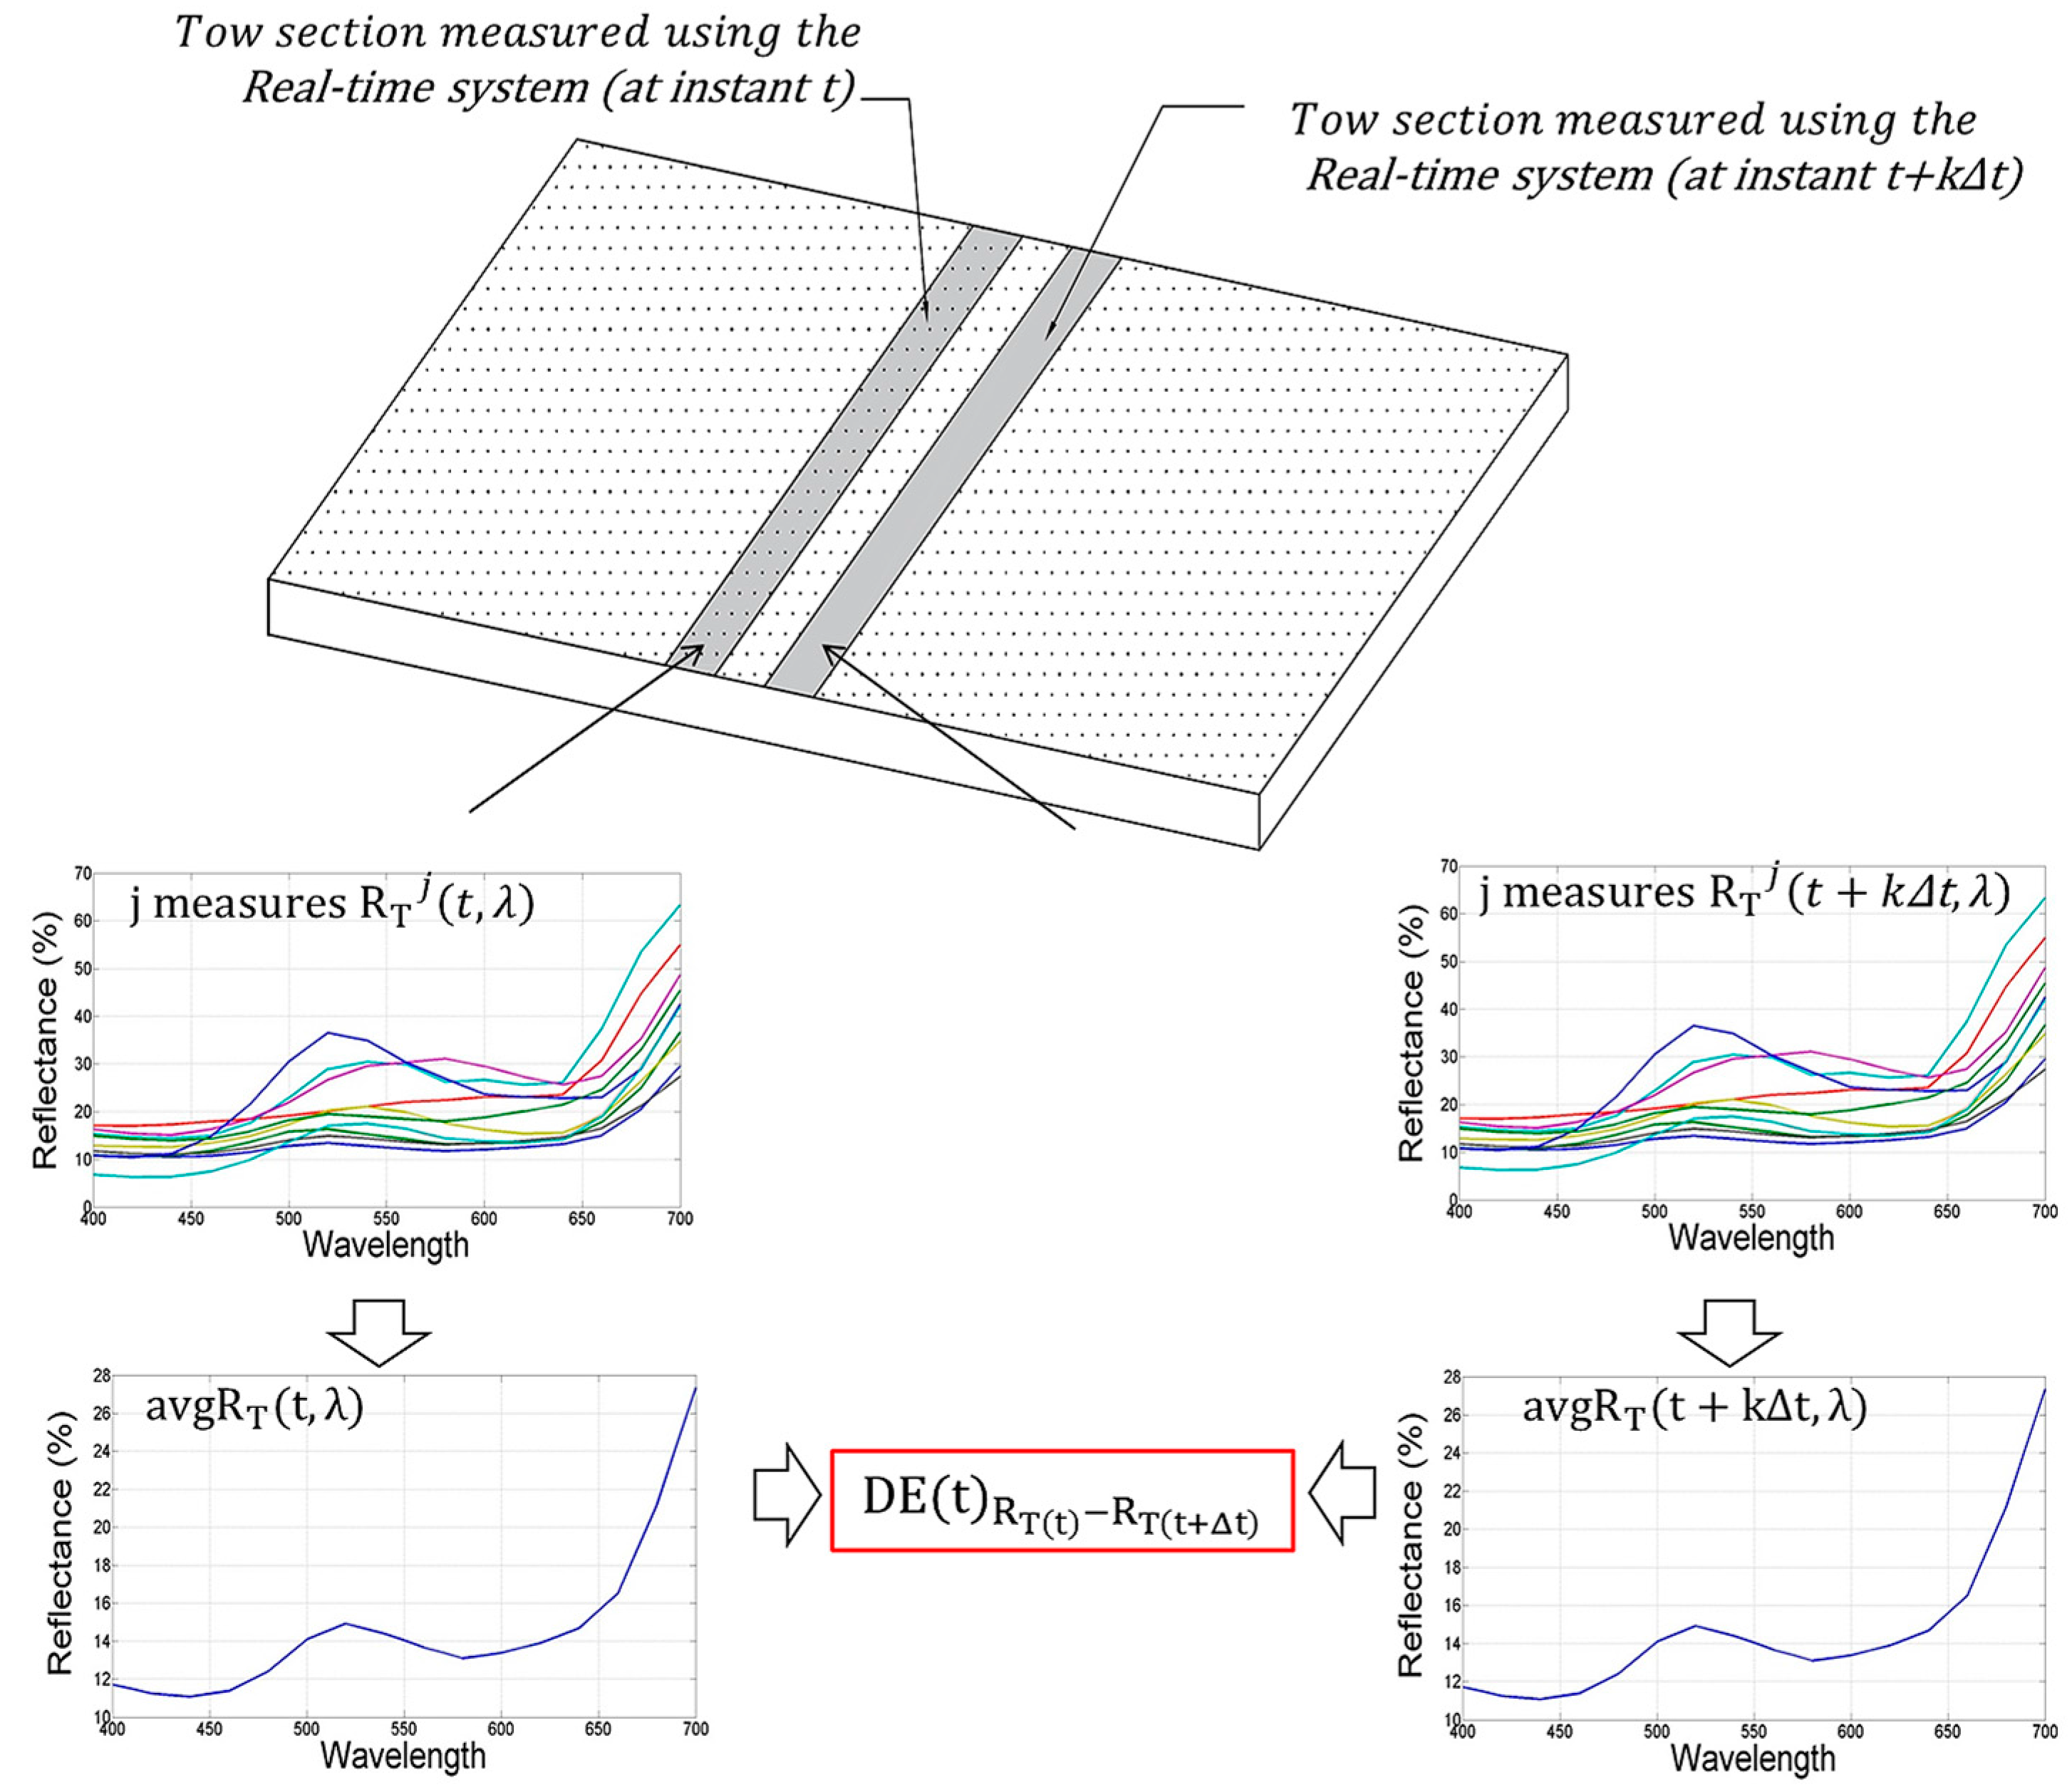
- CMC(2:1) Colorimetric distances between and ; these distances are defined at the generic instant during the carding process and allow to monitor how, averagely, the color of the tow changes with respect to the reference fabric (see Figure 7). Of course, in the case that the comparison between and is preferred to the comparison between and , it is to be taken into account that the color distance between them is provided by:
- CMC(2:1) Colorimetric distances between and . Once the averaged spectral response of the tow in an instant is measured, it is possible to monitor how color changes during the carding process (see Figure 8). As a consequence, this parameter measures the local variability of the tow color during the carding process. In fact, this distance is defined at the generic instant .
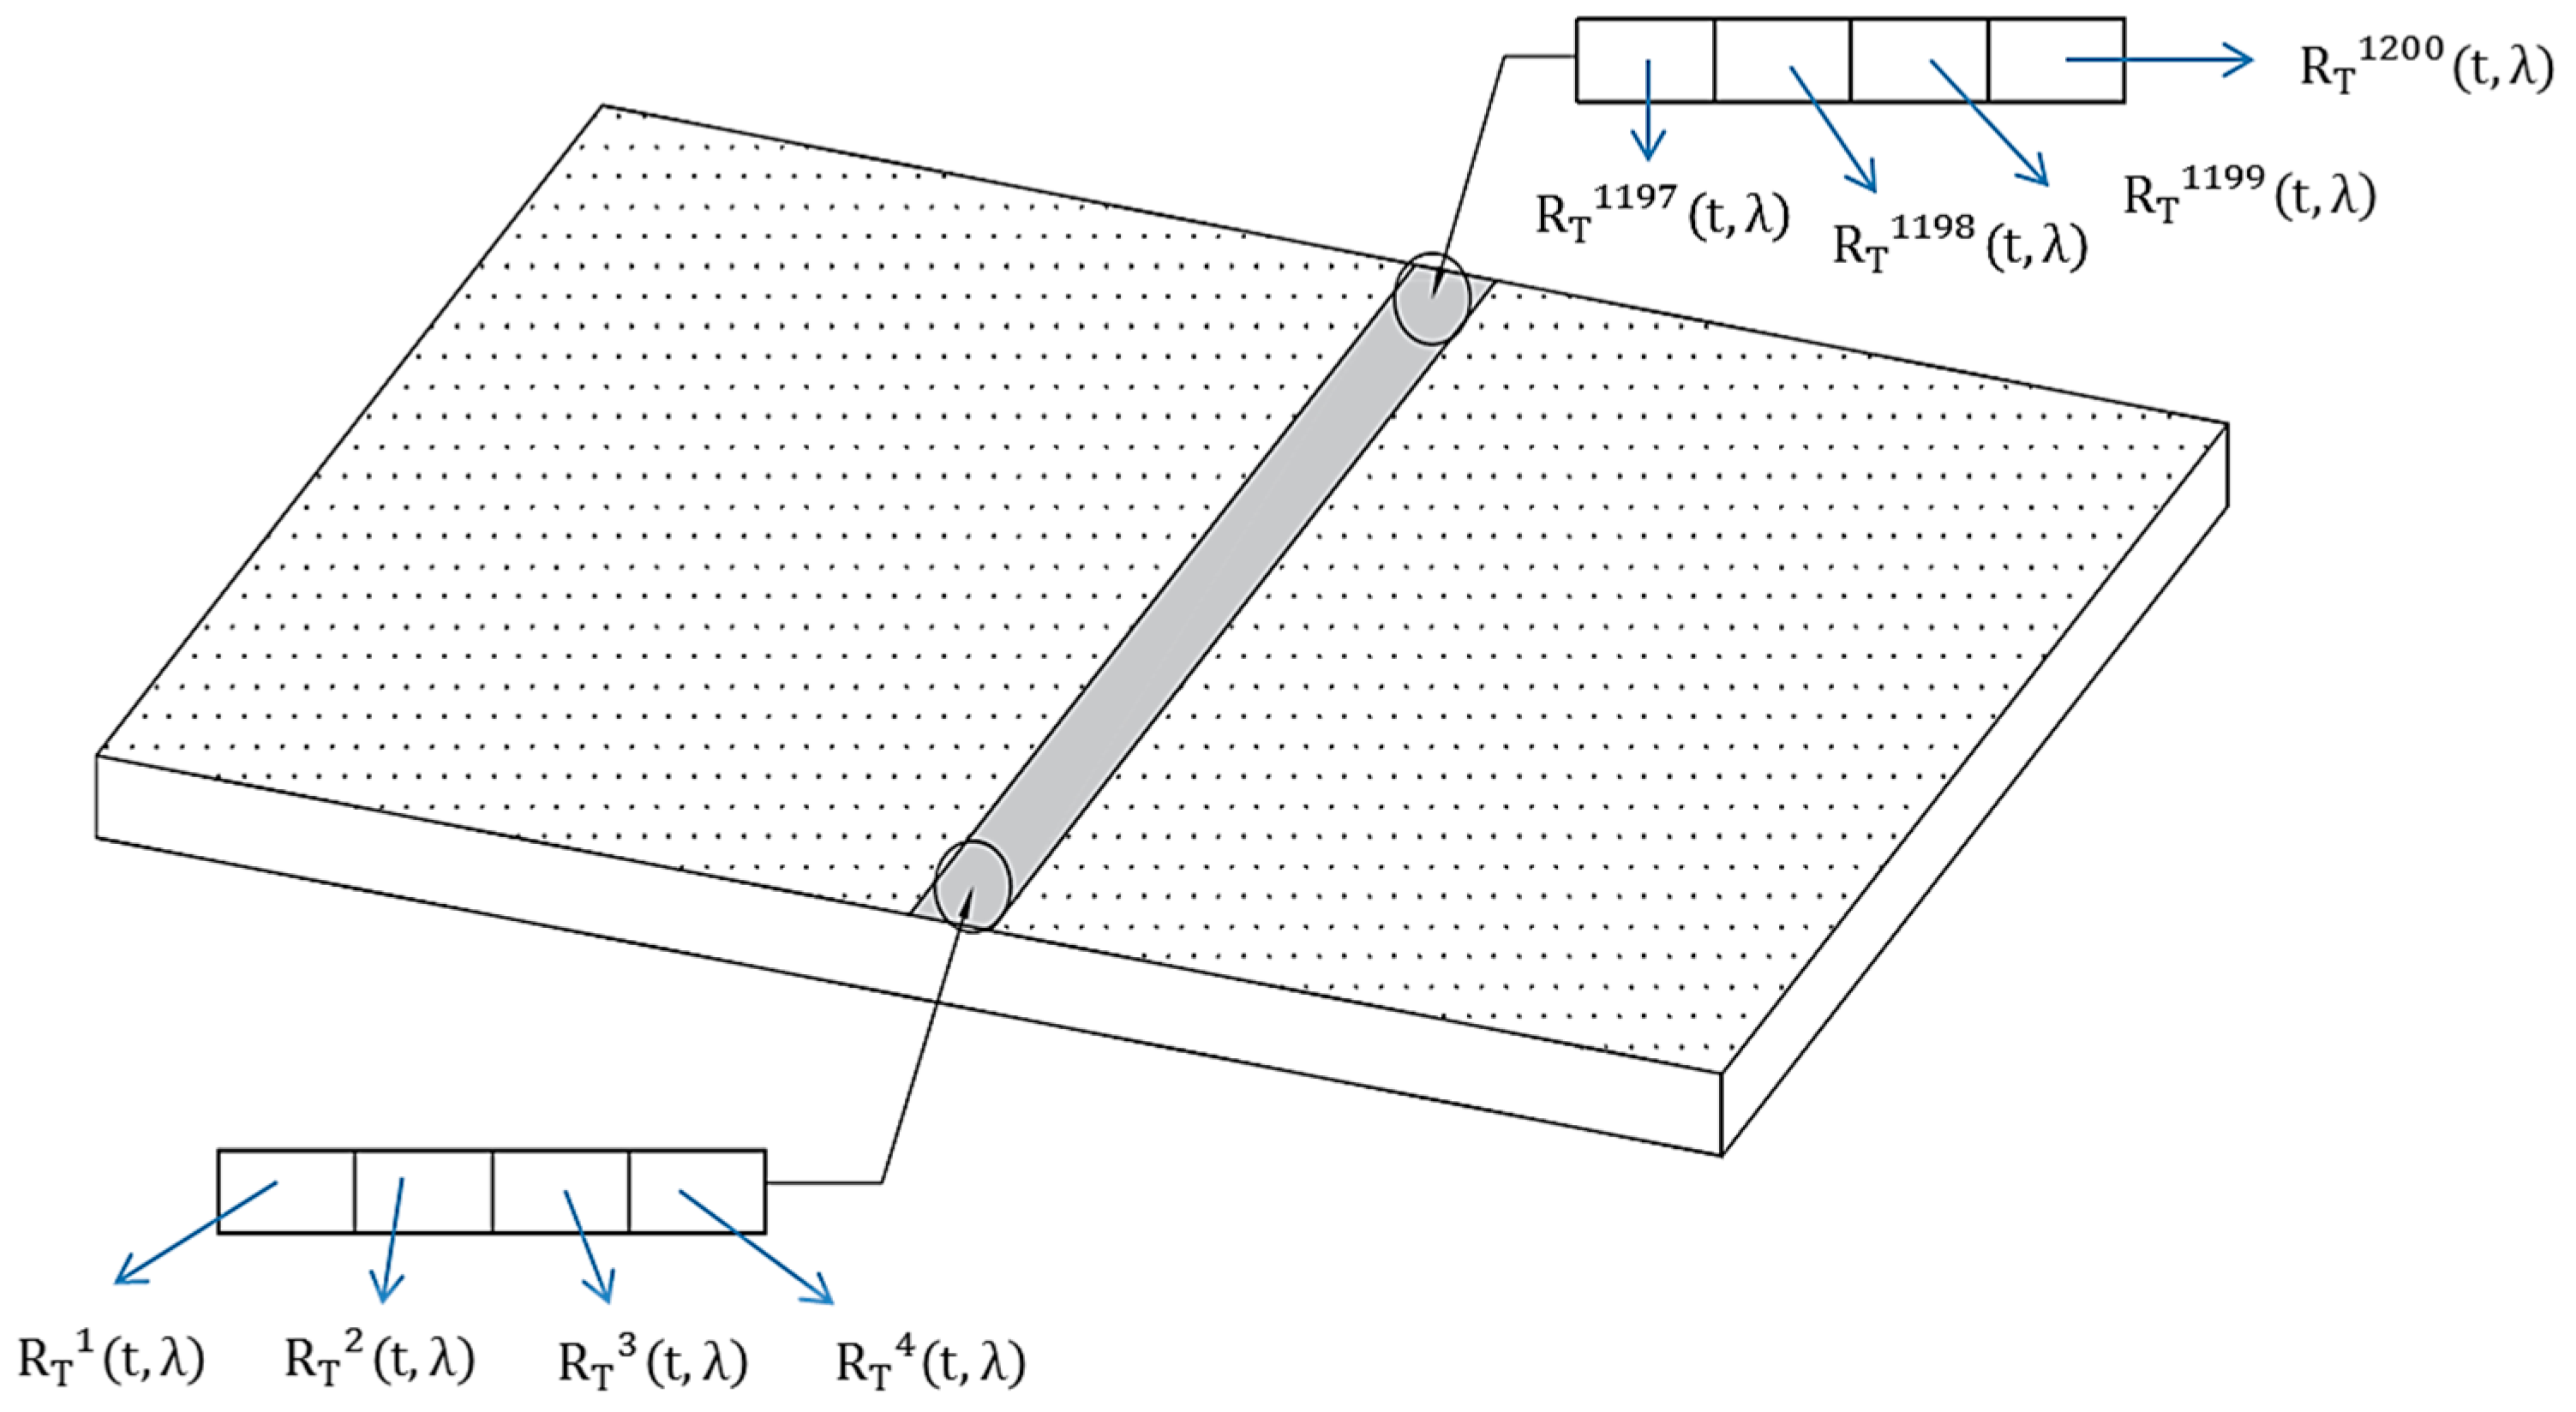
- Colorimetric distance between different points on a single tow section. values can be directly used to assess differences, in terms of spectral response, in different points of the tow section under inspection (see Figure 9). In this last case, the comparison could be properly performed by comparing spectral response directly, since a common practice for textile field does not exist for this specific case; thus no need of color space conversion is necessary. However, also in this case, the definition of the CMC color distance allows reducing the comparison of 31 reflectance values for each acquired spectrum to a single parameter, thus simplifying the comparison task.
2.2.3. Software Implementation
- A library for managing spectral scanner on/off and parameters, D65 lamp on/off and calibration.
- A module for the evaluation of color distances according to Equations (1)–(4).
- A GUI for setting a number of parameters, such as threshold values for CMC distance acceptability, company id code and description of the lot under inspection.
- A module for storing reflectance data and color distances in a SQL database to be accessed by any PC connected to the company network.
3. Results
3.1. Laboratory Testing System Results
3.2. Real-Time Color Measurement
- 1)
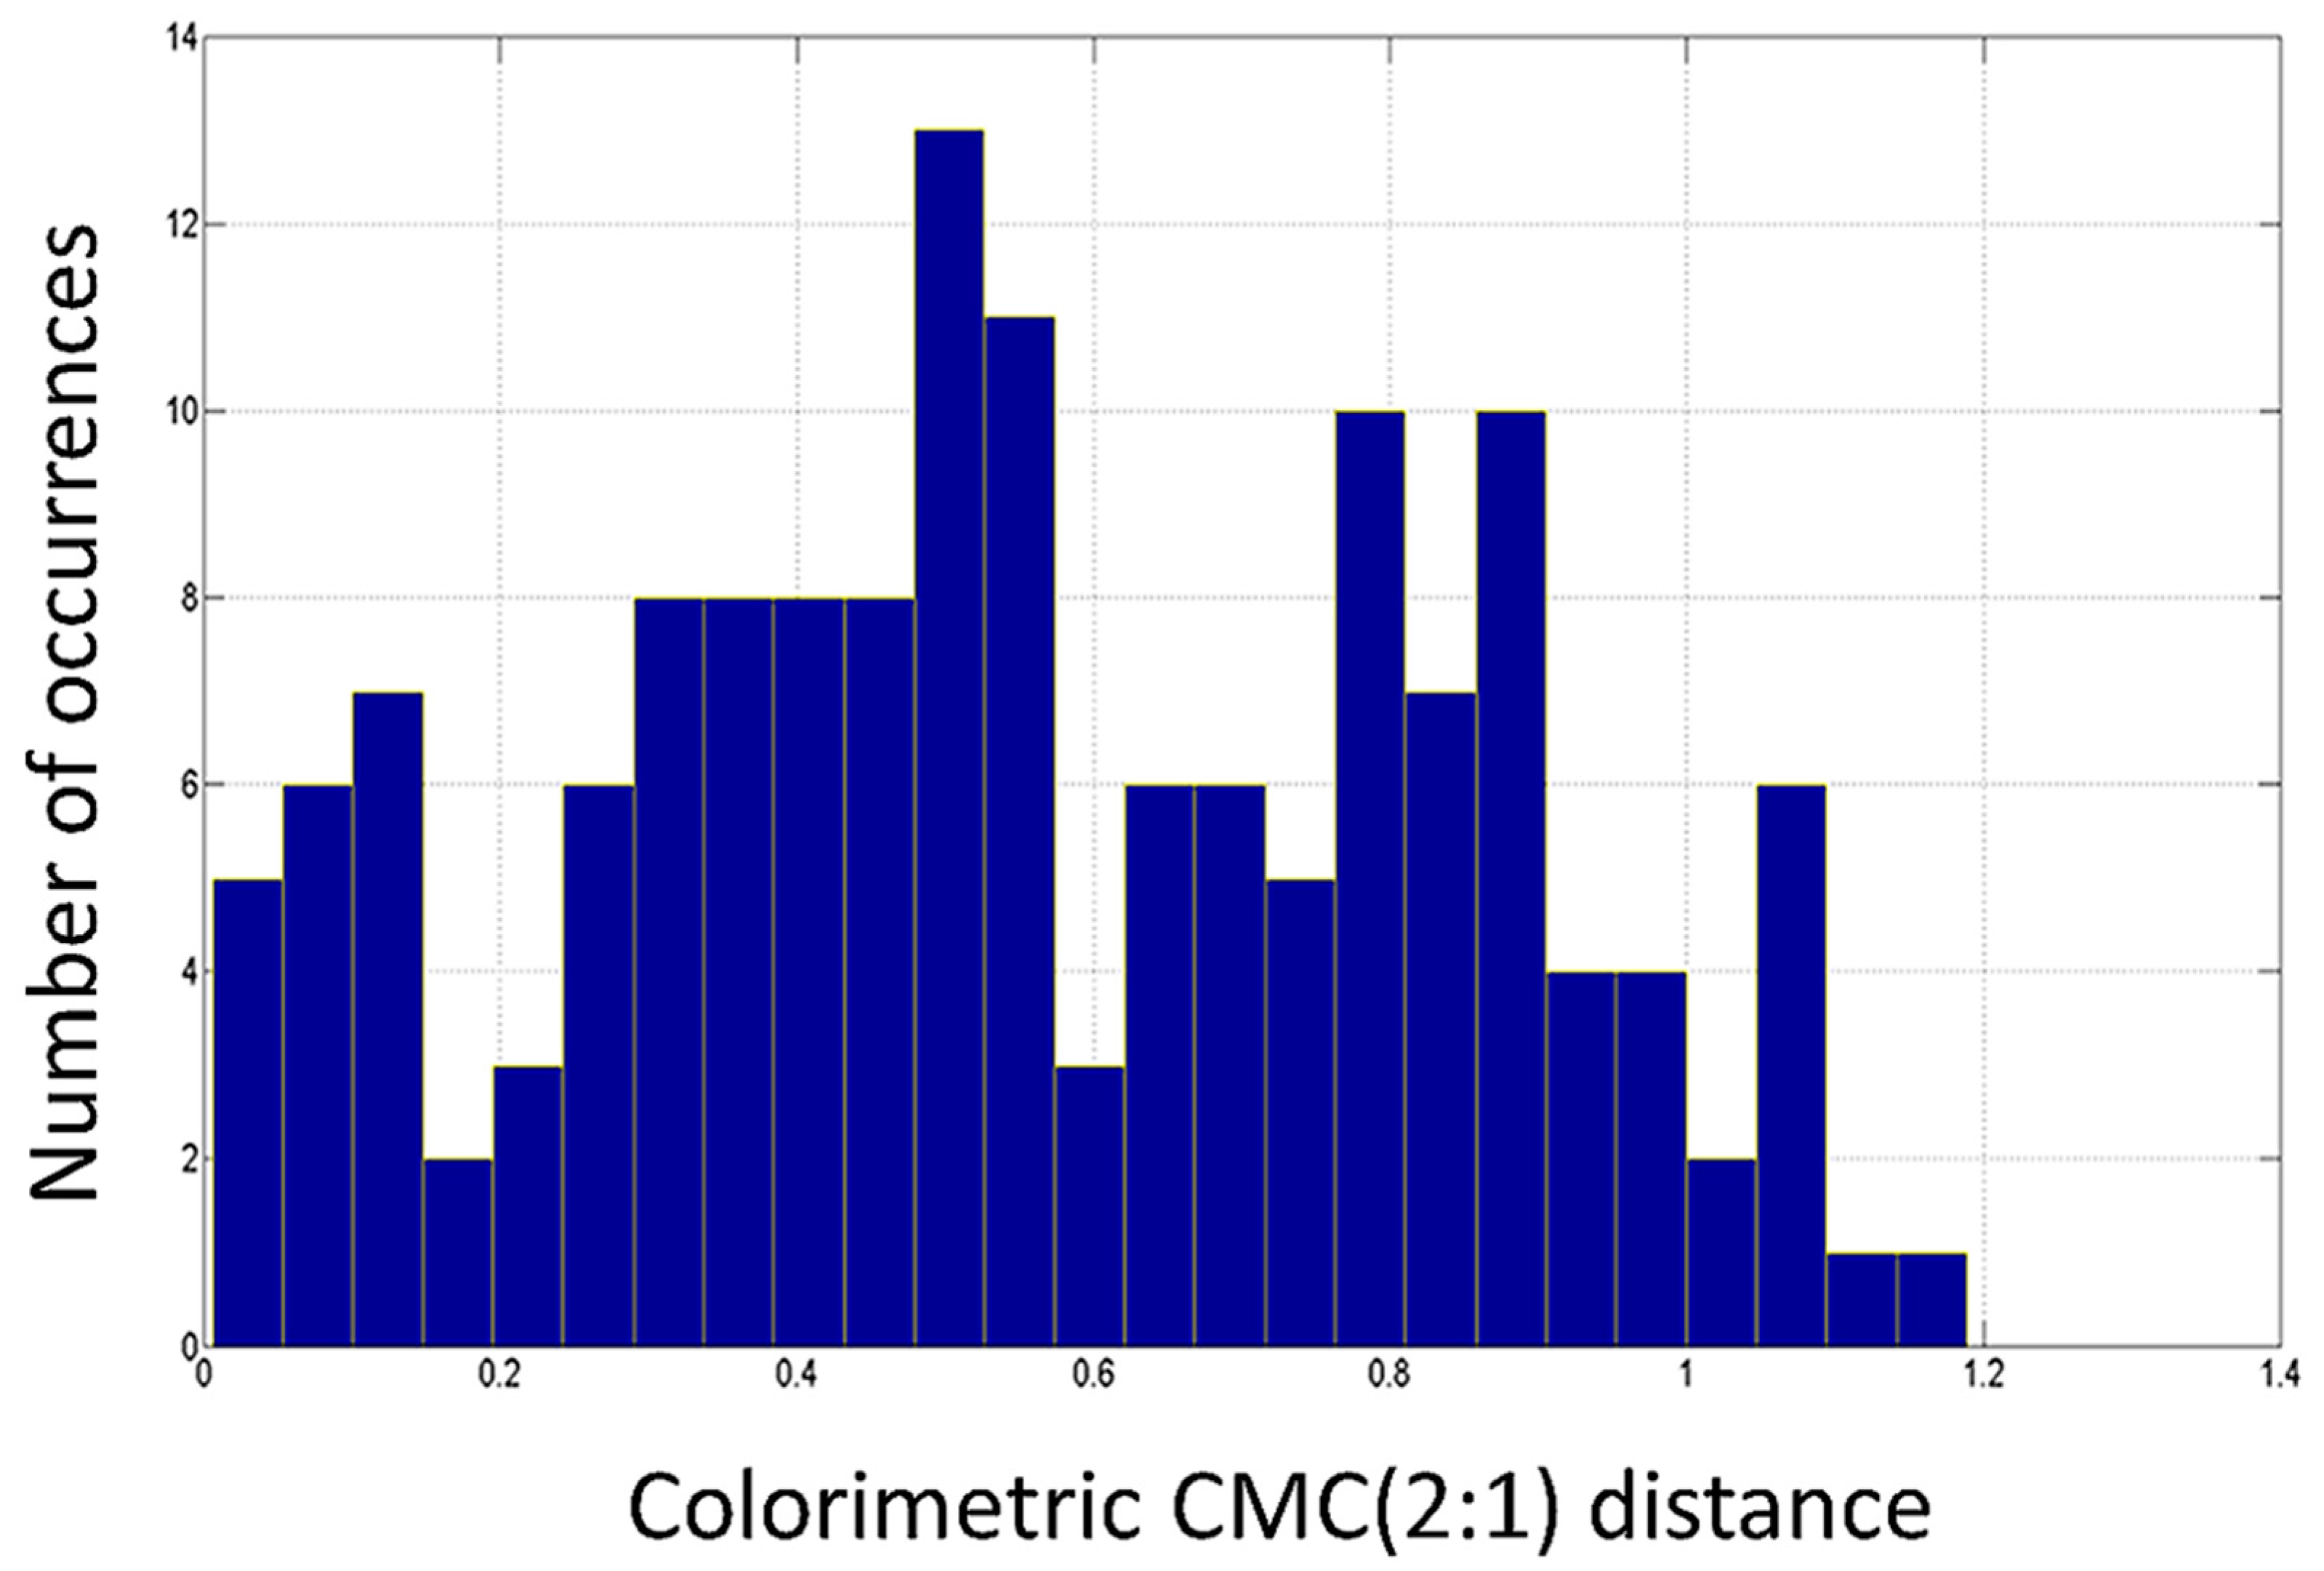
- Colorimetric distances between and . In Figure 11 distances measured during the carding process are depicted together with maximum, minimum, average and standard deviation values. In Figure 12 the histogram representing the number of occurrences providing a certain value for the CMC(2:1) distance is shown. By examining Figure 12, it is possible to state that the particular carded tow used of the test has a color distance lower than 0.8 in the 75.33% and lower than 0.9 in 88% of measured sections. Of course it is up to the Company to decide the overall quality of the tow on the basis of these experimental evidences. Referring to the company experimenting the proposed system, the tow is deemed to be of “good quality” since at least 70% of sections presents color distance lower than 0.8 (high quality is CMC(2:1) < 0.8 for 90% of sections). Of course, different companies could decide different quality grades for their own products.
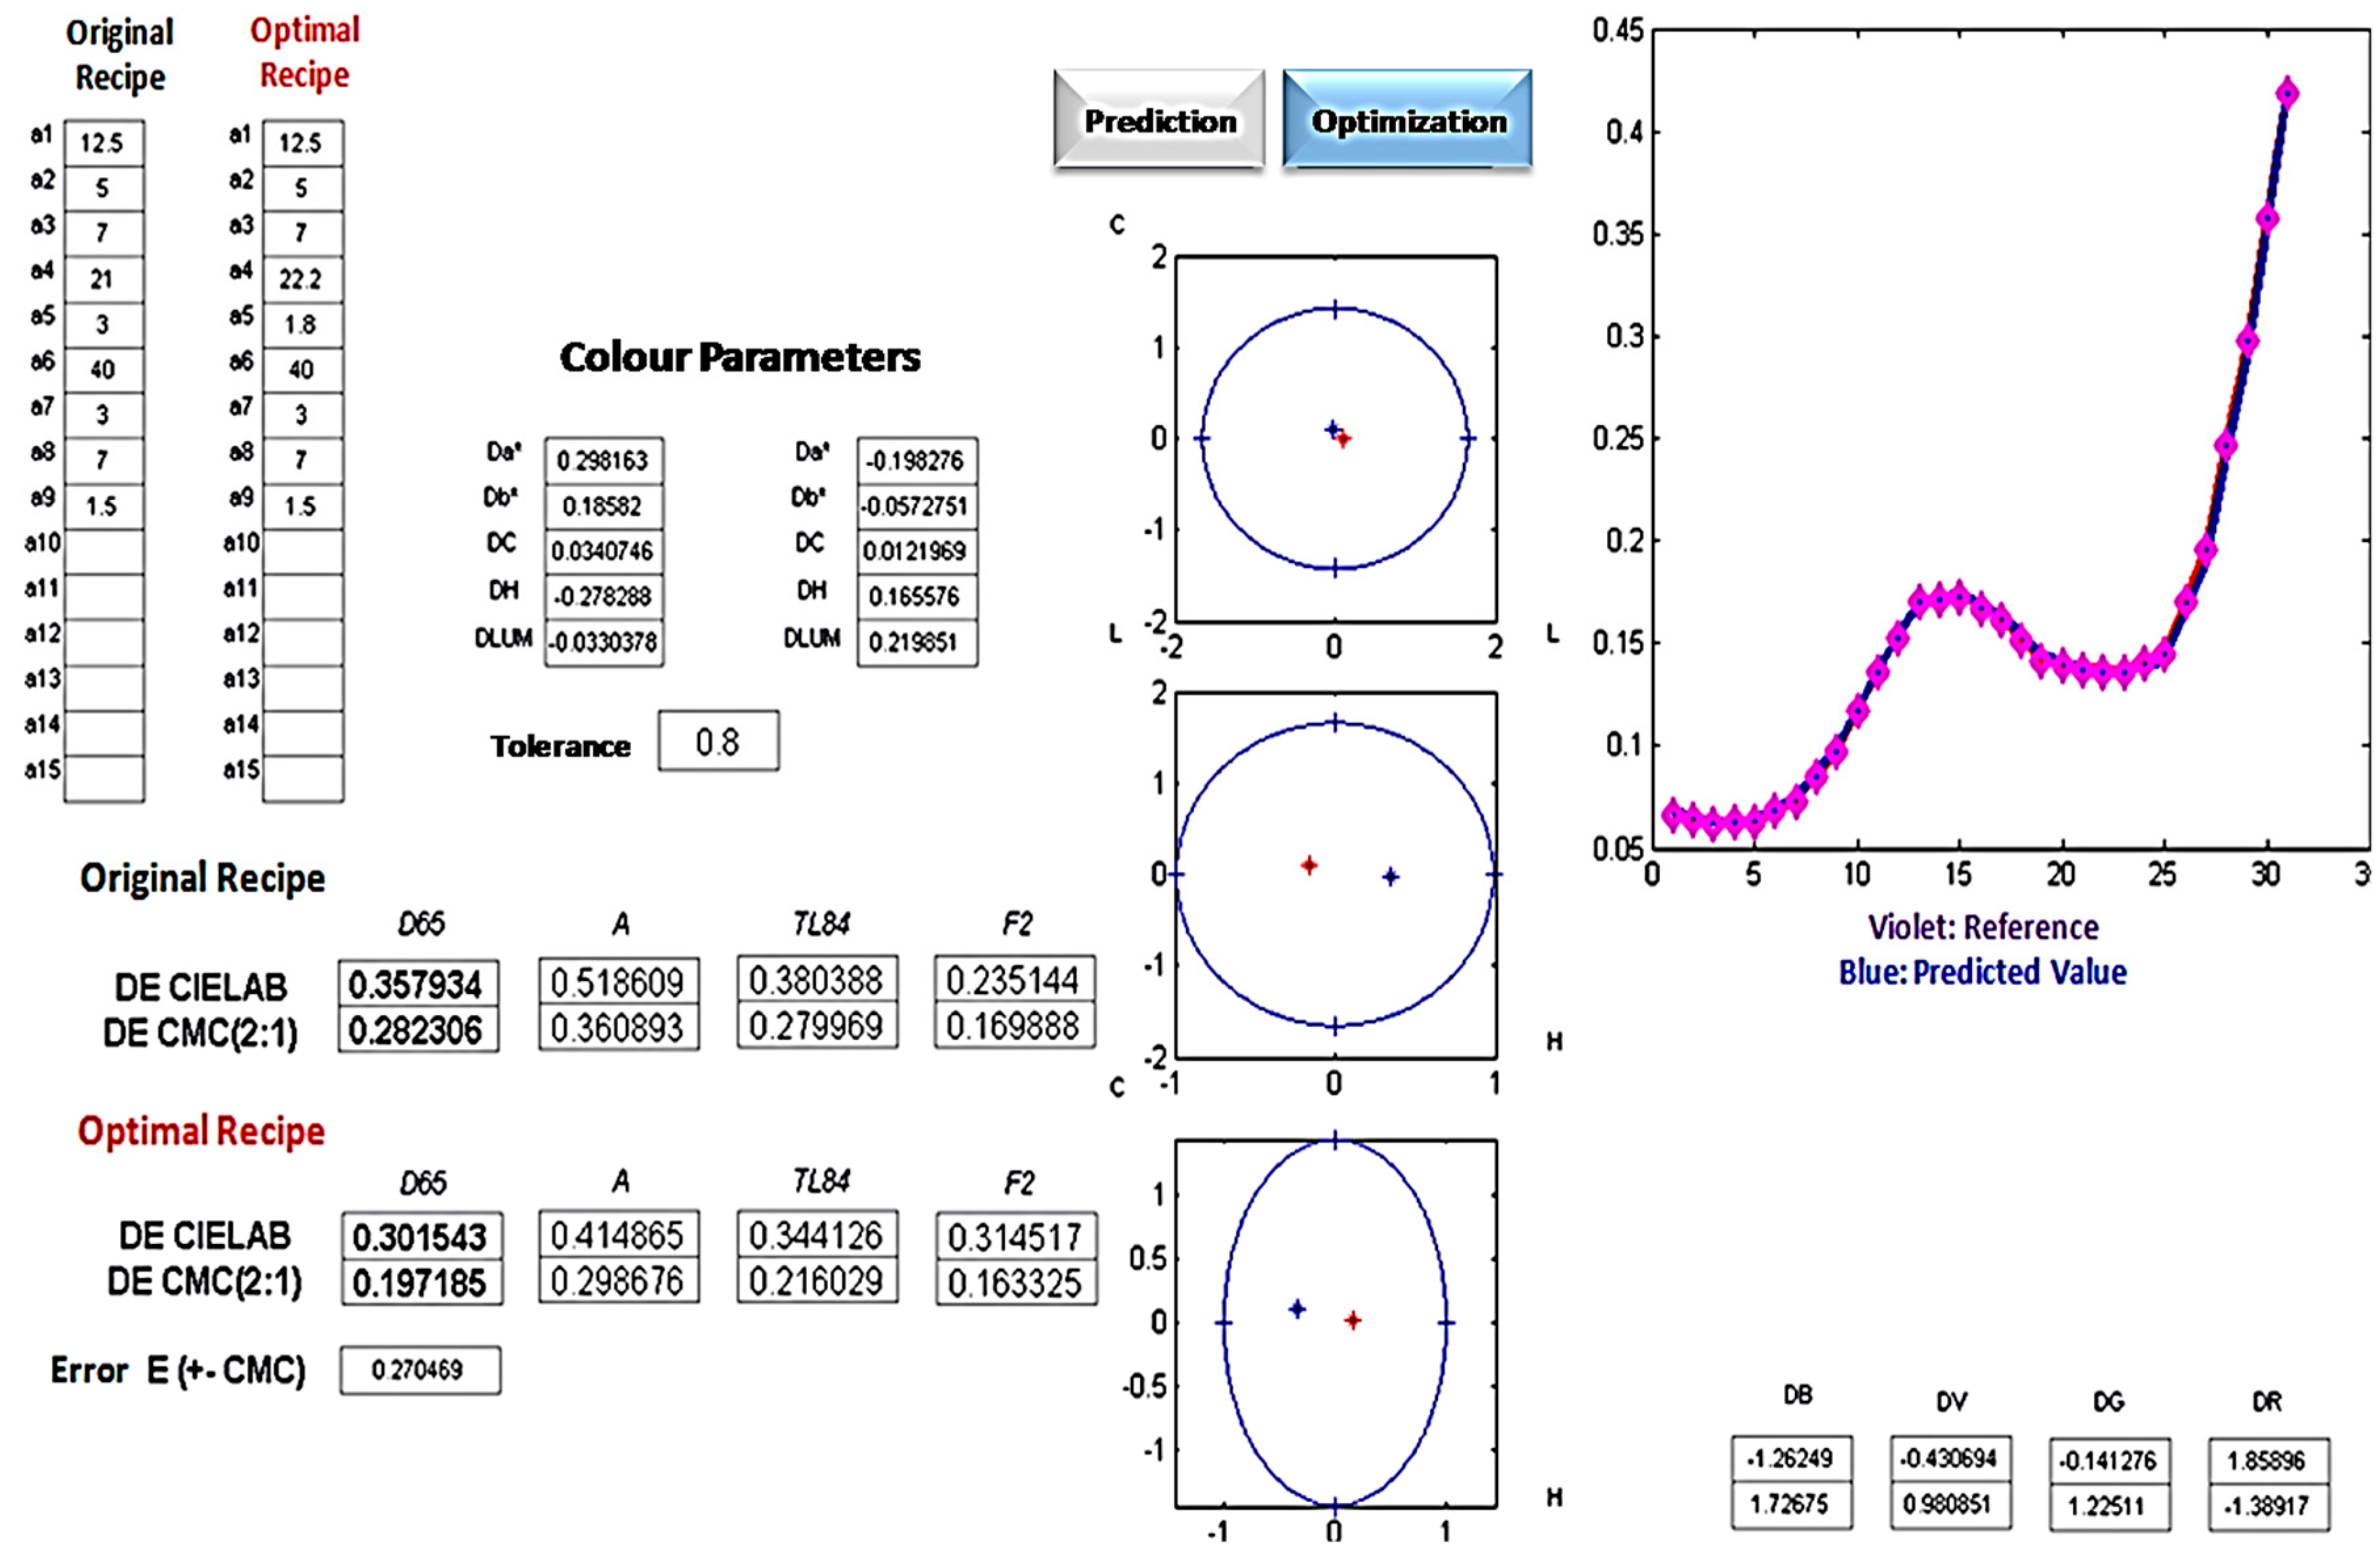
- 2)
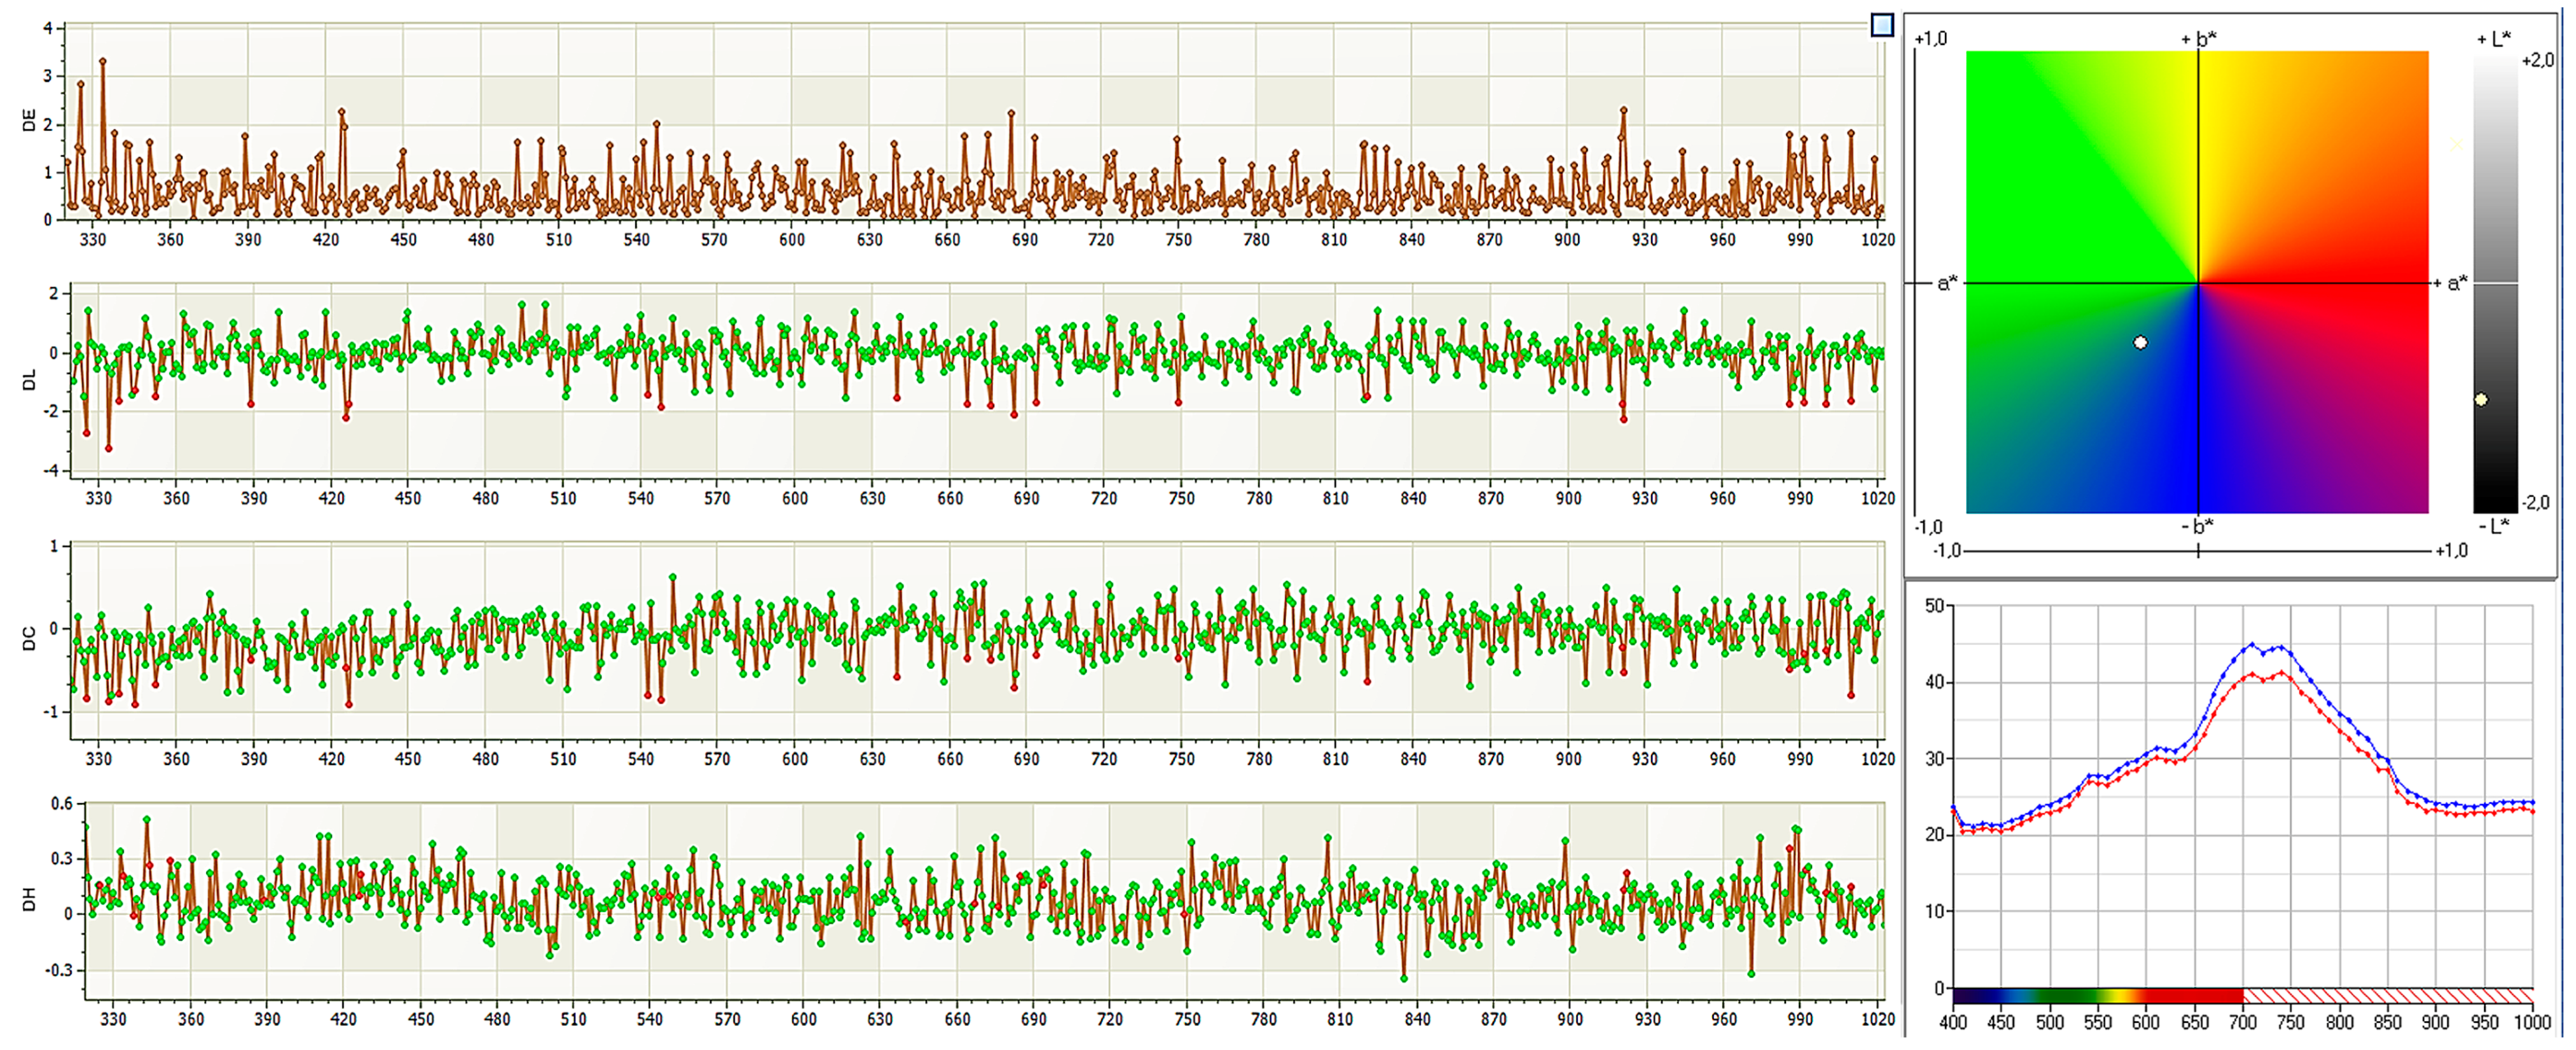
- Colorimetric distance between and . In Figure 13, take from the proposed system GUI, the CMC(2:1) distances between the averaged value of spectral reflectance taken each (with ) are depicted. Figure 13 also shows other related parameters such as, for instance, DC and CH distances [21] and the final measured spectrum. This second modality of color control is considered most relevant for the company staff that tested the proposed system. Their primary interest, in fact, is to guarantee that the entire tow maintains as close as possible the same color during carding process. In this illustrative case, since 97.5% of measures are within a given tolerance (lower than 1.2 in this case), the inspected fabric is considered “high quality” one. In addition, in this case, different companies could decide alternative quality grades for their own products.
- 3)
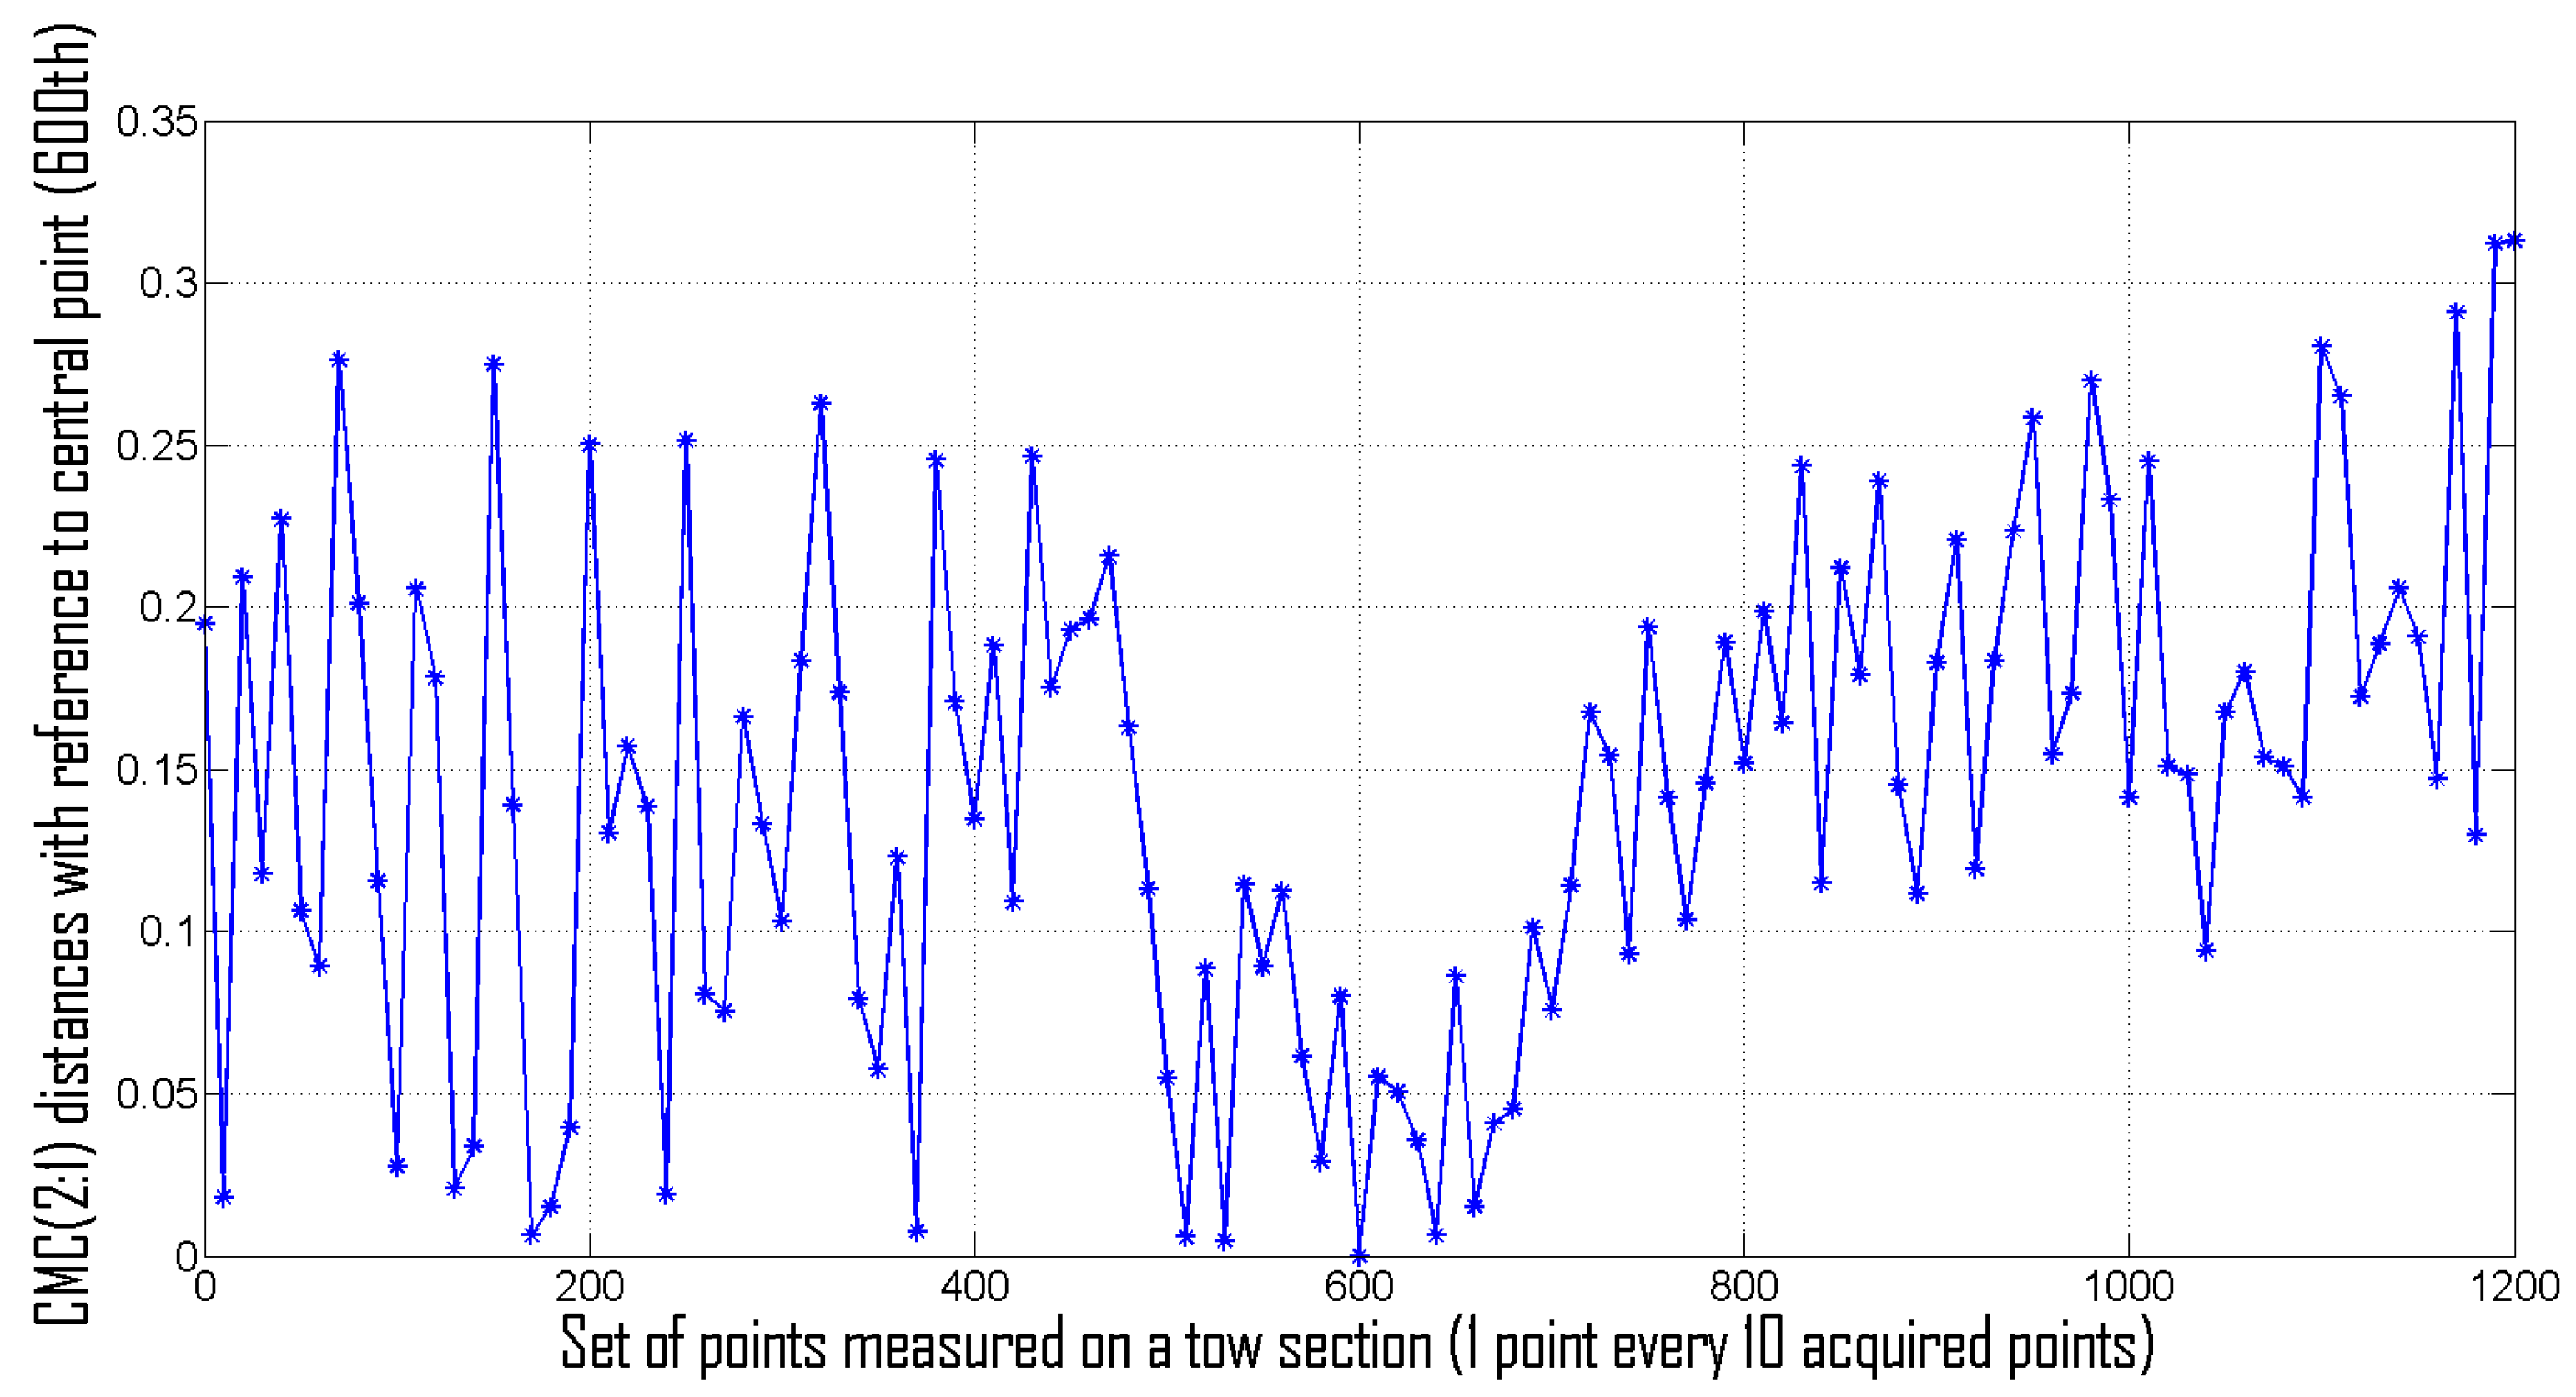
- Colorimetric distance between different points on a single tow section. Let us consider, as an example, the tow section acquired at ; as mentioned above, a set of 1200 values can be measured at that time. All these vectors, defining the spectral response of a single equal-spaced pixel of the tow section, can be compared each other in terms of CMC(2:1) distance. Let, now, be (i.e., the reflectance of the 600th point—the middle one—of the acquired set) used as reference for monitoring color changes within the tow section. Accordingly, all other spectral responses can be compared with such a point to highlight possible spectral response changes. In Figure 14, the color distance, in terms of CMC(2:1) between a point every 100 acquired points of the tow sections and the reference one, is depicted. Results shows that the color is approximately constant for all central points of the tow section, while distance averagely increases in the margins.
4. Discussion
5. Conclusions
- comparing the color of the tow during the carding process with respect to the desired fabric;
- locally comparing the overall trend of the tow during the carding process;
- analyzing differences in terms of color in different sections and points of the tow; and
- providing a real-time process.
Acknowledgments
Author Contributions
Conflicts of Interest
References
- Furferi, R.; Carfagni, M. Colour Mixing Modelling and Simulation: Optimization of Colour Recipe for Carded Fibres. Model. Simul. Eng. 2010, 10. [Google Scholar] [CrossRef]
- Chae, Y.; Xin, J.H.; Hua, T. Color prediction models for digital Jacquard woven fabrics. Col. Res. Appl. 2016, 41, 64–71. [Google Scholar] [CrossRef]
- Rich, D.C. A review of solid-state lighting and its impact on the marketing and production of decorative coatings. J. Coat. Technol. Res. 2016, 13, 1–9. [Google Scholar] [CrossRef]
- Khan, M.K.R.; Sarker, R.C.; Rahman, H. The Influence of Some Process Parametres on Rotor Spun Yarn Quality Produced from Recycled Cotton Spinning Wastes. Int. J. Text. Sci. 2015, 4, 9–19. [Google Scholar]
- Ashraf, U.; Hussain, T.; Jabbar, A. Effect of cotton fiber and yarn characteristics on color variation in woven fabric dyed with vat dyes. J. Text. Inst. 2014, 105, 1287–1292. [Google Scholar] [CrossRef]
- Juárez, A.V.; Rost, G.; Heitmann, U.; Heger, E.; Müller, R. Construction of a pilot plant for producing fine linen fibers for textiles. Biochem. Eng. J. 2013, 71, 11–18. [Google Scholar] [CrossRef]
- Cook, J. Mathematical Models for Dermal Wound Healing: Wound Contraction and Scar Formation. Ph.D. Thesis, University of Washington, Seattle, WA, USA, 2001. [Google Scholar]
- Furferi, R.; Governi, L.; Volpe, Y. Color matching of fabric blends: Hybrid Kubelka-Munk+ artificial neural network based method. J. Electron. Imaging 2016, 25. [Google Scholar] [CrossRef]
- Ahmad, G.G. Using artificial neural networks with graphical user interface to predict the strength of carded cotton yarns. J. Text. Inst. 2016, 107, 386–394. [Google Scholar] [CrossRef]
- Furferi, R.; Governi, L.; Volpe, Y. Methods for predicting spectral response of fibers blends. Lect. Notes Comput. Sci. 2015, 9281, 79–86. [Google Scholar]
- Shen, J.; Zhou, X.; Ma, H.; Chen, W. Spectrophotometric prediction of pre-colored fiber blends with a hybrid model based on artificial neural network and Stearns—Noechel model. Text. Res. J. 2016, in press. [Google Scholar] [CrossRef]
- Amirshahi, S.H.; Pailthorpe, M.T. Applying the Kubelka-Munk equation to explain the color of blends prepared from precolored fibers. Text. Res. J. 1994, 64, 357–364. [Google Scholar] [CrossRef]
- Walowit, E.; McCarthy, C.J.; Berns, R.S. An algorithm for the optimization of kubelka-munk absorption and scattering coefficients. Color Res. Appl. 1987, 12, 340–343. [Google Scholar] [CrossRef]
- Burlone, D.A. Effect of fiber translucency on the color of blends of precolored fibers. Text. Res. J. 1990, 60, 162–167. [Google Scholar] [CrossRef]
- Yang, H.; Zhu, S.; Pan, N. On the Kubelka-Munk Single-Constant/Two-Constant Theory. Text. Res. J. 2010, 80, 263–270. [Google Scholar] [CrossRef]
- Tang, I.W.; Xin, J.H. Yarn color measurement and reproduction by a multispectral imaging system. In Proceedings of the Color and Imaging Conference, San Diego, CA, USA, 7–11 November 2016; Volume 2016, pp. 103–110.
- Li, Y.; Ai, J.; Sun, C. Online Fabric Defect Inspection Using Smart Visual Sensors. Sensors 2013, 13, 4659–4673. [Google Scholar] [CrossRef] [PubMed]
- Zhou, Y.; Zhao, D.; Yu, Y.; Yuan, J.; Du, S. Adaptive Color Calibration Based One-Shot Structured Light System. Sensors 2012, 12, 10947–10963. [Google Scholar] [CrossRef] [PubMed]
- Lin, J.J.; Sun, P.T.; Chen, J.R.; Wang, L.J.; Kuo, H.C.; Kuo, W.G. Applying gray model to predicting trend of textile fashion colors. J. Text. Inst. 2010, 101, 360–368. [Google Scholar] [CrossRef]
- Zhang, X.; Wang, Q.; Li, J.; Zhou, X.; Yang, Y.; Xu, H. Estimating spectral reflectance from camera responses based on CIE XYZ tristimulus values under multi-illuminants. Color Res. Appl. 2016. [Google Scholar] [CrossRef]
- Berns, R.S. Modification of CIEDE2000 for Assessing Color Quality of Image Archives. In Proceedings of the Archiving Conference, San Diego, CA, USA, 7–11 November 2016; Volume 2016, pp. 181–185.
- Computer House. Available online: http://www.cho.it/ (accessed on 27 June 2016).
- Luo, L.; Tsang, K.M.; Shen, H.L.; Shao, S.J.; Xin, J.H. An investigation of how the texture surface of a fabric influences its instrumental color. Color Res. Appl. 2015, 40, 472–482. [Google Scholar] [CrossRef]


| Fabric Name (Company Code) | Number of Raw Materials | Original Recipe | CMC(2:1) Distance (Original Recipe) | Modified Recipe | CMC(2:1) Distance (Modified Recipe) | ||
|---|---|---|---|---|---|---|---|
| 7460C | 5 | 0.09 | 0.5983 | 0.130 | 0.3141 | ||
| 0.155 | 0.120 | ||||||
| 0.250 | 0.240 | ||||||
| 0.180 | 0.205 | ||||||
| 0.325 | 0.305 | ||||||
| Sample #Number | CMC(2:1) Measurement #1 | CMC(2:1) Measurement #5 | CMC(2:1) Measurement #10 | Mean Value for the 10 Readings |
|---|---|---|---|---|
| 1 | 0.2933 | 0.3377 | 0.2324 | 0.2913 |
| 2 | 0.2857 | 0.2534 | 0.3267 | 0.2906 |
| 3 | 0.3199 | 0.2960 | 0.2402 | 0.2879 |
| 4 | 0.3306 | 0.3288 | 0.3287 | 0.3355 |
| 5 | 0.3383 | 0.3615 | 0.3445 | 0.3528 |
| 6 | 0.2569 | 0.3731 | 0.3422 | 0.3276 |
| 7 | 0.3255 | 0.3030 | 0.2122 | 0.2885 |
| 8 | 0.3214 | 0.2336 | 0.3187 | 0.2971 |
| 9 | 0.2376 | 0.2354 | 0.2988 | 0.2628 |
| 10 | 0.2302 | 0.2538 | 0.3458 | 0.2858 |
| 11 | 0.2947 | 0.3529 | 0.3716 | 0.2913 |
| 12 | 0.3732 | 0.2532 | 0.2481 | 0.2906 |
| Mean value | 0.3006 | 0.2985 | 0.3008 | 0.3002 |
| Standard Deviation | 0.0428 | 0.0516 | 0.0534 |
© 2016 by the authors; licensee MDPI, Basel, Switzerland. This article is an open access article distributed under the terms and conditions of the Creative Commons Attribution (CC-BY) license (http://creativecommons.org/licenses/by/4.0/).
Share and Cite
Furferi, R.; Governi, L.; Volpe, Y.; Carfagni, M. Carded Tow Real-Time Color Assessment: A Spectral Camera-Based System. Sensors 2016, 16, 1404. https://0-doi-org.brum.beds.ac.uk/10.3390/s16091404
Furferi R, Governi L, Volpe Y, Carfagni M. Carded Tow Real-Time Color Assessment: A Spectral Camera-Based System. Sensors. 2016; 16(9):1404. https://0-doi-org.brum.beds.ac.uk/10.3390/s16091404
Chicago/Turabian StyleFurferi, Rocco, Lapo Governi, Yary Volpe, and Monica Carfagni. 2016. "Carded Tow Real-Time Color Assessment: A Spectral Camera-Based System" Sensors 16, no. 9: 1404. https://0-doi-org.brum.beds.ac.uk/10.3390/s16091404