Article

Embedded Smart Antenna for Non-Destructive Testing and Evaluation (NDT&E) of Moisture Content and Deterioration in Concrete

1
Built Environment & Sustainable Technology (BEST) Research Institute, Faculty of Engineering & Technology, Liverpool John Moores University, Liverpool L3 3AF, UK
2
Sensor City Liverpool Limited, Liverpool L3 5LJ, UK
*
Authors to whom correspondence should be addressed.
Submission received: 14 December 2018 / Revised: 14 January 2019 / Accepted: 23 January 2019 / Published: 28 January 2019
(This article belongs to the Special Issue RF Technology for Sensor Applications)

Abstract

:
Concrete failure will lead to serious safety concerns in the performance of a building structure. It is one of the biggest challenges for engineers to inspect and maintain the quality of concrete throughout the service years in order to prevent structural deterioration. To date, a lot of research is ongoing to develop different instruments to inspect concrete quality. Detection of moisture ingress is important in the structural monitoring of concrete. This paper presents a novel sensing technique using a smart antenna for the non-destructive evaluation of moisture content and deterioration inspection in concrete blocks. Two different standard concrete samples (United Kingdom and Malaysia) were investigated in this research. An electromagnetic (EM) sensor was designed and embedded inside the concrete to detect the moisture content within the structure. In addition, CST microwave studio was used to validate the theoretical model of the EM sensor against the test data. The results demonstrated that the EM sensor at 2.45 GHz is capable of detecting the moisture content in the concrete with linear regression of R2 = 0.9752. Furthermore, identification of different mix ratios of concrete were successfully demonstrated in this paper. In conclusion, the EM sensor is capable of detecting moisture content non-destructively and could be a potential technique for maintenance and quality control of the building performance.

Graphical Abstract

1. Introduction

Concrete structures play an important role in structural health of buildings, bridges, and so forth. [1]. It is normal that concrete undergoes deterioration over time due to the natural behaviour of the concrete [2]. However, it undergoes rapid deterioration when exposed to aggressive environments and unpredictable weather changes, which leads to a reduction in service life. Hence, it is important to ensure the service life of concrete structures are monitored [3]. Premature deterioration of the structure has a huge cost related impact on national economics. About 3% of the world’s gross domestic product (GDP) that is, US$ 2.2 trillion lost has been reported from world statistics owing to a premature deterioration of concrete structures [4]. In addition, structural health plays a significant role for the risk of building collapse, which may cause injuries or even death to occupants [5]. Hence, reliability of concrete and reinforced concrete (RC) structures can be ensured through accurate prediction of service life, which is influenced by several deteriorating factors such as corrosion of embedded metals, chemical attack, erosion, surface defect and so forth [6].
Extensive research studies have reported that moisture content within the concrete structures is a key point for structural health monitoring [7,8]. The moisture induces varying forms of physical, biological and chemical processes, which rapidly deteriorate the structural strength [9]. Currently, there are a few conventional methods available to determine the dampness of building fabrics [10]. However, most of the available equipment to measure moisture content is destructive to the building fabric, as they require additional drilling into the material to take a measurement. Moreover, these methods often provide inaccurate results [11]. Hence, it creates a huge research interest to develop non-destructive methods and reliable solutions for structural health monitoring [12]. Throughout the years, many non-destructive techniques have been reported in the literature to monitor the moisture content in concrete, such as thermal analysis [13], gamma ray method [14], the ultrasonic techniques [15], X-ray diffraction [16] and scanning electron microscopy [17]. Reported results showed that these methods provided much better performance and accuracy compared to the conventional methods. However, precise calibration, high skills for operating and use of these techniques is required [18]. Therefore, it is necessary to develop easy, reliable and user-friendly technology/instruments to monitor the structural health of buildings, bridges and so forth.
In recent years, numerous studies specialized in the structural health monitoring (SHM) investigating new smart material-based methods to replace the conventional techniques [19]. These smart material-based SHM techniques include piezoelectric materials [20] and fibre optic sensors [21,22] to monitor damage, debonding and corrosion. However, monitoring of moisture content which is the key factor for the structural life prediction has been disregarded [23]. Recently, a few research activities introduced an electro-mechanical impedance (EMI) technique to monitor the concrete hydration, curing and strength gain [24]. Qin and Li monitored the hydration of cement using embedded piezoelectric patch (PZT), by determining the dynamic modulus of the cement paste through the measurement of the ultrasonic pulse velocity. However, they could not monitor the early hydration as they bonded the PZT patch to the concrete surface only after hardening [25]. Providakis et al. designed a miniaturized wireless EMI based measuring system to monitor the early age strength of concrete. Based on their experimental studies, they found that the EMI signal gradually shifted to the right as the concrete curing time increased [26]. Different sensing techniques with polymer optic fibres have been proposed throughout the year [27,28]. Zhou et al. introduced fibre-reinforced polymer-packaged optical-fibre Bragg grating (OFBG) to monitor damage for civil infrastructure under harsh environment [29]. Furthermore, there are different patch antennas were proposed recently for varies application for structure heat monitoring. Jun Yao et al. demonstrated that wireless vibratory strain sensing system for dynamic strain tracking ability based on principle of resonant frequency as a function of the tensile strain [30]. On the other hand, Sanders et al. found that microstrip patch antenna is a potential to use as temperature sensor by correlating the antenna resonant frequency shift and the temperature change [31]. On top of that, Cheng et al. also has demonstrated the microstrip patch antenna for high temperature sensor application [32].
Hence, this research paper aims to develop a smart sensing technology by using electromagnetic wave techniques for the determination of moisture content and therefore deterioration in concrete structures. A microstrip patch antenna developed to generate EM signals and continuous data monitoring was performed by transmitting information to the data acquisition system. The smart sensor is embedded inside the concrete structure for real-time monitoring. A model for determination of moisture content and deterioration of concrete is successfully developed and implemented. Furthermore, theoretical model of signal transmitting of electromagnetic wave was validated by using CST microwave simulation software. This smart sensor can be easily applied to determine moisture content of concrete in real time and user-friendly approach.

2. Experimental Setup and Methodology

2.1. Microwave Theory and Application

Moisture content inside concrete structures can be studied from the data of their interactions with microwaves. This interaction can be revealed in the form of a unique signal spectrum called as reflection coefficient (S11) and transmission coefficient (S21) [33]. Permittivity and conductivity of water percentages will vary the measurement quantities of signal spectrum. Permittivity is a measurement of the dielectric medium response to the applied microwaves through the changing of its electric field. It depends on the material’s ability to polarize in response to the applied field. This theory can be applied to detect moisture in concrete structures because water generally has high value of dielectric constant ~81 [34]. Dielectric constant and dielectric loss of material is the two key parameters to define permittivity.
  • Dielectric constant (ε′) is defined as a quantity measuring the ability of a material to store electrical energy in an electric field. The changing moisture content of concrete will vary the dielectric constant due to the polarization of water inside the concrete sample.
  • Dielectric loss (ε″) is defined as loss of electromagnetic energy propagating inside the concrete structure due to the rotation and oscillation between the water molecules thus resulting in friction.
Changes of moisture content inside the concrete structure will alter its permittivity and yielding a unique spectrum when it comes in contact with microwave [35]. Hence, this technology is suitable and fits well to evaluate the moisture content inside the concrete [36].

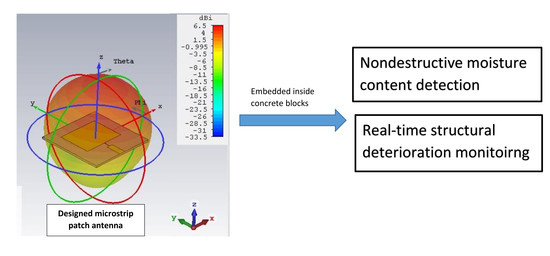
2.2. Microstrip Patch Antenna at 2.45 GHz Frequency

CST Microwave Studio was used to design a patch type sensor that resonates at 2.45 GHz frequency for this investigation. The designed sensor was proposed under consideration of the desired resonant frequency, dielectric medium of the patch antenna and size consideration for overall rectangular patch antenna. Figure 1 illustrates the full dimension of a patch antenna propagated at 2.45 GHz frequency. A microstrip patch antenna consists of a conducting patch (copper) and ground plane in between (FR-4). FR-4 is a dielectric medium known as substrate. Table 1 shows the properties of the materials and the overall dimension that includes material thickness, dielectric constant, electrical conductivity and loss tangent of the material.

Design of Microstrip Patch Antenna

The width (W) of the patch is calculated by Equation (1):
W = c 2 f o 2 ε r + 1
where c is free space speed of light, f o is desired resonant frequency and ε r is dielectric constant of substrate.
The length (L) of the patch is calculated by Equation (2):
L =   c 2 f o ε e f f 0.824 h ( ( ε e f f + 0.3 ) ( W h   +   0.264 ) ( ε e f f     0.258 ) ( W h   +   0.8 ) ) , ε e f f = ε r   +   1 2 + ε r     1 2 ( 1 1   +   12 h W ) .
where ε e f f is the effective dielectric constant, W is width of the patch and h is height of substrate.
A small square size of 60 mm × 60 mm ground was incorporated in the patch antenna. The substrate size has the similar size to the ground. Up to date research, there are different methods of feeding to the microstrip patch antenna such as inset feed method, fed with a quarter-wavelength transmission line, coaxial cable, coupled feeds and aperture feeds. In this research, we aim to produce a remarkable small size, simple fabrication and easy integration antenna. With the benefits of minimal dependence on substrate thickness and unipolar configuration, quarter-wavelength transmission feed line was selected for the patch antenna.

2.3. Materials Preparation and Properties

2.3.1. Fabrication of Printed Circuit Board (Patch Antenna)

Once the sensor is designed and a desired performance is obtained, the next step was to fabricate it. EAGLE (Easily Applicable Graphical Layout Editor) was used prior to moving to the actual fabrication of the antenna. EAGLE is a PCB (Printed Circuit Board) design software, which is developed by CadSoft (CadSoft US, 2016). Figure 2 shows the circuit layout ready to print on the PCB for the patch antenna sensor. The software contains a number of functions, such as a schematics editor, a PCB editor and auto-router module. The most common use of this software is a design of electronic schematics and layouts of PCB boards.
Figure 3 shows the LPKF Protomat D104, which was used to fabricate the antenna on FR4 PCB board. The machine was controlled by Circuit Pro control software via a PC, where the antenna’s layout files were loaded for drilling and the milling. The Gerber files were exported from Autodesk EAGLE software.

2.3.2. Concrete Structure

A preliminary cubes structure for testing was made from two different standards (Europe EN 206-1-2013 and Malaysia MS 26-1-8:2010). The size of the block is 150 × 300 × 300 mm there were no reinforcement bars. The composition of the concrete structures is provided in Table 2.

2.3.3. Water Content

An electronic weight balance was placed under the concrete block throughout the experiments. The weight before and after the test are recorded to measure the weight of moisture content in the concrete block. Equation (3) was used to evaluate the water content measurement throughout the experiments.
MC = W w W d
were MC is moisture content weight (kg), W w is wet weight (kg) and W d is dry weight (kg) of overall concrete.

2.4. Experimental Setup

A printed circuit board (smart sensor) transmitted signal of 2.45 GHz was designed at Liverpool John Moores University and fabricated at Sensor City Liverpool Limited. The smart sensor is embedded within the concrete structure as shown in Figure 4.
The experimental setup for this investigation is shown in Figure 5. The experimental setup consists of a vector network analyser (VNA), weight balance under the concrete and a data acquisition system designed in LabVIEW program. Reflection signals (S11) were detected from the patch antenna connected to the VNA. All the results were recorded throughout the experiments to quantify the moisture content lost.

2.5. Data Acquisition

A continuous monitoring was implemented using VNA for attenuation of the electromagnetic wave propagation in the concrete and weight of water content by electronic weight balance. All the experimental results are recorded by using designed LabVIEW Program in the interval of 5 min for 48 h. Three repeatability test for each of the samples were performed. Root means square (RMS) error was calculated and was found to be >95% for the repetition.

2.6. Numerical Simulation

Numerical simulation was conducted by using CST simulation package in order to stimulate the resonant frequency for the microstrip patch antenna. The simulation results were set at range of 1.8 GHz–3.0 GHz and were validated against the experimental results.

3. Results and Discussions

3.1. Moisture Content in MS 26-1-8:2010 Concrete

Signal spectrum generated from the smart sensor inside the MS 26-1-8:2010 concrete is illustrated in Figure 6. It is interesting to see that at the frequency of 2.4 GHz, the signal spectrum from −7.5 dB to −6.8 dB when the moisture content decrease. Figure 7 shows the correlation of frequency shift against the moisture content inside the concrete. A linear regression of 0.9228 which suggesting that this signal region could be potential for moisture content measurements.

3.2. Moisture Content in Europe EN 206-1-2013 Concrete in 2.43 GHz and 4.16 GHz

Figure 8 shows the signal spectrum for moisture content in EN 206-1-2013 concrete in a range of 2.35–2.5 GHz reported a small fraction of amplitude increase from −6.5 to −6.39 dB. Figure 9 show the correlation of amplitude with moisture content at R2 = 0.7286. The results show a fair correlation in the region of 2.43 GHz. Further investigation was carried on for the area of interest around 4.16 GHz, which is the second harmonic wave of the designed 2.45 GHz antenna sensor as show in Figure 10. The amplitude increases from −48.3 to −41.5 dB when moisture content decrease. In Figure 11, it is shown the correlation between the amplitude and moisture content. A better linear regression of moisture content relationship with signal amplitude of 4.16 GHz at R2 = 0.9587 can be observed compare to 2.43 GHz. Hence, it is concluded that the designed microstrip patch antenna can accurately monitor the moisture content of the concrete and hence deterioration monitoring of concrete structures.

3.3. Signal Spectrum for MS 26-1-8:2010 Concrete and Europe EN 206-1-2013 Concrete

Figure 12 illustrates the signal spectrum of a smart antenna embedded inside two different concrete blocks. Generally, two-signal spectrums show a similar pattern trend but different amplitude values in the range of 2–3 GHz. The difference in the reflected signal variation can be related to the variation in the concrete’s composition. Future work could be interesting to investigate the patch antenna for composition detection for quality issue approach.

3.4. Simulation Results

Figure 13 shows the simulated results by using CST studio suit compared to experimental results. It is shown that the signal spectrum is well simulated with 95% of root mean square error. The simulation is well designed for the amplitude peak at 2.45 GHz at −15.6 dB. However, the experimental results show the peak at 2.475 GHz at 16.8 dB, which offset 0.02 GHz from the simulation design. The variation is due to the accuracy of the actual patch antenna dimension and thickness of the materials. Future work is recommended for the high precision machining for production of patch antenna.

4. Conclusions

The EM sensor showed high potential to be used for moisture loss evaluation in concrete structures. The following conclusions can be drawn:
(1)
Designed of 2.45 GHz patch antenna is well validated between experiment and simulation.
(2)
Self-printed 2.45 GHz patch antenna successfully detected moisture content in two concrete blocks that were made based on two different standards (Europe EN 206-1-2013 and Malaysia MS 26-1-8:2010).
(3)
Detection of moisture content in Malaysia MS 26-1-8:2010 and Europe EN 206-1-2013 concrete blocks is well correlated at linear regression of 0.9228 and 0.9587 respectively.
The future investigation is to implement the full sensing system, namely circuitries of RF signal generator inside the concrete by self-generated energy for data transmission for moisture detection.

Author Contributions

P.K. and M.M. organize the conceptualization idea and methodology of this paper. Following that, K.H.T. and M.M. working on software, data validation, formal analysis and investigation. K.H. and M.G. working on the concrete block samples preparation. P.K. and A.S. assist on data curation. The original writing and draft preparation are done by K.H.T., M.M., P.K. and A.S. done on review and editing. This project is supervised under A.A.-S. and A.S.

Funding

This research received no external funding.

Acknowledgments

The authors gratefully acknowledge Liverpool John Moores University Faculty of Engineering and Technology for providing the funding for this research project to be undertaken. The authors would like to acknowledge the CST Studio for use of their simulation software.

Conflicts of Interest

The authors declare no conflict of interest.

References

  1. Annamdas, V.G.M.; Bhalla, S.; Soh, C.K. Applications of structural health monitoring technology in Asia. Struct. Health Monit. 2017, 16, 324–346. [Google Scholar] [CrossRef]
  2. Glasser, F.P.; Marchand, J.; Samson, E. Durability of concrete—Degradation phenomena involving detrimental chemical reactions. Cem. Concr. Res. 2008, 38, 226–246. [Google Scholar] [CrossRef]
  3. Soares, N.; Bastos, J.; Dias Pereira, L.; Soares, A.; Amaral, A.R.; Asadi, E.; Rodrigues, E.; Lamas, F.B.; Monteiro, H.; Lopes, M.A.R.; et al. A review on current advances in the energy and environmental performance of buildings towards a more sustainable built environment. Renew. Sustain. Energy Rev. 2017, 77, 845–860. [Google Scholar] [CrossRef]
  4. Akpabot, A.I.; Ede, A.; Olofinnade, O.; Bamigboye, G. Predicting Buildings Collapse Due to Seismic Action in Lagos State. Int. J. Eng. Res. Afr. 2018, 37, 91–102. [Google Scholar] [CrossRef]
  5. Güemes, A.; Fernández-López, A.; Díaz-Maroto, P.F.; Lozano, A.; Sierra-Perez, J. Structural Health Monitoring in Composite Structures by Fiber-Optic Sensors. Sensors 2018, 18, 1094. [Google Scholar] [CrossRef] [PubMed]
  6. Li, Z.; Chan, T.H.T.; Ko, J.M. Fatigue analysis and life prediction of bridges with structural health monitoring data—Part I: Methodology and strategy. Int. J. Fatigue 2001, 23, 45–53. [Google Scholar] [CrossRef]
  7. Wu, Z.; Wong, H.; Buenfeld, N. Transport properties of concrete after drying-wetting regimes to elucidate the effects of moisture content, hysteresis and microcracking. Cem. Concr. Res. 2017, 98, 136–154. [Google Scholar] [CrossRef]
  8. Ranjith, P.; Jasinge, D.; Song, J.Y.; Choi, S.K. A study of the effect of displacement rate and moisture content on the mechanical properties of concrete: Use of acoustic emission. Mech. Mater. 2008, 40, 453–469. [Google Scholar] [CrossRef]
  9. Shoukry, S.N.; William, G.W.; Downie, B.; Riad, M.Y. Effect of moisture and temperature on the mechanical properties of concrete. Constr. Build. Mater. 2011, 25, 688–696. [Google Scholar] [CrossRef]
  10. Bungey, J.H.; Grantham, M.G. Testing of Concrete in Structures; CRC Press: Boca Raton, FL, USA, 2014. [Google Scholar]
  11. Stanish, K.; Hooton, R.D; Thomas, M. Testing the Chloride Penetration Resistance Concrete: A Literature Review; Department of Civil Engineering, University of Toronto: Toronto, ON, Canada, 2000. [Google Scholar]
  12. McCann, D.; Forde, M. Review of NDT methods in the assessment of concrete and masonry structures. NDT & E Int. 2001, 34, 71–84. [Google Scholar]
  13. Subbarao, G.V.; Mulaveesala, R. Quadratic frequency modulated thermal wave imaging for non-destructive testing. Prog. Electromagn. Res. 2012, 26, 11–22. [Google Scholar] [CrossRef]
  14. Hampel, U.; Bieberle, A.; Hoppe, D.; Kronenberg, J. High resolution gamma ray tomography scanner for flow measurement and non-destructive testing applications. Rev. Sci. Instrum. 2007, 78, 103704. [Google Scholar] [CrossRef] [PubMed]
  15. Green, R.E., Jr. Non-contact ultrasonic techniques. Ultrasonics 2004, 42, 9–16. [Google Scholar] [CrossRef] [PubMed]
  16. Hanke, R.; Fuchs, T.; Uhlmann, N. X-ray based methods for non-destructive testing and material characterization. Nucl. Instrum. Methods Phys. Res. Sect. A Accel. Spectrom. Detect. Assoc. Equip. 2008, 591, 14–18. [Google Scholar] [CrossRef]
  17. Bisschop, J.; Van Mier, J. How to study drying shrinkage microcracking in cement-based materials using optical and scanning electron microscopy? Cem. Concr. Res. 2002, 32, 279–287. [Google Scholar] [CrossRef]
  18. Maierhofer, C.; Reinhardt, H.W.; Dobmann, G. Non-Destructive Evaluation of Reinforced Concrete Structures: Non-Destructive Testing Methods; Elsevier: New York, NY, USA, 2010. [Google Scholar]
  19. Farrar, C.R.; Worden, K. An introduction to structural health monitoring. Philos. Trans. R. Soc. Lond. A: Math. Phys. Eng. Sci. 2007, 365, 303–315. [Google Scholar] [CrossRef] [PubMed]
  20. Qing, X.; Kumar, A.; Zhang, C.; Gonzalez, I.F.; Guo, G.; Chang, F. A hybrid piezoelectric/fiber optic diagnostic system for structural health monitoring. Smart Mater. Struct. 2005, 14, S98. [Google Scholar] [CrossRef]
  21. Li, H.-N.; Li, D.-S; Song, G.-B. Recent applications of fiber optic sensors to health monitoring in civil engineering. Eng. Struct. 2004, 26, 1647–1657. [Google Scholar] [CrossRef]
  22. Hamdan, A.; Sultan, M.; Mustapha, F. Structural Health Monitoring of Biocomposites, Fibre-Reinforced Composites, and Hybrid Composite. In Structural Health Monitoring of Biocomposites, Fibre-Reinforced Composites and Hybrid Composites; Woodhead Publishing: Sawston, UK, 2019; pp. 227–242. [Google Scholar]
  23. Chang, P.C.; Flatau, A.; Liu, S. Health monitoring of civil infrastructure. Struct. Health Monit. 2003, 2, 257–267. [Google Scholar] [CrossRef]
  24. Talakokula, V.; Bhalla, S.; Gupta, A. Monitoring early hydration of reinforced concrete structures using structural parameters identified by piezo sensors via electromechanical impedance technique. Mech. Syst. Signal Process. 2018, 99, 129–141. [Google Scholar] [CrossRef]
  25. Qin, L.; Li, Z. Monitoring of cement hydration using embedded piezoelectric transducers. Smart Mater. Struct. 2008, 17, 055005. [Google Scholar] [CrossRef]
  26. Providakis, C.; Liarakos, E.; Kampianakis, E. Nondestructive wireless monitoring of early-age concrete strength gain using an innovative electromechanical impedance sensing system. Smart Mater. Res. 2013, 932568. [Google Scholar] [CrossRef]
  27. Leal-Junior, A.G.; Díaz, C.R.; Marques, C.; Pontes, M.J.; Frizera, A. Multiplexing technique for quasi-distributed sensors arrays in polymer optical fiber intensity variation-based sensors. Opt. Laser Technol. 2019, 111, 81–88. [Google Scholar] [CrossRef]
  28. Alokita, S. Recent advances and trends in structural health monitoring. In Structural Health Monitoring of Biocomposites, Fibre-Reinforced Composites and Hybrid Composites; Woodhead Publishing: Sawston, UK, 2019; pp. 53–73. [Google Scholar]
  29. Zhou, Z.; Wang, Z.; Shao, L. Fiber-reinforced polymer-packaged optical fiber Bragg grating strain sensors for infrastructures under harsh environment. J. Sens. 2016, 3953750. [Google Scholar] [CrossRef]
  30. Yao, J.; Tjuatja, S.; Huang, H. Real-time vibratory strain sensing using passive wireless antenna sensor. IEEE Sens. J. 2015, 15, 4338–4345. [Google Scholar] [CrossRef]
  31. Sanders, J.W.; Yao, J.; Huang, H. Microstrip patch antenna temperature sensor. IEEE Sens. J. 2015, 15, 5312–5319. [Google Scholar] [CrossRef]
  32. Cheng, H.; Ebadi, S.; Ren, X.; Gong, X. Wireless passive high-temperature sensor based on multifunctional reflective patch antenna up to 1050 degrees centigrade. Sens. Actuators A Phys. 2015, 222, 204–211. [Google Scholar] [CrossRef]
  33. Savin, A.; Steigmann, R.; Bruma, A.; Šturm, R. An electromagnetic sensor with a metamaterial lens for nondestructive evaluation of composite materials. Sensors 2015, 15, 15903–15920. [Google Scholar] [CrossRef] [PubMed]
  34. Teng, K.H.; Shaw, A.; Ateeq, M.; AL-shamma’a, A.; Wylie, A.; Kazi, S.N.; Chew, B.T.; Kot, P. Design and implementation of a non-invasive real-time microwave sensor for assessing water hardness in heat exchangers. J. Electromagn. Waves Appl. 2018, 32, 797–811. [Google Scholar] [CrossRef]
  35. Kot, P.; Shaw, A.; Riley, M.; Ali, A.S.; Cotgrave, A. The Feasibility of Using Electromagnetic Waves in Determining Membrane Failure Through Concrete. Int. J. Civ. Eng. 2017, 15, 355–362. [Google Scholar] [CrossRef]
  36. Kot, P.; Shaw, A.; Riley, M.; Ali, A.S. The application of electromagnetic waves in monitoring water infiltration on concrete flat roof: The case of Malaysia. Constr. Build. Mater. 2016, 122, 435–445. [Google Scholar] [CrossRef]
Figure 1. Full dimension of a patch antenna for 2.45 GHz frequency.
Sensors 19 00547 g001
Figure 2. Designed 2.45 GHz Microstrip Patch Antenna Sensor ready for fabrication.
Sensors 19 00547 g002
Figure 3. LPKF Protomat D104 machine used to fabricate the microstrip antenna on FR4 PCB board.
Sensors 19 00547 g003
Figure 4. Smart sensor is embedded in the concrete block for moisture detection.
Sensors 19 00547 g004
Figure 5. Experimental Setup for moisture content detection in concrete structure.
Sensors 19 00547 g005
Figure 6. Signal spectrum for moisture content in MS 26-1-8:2010 concrete structure in the range of 2.3–2.5 GHz.
Sensors 19 00547 g006
Figure 7. Correlation of moisture content weight with S11 amplitude at 2.406 GHz in MS 26-1-8:2010 concrete.
Sensors 19 00547 g007
Figure 8. Signal spectrum for moisture content in EN 206-1-2013 concrete structure in the range of 2.35–2.5 GHz.
Sensors 19 00547 g008
Figure 9. Correlation of S11 amplitude against moisture content in Europe EN 206-1-2013 correlation in 2.43 GHz.
Sensors 19 00547 g009
Figure 10. Signal spectrum for moisture content in EN 206-1-2013 concrete structure in the range of 4.1–4.25 GHz.
Sensors 19 00547 g010
Figure 11. Correlation of S11 amplitude against moisture content in Europe EN 206-1-2013 correlation in 4.16 GHz frequency.
Sensors 19 00547 g011
Figure 12. Signal spectrum for MS 26-MS 26-1-8:2010 concrete and Europe EN 206-1-2013 concrete in the range of 2–3 GHz at dry condition.
Sensors 19 00547 g012
Figure 13. Comparison between experimental and CST simulation results of patch antenna in exposure to air condition.
Sensors 19 00547 g013
Table 1. Properties of conductor and dielectric of microstrip patch antenna.
Copper (Conductor & Ground)FR-4 (Dielectric)
Thickness0.03 mm1.6 mm
Dielectric constant, ε14.7
Electrical Conductivity5.96 × 107 (S/m)0
Loss tangent, tan б00.035
Table 2. Concrete composition with OPC (CEM II 32.5 R)- kg/m3.
ParametersUK Standards (EN 206-1-2013)Malaysian Standards (MS 26-1-8:2010)
Type of cementCEM IICEM II
Cement350393
Sand 0.25–2 mm525589
Gravel 4–8 mm10501178
Water/cement ratio0.70.5

