Predicting Blast-Induced Ground Vibration in Open-Pit Mines Using Vibration Sensors and Support Vector Regression-Based Optimization Algorithms


Abstract
:1. Introduction
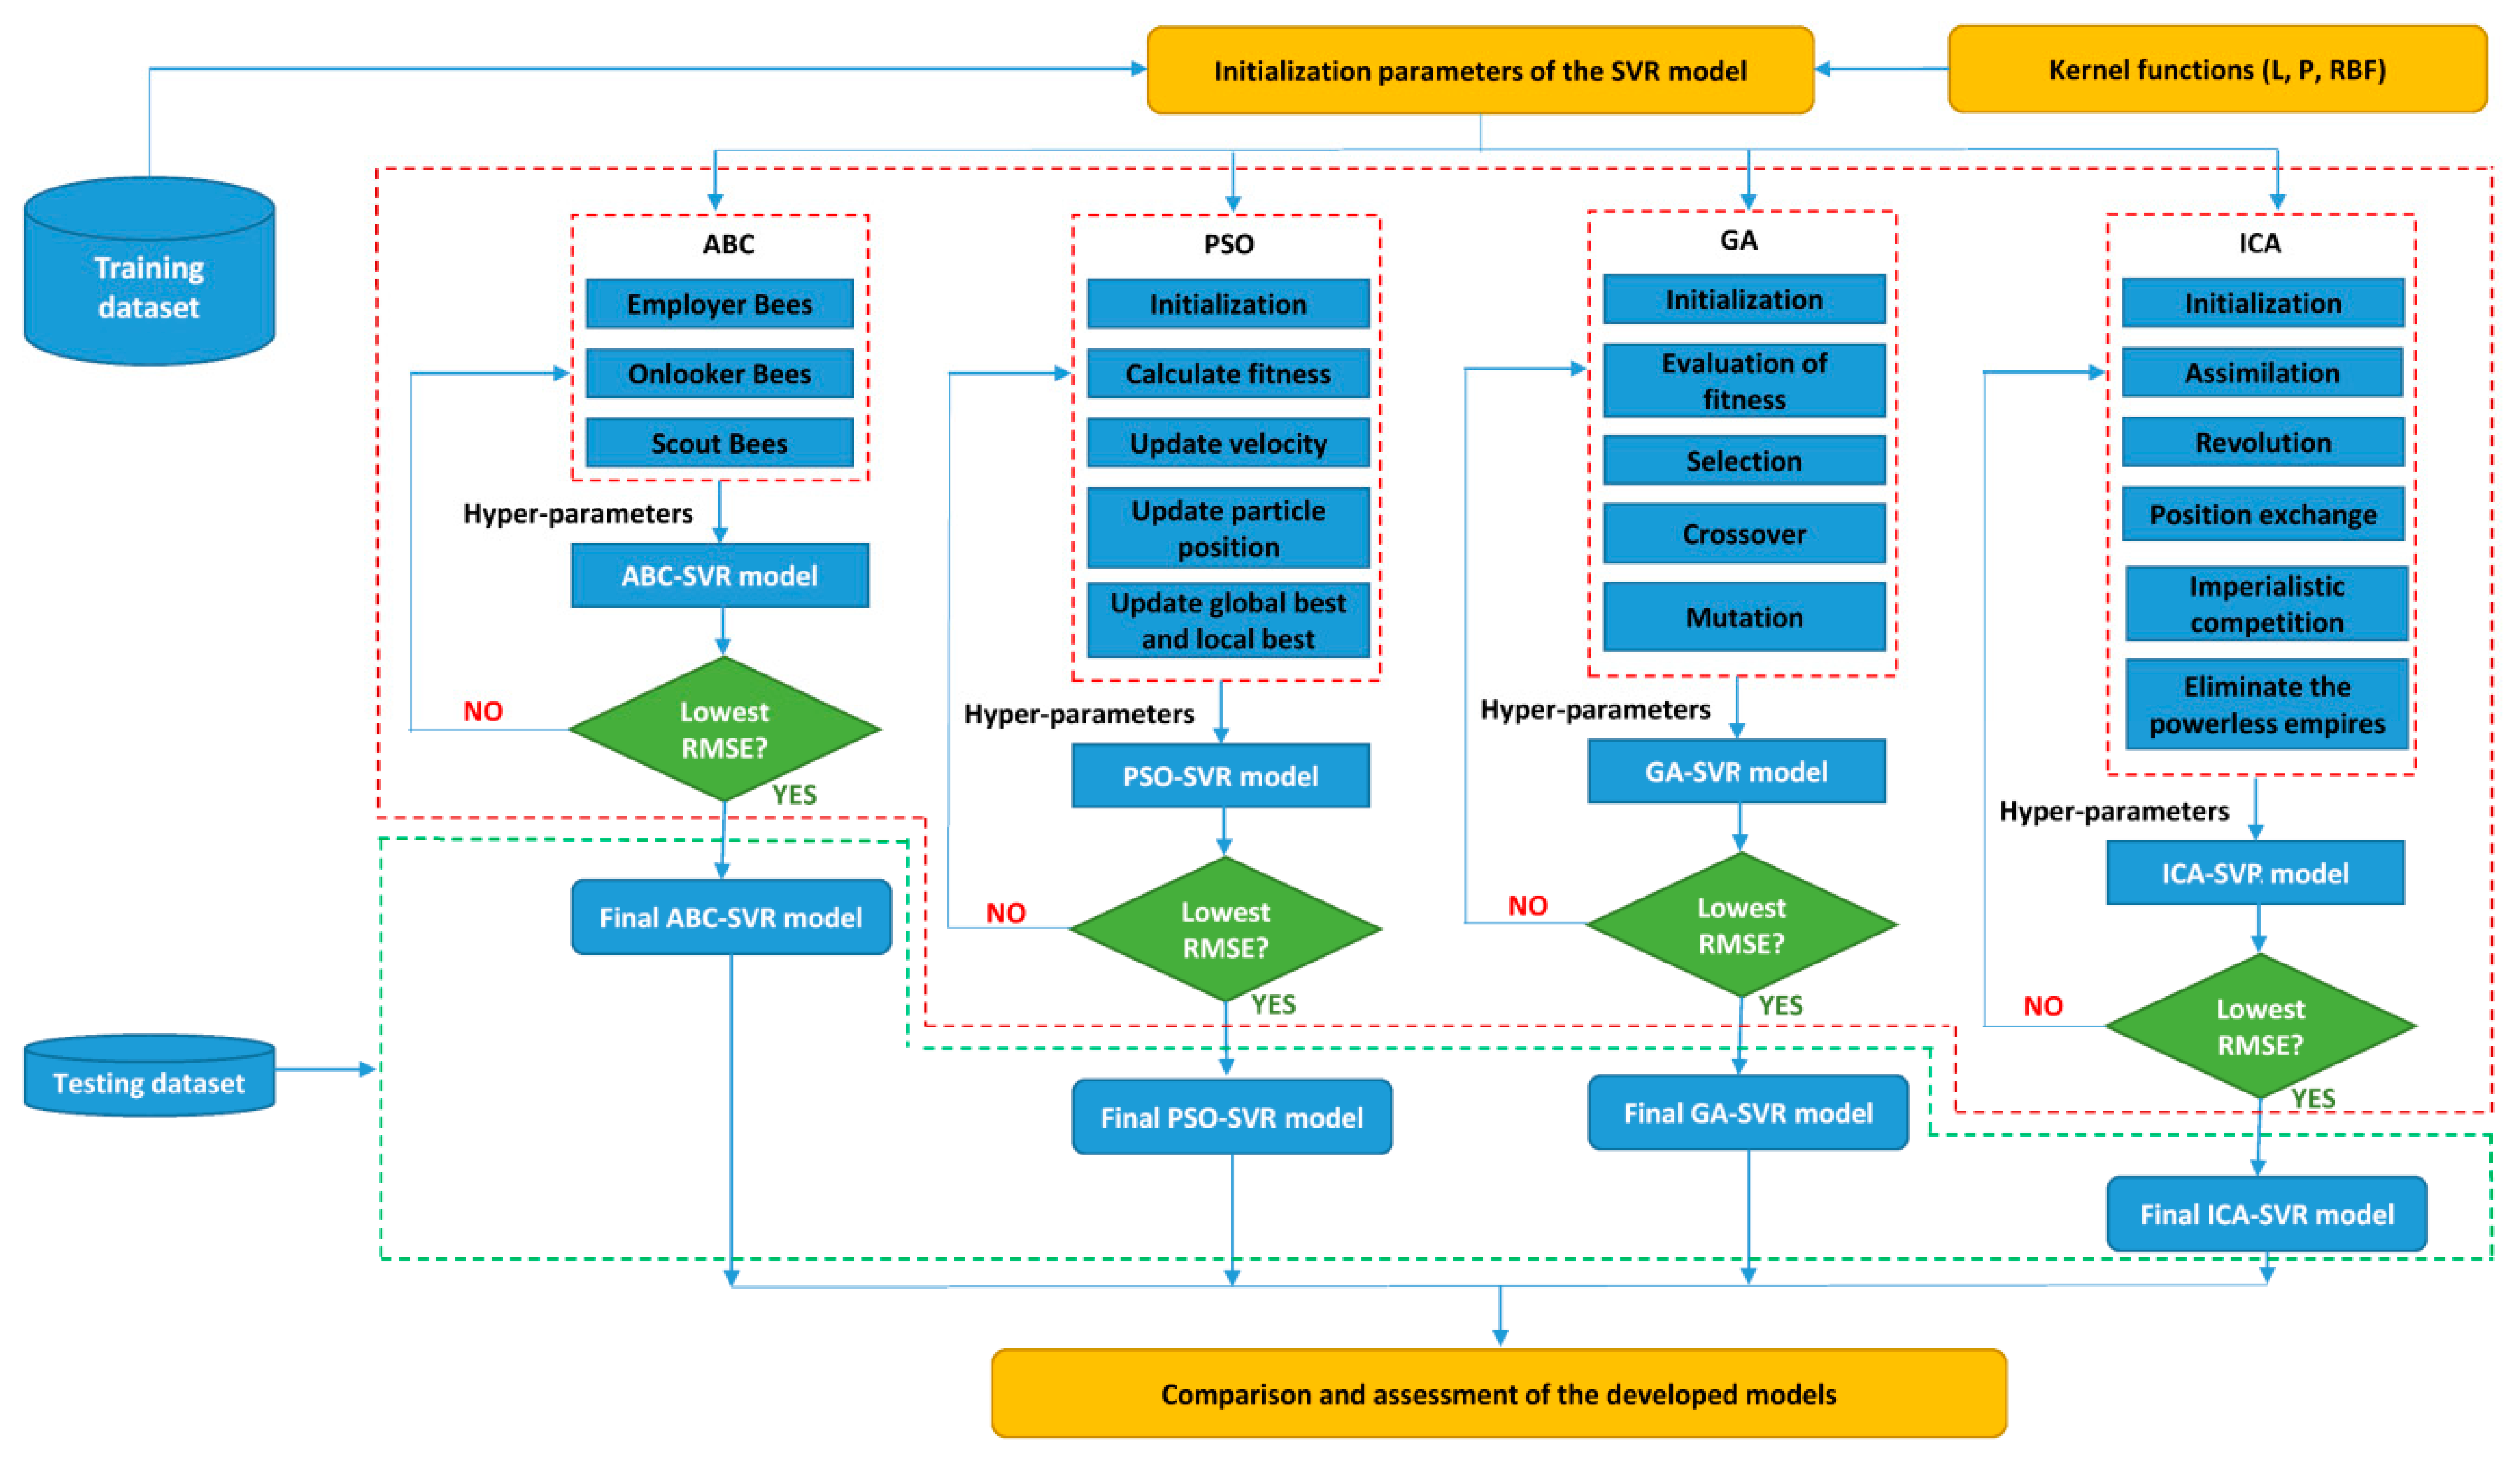
2. Proposing the Framework of SVR-based Evolution Algorithms
3. Statistical Criteria
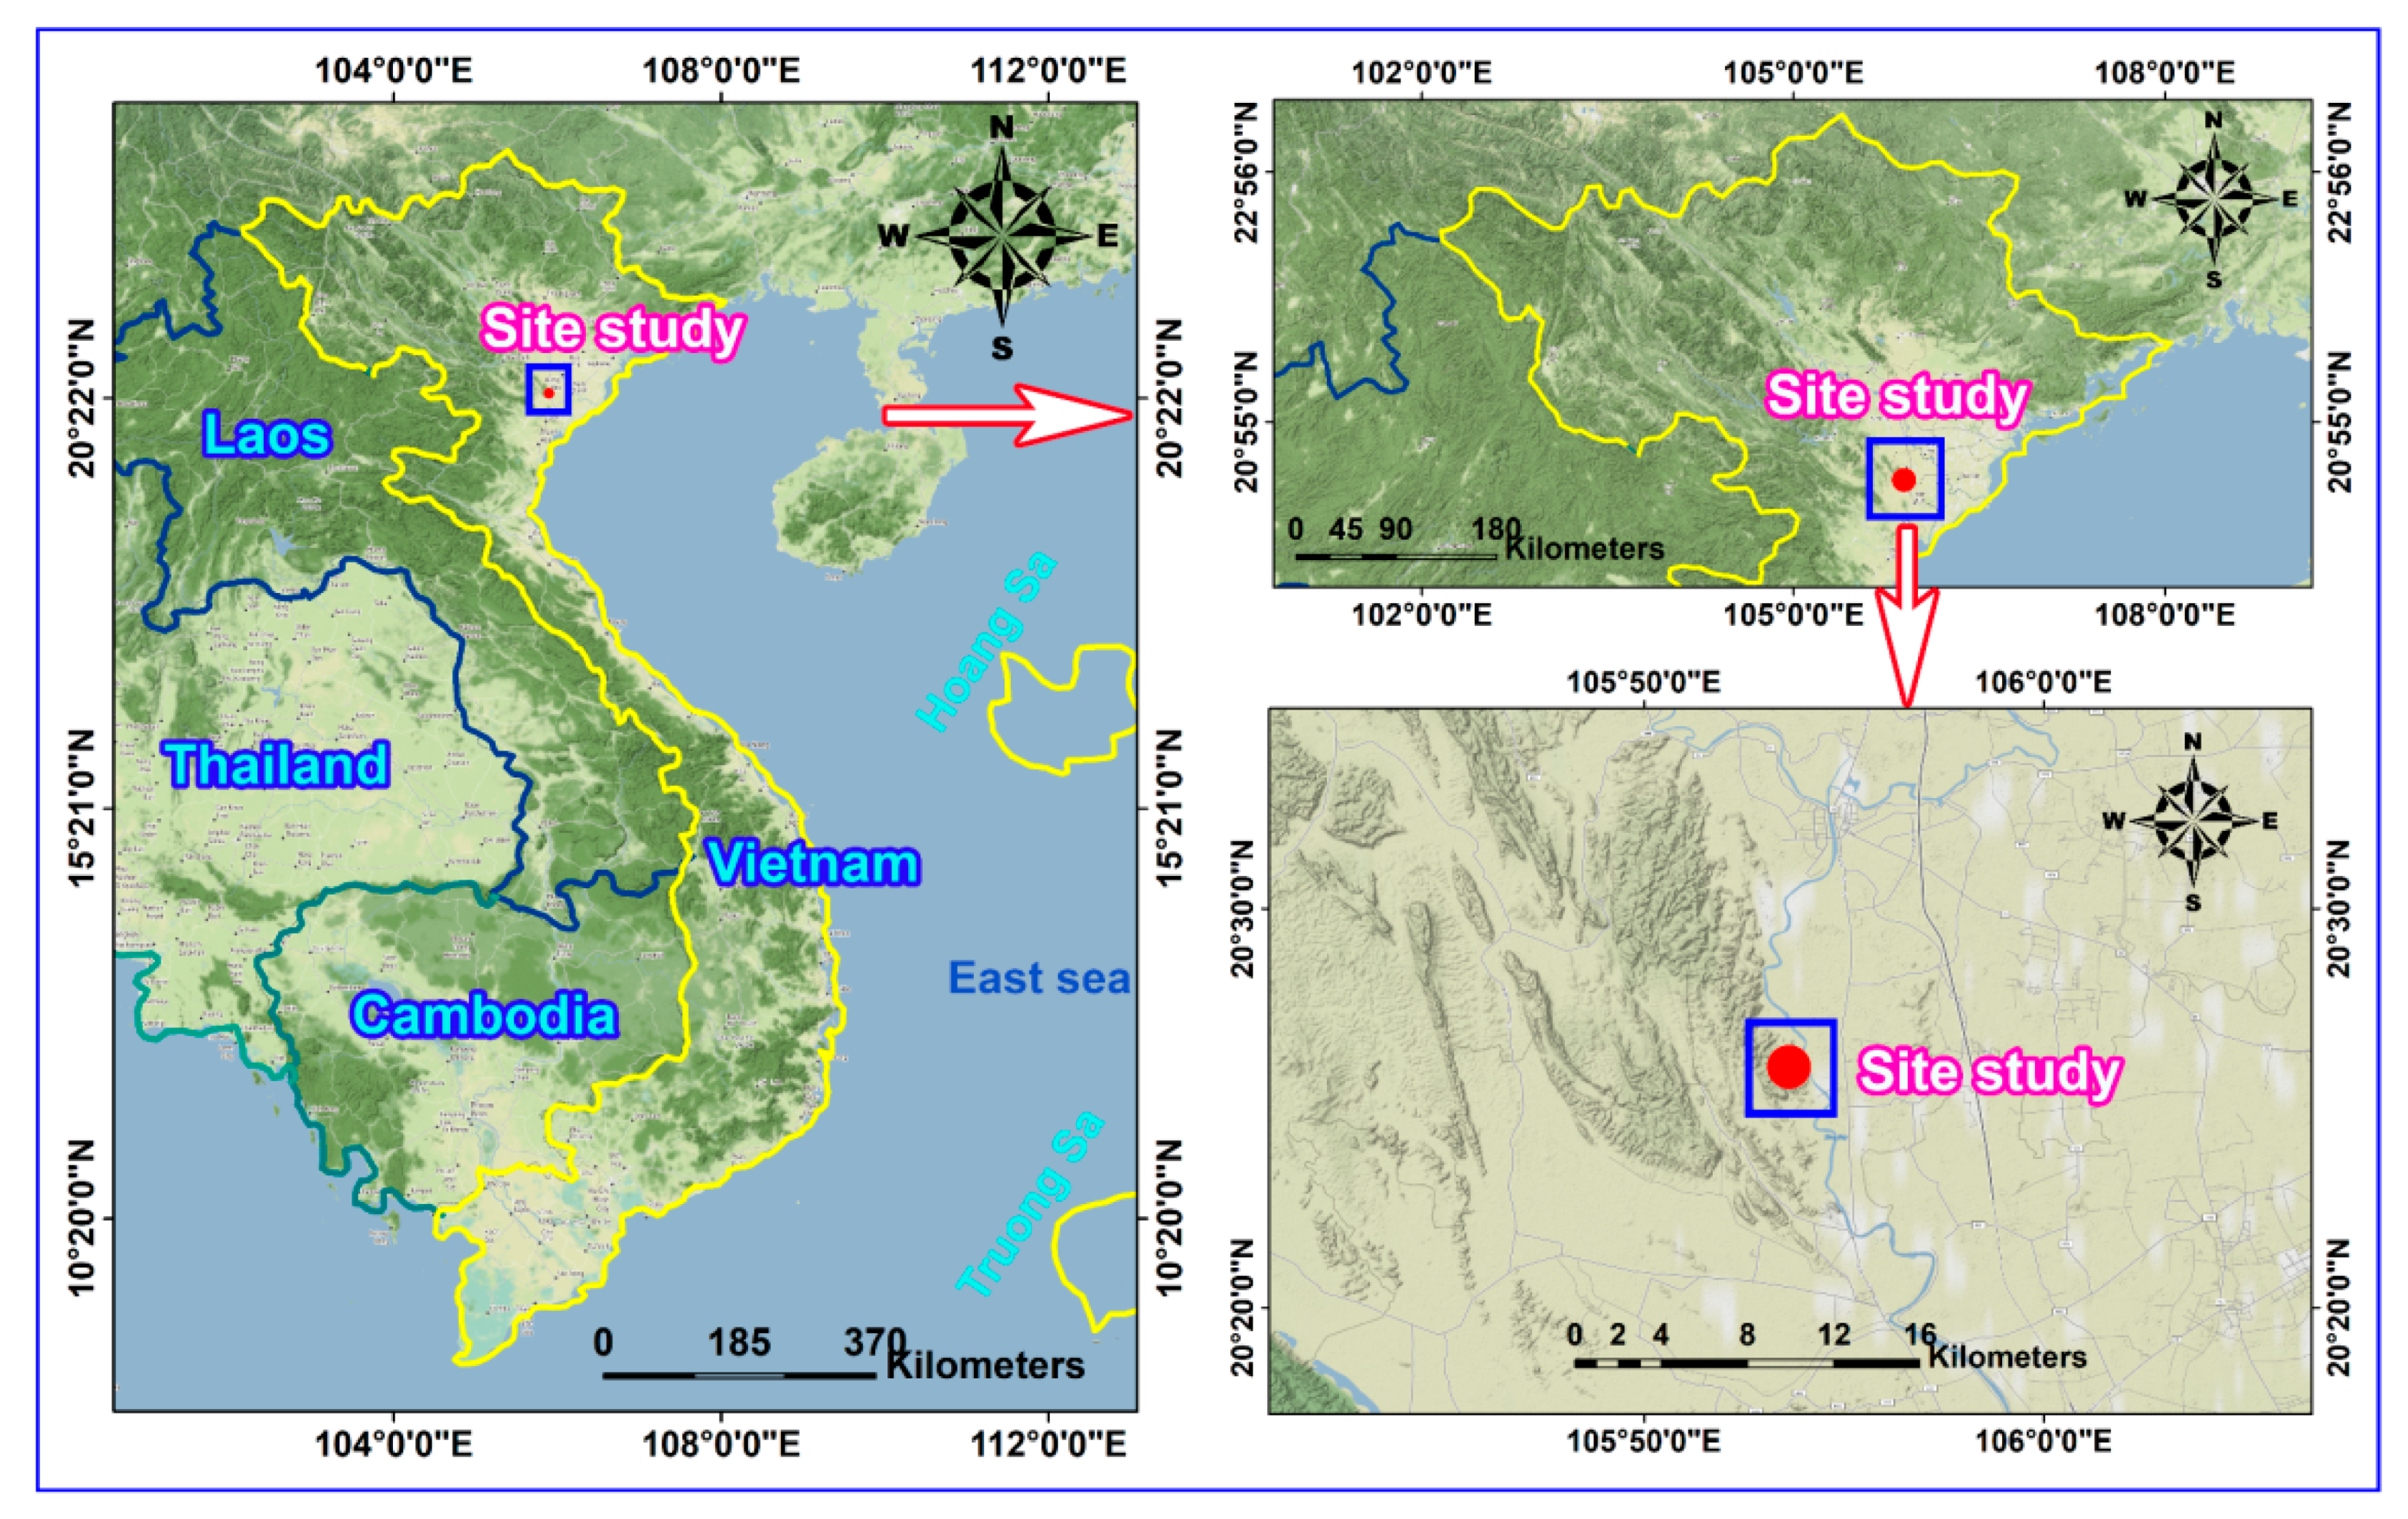
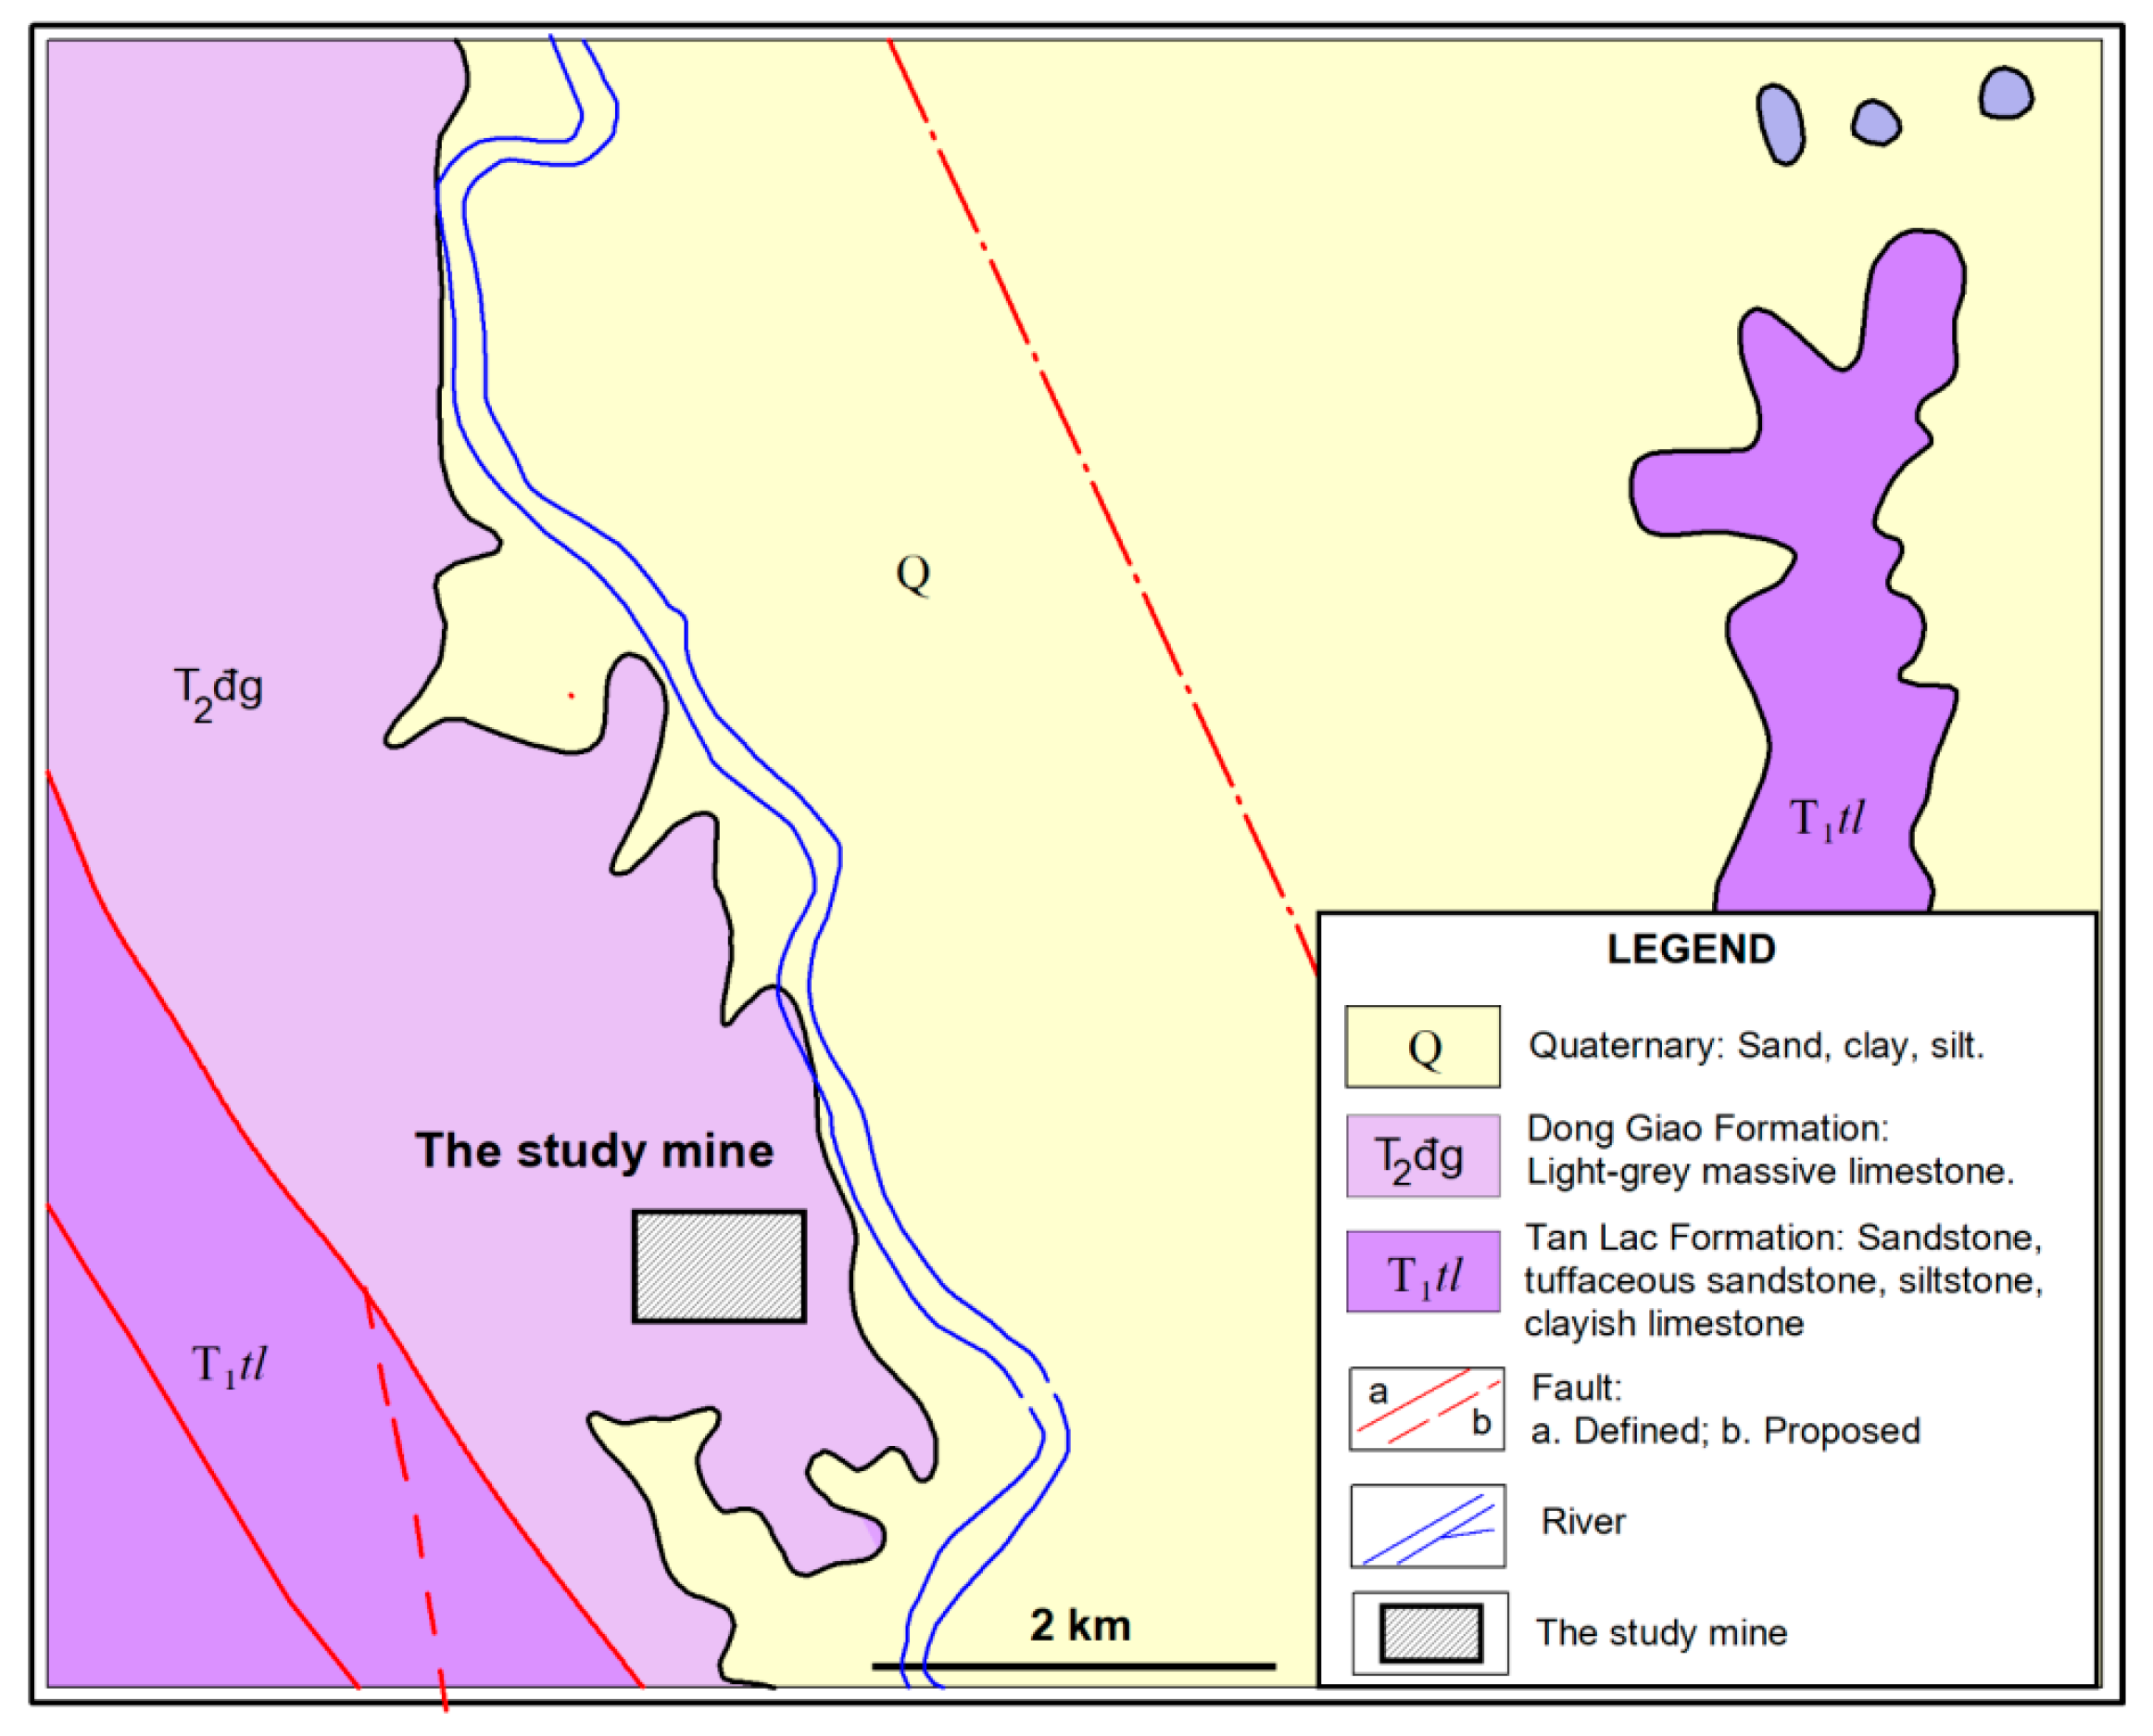
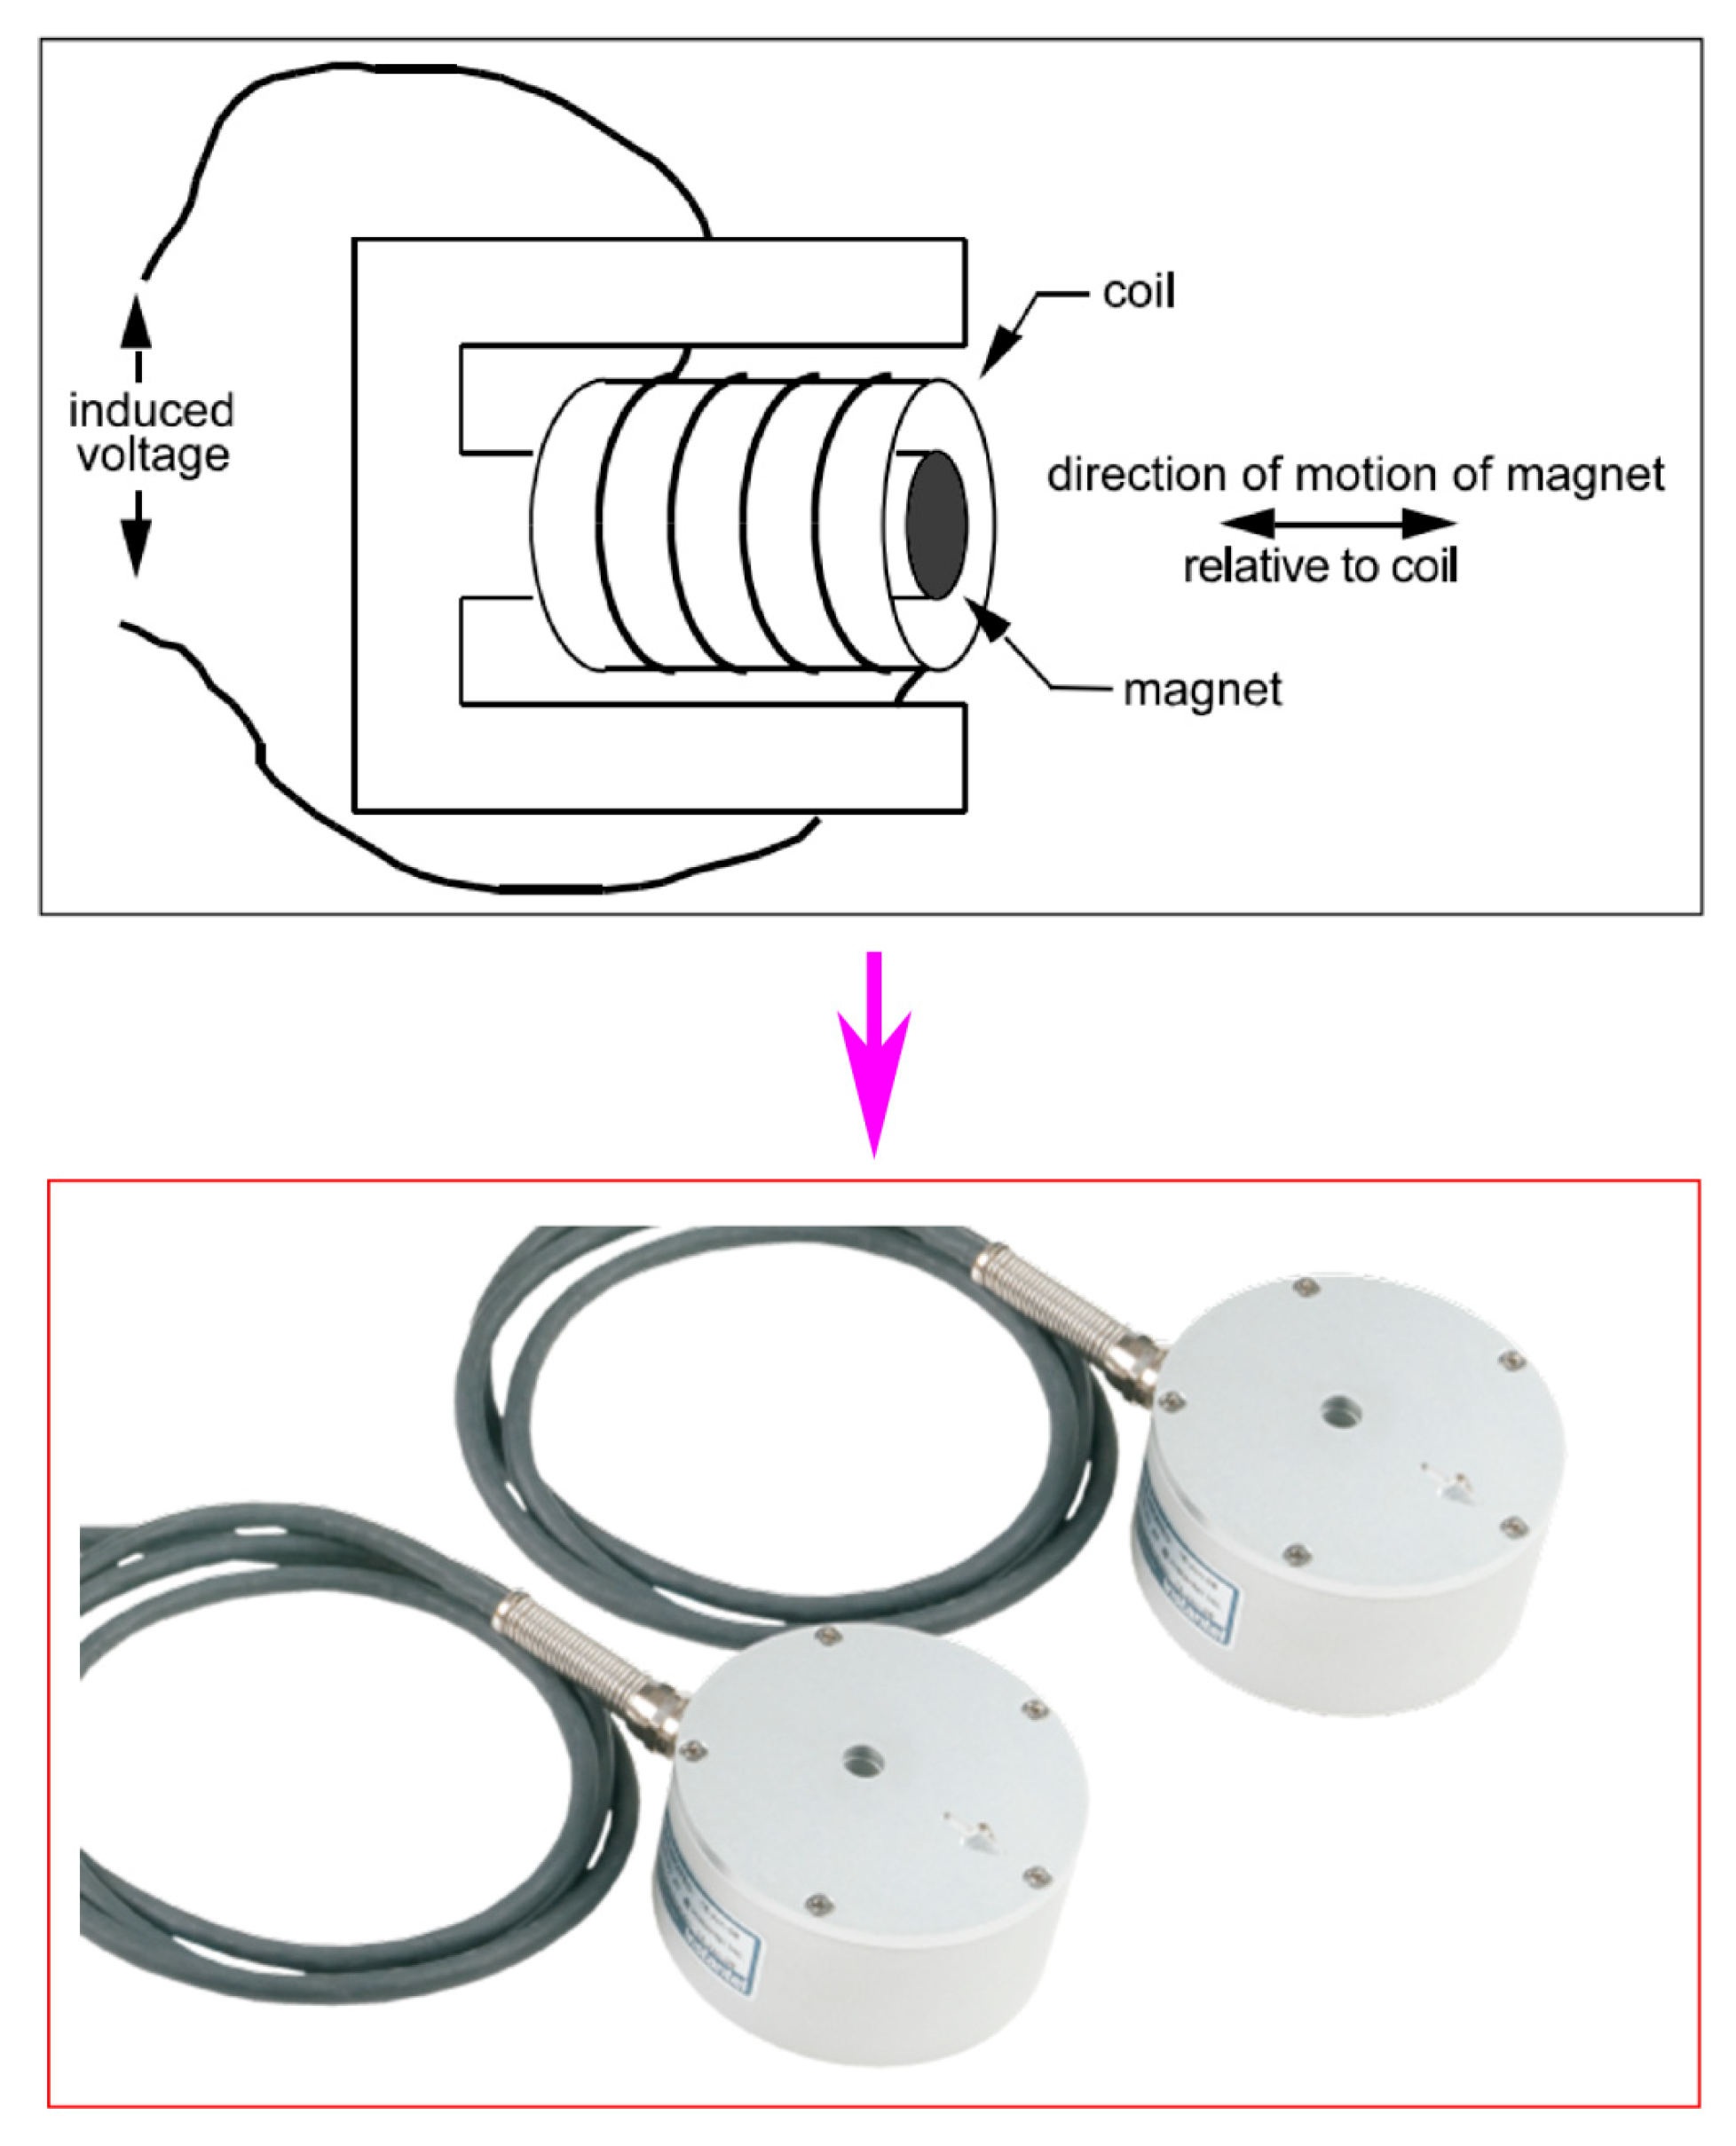
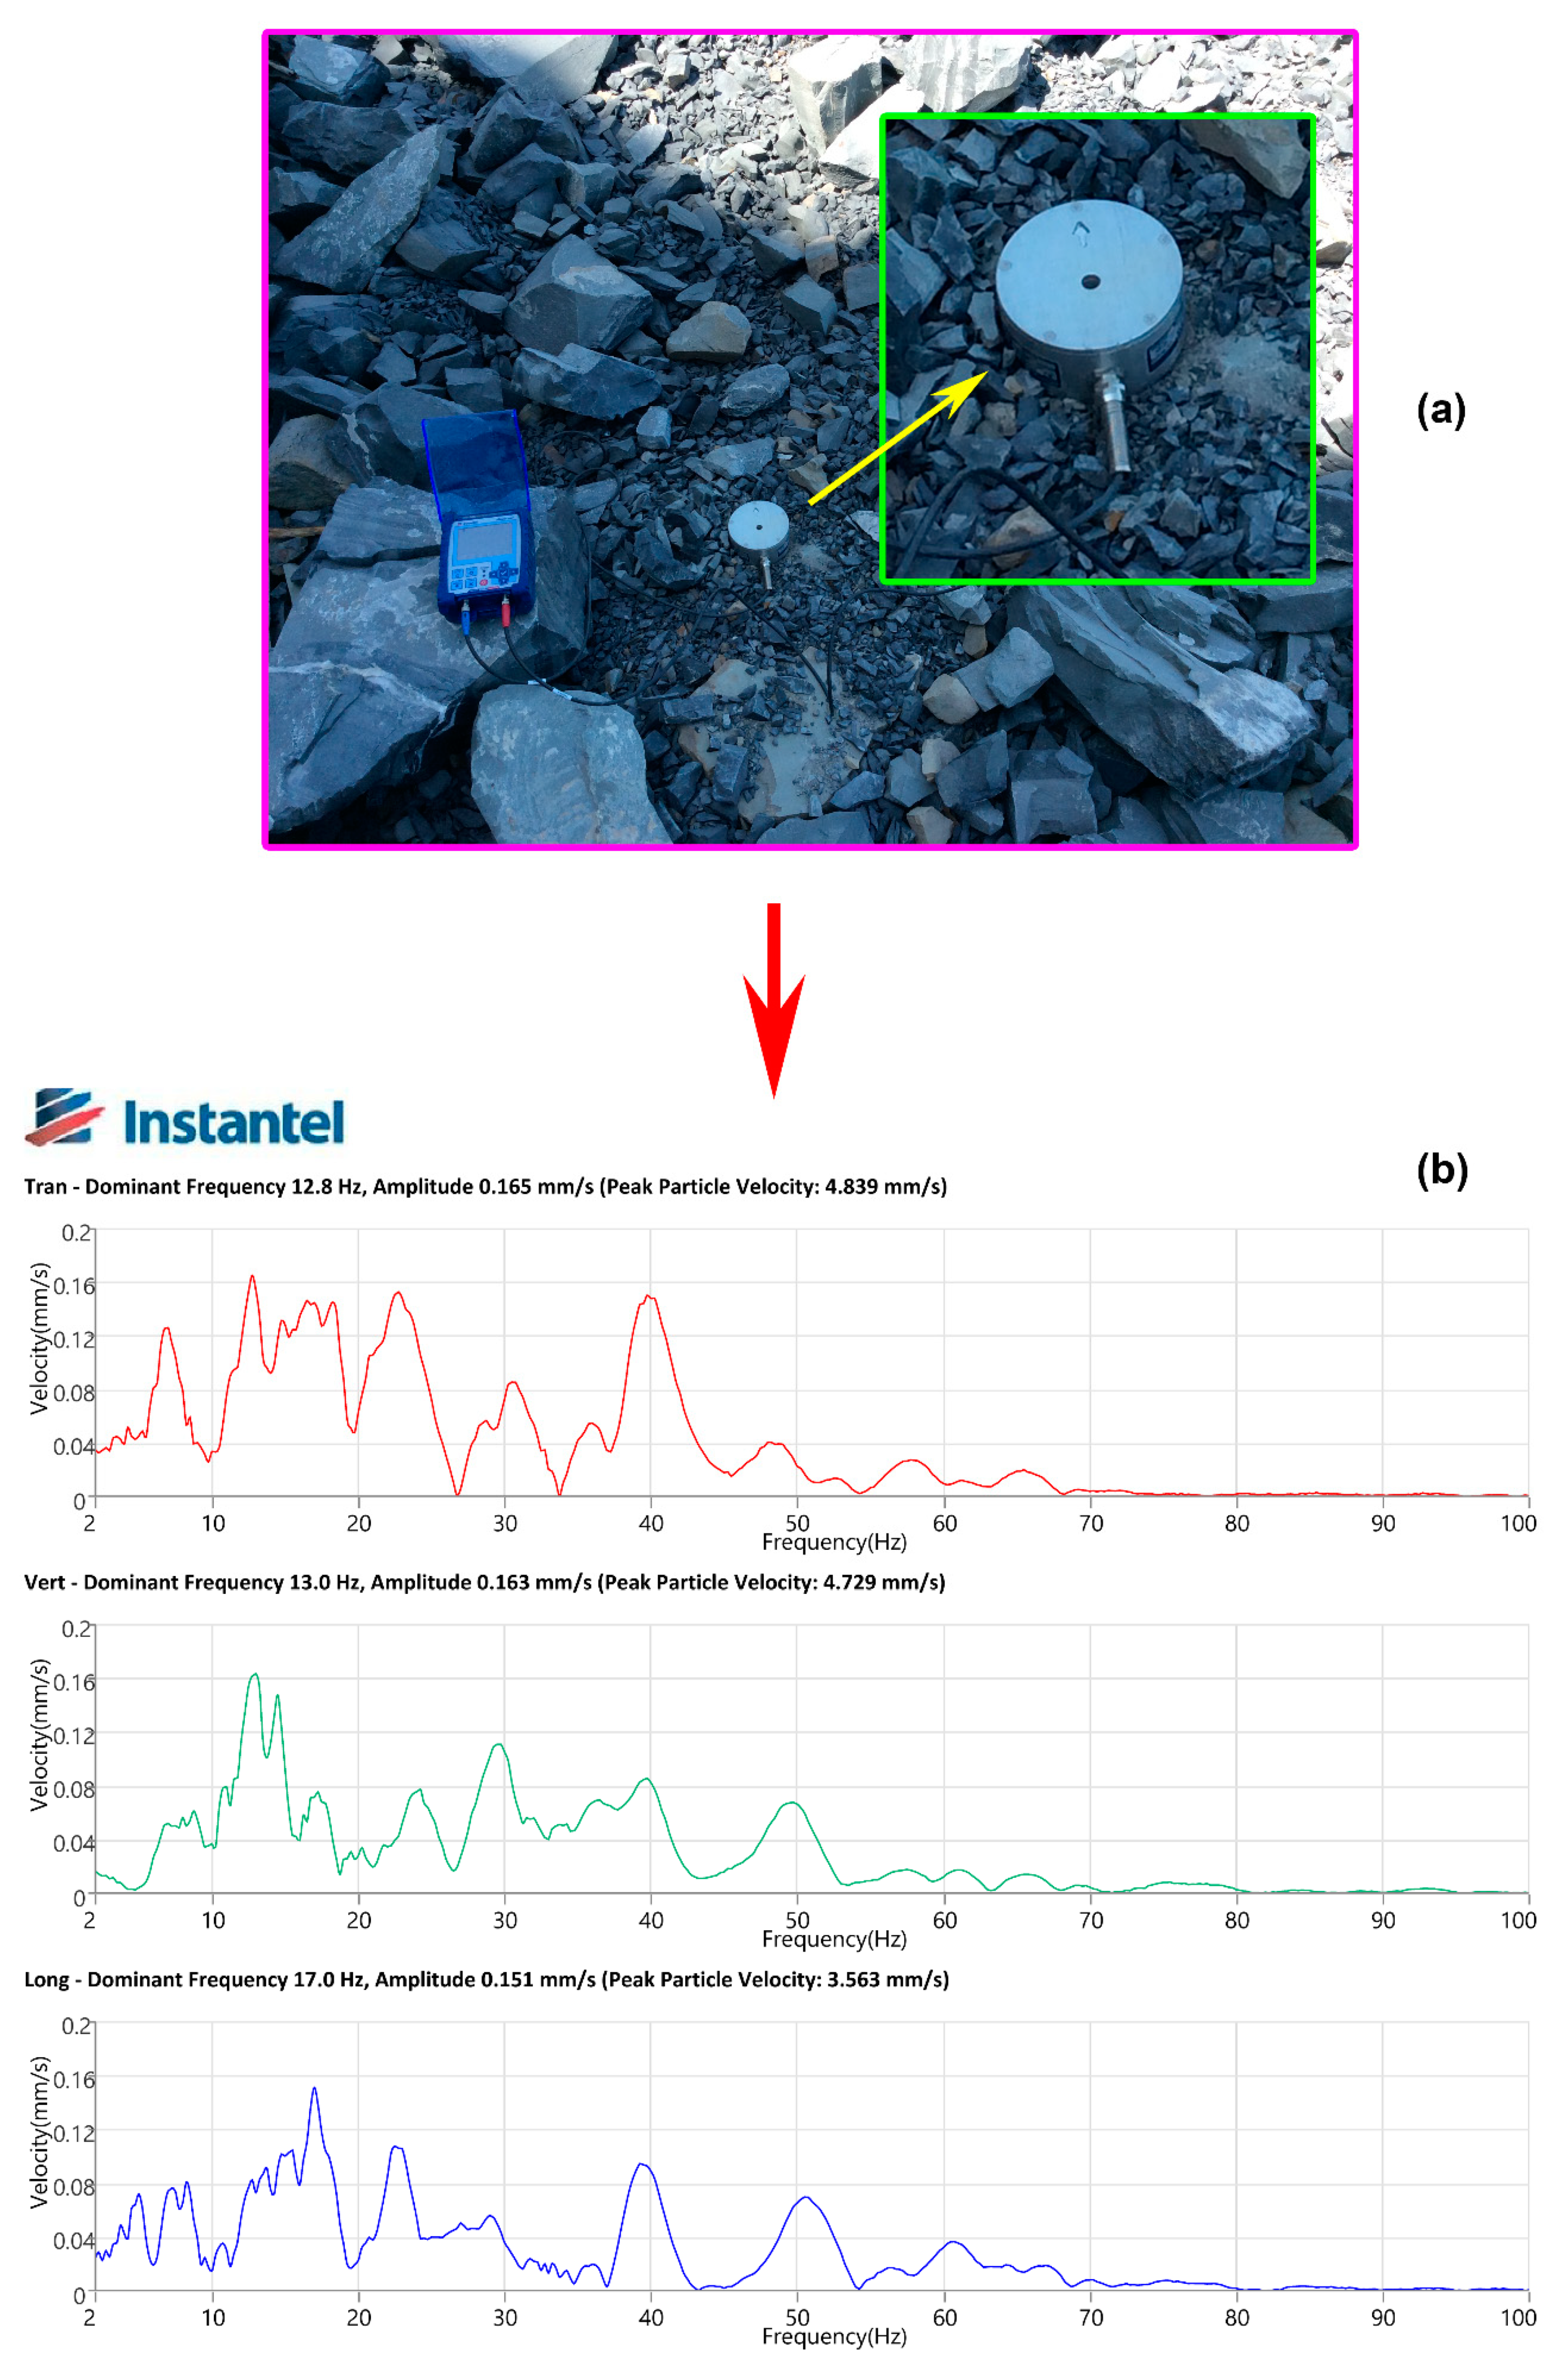
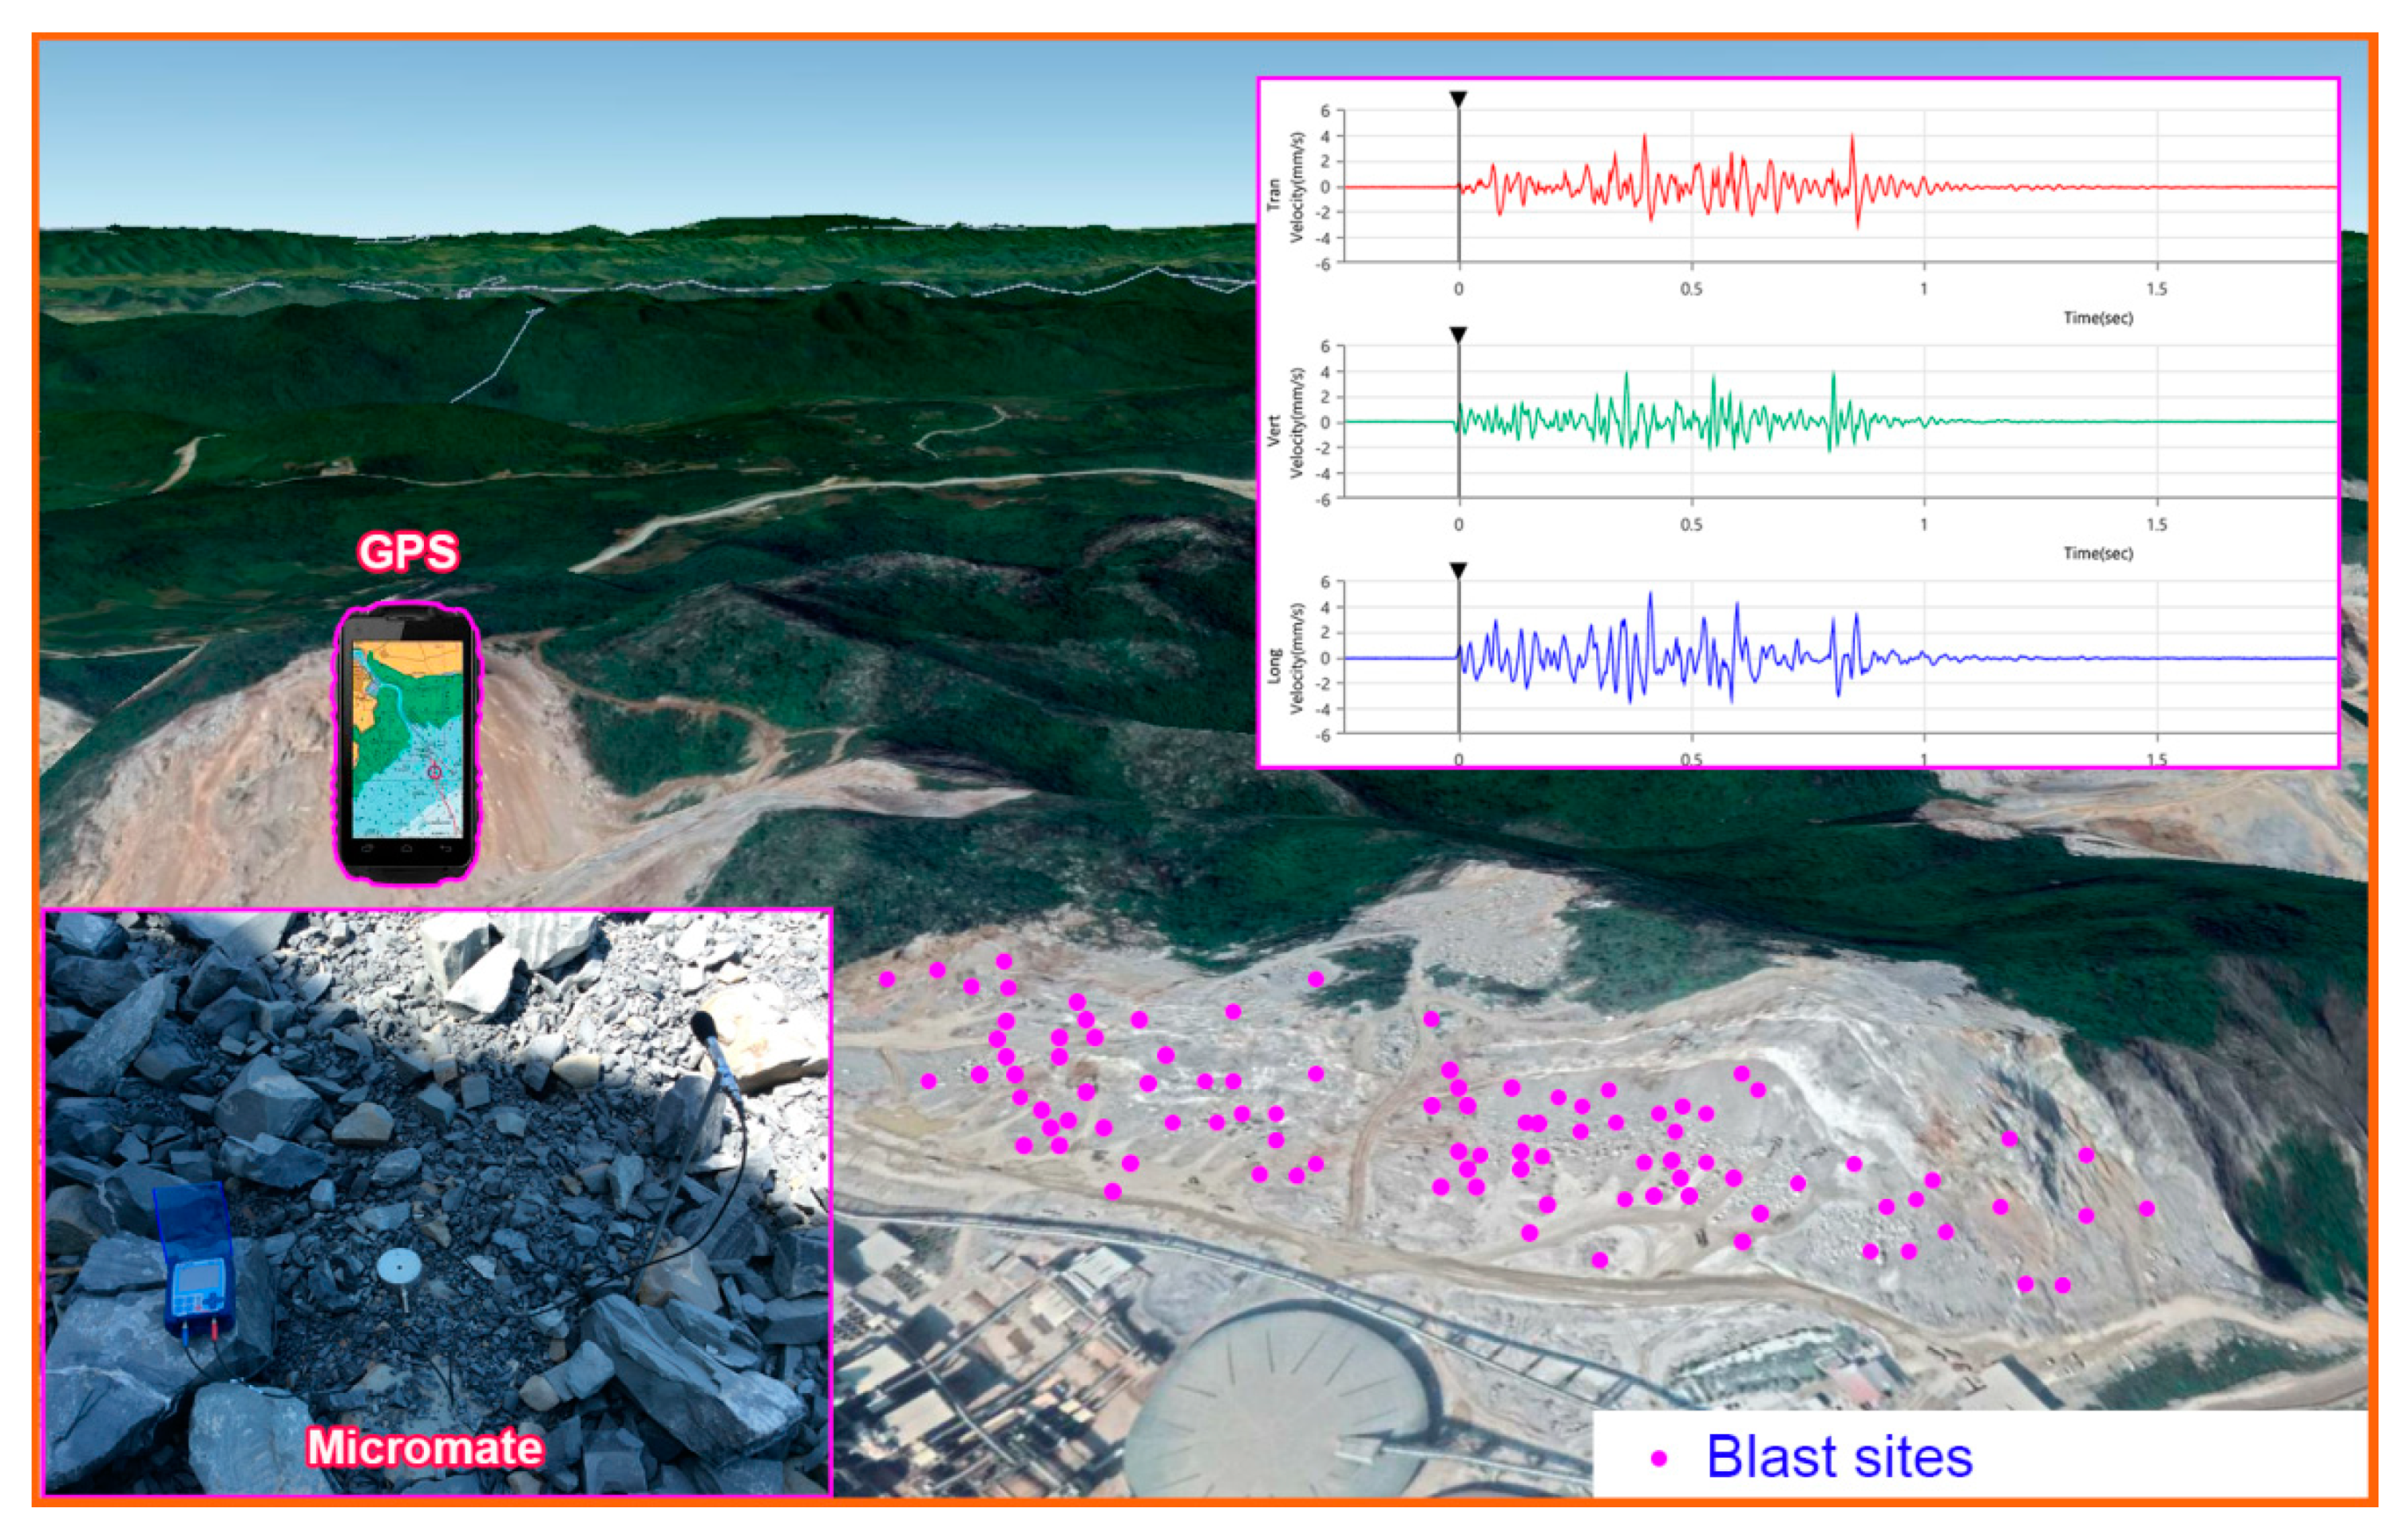
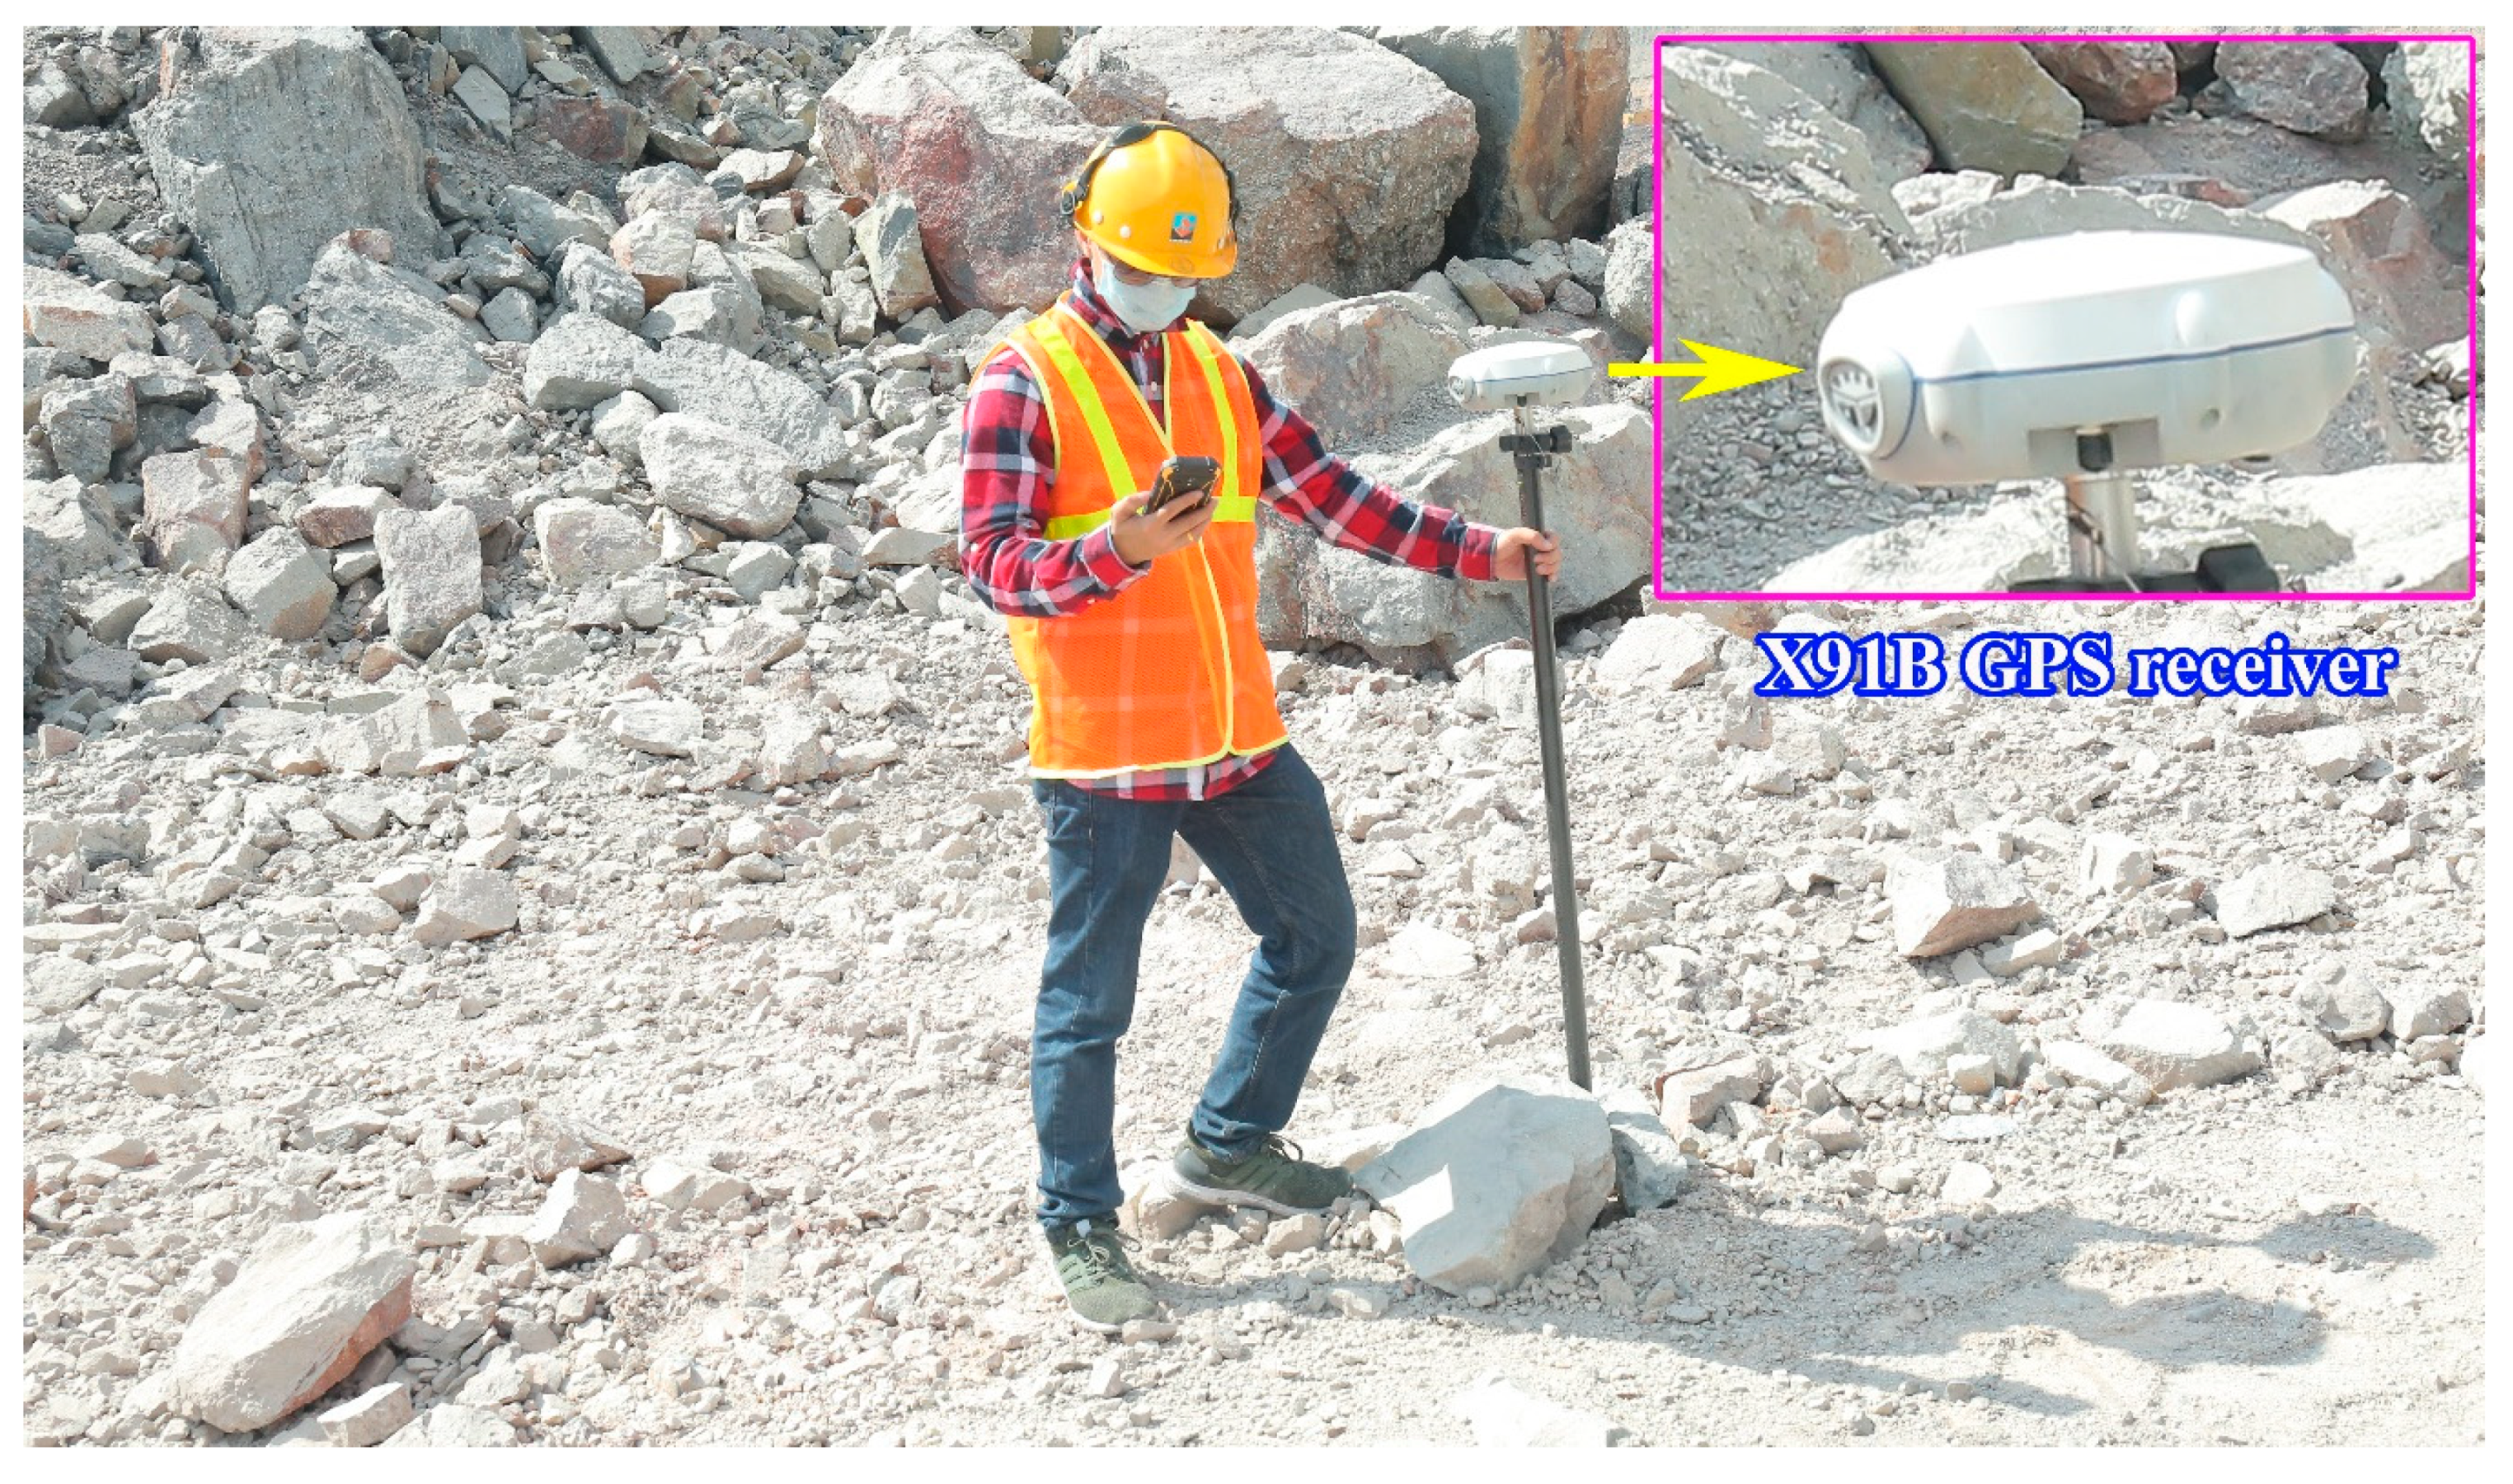
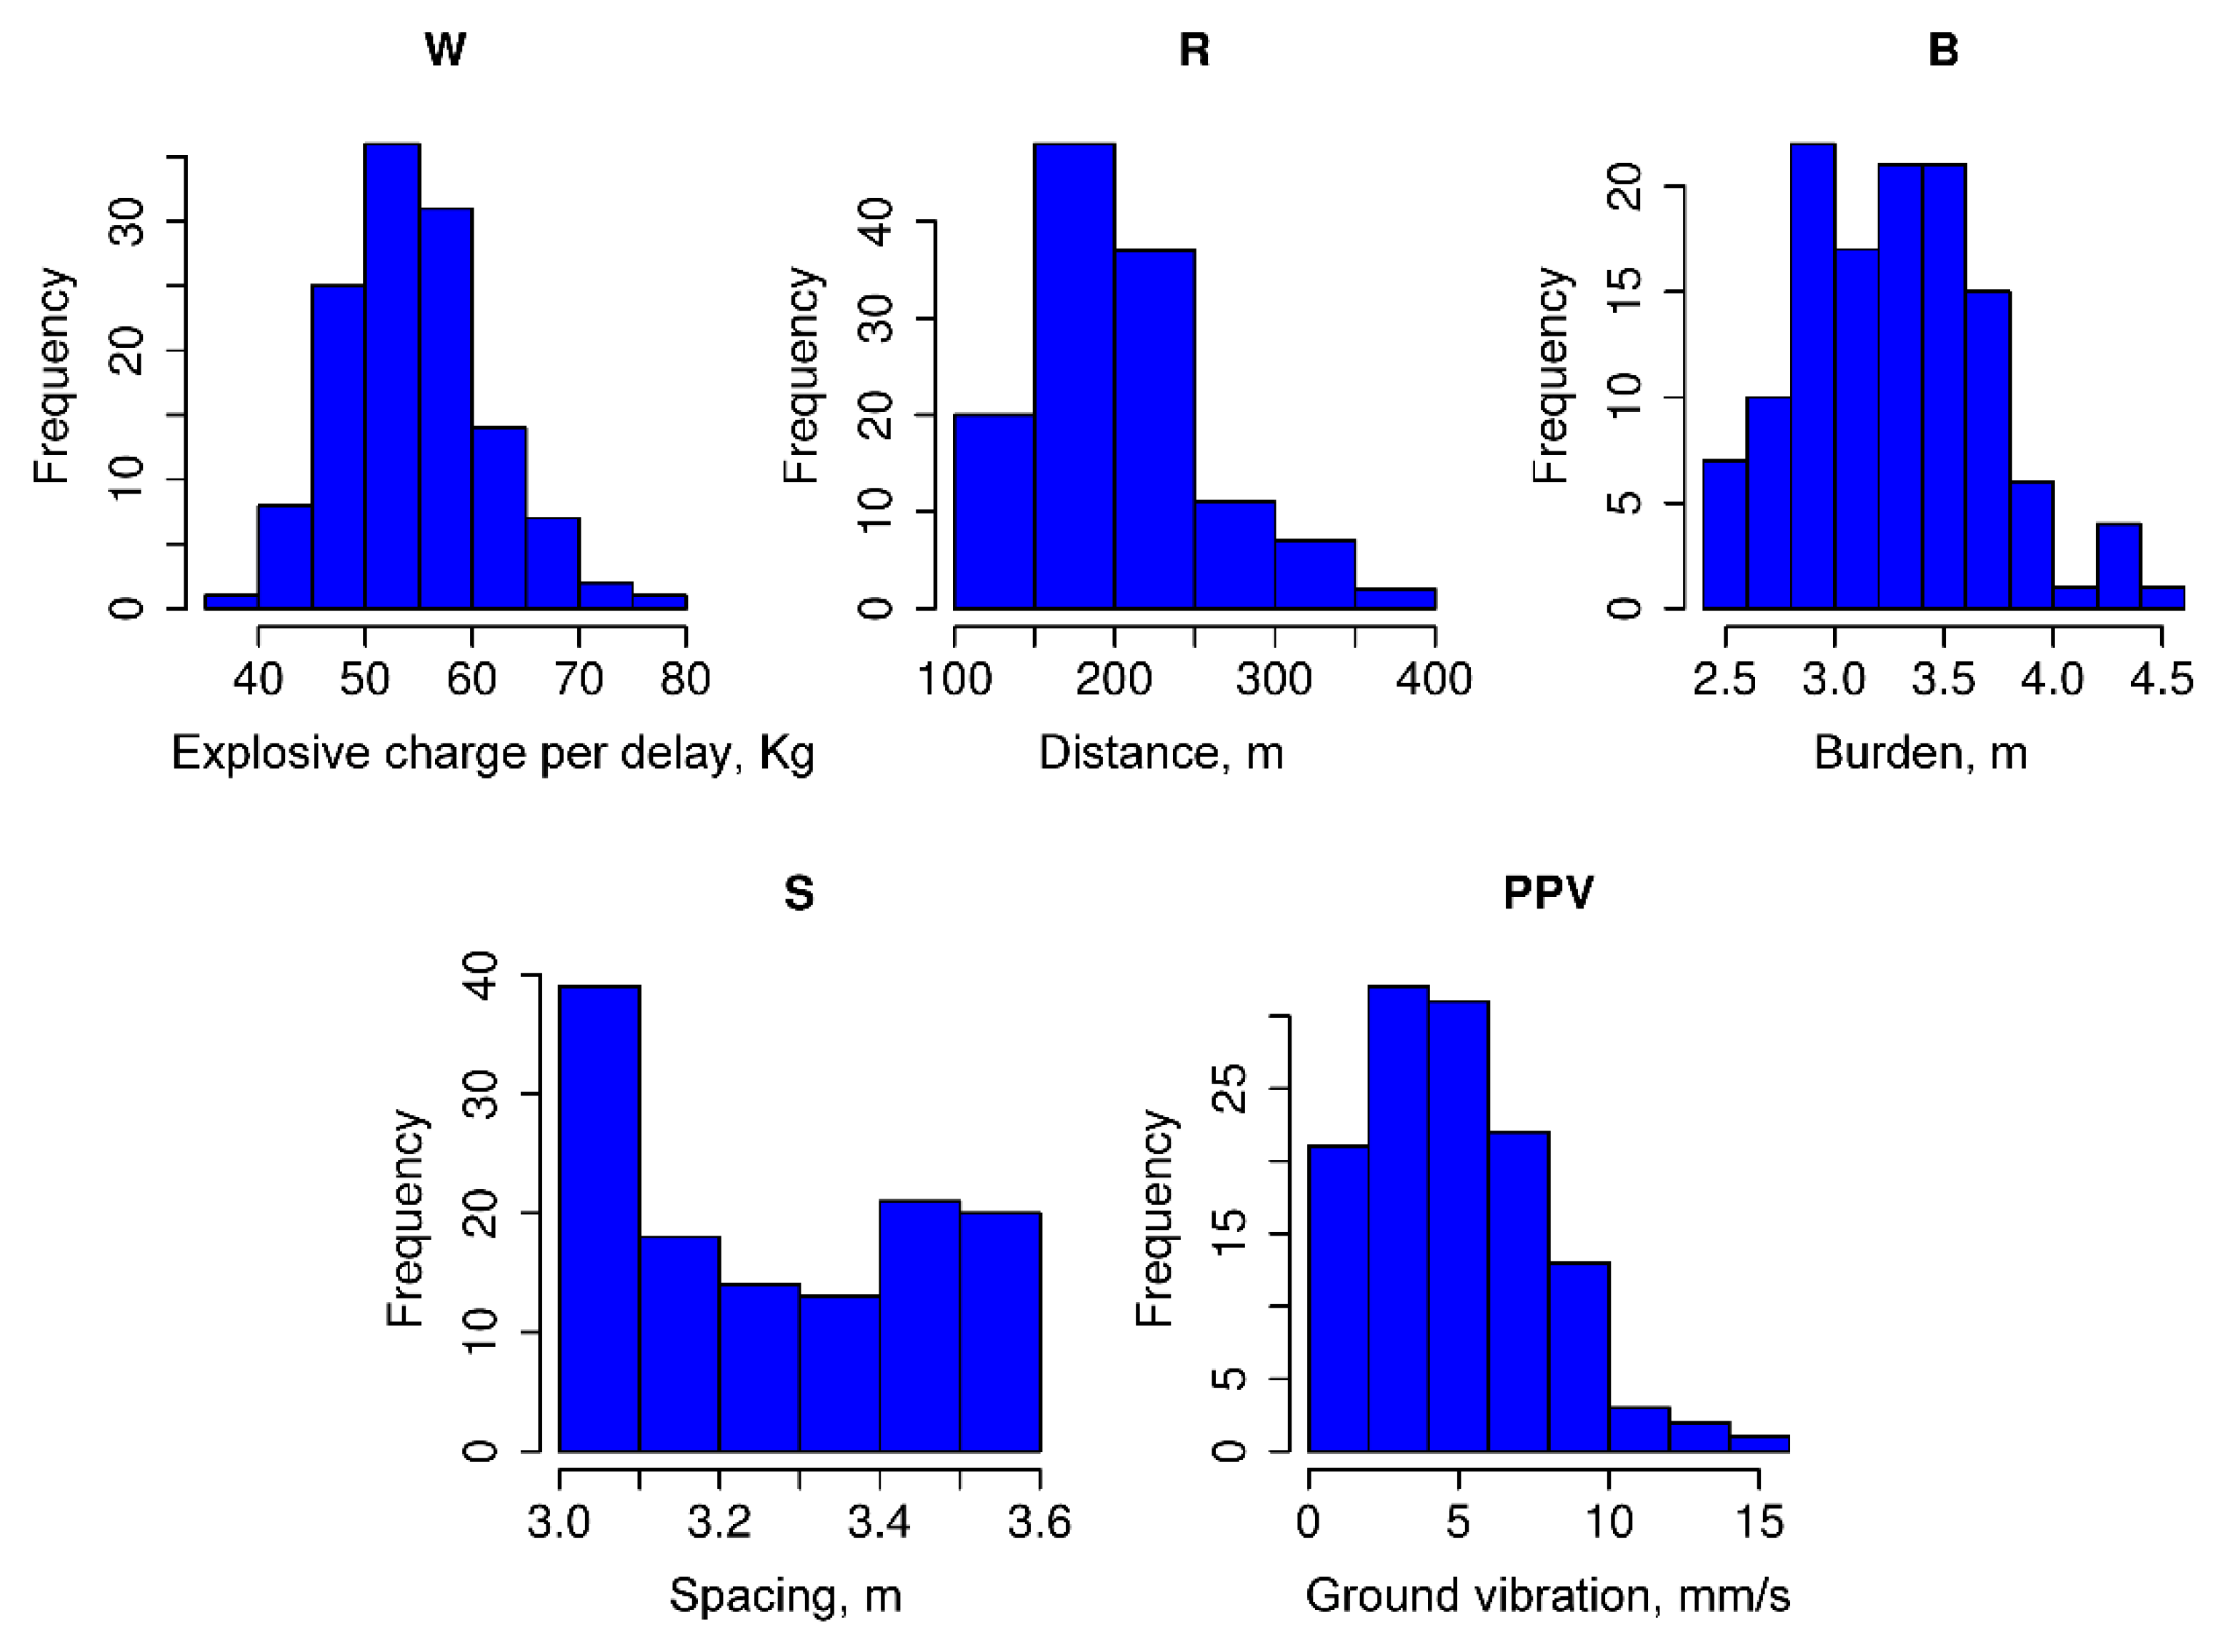
4. Vibration Sensors and Experimental Datasets
5. Results and Discussion
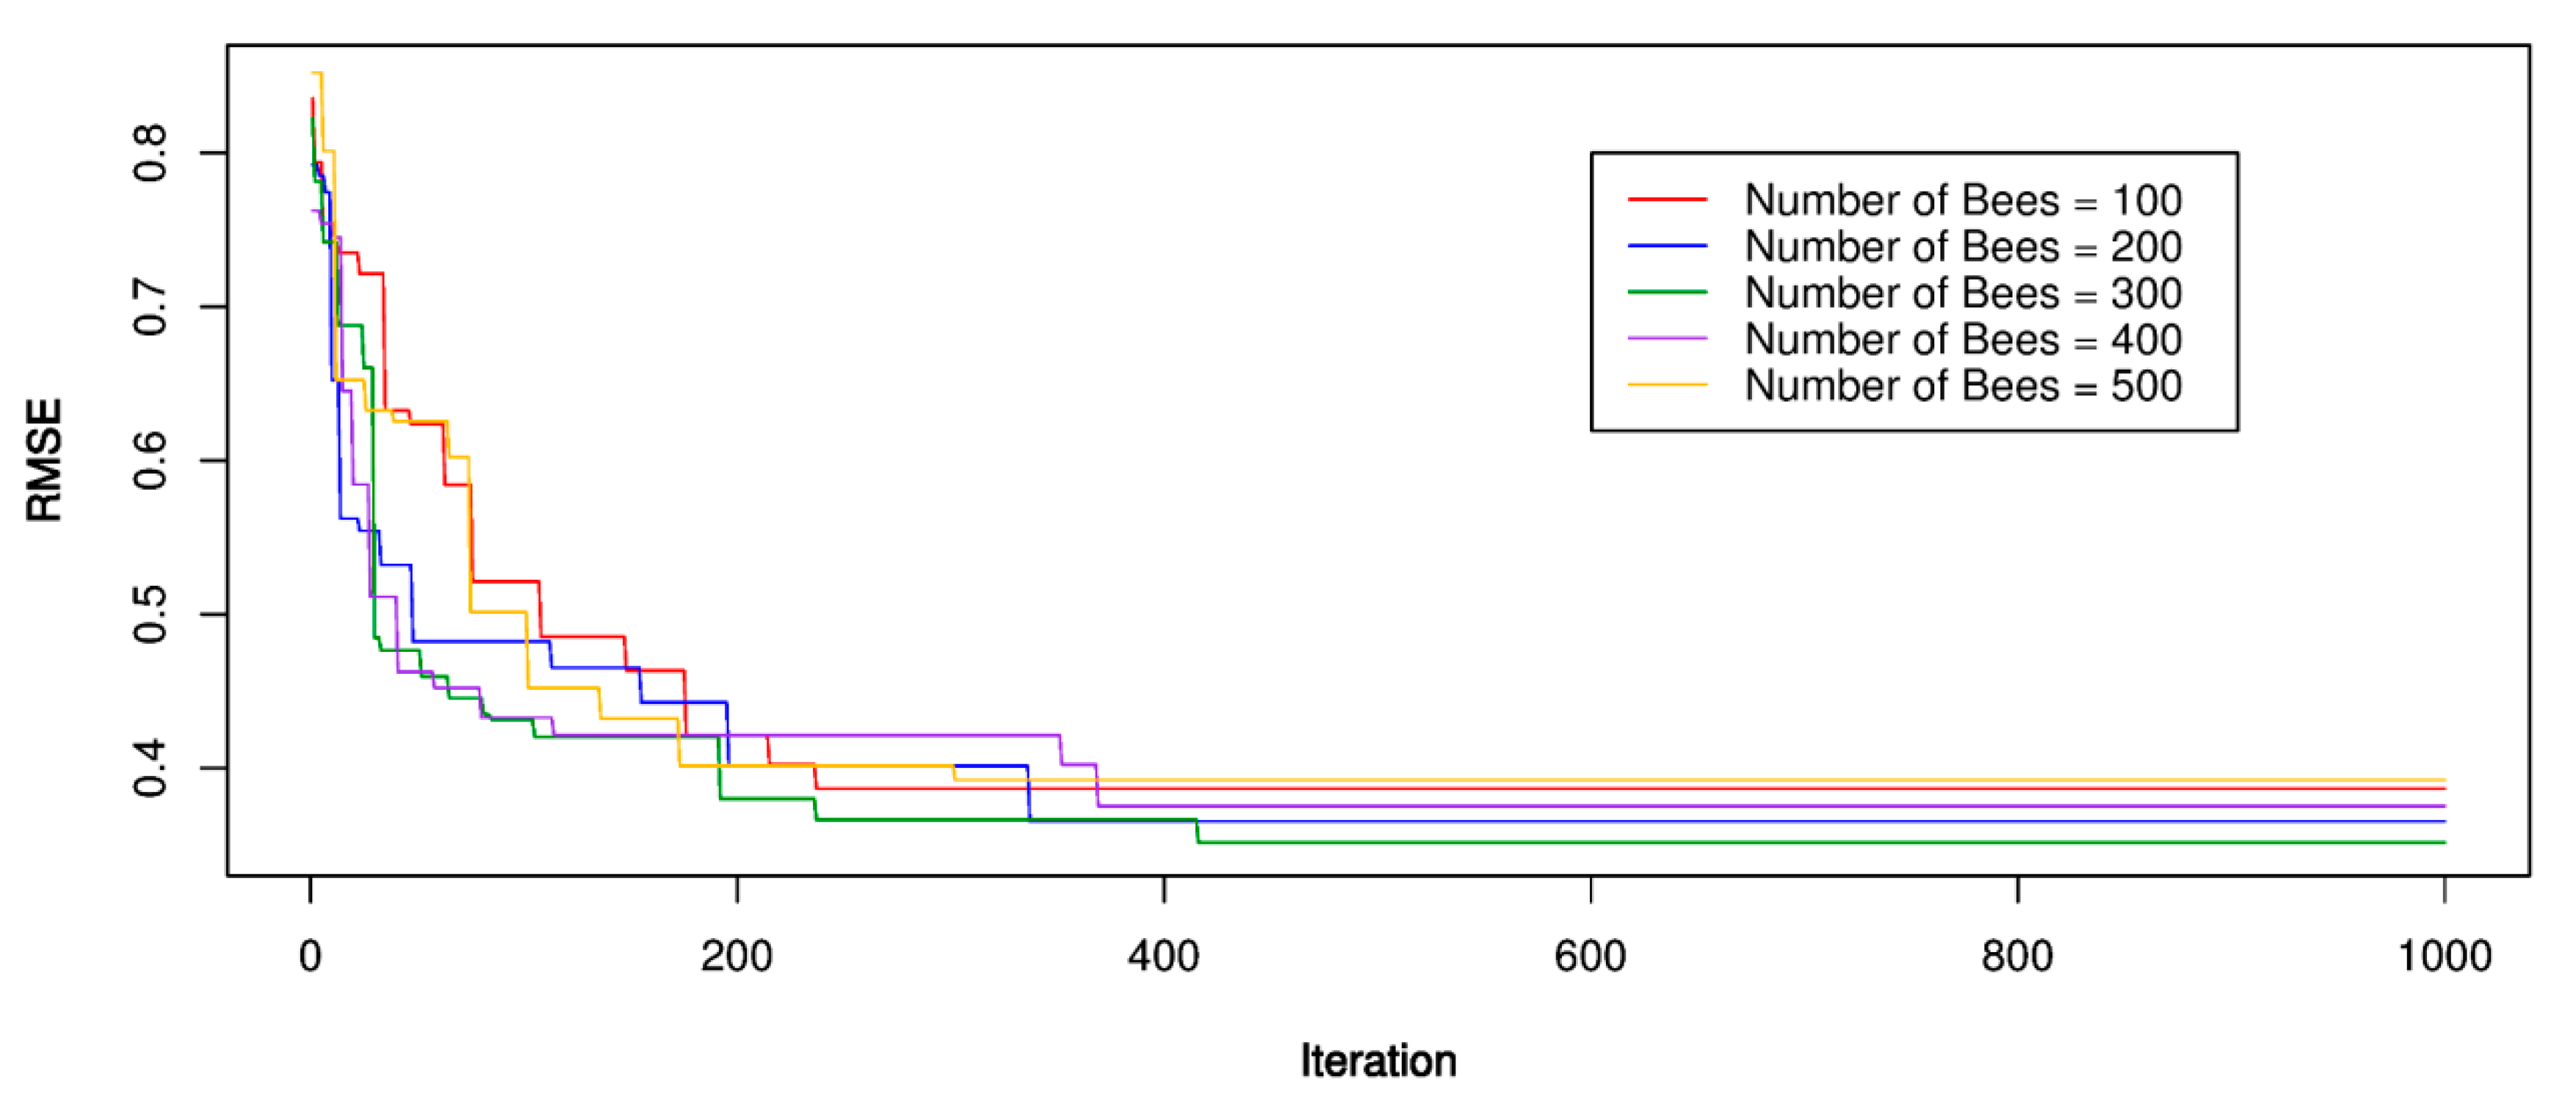
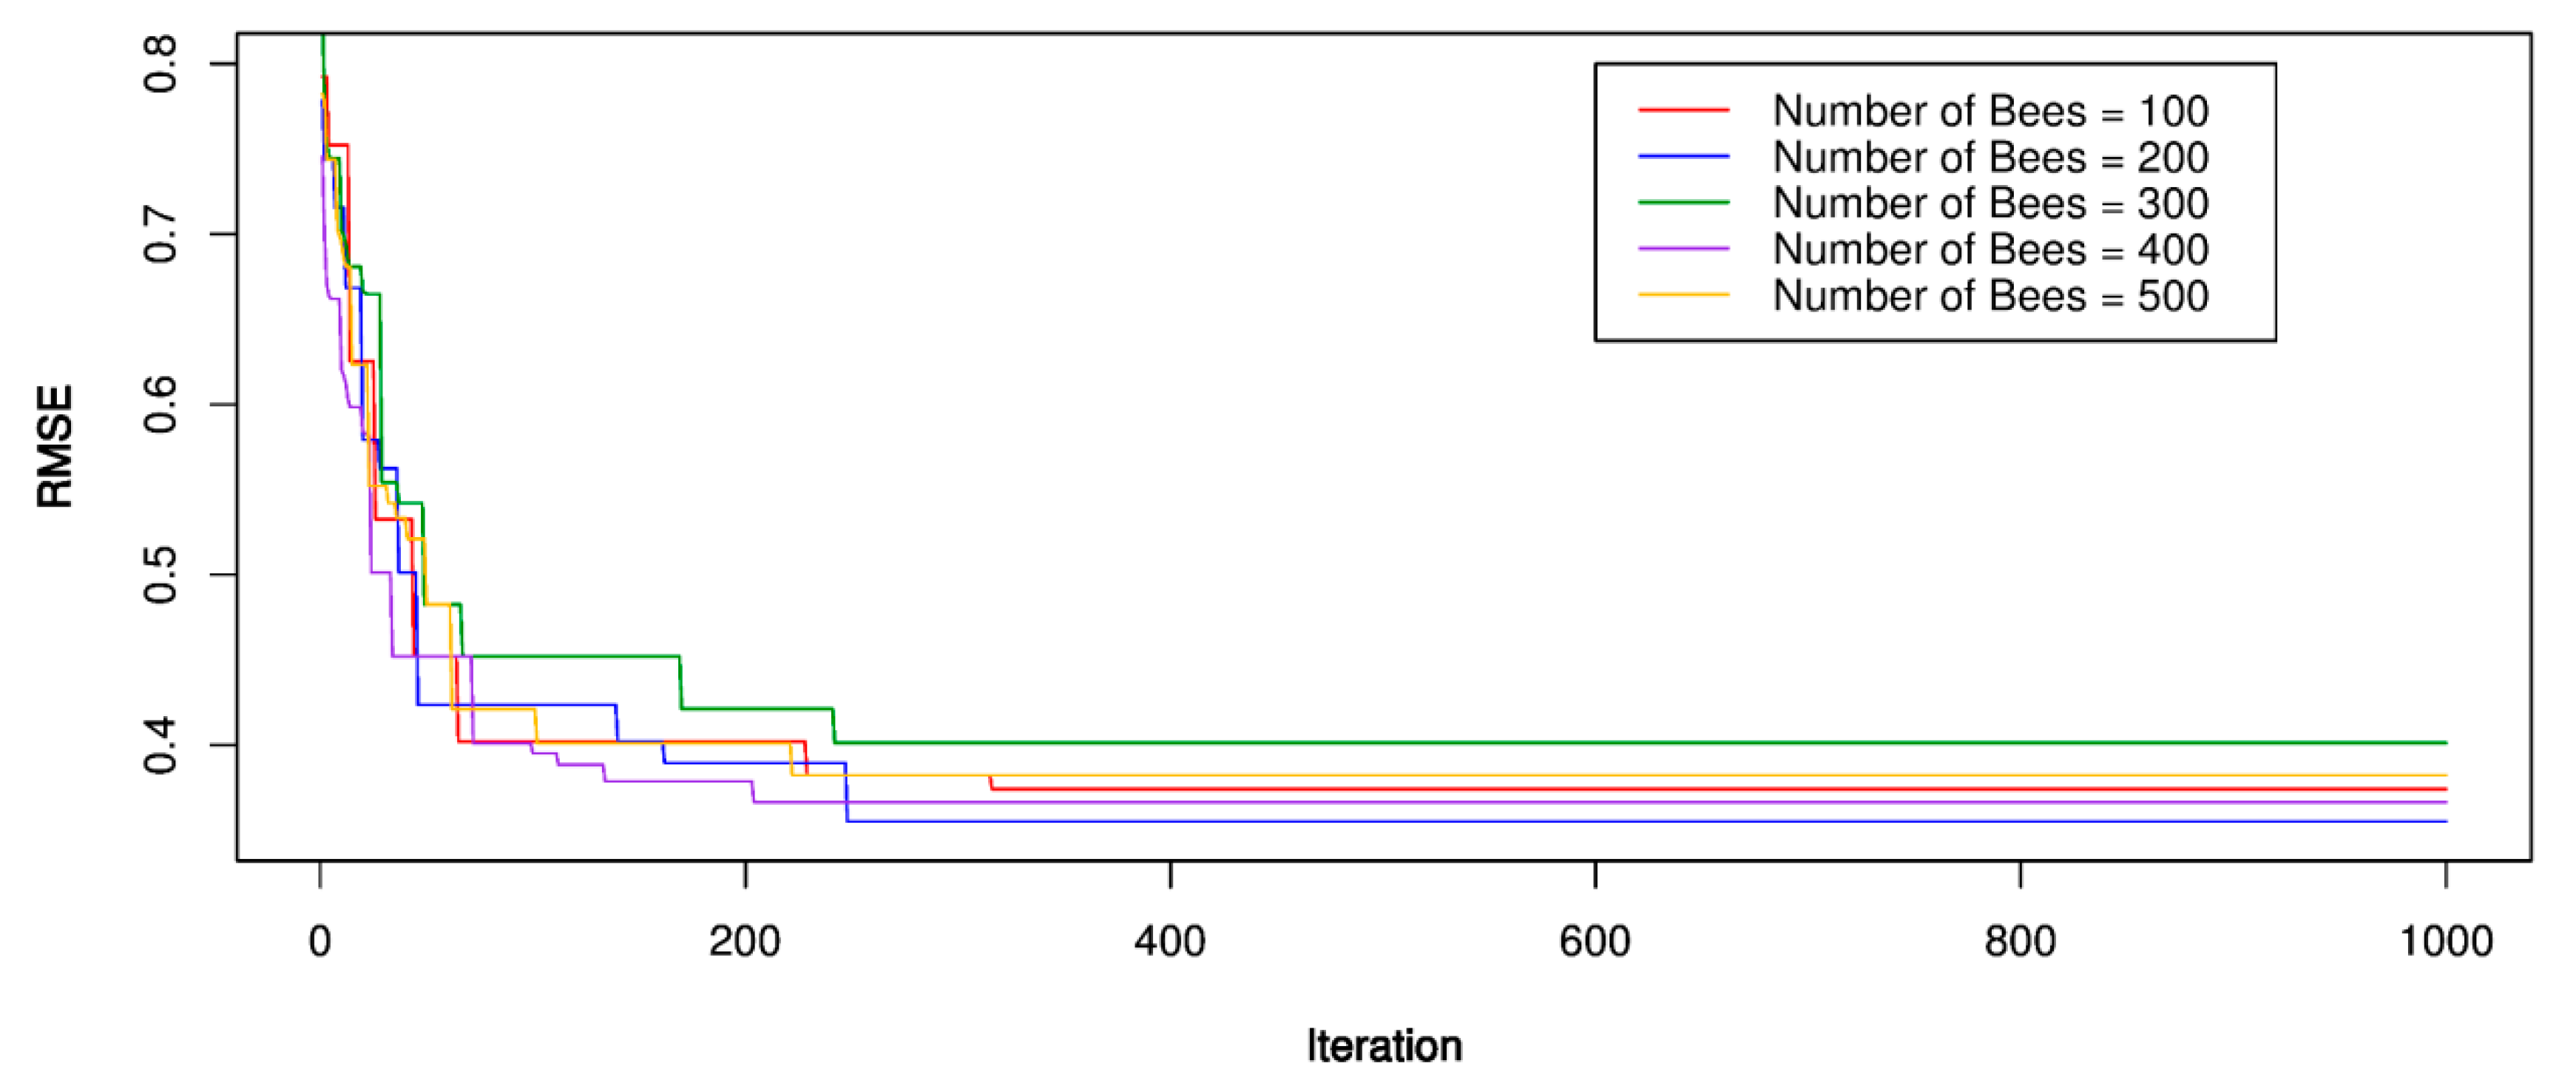
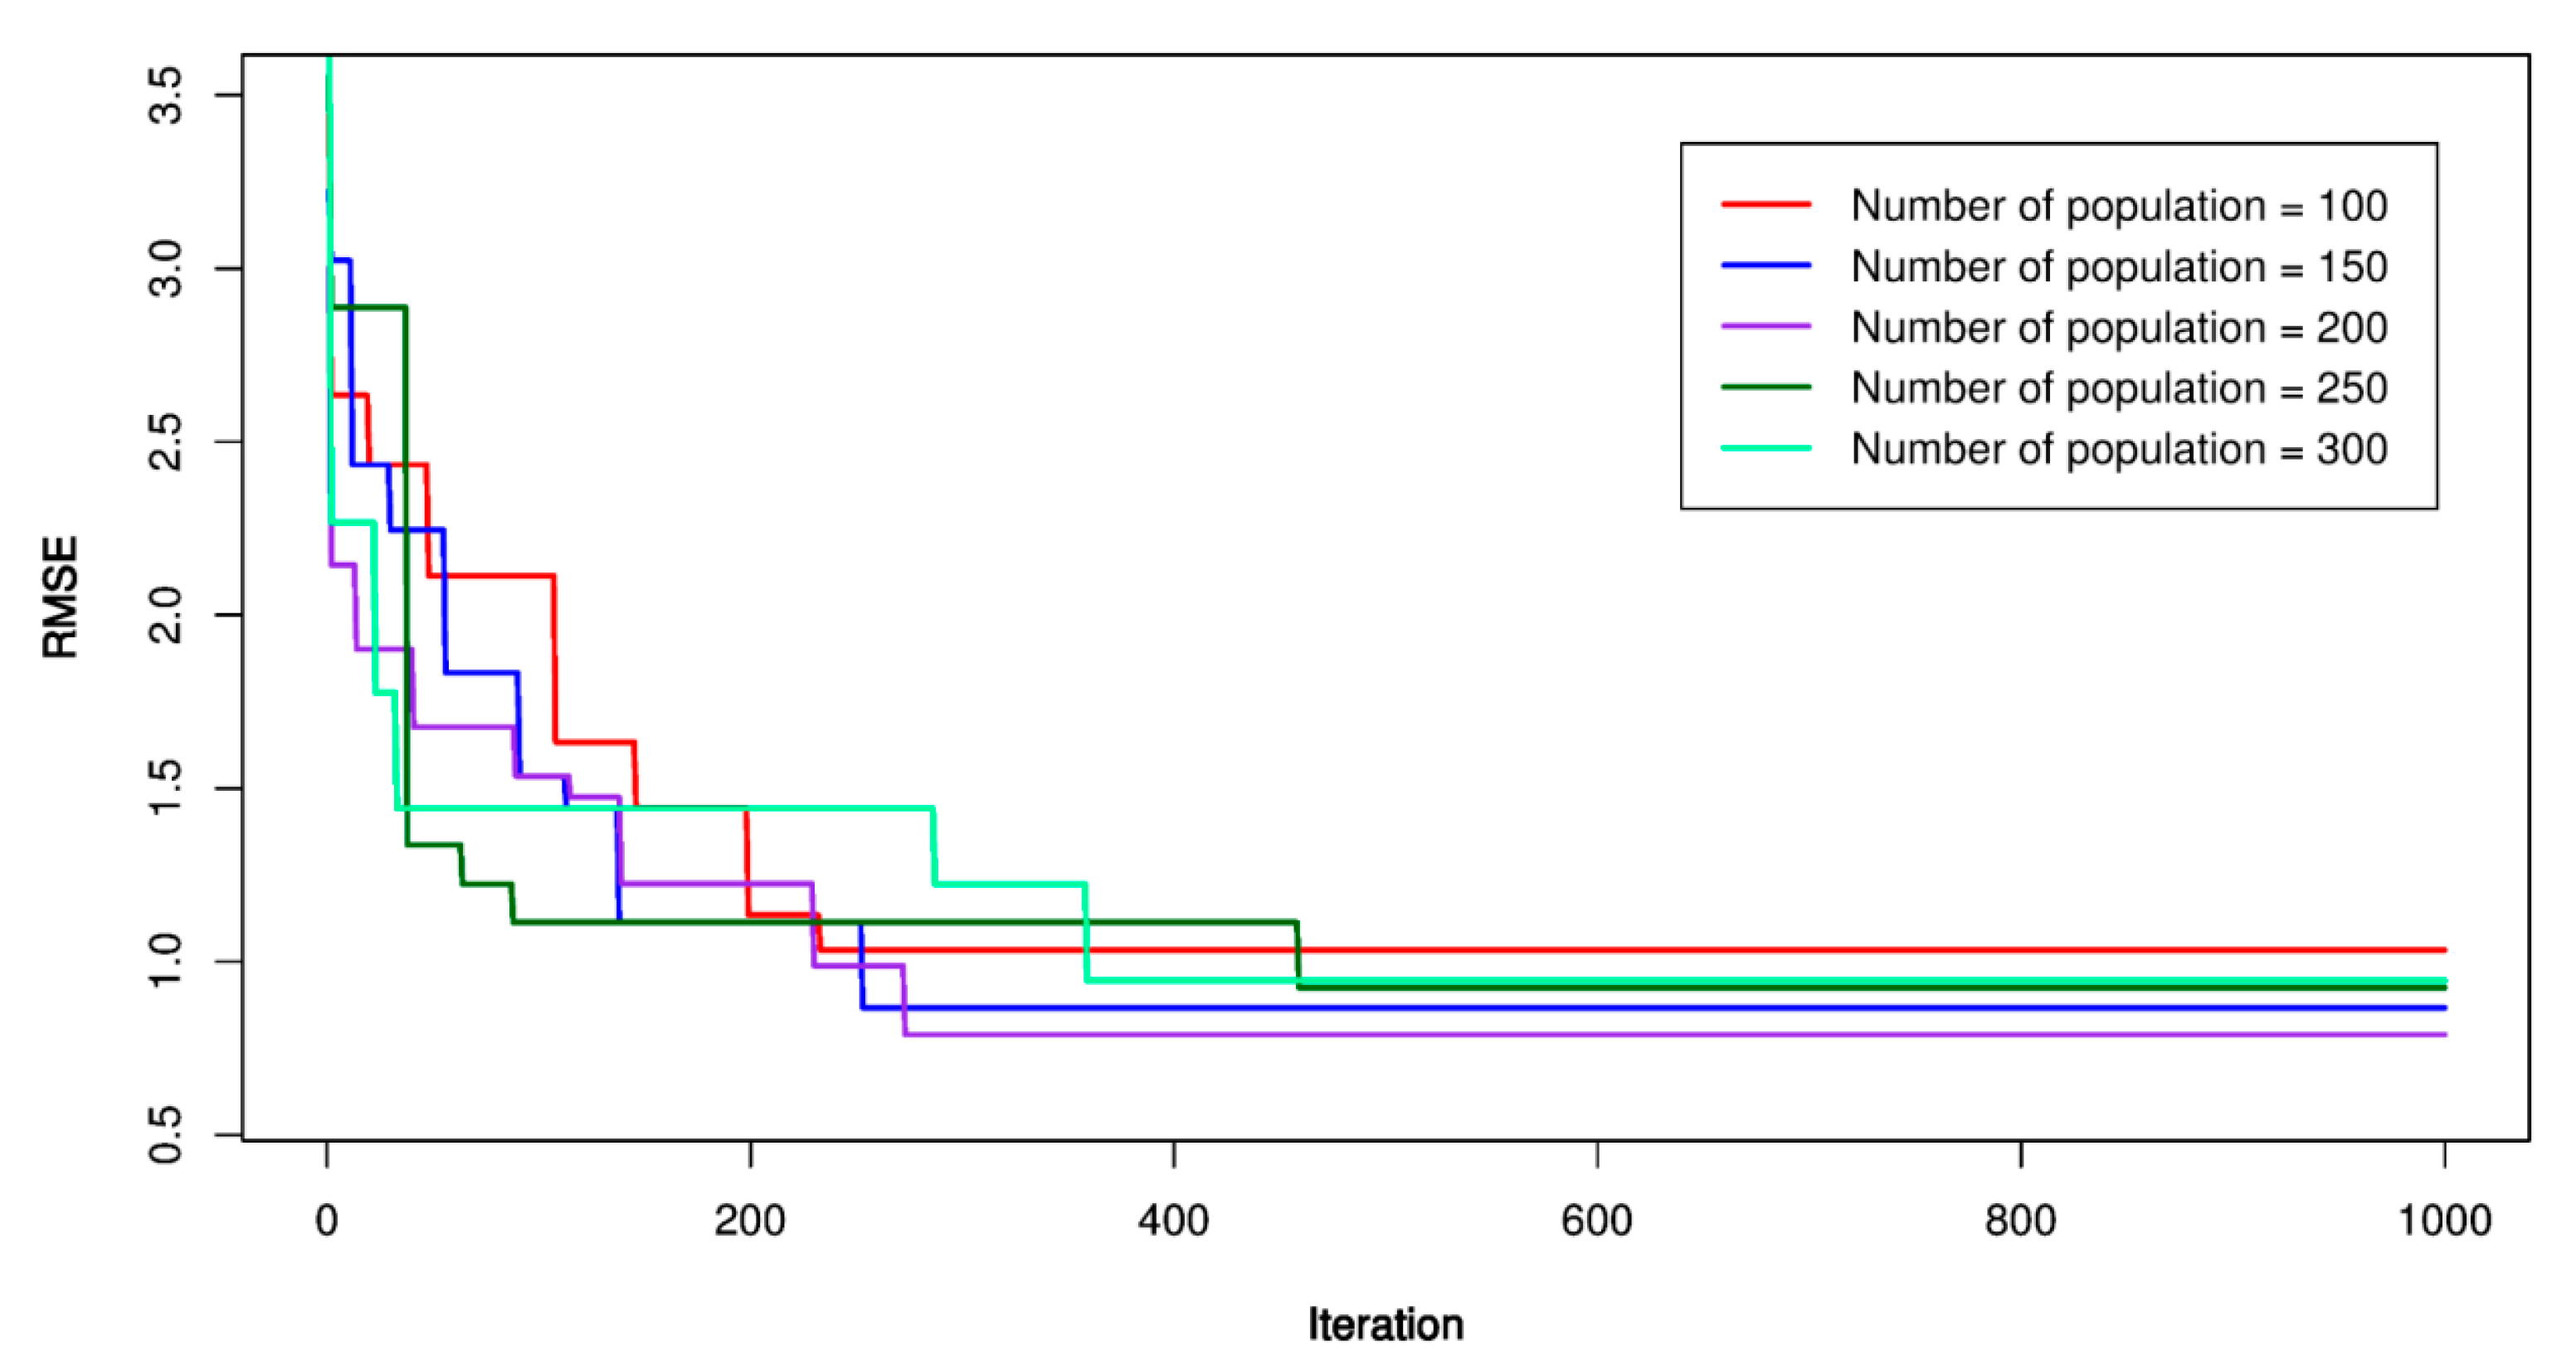
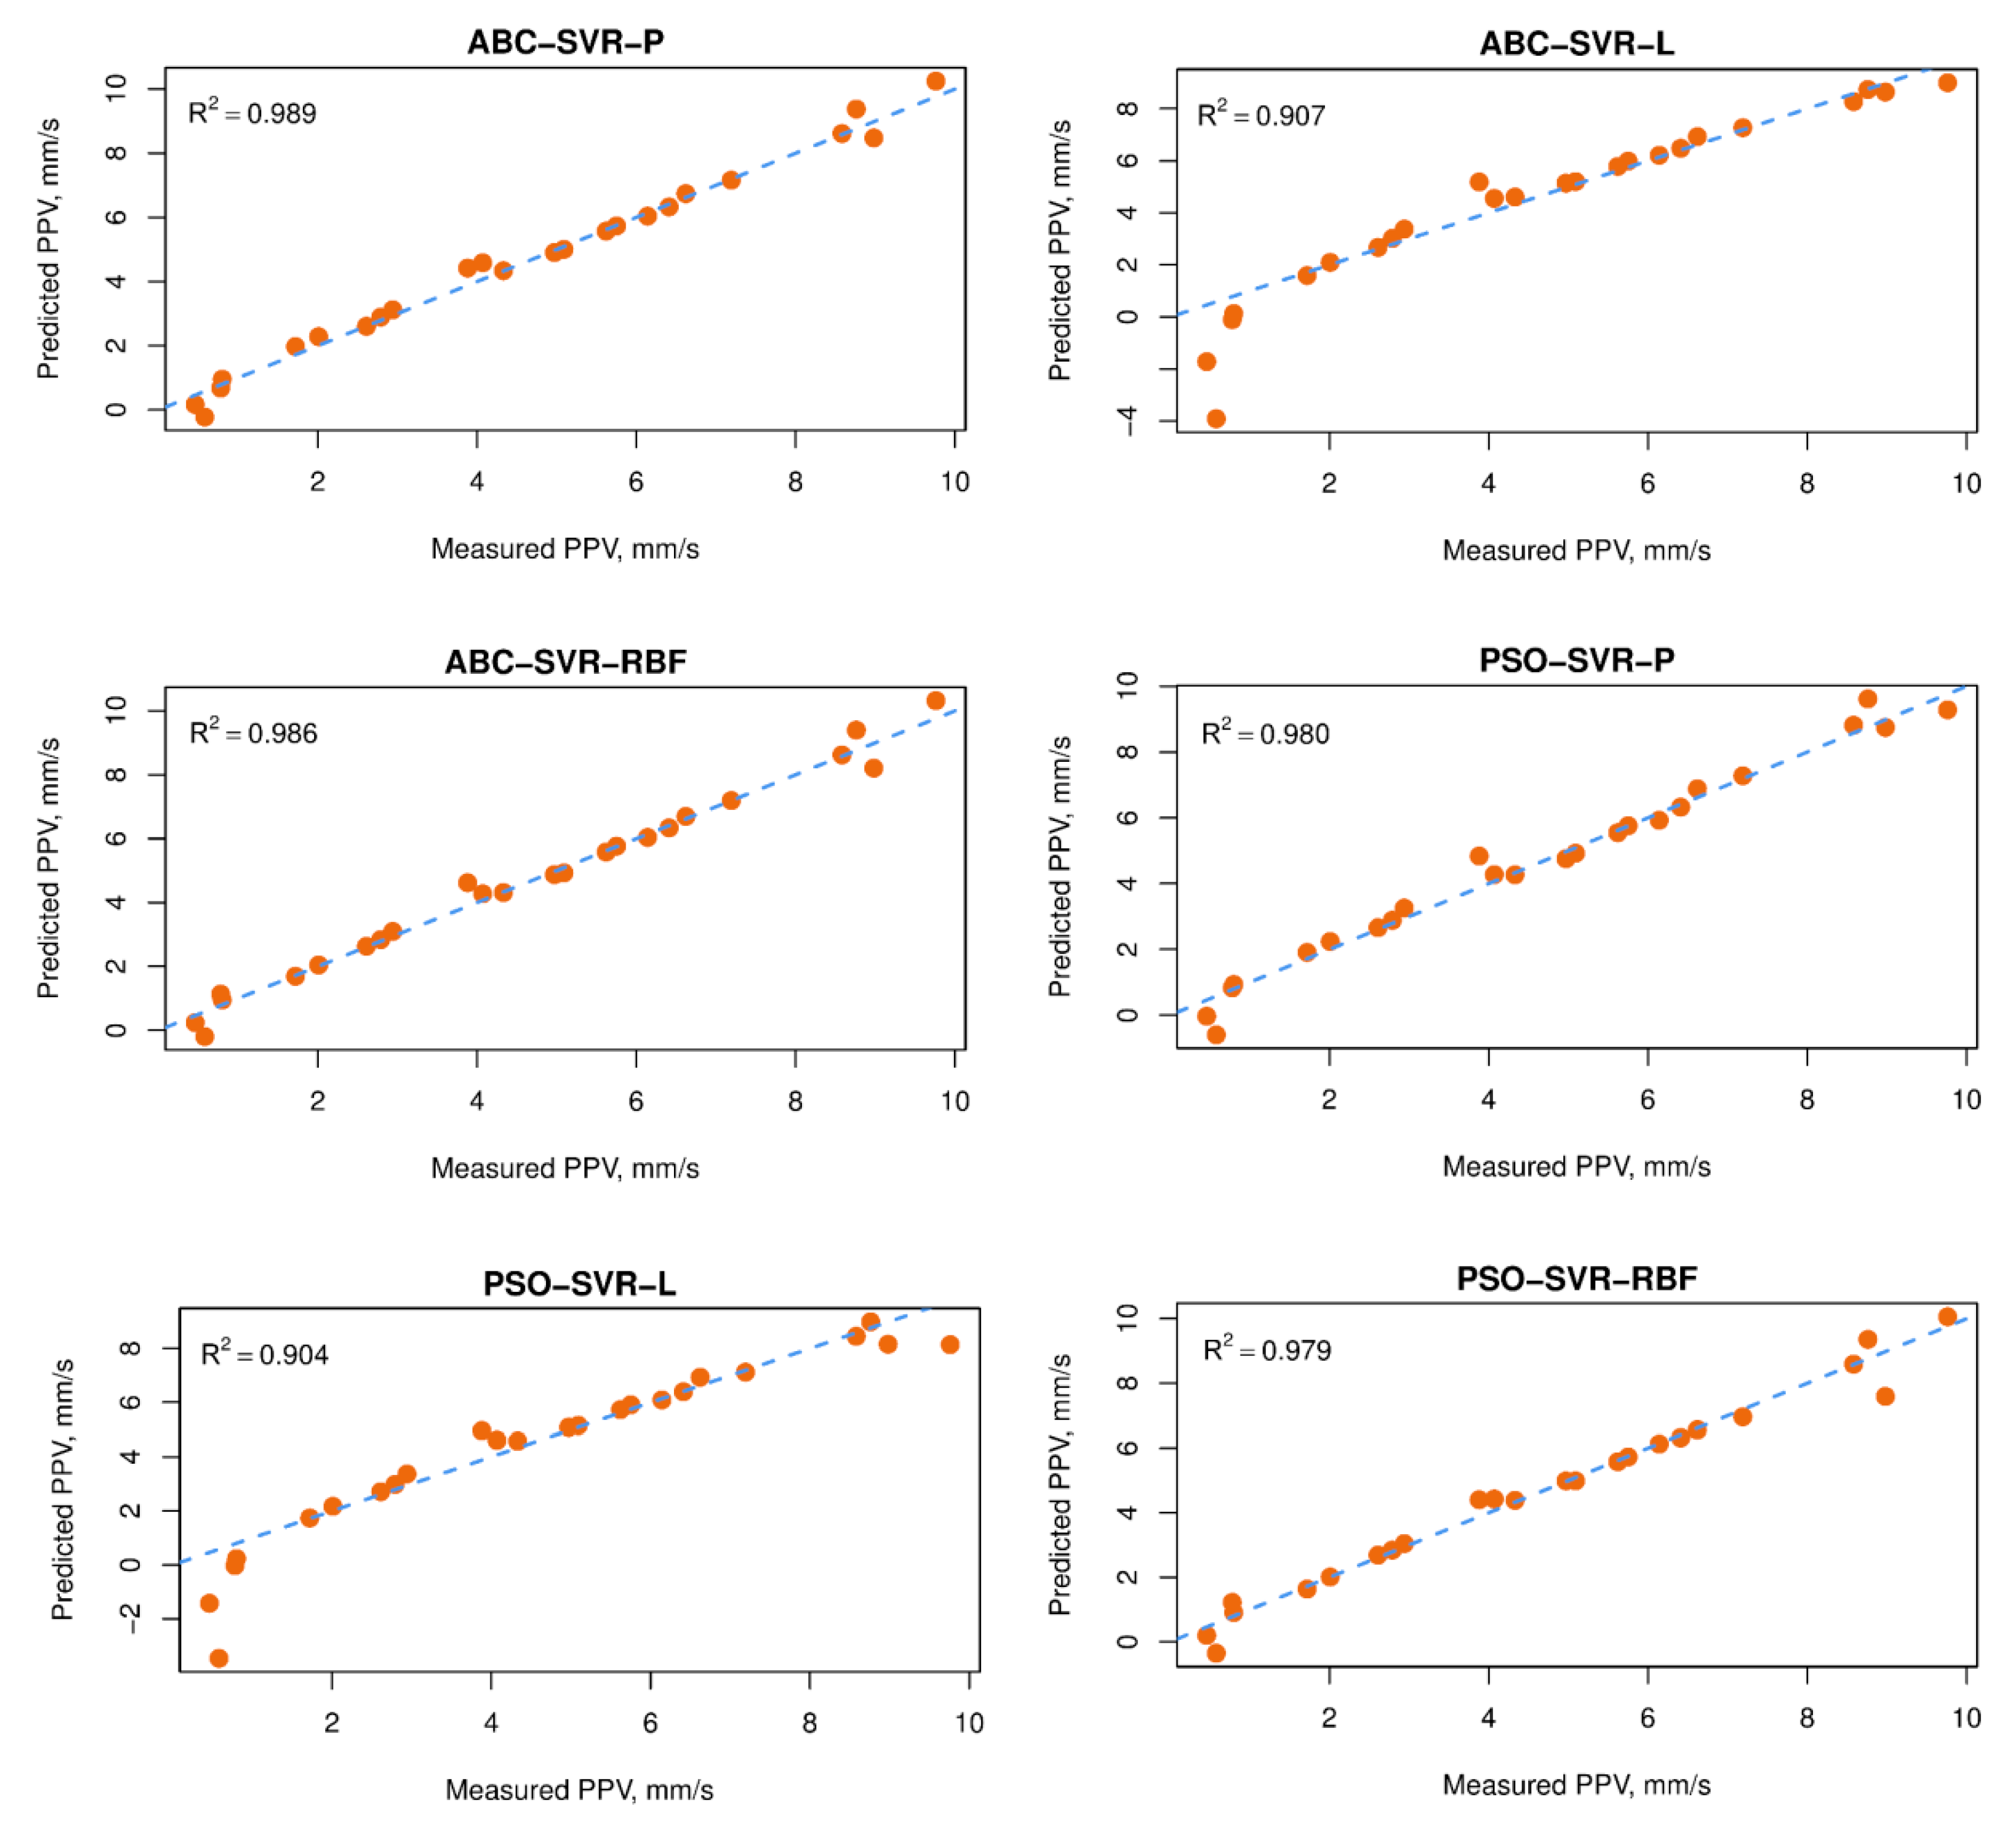
5.1. ABC-SVR Models
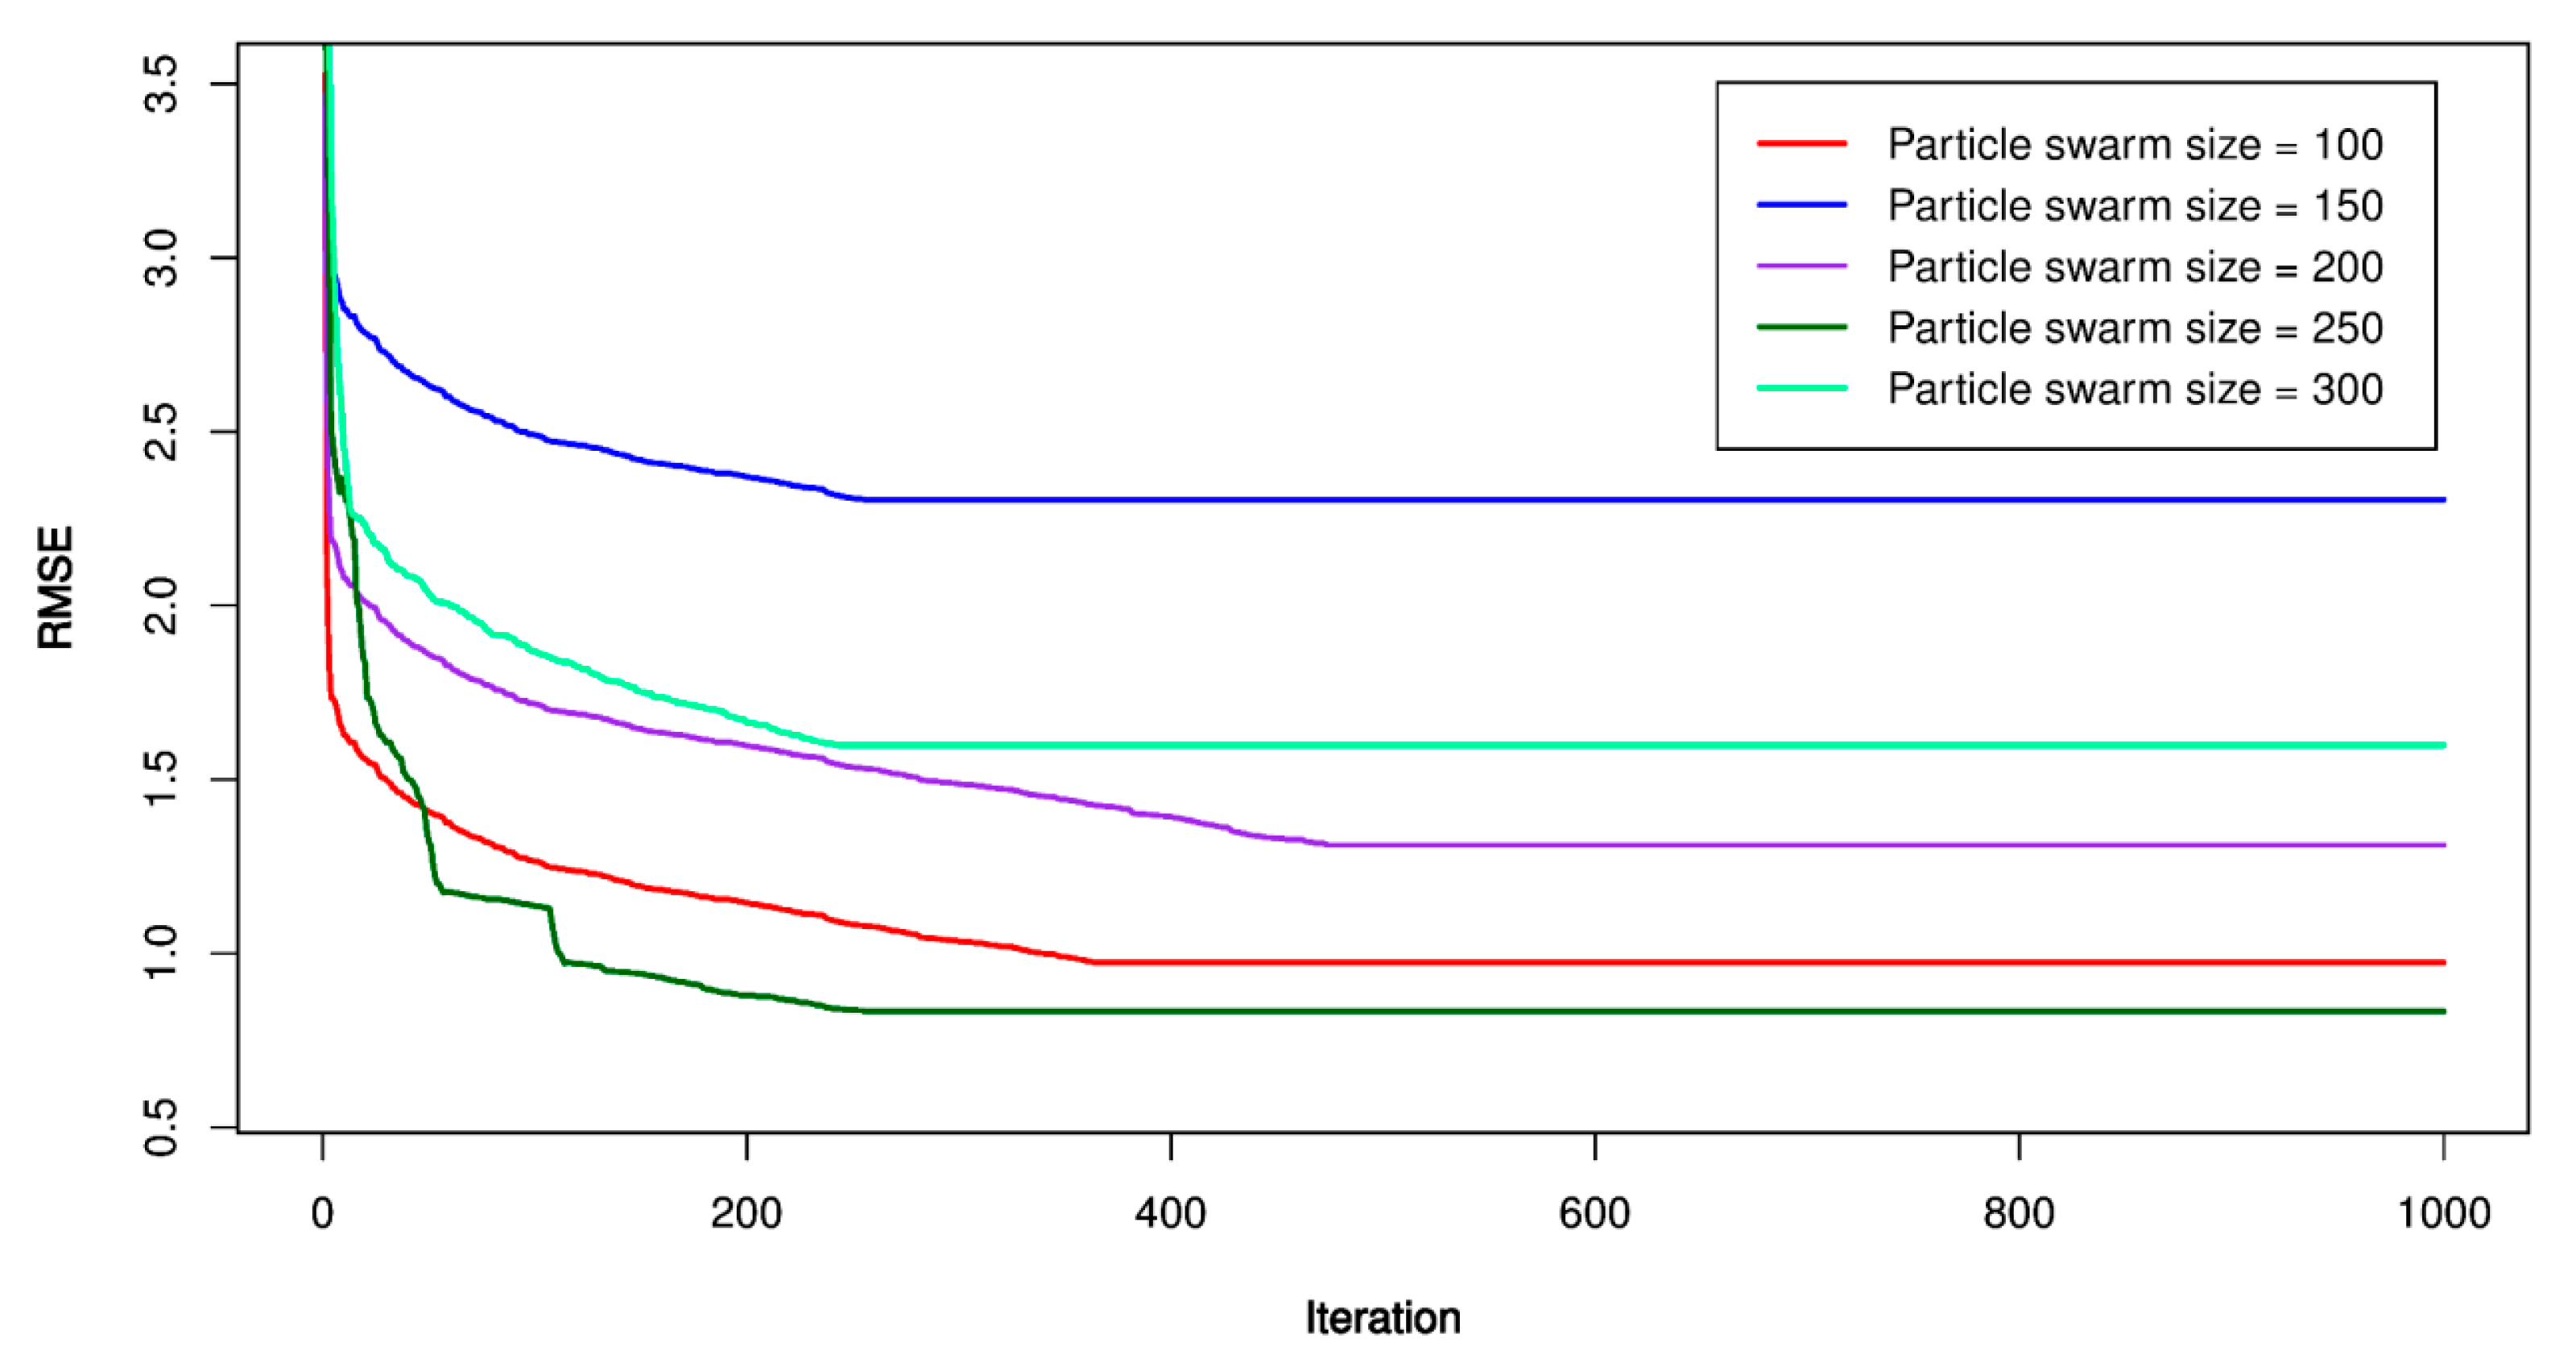
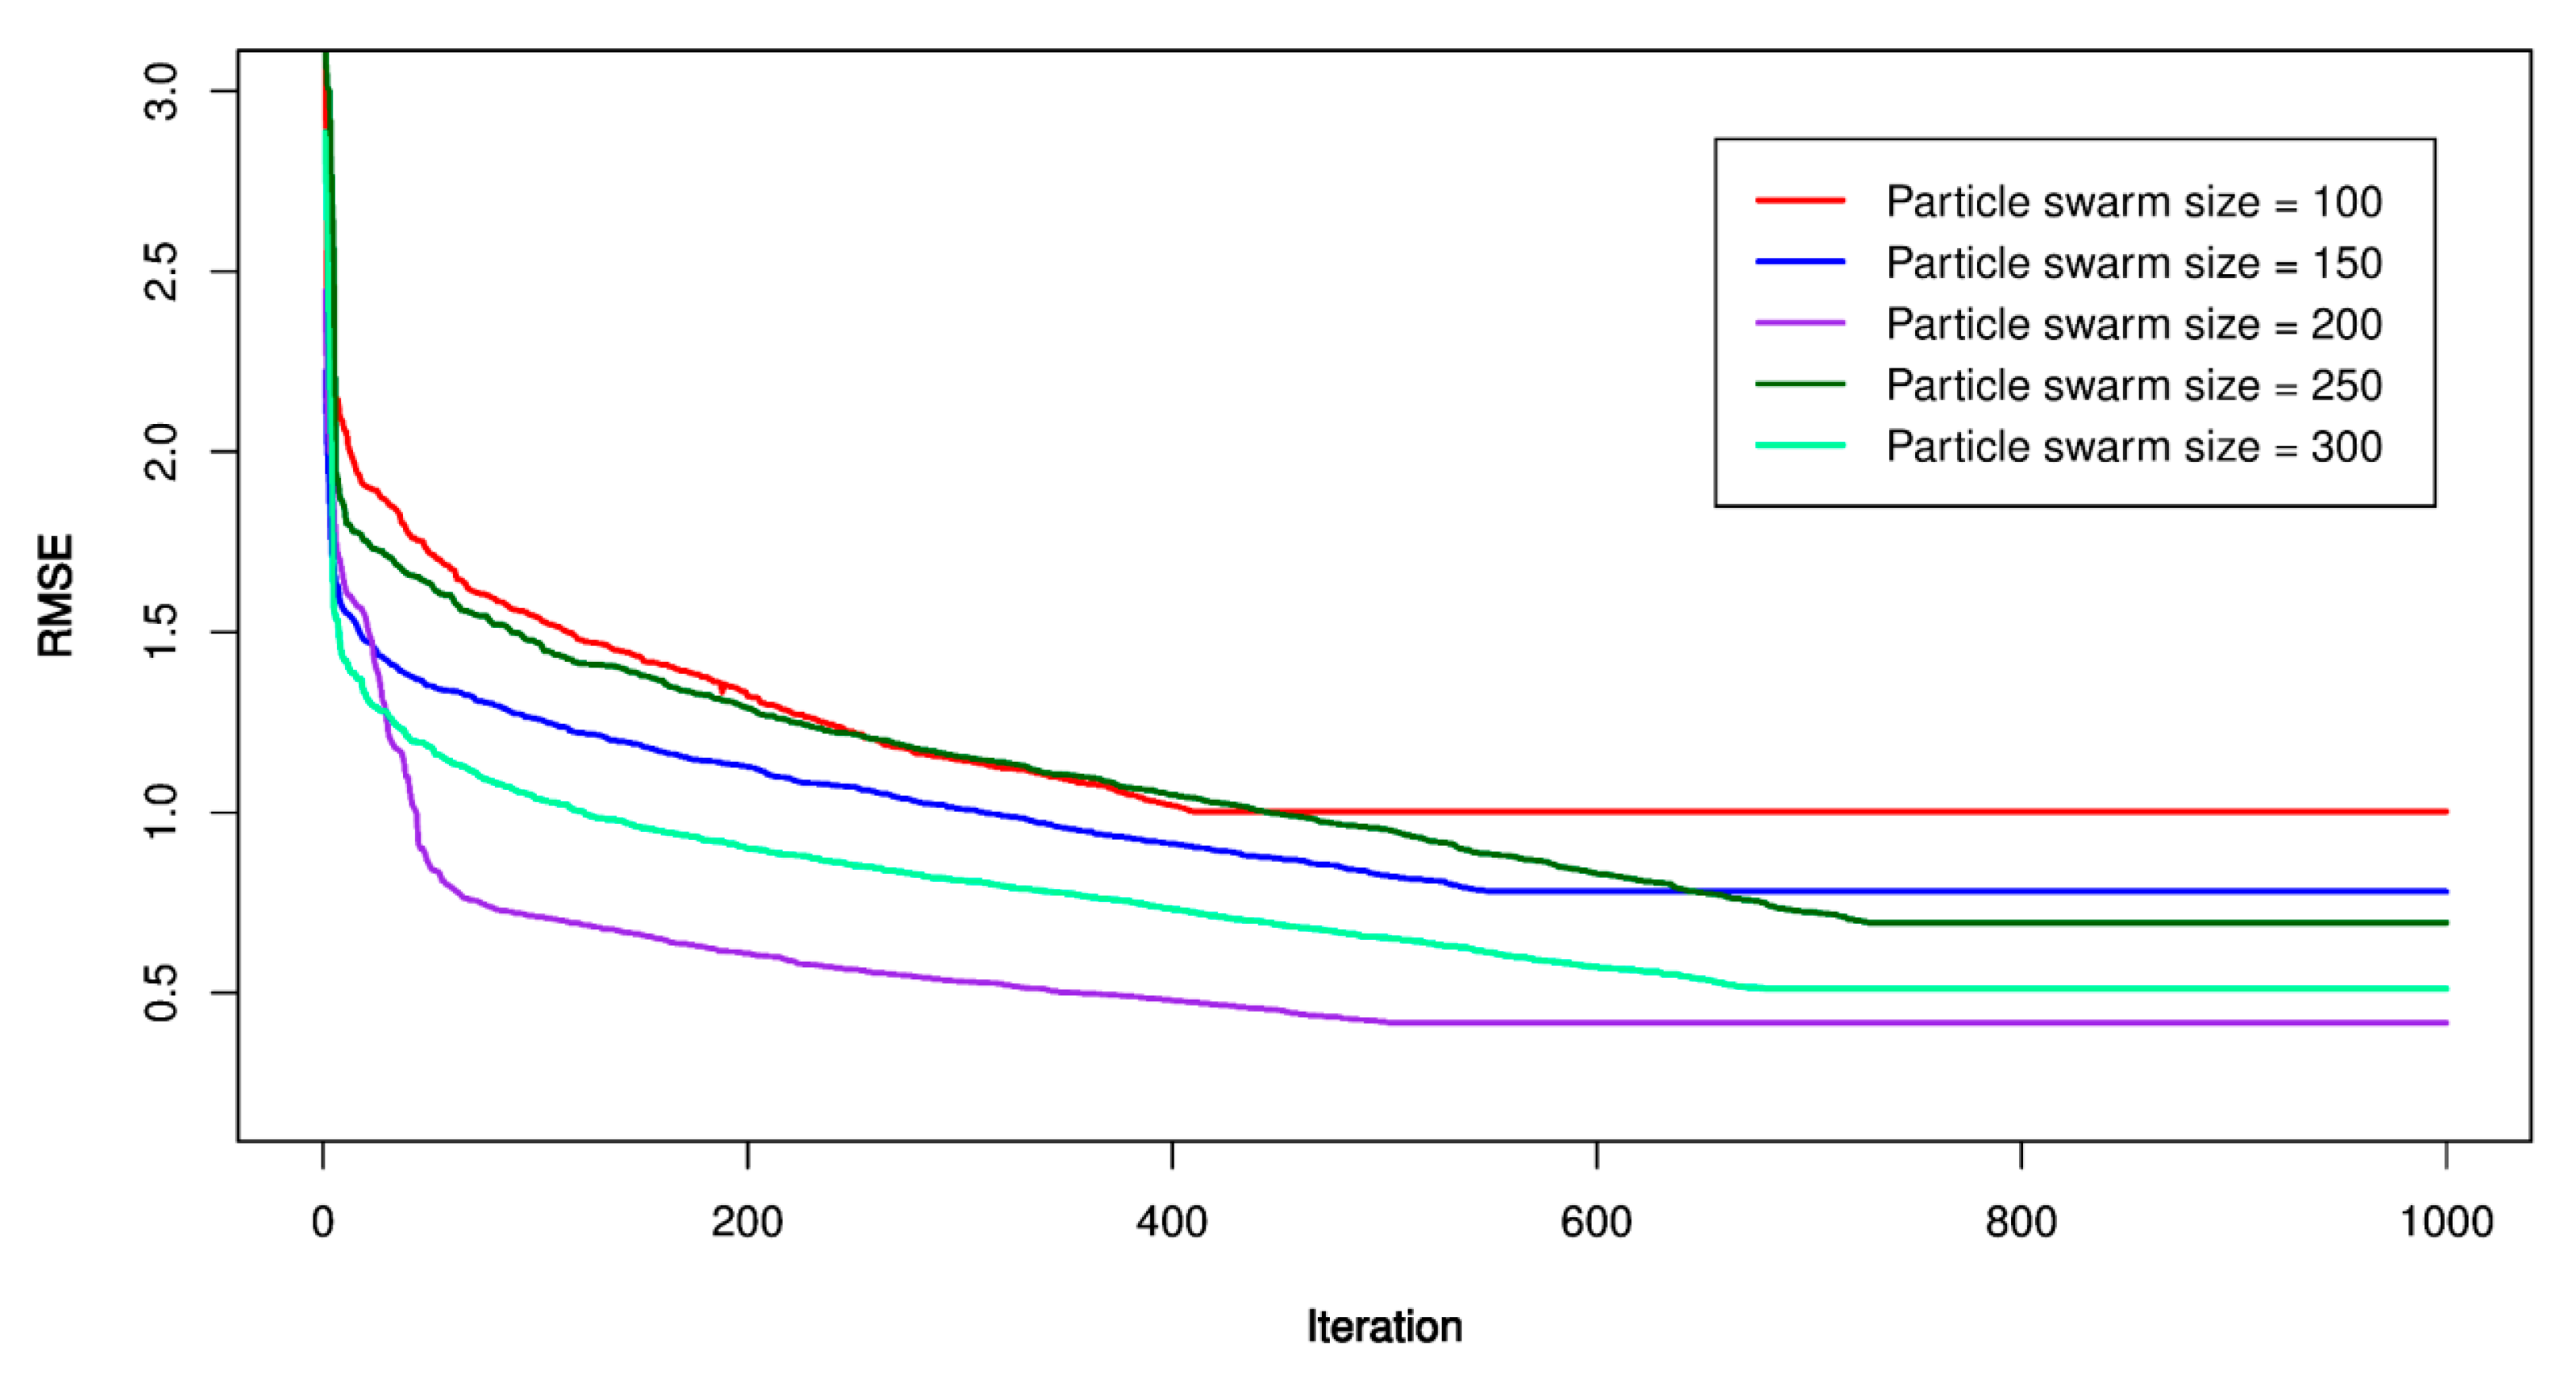
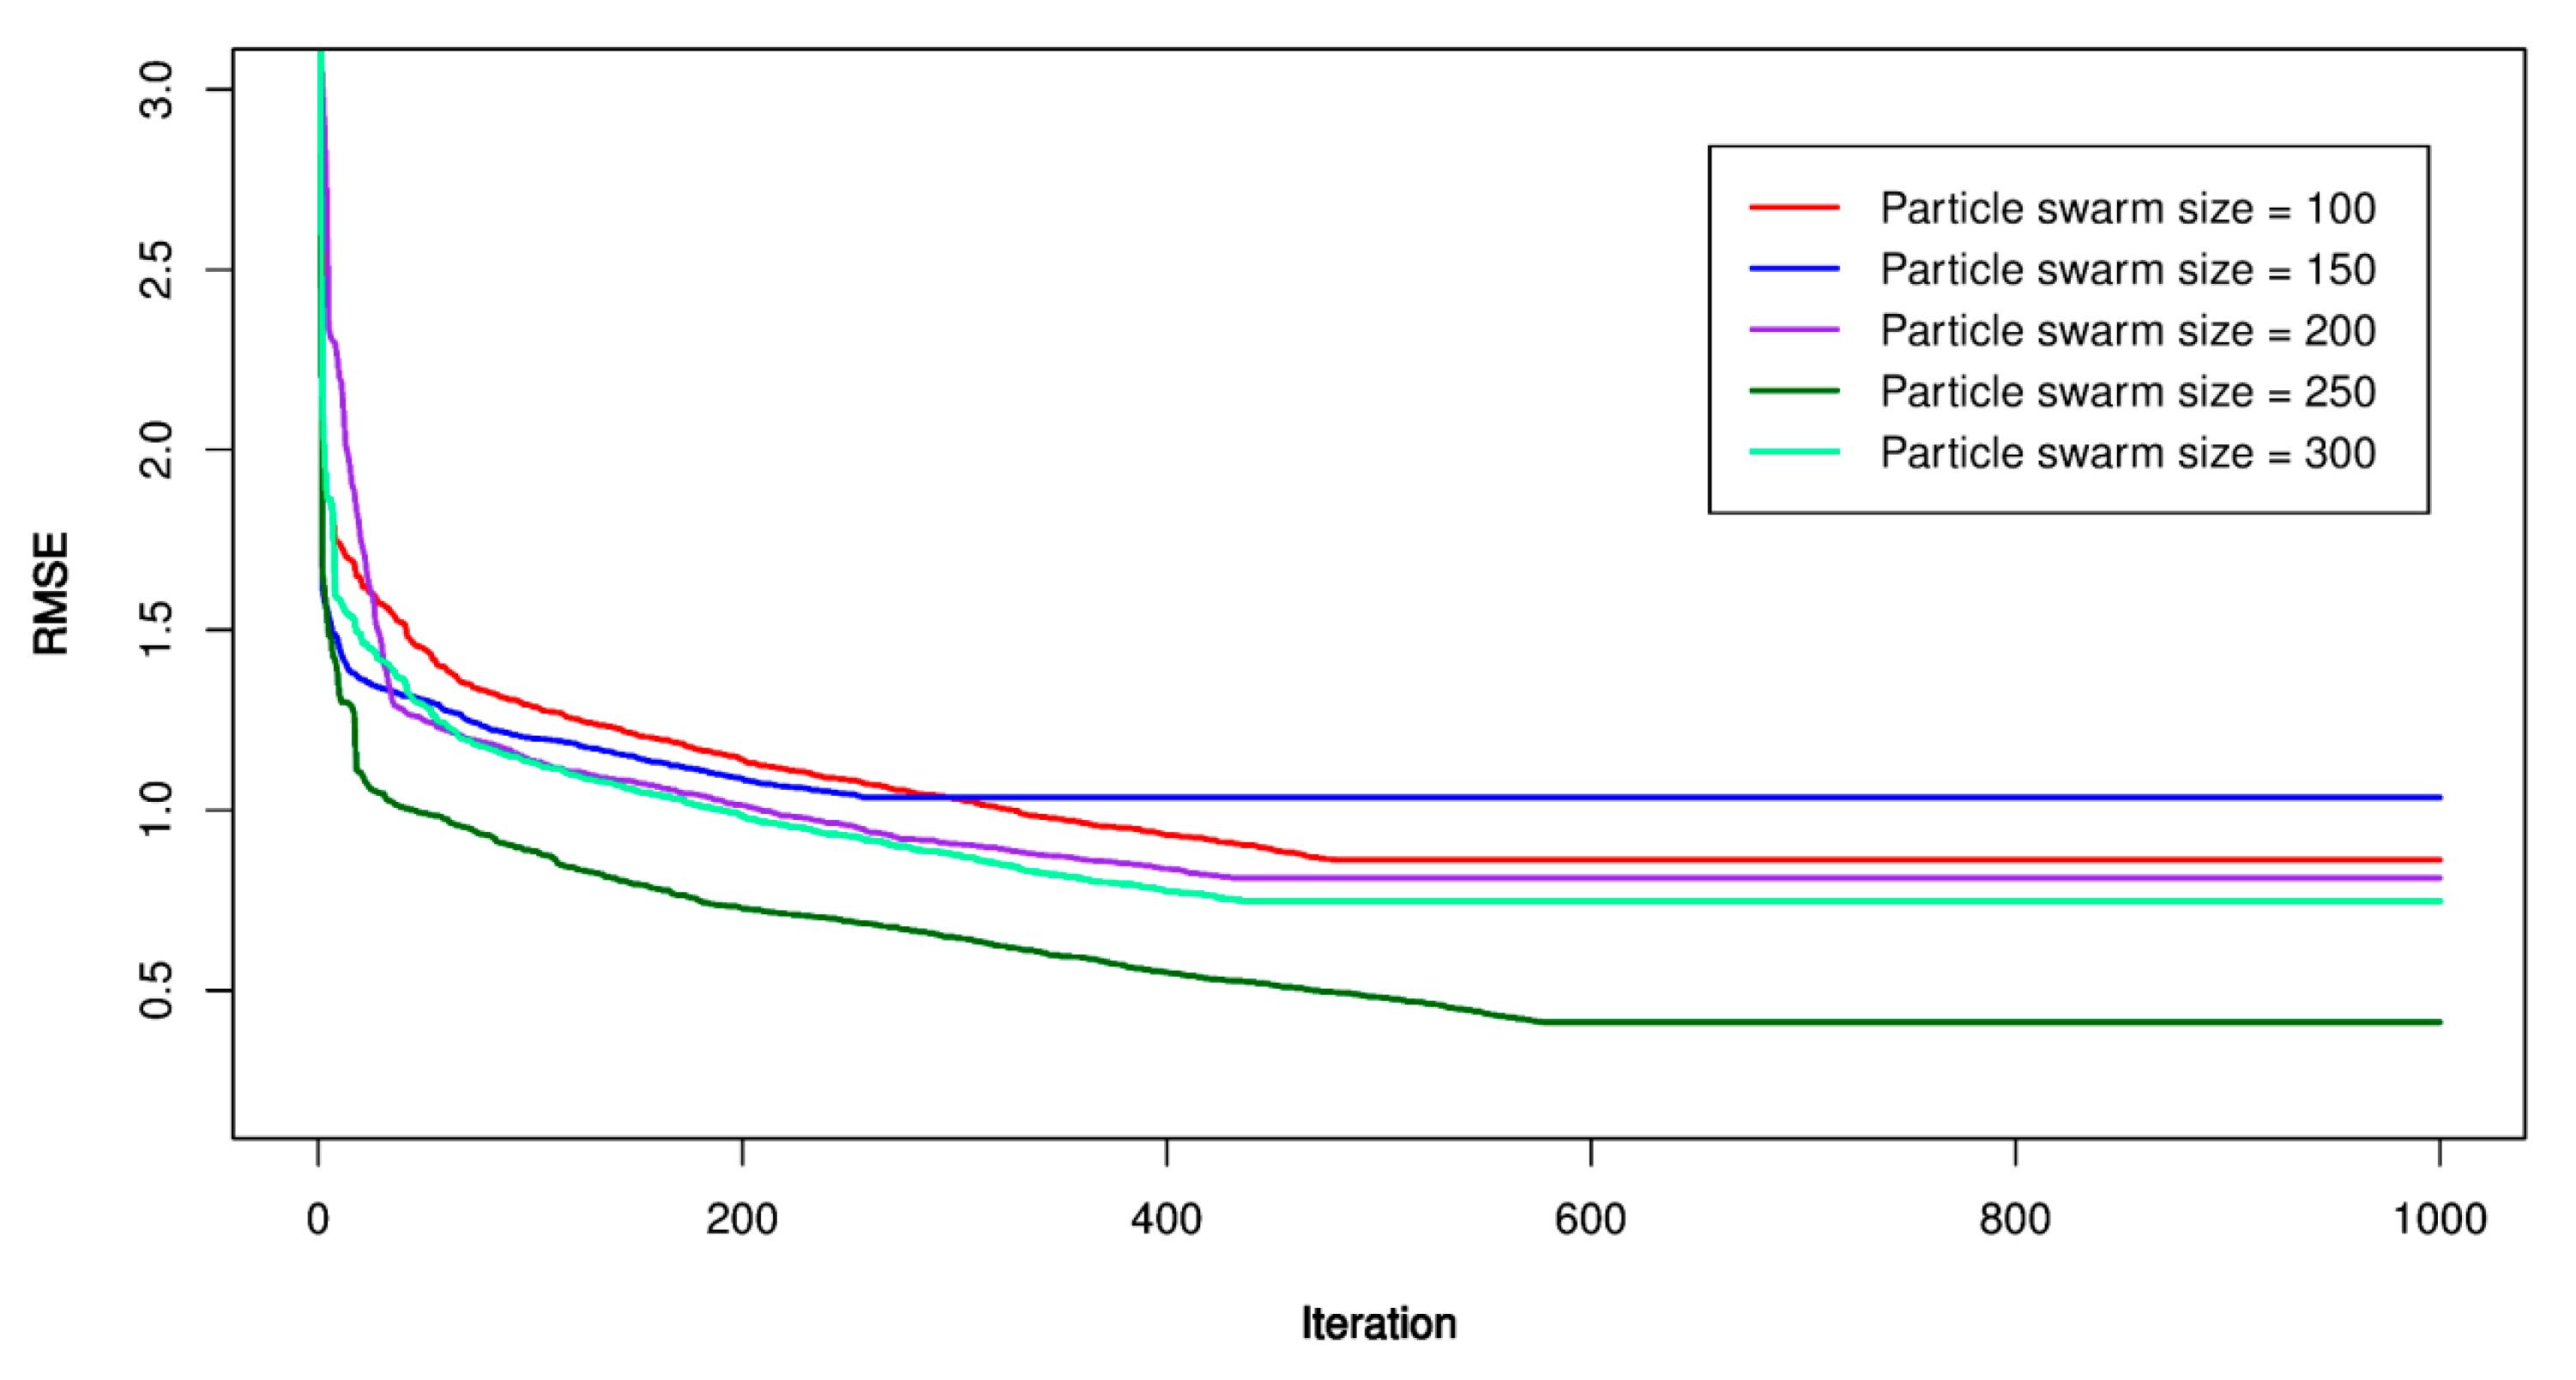
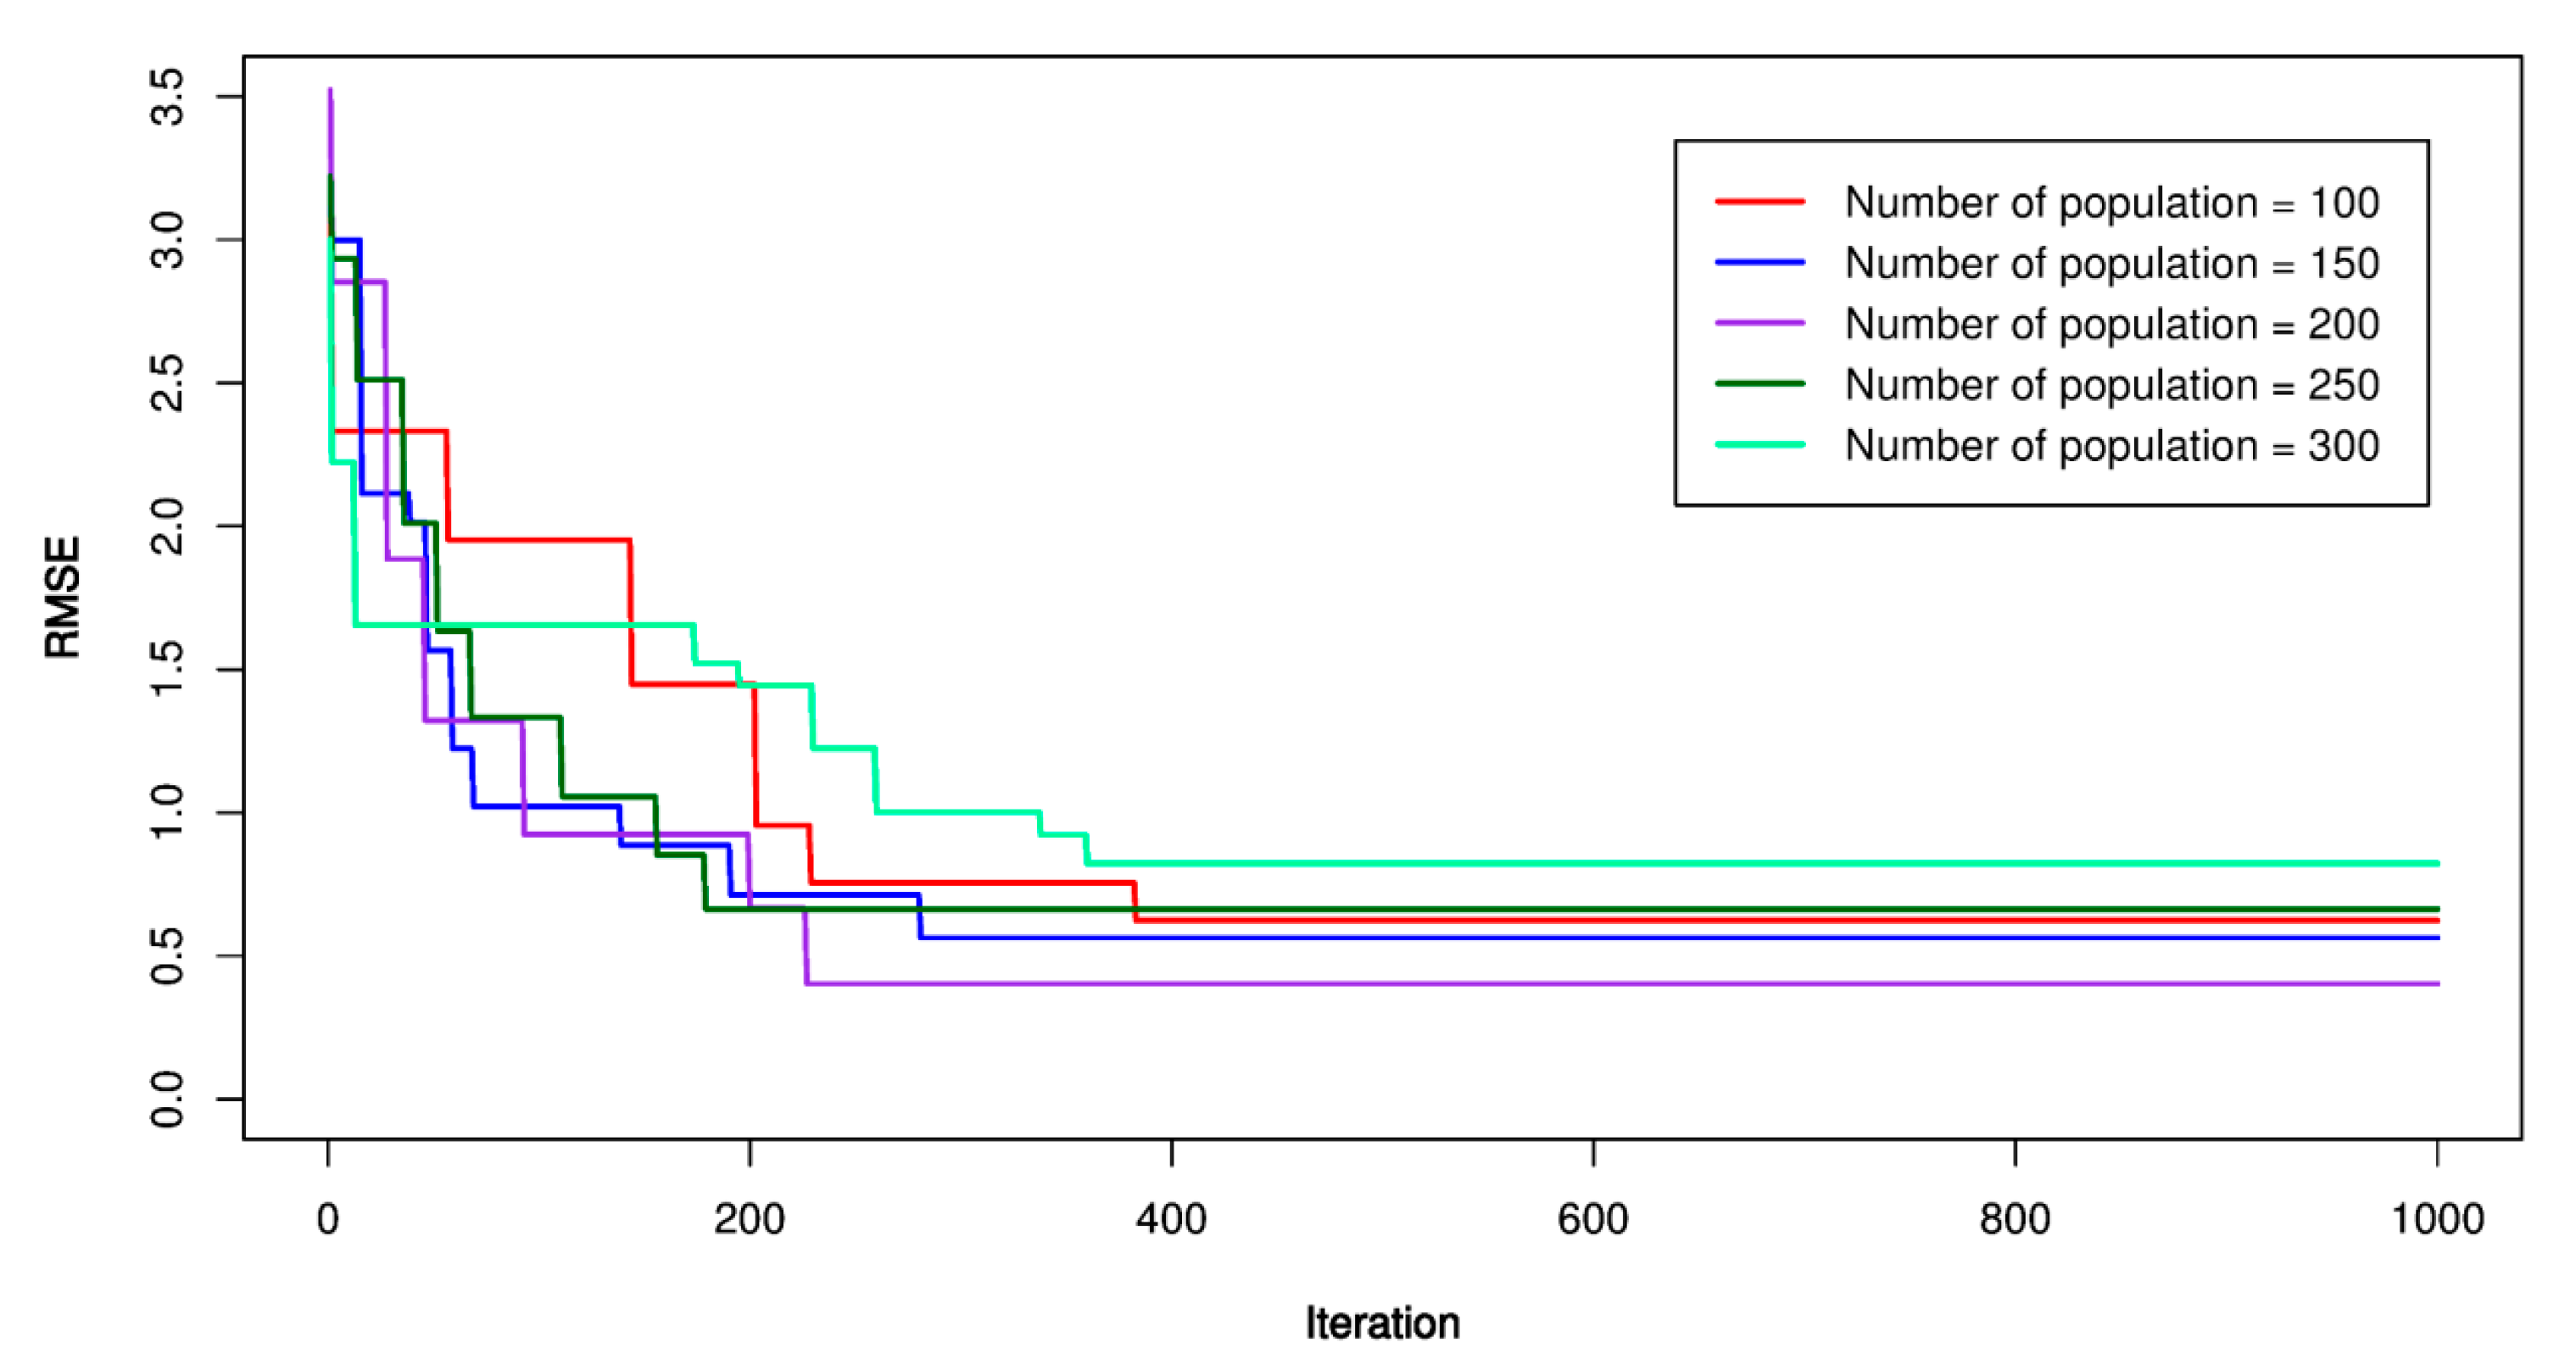
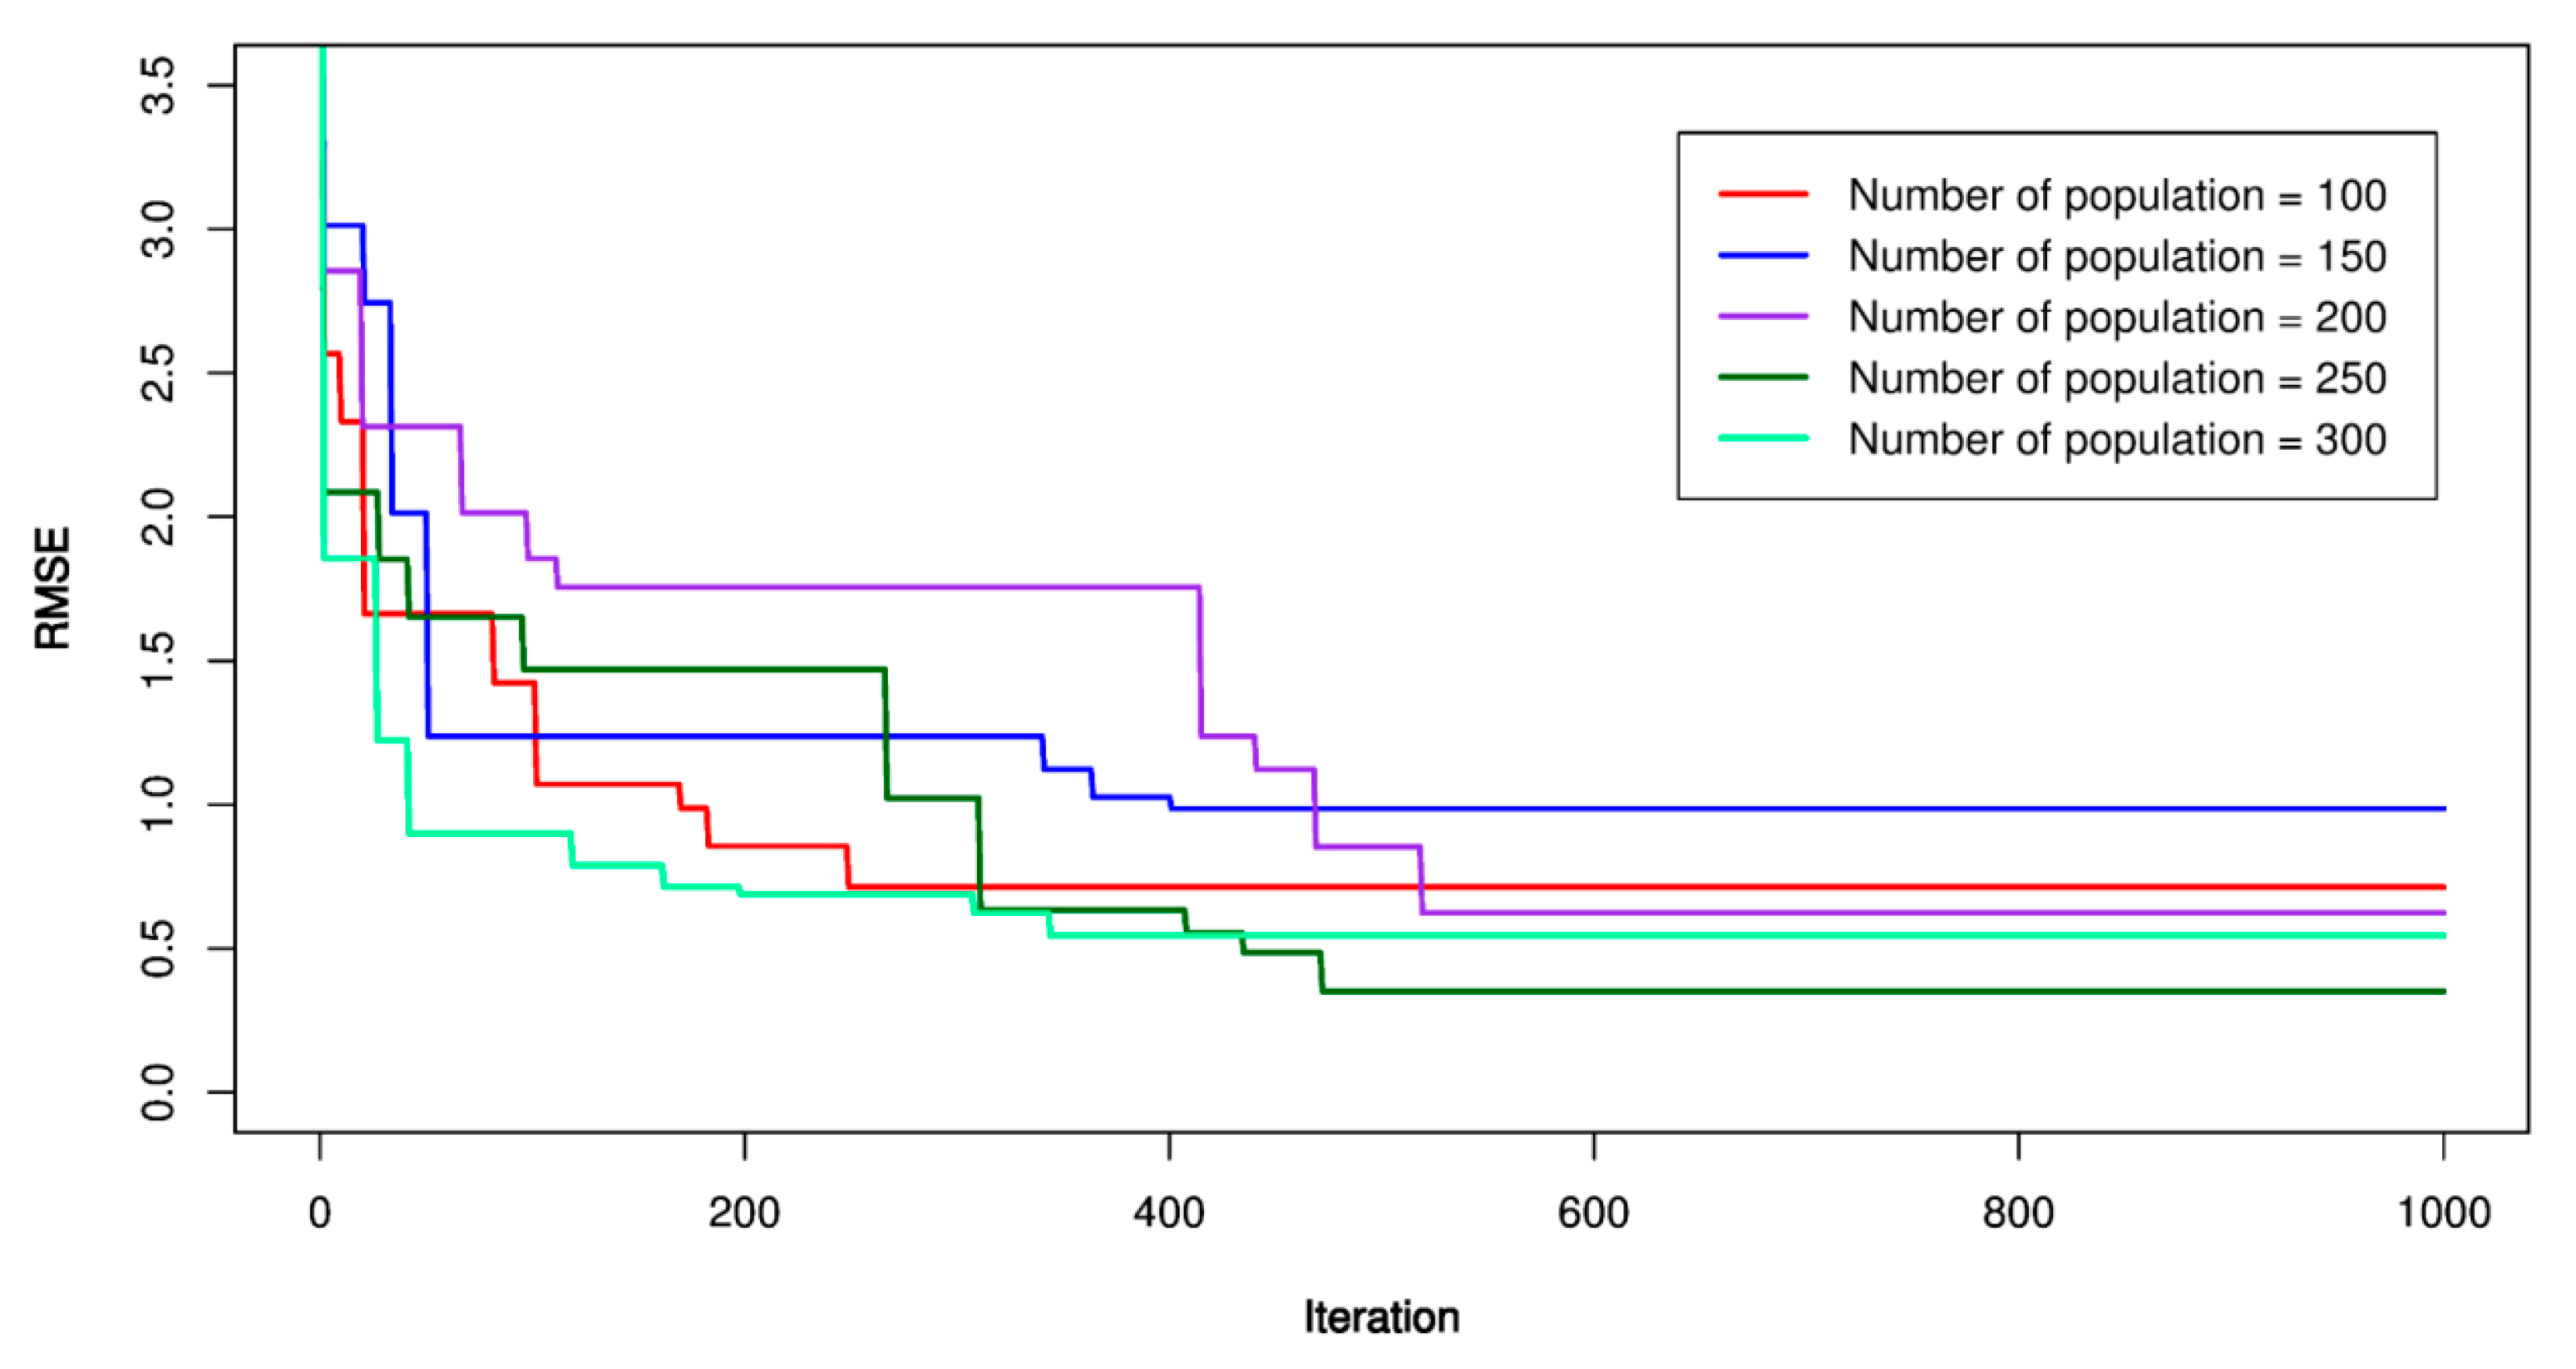
5.2. PSO-SVR Models
- -
- The number of particle swarms (p);
- -
- The maximum particle’s velocity (Vmax);
- -
- The individual cognitive ();
- -
- The group cognitive ();
- -
- The inertia weight (w);
- -
- The maximum number of iteration (mi).
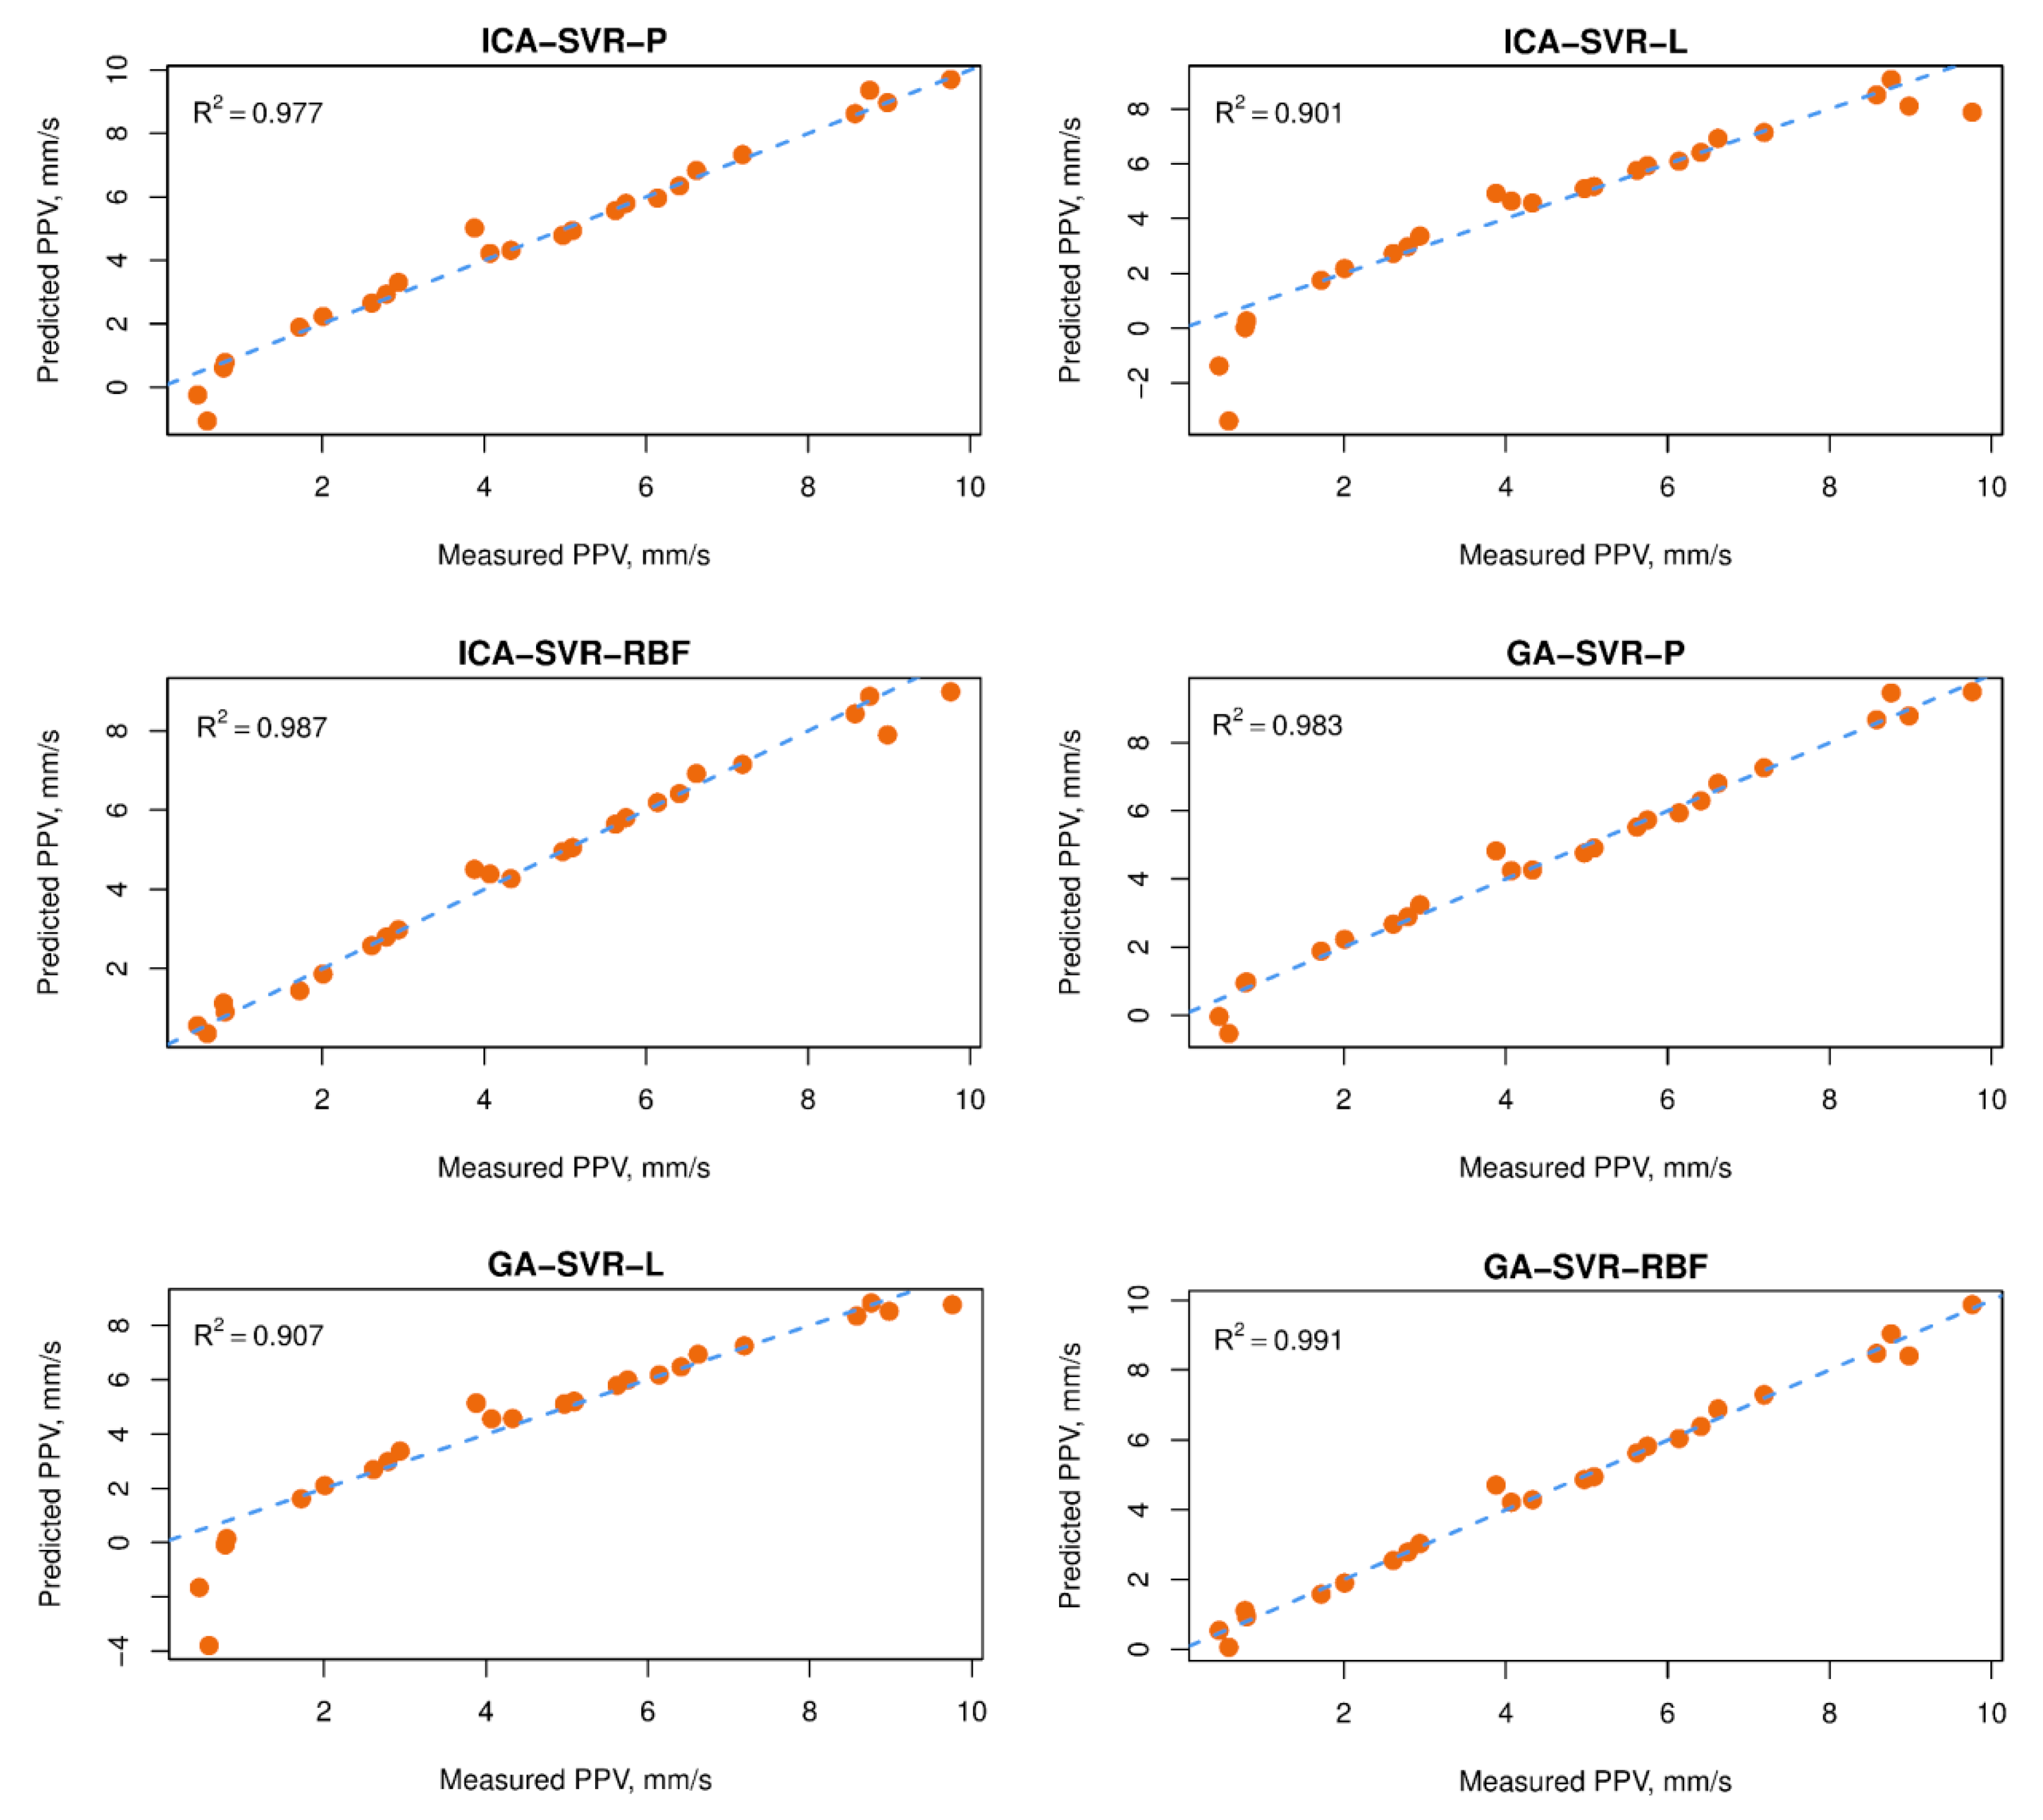
5.3. ICA-SVR Models
5.4. GA-SVR Models
5.5. Evaluating the Developed Models
5.6. Sensitivity Analysis
6. Conclusions
- (1)
- Evolutionary algorithms are of great value in improving the accuracy of traditional models for PPV estimation, particular the SVR model.
- (2)
- Kernel functions have a great effect on SVR’s accuracy, especially the RBF. By means of evolutionary algorithms, kernel functions can reach optimal values for the SVR model.
- (3)
- GA is the most dominant evolutionary algorithm when combined with the SVR model and RBF (i.e., GA-SVR-RBF model) for predicting PPV. It should be approved as a robust technique to accurately predict PPV.
- (4)
- Monitoring distance and explosive charge (per delay) are the most critical factors in predicting PPV. They should be given special attention and carefully collected to improve the models’ accuracy in practice.
Author Contributions
Funding
Acknowledgments
Conflicts of Interest
References
- Fang, Q.; Nguyen, H.; Bui, X.-N.; Nguyen, T.-T. Prediction of Blast-Induced Ground Vibration in Open-Pit Mines Using a New Technique Based on Imperialist Competitive Algorithm and M5Rules. Nat. Resour. Res. 2019, 1–16. [Google Scholar] [CrossRef]
- Nguyen, H.; Bui, X.-N.; Bui, H.-B.; Mai, N.-L. A comparative study of artificial neural networks in predicting blast-induced air-blast overpressure at Deo Nai open-pit coal mine, Vietnam. Neural Comput. Appl. 2018, 1–17. [Google Scholar] [CrossRef]
- Nguyen, H.; Bui, X.-N.; Nguyen-Thoi, T.; Ragam, P.; Moayedi, H. Toward a State-of-the-Art of Fly-Rock Prediction Technology in Open-Pit Mines Using EANNs Model. Appl. Sci. 2019, 9, 4554. [Google Scholar] [CrossRef] [Green Version]
- Nguyen, H.; Bui, X.-N.; Tran, Q.-H.; Le, T.-Q.; Do, N.-H.; Hoa, L.T.T. Evaluating and predicting blast-induced ground vibration in open-cast mine using ANN: A case study in Vietnam. SN Appl. Sci. 2018, 1, 125. [Google Scholar] [CrossRef] [Green Version]
- Zhou, J.; Shi, X.; Li, X. Utilizing gradient boosted machine for the prediction of damage to residential structures owing to blasting vibrations of open pit mining. J. Vib. Control. 2016, 22, 3986–3997. [Google Scholar] [CrossRef]
- Bui, X.N.; Nguyen, H.; Le, H.A.; Bui, H.B.; Do, N.H. Prediction of Blast-induced Air Over-pressure in Open-Pit Mine: Assessment of Different Artificial Intelligence Techniques. Nat. Resour. Res. 2019. [Google Scholar] [CrossRef]
- Bui, X.N.; Muazu, M.A.; Nguyen, H. Optimizing Levenberg–Marquardt backpropagation technique in predicting factor of safety of slopes after two-dimensional OptumG2 analysis. Eng. Comput. 2019. [Google Scholar] [CrossRef]
- Zhang, X.; Nguyen, H.; Bui, X.-N.; Tran, Q.-H.; Nguyen, D.-A.; Bui, D.T.; Moayedi, H. Novel Soft Computing Model for Predicting Blast-Induced Ground Vibration in Open-Pit Mines Based on Particle Swarm Optimization and XGBoost. Nat. Resour. Res. 2019. [Google Scholar] [CrossRef]
- Nguyen, H.; Moayedi, H.; Jusoh, W.A.W.; Sharifi, A. Proposing a novel predictive technique using M5Rules-PSO model estimating cooling load in energy-efficient building system. Eng. Comput. 2019. [Google Scholar] [CrossRef]
- Nguyen, H.; Moayedi, H.; Foong, L.K.; Al Najjar, H.H.A.; Jusoh, W.W.A.; Rashid, A.S.A.; Jamali, J. Optimizing, ANN models with PSO for predicting short building seismic response. Eng. Comput. 2019. [Google Scholar] [CrossRef]
- Nguyen, H.; Drebenstedt, C.; Bui, X.-N.; Bui, D.T. Prediction of Blast-Induced Ground Vibration in an Open-Pit Mine by a Novel Hybrid Model Based on Clustering and Artificial Neural Network. Nat. Resour. Res. 2019. [Google Scholar] [CrossRef]
- Nguyen, H.; Bui, X.-N.; Tran, Q.-H.; Mai, N.-L. A new soft computing model for estimating and controlling blast-produced ground vibration based on hierarchical K-means clustering and cubist algorithms. Appl. Soft Comput. 2019, 77, 376–386. [Google Scholar] [CrossRef]
- Nguyen, H.; Bui, X.-N.; Bui, H.-B.; Cuong, D.T. Developing an XGBoost model to predict blast-induced peak particle velocity in an open-pit mine: A case study. Acta Geophys. 2019, 67, 477–490. [Google Scholar] [CrossRef]
- Nguyen, H.; Bui, X.-N. Predicting Blast-Induced Air Overpressure: A Robust Artificial Intelligence System Based on Artificial Neural Networks and Random Forest. Nat. Resour. Res. 2019, 28, 893–907. [Google Scholar] [CrossRef]
- Moayedi, H.; Armaghani, D.J. Optimizing an ANN model with ICA for estimating bearing capacity of driven pile in cohesionless soil. Eng. Comput. 2018, 34, 347–356. [Google Scholar] [CrossRef]
- Moayedi, H.; Hayati, S. Modelling and optimization of ultimate bearing capacity of strip footing near a slope by soft computing methods. Appl. Soft Comput. 2018, 66, 208–219. [Google Scholar] [CrossRef]
- Moayedi, H.; Hayati, S. Applicability of a CPT-Based Neural Network Solution in Predicting Load-Settlement Responses of Bored Pile. Int. J. Geomech. 2018, 18, 06018009. [Google Scholar] [CrossRef]
- Moayedi, H.; Hayati, S. Artificial intelligence design charts for predicting friction capacity of driven pile in clay. Neural Comput. Appl. 2018. [Google Scholar] [CrossRef]
- Moayedi, H.; Raftari, M.; Sharifi, A.; Jusoh, W.A.W.; Rashid, A.S.A. Optimization of ANFIS with GA and PSO estimating α ratio in driven piles. Eng. Comput. 2019. [Google Scholar] [CrossRef]
- Moayedi, H.; Rezaei, A. An artificial neural network approach for under-reamed piles subjected to uplift forces in dry sand. Neural Comput. Appl. 2017. [Google Scholar] [CrossRef]
- Wu, S.; Song, H.; Cheng, G.; Zhong, X. Civil engineering supervision video retrieval method optimization based on spectral clustering and R-tree. Neural Comput. Appl. 2018. [Google Scholar] [CrossRef]
- Cao, M.S.; Pan, L.X.; Gao, Y.F.; Novák, D.; Ding, Z.C.; Lehký, D.; Li, X.L. Neural network ensemble-based parameter sensitivity analysis in civil engineering systems. Neural Comput. Appl. 2017, 28, 1583–1590. [Google Scholar] [CrossRef]
- Rahimdel, M.J.; Bagherpour, R. Haulage system selection for open pit mines using fuzzy MCDM and the view on energy saving. Neural Comput. Appl. 2018, 29, 187–199. [Google Scholar] [CrossRef]
- Ghasemi, E. Particle swarm optimization approach for forecasting backbreak induced by bench blasting. Neural Comput. Appl. 2017, 28, 1855–1862. [Google Scholar] [CrossRef]
- Aich, U.; Banerjee, S. Modeling of EDM responses by support vector machine regression with parameters selected by particle swarm optimization. Appl. Math. Model. 2014, 38, 2800–2818. [Google Scholar] [CrossRef]
- Amini, H.; Gholami, R.; Monjezi, M.; Torabi, S.R.; Zadhesh, J. Evaluation of flyrock phenomenon due to blasting operation by support vector machine. Neural Comput. Appl. 2012, 21, 2077–2085. [Google Scholar] [CrossRef]
- de Almeida, B.J.; Neves, R.F.; Horta, N. Combining Support Vector Machine with Genetic Algorithms to optimize investments in Forex markets with high leverage. Appl. Soft Comput. 2018, 64, 596–613. [Google Scholar] [CrossRef]
- Deka, P.C. Support vector machine applications in the field of hydrology: A review. Appl. Soft Comput. 2014, 19, 372–386. [Google Scholar]
- Feng, Q.; Zhang, J.; Zhang, X.; Wen, S. Proximate analysis based prediction of gross calorific value of coals: A comparison of support vector machine, alternating conditional expectation and artificial neural network. Fuel Process. Technol. 2015, 129, 120–129. [Google Scholar] [CrossRef]
- Bui, X.-N.; Lee, C.W.; Nguyen, H.; Bui, H.-B.; Long, N.Q.; Le, Q.-T.; Nguyen, V.-D.; Nguyen, N.-B.; Moayedi, H. Estimating PM10 Concentration from Drilling Operations in Open-Pit Mines Using an Assembly of SVR and PSO. Appl. Sci. 2019, 9, 2806. [Google Scholar] [CrossRef] [Green Version]
- Bui, H.-B.; Nguyen, H.; Choi, Y.; Bui, X.-N.; Nguyen-Thoi, T.; Zandi, Y. A Novel Artificial Intelligence Technique to Estimate the Gross Calorific Value of Coal Based on Meta-Heuristic and Support Vector Regression Algorithms. Appl. Sci. 2019, 9, 4868. [Google Scholar] [CrossRef] [Green Version]
- Hasanipanah, M.; Shahnazar, A.; Amnieh, H.B.; Armaghani, D.J. Prediction of air-overpressure caused by mine blasting using a new hybrid PSO-SVR model. Eng. Comput. 2017, 33, 23–31. [Google Scholar] [CrossRef]
- Nguyen, H. Support vector regression approach with different kernel functions for predicting blast-induced ground vibration: A case study in an open-pit coal mine of Vietnam. SN Appl. Sci. 2019, 1, 283. [Google Scholar] [CrossRef] [Green Version]
- Khandelwal, M.; Singh, T. Prediction of blast-induced ground vibration using artificial neural network. Int. J. Rock Mech. Min. Sci. 2009, 46, 1214–1222. [Google Scholar] [CrossRef]
- Khandelwal, M.; Kankar, P.; Harsha, S. Evaluation and prediction of blast induced ground vibration using support vector machine. Min. Sci. Technol. (China) 2010, 20, 64–70. [Google Scholar] [CrossRef]
- Saadat, M.; Khandelwal, M.; Monjezi, M. An ANN-based approach to predict blast-induced ground vibration of Gol-E-Gohar iron ore mine, Iran. J. Rock Mech. Geotech. Eng. 2014, 6, 67–76. [Google Scholar] [CrossRef] [Green Version]
- Hajihassani, M.; Armaghani, D.J.; Marto, A.; Mohamad, E.T. Ground vibration prediction in quarry blasting through an artificial neural network optimized by imperialist competitive algorithm. Bull. Eng. Geol. Environ. 2015, 74, 873–886. [Google Scholar] [CrossRef]
- Hajihassani, M.; Armaghani, D.J.; Monjezi, M.; Mohamad, E.T.; Marto, A. Blast-induced air and ground vibration prediction: A particle swarm optimization-based artificial neural network approach. Environ. Earth Sci. 2015, 74, 2799–2817. [Google Scholar] [CrossRef]
- Amiri, M.; Amnieh, H.B.; Hasanipanah, M.; Khanli, L.M. A new combination of artificial neural network and K-nearest neighbors models to predict blast-induced ground vibration and air-overpressure. Eng. Comput. 2016, 32, 631–644. [Google Scholar] [CrossRef]
- Hasanipanah, M.; Faradonbeh, R.S.; Amnieh, H.B.; Armaghani, D.J.; Monjezi, M. Forecasting blast-induced ground vibration developing a CART model. Eng. Comput. 2017, 33, 307–316. [Google Scholar] [CrossRef]
- Hasanipanah, M.; Naderi, R.; Kashir, J.; Noorani, S.A.; Qaleh, A.Z.A. Prediction of blast-produced ground vibration using particle swarm optimization. Eng. Comput. 2017, 33, 173–179. [Google Scholar] [CrossRef]
- Taheri, K.; Hasanipanah, M.; Golzar, S.B.; Majid, M.Z.A. A hybrid artificial bee colony algorithm-artificial neural network for forecasting the blast-produced ground vibration. Eng. Comput. 2017, 33, 689–700. [Google Scholar] [CrossRef]
- Faradonbeh, R.S.; Monjezi, M. Prediction and minimization of blast-induced ground vibration using two robust meta-heuristic algorithms. Eng. Comput. 2017, 33, 835–851. [Google Scholar] [CrossRef]
- Behzadafshar, K.; Mohebbi, F.; Soltani Tehrani, M.; Hasanipanah, M.; Tabrizi, O. Predicting the ground vibration induced by mine blasting using imperialist competitive algorithm. Eng. Comput. 2018, 35, 1774–1787. [Google Scholar] [CrossRef]
- Tian, E.; Zhang, J.; Tehrani, M.S.; Surendar, A.; Ibatova, A.Z. Development of GA-based models for simulating the ground vibration in mine blasting. Eng. Comput. 2018, 55, 849–855. [Google Scholar] [CrossRef]
- Hasanipanah, M.; Amnieh, H.B.; Khamesi, H.; Armaghani, D.J.; Golzar, S.B.; Shahnazar, A. Prediction of an environmental issue of mine blasting: An imperialistic competitive algorithm-based fuzzy system. Int. J. Environ. Sci. Technol. 2018, 15, 551–560. [Google Scholar] [CrossRef]
- Eberhart, R.; Kennedy, J. A new optimizer using particle swarm theory. In Proceedings of the Sixth International Symposium on Micro Machine and Human Science, Nagoya, Japan, 4–6 October 1995; pp. 39–43. [Google Scholar]
- Fang, Q.; Nguyen, H.; Bui, X.-N.; Tran, Q.-H. Optimizing ANN models with PSO for predicting short building seismic response. Nat. Resour. Res. 2019, 1–15. [Google Scholar] [CrossRef]
- Tang, B.; Xiang, K.; Pang, M. An integrated particle swarm optimization approach hybridizing a new self-adaptive particle swarm optimization with a modified differential evolution. Neural Comput. Appl. 2018. [Google Scholar] [CrossRef]
- Kennedy, J. Particle swarm optimization. In Encyclopedia of Machine Learning; Springer: Berlin/Heidelberg, Germany, 2011; pp. 760–766. [Google Scholar]
- Atashpaz, -G.E.; Lucas, C. Imperialist competitive algorithm: An algorithm for optimization inspired by imperialistic competition. In Evolutionary Computation, CEC 2007; IEEE: Piscataway, NJ, USA, 2007; pp. 4661–4667. [Google Scholar]
- Hosseini, S.; Al Khaled, A. A survey on the imperialist competitive algorithm metaheuristic: Implementation in engineering domain and directions for future research. Appl. Soft Comput. 2014, 24, 1078–1094. [Google Scholar] [CrossRef]
- Elsisi, M. Design of neural network predictive controller based on imperialist competitive algorithm for automatic voltage regulator. Neural Comput. Appl. 2019. [Google Scholar] [CrossRef]
- Zadeh Shirazi, A.; Mohammadi, Z. A hybrid intelligent model combining ANN and imperialist competitive algorithm for prediction of corrosion rate in 3C steel under seawater environment. Neural Comput. Appl. 2017, 28, 3455–3464. [Google Scholar] [CrossRef]
- Mitchell, M. An Introduction to Genetic Algorithms; MIT press: Cambridge, MA, USA, 1998. [Google Scholar]
- Carr, J. An introduction to genetic algorithms. Sr. Proj. 2014, 1, 40. [Google Scholar]
- Karaboga, D. An Idea based on Honey bee Swarm for Numerical Optimization; Technical Report-tr06; Erciyes University, Engineering Faculty, Computer Egineering Department: Kayseri, Turkey, October 2005. [Google Scholar]
- Vapnik, V. Pattern recognition using generalized portrait method. Autom. Remote. Control. 1963, 24, 774–780. [Google Scholar]
- Yu, Z.; Shi, X.; Zhou, J.; Rao, D.; Chen, X.; Dong, W.; Miao, X.; Ipangelwa, T. Feasibility of the indirect determination of blast-induced rock movement based on three new hybrid intelligent models. Eng. Comput. 2019. [Google Scholar] [CrossRef]
- Ding, Z.; Nguyen, H.; Bui, X.-N.; Zhou, J.; Moayedi, H. Computational Intelligence Model for Estimating Intensity of Blast-Induced Ground Vibration in a Mine Based on Imperialist Competitive and Extreme Gradient Boosting Algorithms. Nat. Resour. Res. 2019. [Google Scholar] [CrossRef]
- Verma, A.; Singh, T. Comparative study of cognitive systems for ground vibration measurements. Neural Comput. Appl. 2013, 22, 341–350. [Google Scholar] [CrossRef]
- Box, G.E.; Cox, D.R. An analysis of transformations. J. R. Stat. Soc. Ser. B (Methodol.) 1964, 26, 211–243. [Google Scholar] [CrossRef]
- Ling, H.; Qian, C.; Kang, W.; Liang, C.; Chen, H. Combination of Support Vector Machine and K-Fold cross validation to predict compressive strength of concrete in marine environment. Constr. Build. Mater. 2019, 206, 355–363. [Google Scholar] [CrossRef]
- Da Veiga, S. Global sensitivity analysis with dependence measures. J. Stat. Comput. Simul. 2015, 85, 1283–1305. [Google Scholar] [CrossRef]
- Gretton, A.; Bousquet, O.; Smola, A.; Schölkopf, B. Measuring statistical dependence with Hilbert-Schmidt norms. In International Conference on Algorithmic Learning Theory; Springer: Berlin/Heidelberg, Germany, 2005; pp. 63–77. [Google Scholar]


| Reference | Method | Results |
|---|---|---|
| Khandelwal, Singh [34] | ANN | R2 = 0.986; MAE = 0.196 |
| Khandelwal et al. [35] | SVM | R2 = 0.955; MAE = 0.226 |
| Saadat et al. [36] | ANN-LM | R2 = 0.957; MSE = 0.000722 |
| Hajihassani et al. [37] | ICA-ANN | R2 = 0.976 |
| Hajihassani et al. [38] | PSO-ANN | R2 = 0.89; MSE = 0.038 |
| Amiri et al. [39] | ANN-KNN | R2 = 0.88; RMSE = 0.54; VAF = 87.84 |
| Hasanipanah et al. [40] | CART | R2 = 0.95; RMSE = 0.17; NS = 0.948 |
| Hasanipanah et al. [41] | PSO-power | R2 = 0.938; RMSE = 0.24; VARE = 0.13; NS = 0.94 |
| Taheri et al. [42] | ABC-ANN | R2 = 0.92; RMSE = 0.22; MAPE = 4.26 |
| Faradonbeh, Monjezi [43] | GEP-COA | R2 = 0.874; RMSE = 6.732; MAE = 5.164 |
| Behzadafshar et al. [44] | ICA-linear | R2 = 0.939; RMSE = 0.320; VAF = 92.18%; MBE = 0.22; MAPE = 0.038 |
| Tian et al. [45] | GA-power | R2 = 0.977; RMSE = 0.285 |
| Hasanipanah et al. [46] | FS-ICA | R2 = 0.942; RMSE = 0.22; VAF = 94.2% |
| Nguyen et al. [12] | HKM-ANN | R2 = 0.983; RMSE = 0.554; VAF = 97.488% |
| Nguyen et al. [11] | HKM-CA | R2 = 0.995; RMSE = 0.475; MAE = 0.373 |
| Zhang et al. [8] | PSO-XGBoost | R2 = 0.968; RMSE = 0.583; MAE = 0.346, VAF = 96.083 |
| Kernel Function | C | μ | κ | σ |
|---|---|---|---|---|
| L | x | - | - | - |
| P | x | x | x | - |
| RBF | x | - | - | x |
| Parameter | Min. | Mean | Max. | Standard Deviation |
|---|---|---|---|---|
| W | 39.200 | 54.620 | 77.900 | 6.846 |
| R | 100.000 | 202.800 | 380.000 | 55.751 |
| B | 2.400 | 3.312 | 4.500 | 0.437 |
| S | 3.000 | 3.302 | 3.600 | 0.208 |
| PPV | 0.300 | 4.804 | 15.170 | 2.928 |
| Model | C | μ | κ | σ |
|---|---|---|---|---|
| ABC-SVR-L | 0.544 | - | - | |
| ABC-SVR-P | 0.146 | 0.729 | 2 | |
| ABC-SVR-RBF | 70.067 | - | - | 0.016 |
| Model | C | μ | κ | σ |
|---|---|---|---|---|
| PSO-SVR-L | 0.119 | - | - | |
| PSO-SVR-P | 4.995 | 0.022 | 2 | |
| PSO-SVR-RBF | 40.901 | - | - | 0.036 |
| Model | C | μ | κ | σ |
|---|---|---|---|---|
| ICA-SVR-L | 0.101 | - | - | |
| ICA-SVR-P | 128.596 | 0.002 | 3 | |
| ICA-SVR-RBF | 2.461 | - | - | 0.079 |
| Model | C | μ | κ | σ |
|---|---|---|---|---|
| GA-SVR-L | 0.178 | - | - | |
| GA-SVR-P | 12.730 | 0.018 | 2 | |
| GA-SVR-RBF | 7.938 | - | - | 0.030 |
| Model | Training Dataset | Testing Dataset | Total Rank | ||||||||||
|---|---|---|---|---|---|---|---|---|---|---|---|---|---|
| RMSE | R2 | MAE | Rank for RMSE | Rank for R2 | Rank for MAE | RMSE | R2 | MAE | Rank for RMSE | Rank for R2 | Rank for MAE | ||
| ABC-SVR-P | 0.425 | 0.977 | 0.265 | 7 | 9 | 8 | 0.317 | 0.989 | 0.226 | 11 | 11 | 9 | 55 |
| ABC-SVR-L | 0.754 | 0.943 | 0.493 | 4 | 3 | 4 | 1.107 | 0.907 | 0.578 | 1 | 3 | 2 | 17 |
| ABC-SVR-RBF | 0.362 | 0.981 | 0.227 | 11 | 11 | 12 | 0.345 | 0.986 | 0.222 | 9 | 9 | 10 | 62 |
| PSO-SVR-P | 0.417 | 0.976 | 0.276 | 8 | 7 | 6 | 0.413 | 0.980 | 0.286 | 6 | 7 | 5 | 39 |
| PSO-SVR-L | 0.833 | 0.941 | 0.526 | 2 | 2 | 2 | 1.044 | 0.904 | 0.574 | 4 | 2 | 4 | 16 |
| PSO-SVR-RBF | 0.411 | 0.978 | 0.256 | 9 | 10 | 10 | 0.410 | 0.979 | 0.245 | 7 | 6 | 8 | 50 |
| ICA-SVR-P | 0.434 | 0.974 | 0.286 | 5 | 5 | 5 | 0.471 | 0.977 | 0.272 | 5 | 5 | 6 | 31 |
| ICA-SVR-L | 0.843 | 0.940 | 0.530 | 1 | 1 | 1 | 1.045 | 0.901 | 0.580 | 3 | 1 | 1 | 8 |
| ICA-SVR-RBF | 0.428 | 0.975 | 0.274 | 6 | 6 | 7 | 0.335 | 0.987 | 0.205 | 10 | 10 | 11 | 50 |
| GA-SVR-P | 0.403 | 0.976 | 0.264 | 10 | 7 | 9 | 0.379 | 0.983 | 0.263 | 8 | 8 | 7 | 49 |
| GA-SVR-L | 0.789 | 0.945 | 0.510 | 3 | 4 | 3 | 1.090 | 0.907 | 0.577 | 2 | 3 | 3 | 18 |
| GA-SVR-RBF | 0.351 | 0.983 | 0.238 | 12 | 12 | 11 | 0.267 | 0.991 | 0.182 | 12 | 12 | 12 | 71 |
© 2019 by the authors. Licensee MDPI, Basel, Switzerland. This article is an open access article distributed under the terms and conditions of the Creative Commons Attribution (CC BY) license (http://creativecommons.org/licenses/by/4.0/).
Share and Cite
Nguyen, H.; Choi, Y.; Bui, X.-N.; Nguyen-Thoi, T. Predicting Blast-Induced Ground Vibration in Open-Pit Mines Using Vibration Sensors and Support Vector Regression-Based Optimization Algorithms. Sensors 2020, 20, 132. https://0-doi-org.brum.beds.ac.uk/10.3390/s20010132
Nguyen H, Choi Y, Bui X-N, Nguyen-Thoi T. Predicting Blast-Induced Ground Vibration in Open-Pit Mines Using Vibration Sensors and Support Vector Regression-Based Optimization Algorithms. Sensors. 2020; 20(1):132. https://0-doi-org.brum.beds.ac.uk/10.3390/s20010132
Chicago/Turabian StyleNguyen, Hoang, Yosoon Choi, Xuan-Nam Bui, and Trung Nguyen-Thoi. 2020. "Predicting Blast-Induced Ground Vibration in Open-Pit Mines Using Vibration Sensors and Support Vector Regression-Based Optimization Algorithms" Sensors 20, no. 1: 132. https://0-doi-org.brum.beds.ac.uk/10.3390/s20010132