LARa: Creating a Dataset for Human Activity Recognition in Logistics Using Semantic Attributes

 ,
,  , , and
Abstract
:
1. Introduction
- What is the the state-of-the-art of dataset creation for multichannel time-series HAR?
- What guidelines are proposed for creating a novel dataset for HAR?
- What are the properties of a logistics-dataset for HAR created by following these guidelines?
- How does a tCNN perform on this dataset using softmax compared to an attribute representation?
2. Related Work
3. Introducing the LARa Dataset
3.1. Guidelines for Creating and Publishing a Dataset
3.2. Laboratory Set-Ups based on Logistics Scenarios
3.2.1. Logistics Scenario 1—Simplified Order Picking System
3.2.2. Logistics Scenario 2—Real-World Order Picking and Consolidation System
3.2.3. Logistics Scenario 3—Real-World Packaging Process
3.3. Configuration of Sensors and Markers
3.4. Characteristics of Participating Subjects
3.5. Recording Procedure
3.5.1. Preliminaries
3.5.2. Recording Process
3.5.3. Documentation and Protocol
- Incidents with respect to S11: After recording 27, it was noticed that the marker of the left finger (see Figure 8, marker number 22) was misplaced. The reseach group could not determine when exactly the marker shifted its position. After recording 30, it was noticed that the marker of the right ankle (see Figure 8, marker number 35) was lost.
- Incidents with respect to S13: After the last recording (number 30), it was noticed that the marker from the right finger (see Figure 8, marker number 23) and the marker from the left wrist (see Figure 8, marker number 18) were missing. One of the lost markers was found on the left side of the subject’s chest.
- Incidents with respect to S14: After recording number 15, it was noticed that the marker of the right forearm (see Figure 8, marker number 17) was stuck to the leg. For the subsequent recordings (number 16 to 30), the marker was put back to its proper position.
3.6. Classes and Attributes
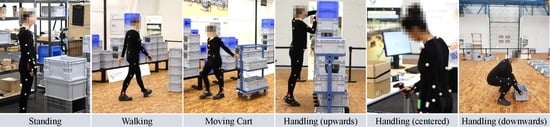
3.6.1. Activity Classes
3.6.2. Attributes
3.6.3. Exemplary Activity Sequence and Its Proper Annotation
3.7. Annotation and Revision
3.8. Folder Overview of the LARa Dataset
4. Deploying LARa for HAR
5. Discussion and Conclusions
- The laboratory dataset LARa will be deployed on IMU data recorded in an industrial environment. The addition of more subjects and the inclusion of further logistical processes and objects is conceivable. New attributes may be added.
- Another approach to recognize human activity is the context. The context may provide information about locations and articles and broaden the application spectrum of the dataset. Context information about the process is provided in this contribution.
- Dependencies between the activities have to be examined, e.g., state-machines. Can information about dependencies increase the accuracy of the recognition of human activities in logistics?
- Finally, the industrial applicability must be proven through a comparison between sensor-based HAR and manual-time management methods, such as REFA and MTM. Can manual-time management methods be enhanced using HAR and LARa?
Author Contributions
Funding
Conflicts of Interest
Appendix A. Related Datasets
State-of-the-Art Datasets for HAR

- Keyword Category A: dataset, data set, database, challenge, library, repository
- Keyword Category B: IMU, inertial measurement unit, accelerometer, MoCap, OMoCap, motion capturing, sensor
- Keyword Category C: HAR, human activity recognition, human activity/activities/actions/ movements/gestures

| Stage | Content Criteria | Description |
|---|---|---|
| I | Human | Data must relate to human movements. |
| II | Sensor | Dataset must contain IMU or OMoCap data, or both. |
| III | Access | Dataset must be accessible online, downloadable and free of charge. |
| IV | Physical Activity | Caspersen et al. [44] defined physical activity “as any bodily movement produced by skeletal muscles that results in energy expenditure”. The definition of physical activity is limited by torso and limb movement [10]. |
| Stage | Content Criteria | No of Datasets |
|---|---|---|
| I | Human | 173 |
| II | Sensor | 95 |
| III | Access | 70 |
| IV | Physical Activity | 61 |
| Root Category | ||
|---|---|---|
| Subcategory | Description | |
| General Information | ||
| Year | Year of publication. Updates are not taken into account. | |
| Dataset name | Name of the dataset and the acronym | |
| Ref. [Dataset] | Link and, if available, the Identifier (DOI) of the dataset | |
| Ref. [Paper] | Identifier or, if not available, link of the paper that describes the dataset, uses it or is generally given as a reference | |
| Domain of the Act. class | ||
| Work | Office work, general work, and physical work in production and logistic | |
| Exercises | Sport activity classes, e.g., basketball, yoga, boxing, golf, ice hockey, soccer | |
| Locomotion | e.g., walking, running, elevating, sitting down, going upstairs, and downstairs | |
| ADL | Activity classes of daily living, e.g., watching TV, shopping, cooking, eating, cleaning, dressing, driving car, personal grooming, interacting, talking, lying | |
| Fall Detection | Falling in different directions and from different heights | |
| Hand Gestures | Focus on the movement of hands, e.g., arm swiping, hand waving, and clapping | |
| Dance | e.g., jazz dance, hip-hop dance, Salsa, Tango | |
| Data Specification | ||
| Recording Time [min] | Total time of the recordings in minutes | |
| Data Size [MiB] | Data Size of the entire unzipped dataset in mebibytes, including e.g., RGB videos, pictures | |
| Format | Formats of data published in the repository | |
| No Subjects | Number of unique subjects | |
| No Act. classes | Number of individual activity classes | |
| List Act. classes | List of all individual activity classes | |
| Laboratory | The recordings were made in a laboratory environment | |
| Real Life | The recordings were made in a real environment, e.g., outdoors, on a sports field, or in a production facility | |
| Sensor | ||
| OMoCap [Hz] | Optical marker-based Motion Capture with frames per second or hertz as a unit | |
| IMU [Hz] | Inertial measurement unit with hertz as a unit | |
| Other Sensors | Sensors except IMU and OMoCap | |
| Phone, Watch, Glasses | Use of sensors built in smartphone, smartwatch, or smart glasses | |

| General Information | Domain of the Act. class | Data Specification | Sensor | Attachment (Sensor/Marker) | ||||||||||||||||||||||||||||||
|---|---|---|---|---|---|---|---|---|---|---|---|---|---|---|---|---|---|---|---|---|---|---|---|---|---|---|---|---|---|---|---|---|---|---|
| Year | Dataset Name | Ref. [Dataset] | Ref. [Paper] | Work | Exercises | Locomotion | ADL | Fall Detection | Hand Gestures | Dance | Recording Time [min] | Data Size [MiB] | Format | No Subjects | No Act. Classes | Laboratory | Real Life | OMoCap [fps/Hz] | IMU [Hz] | Other Sensors | Phone, Watch, Glasses | Hand/Wrist | Lower Arm | Upper Arm | Foot/Ankle | Lower Leg | Upper Leg | Hip | Shoulder | Belly/Waist | Thorax/Chest | Lower Back | Upper Back | Head |
| 2003 | Carnegie Mellon University Motion Capture Database (CMU Mocap) | [84] | - | x | x | x | x | - | 18,673 | amc | 112 | 23 | x | 120 | x | x | x | x | x | x | x | x | x | x | x | x | x | |||||||
| 2004 | Leuven Action Database | [45] | [85] | x | x | x | - | 14 | text, avi, xls, pdf | 1 | 22 | x | 30 | RGB | x | x | x | x | x | x | x | x | x | x | ||||||||||
| 2007 | HDM05 | [54] | [86] | x | x | x | x | - | 3000.32 | c3d, amc, avi | 5 | 70 | x | 120 | RGB | x | x | x | x | x | x | x | x | x | x | x | x | |||||||
| 2008 | Wearable Action Recognition Database (WARD) | [87] | [88] | x | x | - | 41.66 | mat | 20 | 13 | x | 20 | x | x | x | x | x | |||||||||||||||||
| 2009 | BodyAttack Fitness | [83] | [89] | x | 15 | 5.64 | mat | 1 | 6 | x | 64 | x | x | |||||||||||||||||||||
| 2009 | Carnegie Mellon University Multimodal Activity (CMU-MMAC) Database | [59] | [90] | x | - | 60,897.03 | amc, txt, asf, wav, xls, avi | 43 | 29 | x | 120 | 125 | RGB, microphone, RFID, BodyMedia | x | x | x | x | x | x | x | x | x | x | x | x | x | ||||||||
| 2009 | HCI gestures | [83] | [89] | x | - | 12.9 | mat | 1 | 5 | x | 96 | x | x | |||||||||||||||||||||
| 2009 | HumanEva I | [91] | [92] | x | x | - | 13,824 | - | 4 | 6 | x | 120 | RGB, depth | x | x | x | x | x | x | x | x | x | x | x | ||||||||||
| 2009 | HumanEva II | [93] | [92] | x | - | 4,649 | - | 2 | 4 | x | 120 | RGB | x | x | x | x | x | x | x | x | x | x | x | |||||||||||
| 2010 | KIT Whole-Body Human Motion Database | [48] | [65] | x | x | x | x | x | - | 2,097,152 | xml, c3d, avi | 224 | 43 | x | 100 | RGB | x | x | x | x | x | x | x | x | x | x | x | x | ||||||
| 2010 | Localization Data for Person Activity Data Set | [55] | [94] | x | x | x | - | 20.5 | txt | 5 | 11 | x | 10 | x | x | x | ||||||||||||||||||
| 2011 | 3DLife/Huawei ACM MM Grand Challenge 2011 | [95] | [96] | x | - | - | svl, cvs | 15 | 5 | x | 160 | RGB, microphone, depth | x | x | x | |||||||||||||||||||
| 2011 | UCF-iPhone Data Set | [97] | [98] | x | x | - | 13.1 | csv | 9 | 9 | x | 60 | x | x | ||||||||||||||||||||
| 2011 | Vicon Physical Action Data Set | [46] | [99] | x | x | 33.33 | 144 | txt | 10 | 20 | x | 200 | x | x | x | x | x | |||||||||||||||||
| 2012 | Activity Prediction (WISDM) | [100] | [101] | x | - | 49.1 | txt | 29 | 6 | x | 20 | x | x | |||||||||||||||||||||
| 2012 | Human Activity Recognition Using Smartphones Data Set (UCI HAR) | [102] | [103] | x | x | 192 | 269 | txt | 30 | 6 | x | 50 | x | x | ||||||||||||||||||||
| 2012 | OPPORTUNITY Activity Recognition Data Set | [4] | [104] | x | x | x | 1500 | 859 | txt | 12 | 24 | x | 32 | x | x | x | x | x | x | x | x | x | ||||||||||||
| 2012 | PAMAP2 Physical Activity Monitoring Data Set | [5] | [105] | x | x | x | 600 | 1652.47 | txt | 9 | 18 | x | x | 100 | heart rate monitor | x | x | x | ||||||||||||||||
| 2012 | USC-SIPI Human Activity Dataset | [76] | [106] | x | - | 42.7 | mat | 14 | 12 | x | 100 | x | ||||||||||||||||||||||
| 2013 | Actitracker (WISDM) | [107] | [108] | x | x | - | 2588.92 | txt | 29 | 6 | x | 20 | x | x | ||||||||||||||||||||
| 2013 | Daily and Sports Activities Data Set | [109] | [110] | x | x | x | 760 | 402 | csv | 8 | 19 | x | 25 | x | x | x | ||||||||||||||||||
| 2013 | Daphnet Freezing of Gait Data Set | [69] | [111] | x | 500 | 86.2 | txt | 10 | 3 | x | 64 | RGB | x | x | x | |||||||||||||||||||
| 2013 | Hand Gesture | [74] | [1] | x | x | 70 | 47.6 | mat | 2 | 11 | x | 32 | x | x | x | |||||||||||||||||||
| 2013 | Physical Activity Recognition Dataset Using Smartphone Sensors | [47] | [112] | x | - | 63.1 | xlsx | 4 | 6 | x | 50 | x | x | x | x | x | ||||||||||||||||||
| 2013 | Teruel-Fall (tFall) | [113] | [114] | x | - | 65.5 | dat | 10 | 8 | x | 50 | x | x | |||||||||||||||||||||
| 2013 | Wearable Computing: Accelerometers’ Data Classification of Body Postures and Movements (PUC-Rio) | [56] | [115] | x | 480 | 13.6 | dat | 4 | 5 | x | 10 | x | x | x | x | |||||||||||||||||||
| 2014 | Activity Recognition from Single Chest-Mounted Accelerometer Data Set | [116] | [117] | x | x | 431 | 44.2 | csv | 15 | 7 | x | 52 | x | |||||||||||||||||||||
| 2014 | Realistic sensor displacement benchmark dataset (REALDISP) | [118] | [119] | x | x | 566.02 | 6717.43 | txt | 17 | 33 | x | 50 | x | x | x | x | x | |||||||||||||||||
| 2014 | Sensors activity dataset | [47] | [120] | x | 2800 | 308 | csv | 10 | 8 | x | 50 | x | x | x | x | x | ||||||||||||||||||
| 2014 | User Identification From Walking Activity Data Set | [121] | [117] | x | x | 431 | 4.18 | csv | 22 | 5 | x | 52 | RGB, microphone | x | x | |||||||||||||||||||
| 2015 | Complex Human Activities Dataset | [47] | [122] | x | x | 390 | 240 | csv | 10 | 13 | x | 50 | x | x | x | |||||||||||||||||||
| 2015 | Heterogeneity Activity Recognition Data Set (HHAR) | [60] | [123] | x | 270 | 3333.73 | csv | 9 | 6 | x | 200 | x | x | x | ||||||||||||||||||||
| 2015 | Human Activity Recognition with Inertial Sensors | [57] | [124] | x | x | x | 496 | 324 | mat | 19 | 13 | x | 10 | x | x | x | ||||||||||||||||||
| 2015 | HuMoD Database | [125] | [126] | x | x | 49.4 | 6044.27 | mat | 2 | 8 | x | 500 | EMG | x | x | x | x | x | x | x | x | x | ||||||||||||
| 2015 | Project Gravity | [61] | [127] | x | x | x | - | 27.6 | json | 3 | 19 | x | 25 | RGB | x | x | x | |||||||||||||||||
| 2015 | Skoda Mini Checkpoint | [83] | [128] | x | x | 180 | 80.3 | mat | 1 | 10 | x | 98 | x | x | x | |||||||||||||||||||
| 2015 | Smartphone-Based Recognition of Human Activities and Postural Transitions Data Set (SBHAR) | [129] | [130] | x | x | 300 | 240 | txt | 30 | 12 | x | 50 | RGB | x | x | |||||||||||||||||||
| 2015 | UTD Multimodal Human Action Dataset (UTD-MHAD) | [49] | [131] | x | x | x | - | 1316.15 | mat, avi | 8 | 27 | x | 50 | depth | x | x | ||||||||||||||||||
| 2016 | Activity Recognition system based on Multisensor data fusion (AReM) Data Set | [132] | [133] | x | x | 176 | 1.69 | csv | 1 | 6 | x | 70 | x | x | x | x | ||||||||||||||||||
| 2016 | Daily Log | [51] | [134] | x | x | x | 106,560 | 4815.97 | csv | 7 | 33 | x | x | GPS | x | x | x | |||||||||||||||||
| 2016 | ExtraSensory Dataset | [52] | [135] | x | x | x | x | 308,320 | 144,423.88 | dat, csv, mfcc | 60 | 51 | x | 40 | microphone | x | x | x | ||||||||||||||||
| 2016 | HDM12 Dance | [136] | [136] | x | 97 | 2,175.48 | asf, c3d | 22 | 20 | x | 128 | x | x | x | x | x | x | x | x | x | x | x | ||||||||||||
| 2016 | RealWorld | [75] | [67] | x | x | 1065 | 3891.92 | csv | 15 | 8 | x | 50 | GPS, magnetic field, microphone, RGB, light | x | x | x | x | x | x | x | x | |||||||||||||
| 2016 | Smartphone Dataset for Human Activity Recognition in Ambient Assisted Living | [137] | [103] | x | x | 94.79 | 46.5 | txt | 30 | 6 | x | 50 | x | x | ||||||||||||||||||||
| 2016 | UMAFall: Fall Detection Dataset | [138] | [139] | x | x | x | - | 359 | csv | 19 | 14 | x | 200 | x | x | x | x | x | x | |||||||||||||||
| 2017 | An Open Dataset for Human Activity Analysis using Smart Devices | [62] | [140] | x | x | x | - | 433 | csv | 1 | 16 | x | x | x | x | x | x | |||||||||||||||||
| 2017 | IMU Dataset for Motion and Device Mode Classification | [141] | [50] | x | - | 2835.21 | mat | 8 | 3 | x | 100 | x | x | x | x | x | x | x | x | x | x | x | ||||||||||||
| 2017 | Martial Arts, Dancing and Sports (MADS) Dataset | [71] | [142] | x | x | - | 24,234.96 | mov, zip | 5 | 5 | x | 60 | RGB | x | x | x | x | x | x | x | x | x | x | x | x | |||||||||
| 2017 | Physical Rehabilitation Movements Data Set (UI-PRMD) | [66] | [143] | x | x | - | 4700.17 | txt | 10 | 10 | x | 100 | depth | x | x | x | x | x | x | x | x | x | x | x | ||||||||||
| 2017 | SisFall | [144] | [145] | x | x | x | 1849.33 | 1627.67 | txt | 38 | 34 | x | 200 | x | ||||||||||||||||||||
| 2017 | TotalCapture Dataset | [72] | [146] | x | x | - | - | - | 5 | 5 | x | x | 60 | RGB | x | x | x | x | x | x | x | x | x | x | x | x | ||||||||
| 2017 | UniMiB SHAR | [147] | [148] | x | x | x | - | 255 | mat | 30 | 17 | x | 50 | microphone | x | x | ||||||||||||||||||
| 2018 | Fall-UP Dataset (Human Activity Recognition) | [149] | [150] | x | x | x | 165.00 | 78 | csv | 17 | 11 | x | 100 | infrared, RGB | x | x | x | x | x | x | x | |||||||||||||
| 2018 | First-Person View | [63] | - | x | x | - | 1046.86 | mp4, csv | 2 | 7 | x | x | RGB | x | x | x | x | |||||||||||||||||
| 2018 | HAD-AW | [64] | [151] | x | x | x | x | x | - | 325 | xlsx | 16 | 31 | x | 50 | x | x | |||||||||||||||||
| 2018 | HuGaDB | [152] | [153] | x | 600 | 401 | txt | 18 | 12 | x | x | EMG | x | x | x | |||||||||||||||||||
| 2018 | Oxford Inertial Odometry Dataset (OxIOD) | [53] | [154] | x | 883.2 | 2751.73 | csv | 4 | 2 | x | x | 250 | 100 | x | x | x | ||||||||||||||||||
| 2018 | Simulated Falls and Daily Living Activities Data Set | [155] | [156] | x | x | x | 630 | 3972.06 | txt | 17 | 36 | x | 25 | x | x | x | x | x | x | |||||||||||||||
| 2018 | UMONS-TAICHI | [157] | [158] | x | - | 28,242.47 | txt, c3d, tsv | 12 | 13 | x | 179 | RGB, depth | x | x | x | x | x | x | x | x | x | x | x | |||||||||||
| 2019 | AndyData-lab-onePerson | [70] | [32] | x | x | x | 300 | 99,803.46 | mvn, mvnx, c3d, bvh, csv, qtm, mp4 | 13 | 6 | x | 120 | 240 | RGB, pressure sensor handglove | x | x | x | x | x | x | x | x | x | x | x | x | |||||||
| 2019 | PPG-DaLiA | [58] | [159] | x | x | x | 2,190 | 23,016.74 | pkl, csv | 15 | 8 | x | 700 | PPG, ECG | x | x | ||||||||||||||||||
| Sum | 61 | 5 | 20 | 51 | 35 | 9 | 6 | 7 | 33 | 30 | 25 | 29 | 30 | 24 | 20 | 28 | 36 | 31 | 16 | 10 | 25 | 11 | 18 | 21 | ||||||||||
| Min. | 15 | 1.69 | 1 | 2 | 30 | 10 | ||||||||||||||||||||||||||||
| Avg. | 13,531.08 | 43,605.15 | 21.1 | 14.8 | 155.9 | 86.2 | ||||||||||||||||||||||||||||
| Max. | 308,320 | 2,097,152 | 224 | 70 | 500 | 700 | ||||||||||||||||||||||||||||
| 2019 | LogisticActivityRecognitionChallenge (LARa) | [160] | x | x | 758 | 58,907.15 | csv, mp4, pdf, pt, py | 14 | 8 | x | 200 | 100 | RGB | x | x | x | x | x | x | x | x | x | x | x | x | x | ||||||||

References
- Bulling, A.; Blanke, U.; Schiele, B. A Tutorial on Human Activity Recognition Using Body-Worn Inertial Sensors. ACM Comput. Surv. (CSUR) 2014, 46, 1–33. [Google Scholar] [CrossRef]
- Ordóñez, F.J.; Roggen, D. Deep convolutional and LSTM recurrent neural networks for multimodal wearable activity recognition. Sensors 2016, 16, 115. [Google Scholar] [CrossRef] [Green Version]
- Grzeszick, R.; Lenk, J.M.; Rueda, F.M.; Fink, G.A.; Feldhorst, S.; ten Hompel, M. Deep Neural Network based Human Activity Recognition for the Order Picking Process. In Proceedings of the 4th International Workshop on Sensor-Based Activity Recognition and Interaction, Rostock, Germany, 21–22 September 2017. [Google Scholar]
- Roggen, D.; Calatroni, A.; Nguyen-Dinh, L.V.; Chavarriaga, R.; Sagha, H.; Digumarti, S.T. Activity Recognition Challenge|Opportunity. Available online: http://www.opportunity-project.eu/challenge.html (accessed on 20 March 2020).
- Reiss, A. UCI Machine Learning Repository: PAMAP2 Physical Activity Monitoring Data Set. 2016. Available online: http://archive.ics.uci.edu/ml/datasets/PAMAP2+Physical+Activity+Monitoring (accessed on 20 March 2020).
- 2016 Warehouse/DC Operations Survey: Ready to Confront Complexity. Available online: https://www.logisticsmgmt.com/article/2016_warehouse_dc_operations_survey_ready_to_confront_complexity (accessed on 20 March 2020).
- Schlögl, D.; Zsifkovits, H. Manuelle Kommissioniersysteme und die Rolle des Menschen. BHM Berg-und Hüttenmännische Monatshefte 2016, 161, 225–228. [Google Scholar] [CrossRef]
- REFA-Time Study. Available online: https://refa.de/en/Int.-global-consulting/time-studies (accessed on 20 March 2020).
- MTM—Methods-Time Measurement: MTM. Available online: https://mtm.org/en/about-mtm/mtm (accessed on 20 March 2020).
- Reining, C.; Niemann, F.; Moya Rueda, F.; Fink, G.A.; ten Hompel, M. Human Activity Recognition for Production and Logistics—A Systematic Literature Review. Information 2019, 10, 245. [Google Scholar] [CrossRef] [Green Version]
- Feldhorst, S.; Masoudenijad, M.; ten Hompel, M.; Fink, G.A. Motion Classification for Analyzing the Order Picking Process Using Mobile Sensors—General Concepts, Case Studies and Empirical Evaluation; SCITEPRESS—Science and and Technology Publications: Setubal, Portugal, 2016; pp. 706–713. [Google Scholar] [CrossRef] [Green Version]
- Moya Rueda, F.; Grzeszick, R.; Fink, G.; Feldhorst, S.; ten Hompel, M. Convolutional Neural Networks for Human Activity Recognition Using Body-Worn Sensors. Informatics 2018, 5, 26. [Google Scholar] [CrossRef] [Green Version]
- Reining, C.; Schlangen, M.; Hissmann, L.; ten Hompel, M.; Moya, F.; Fink, G.A. Attribute Representation for Human Activity Recognition of Manual Order Picking Activities. In Proceedings of the 5th International Workshop on Sensor-Based Activity Recognition and Interaction—iWOAR ’18, Berlin, Germany, 20–21 September 2018; pp. 1–10. [Google Scholar] [CrossRef]
- General Data Protection Regulation (GDPR). Available online: https://gdpr.eu/tag/gdpr/ (accessed on 15 April 2020).
- Venkatapathy, A.K.R.; Bayhan, H.; Zeidler, F.; ten Hompel, M. Human Machine Synergies in Intra-Logistics: Creating a Hybrid Network for Research and Technologies. In Proceedings of the 2017 Federated Conference on Computer Science and Information Systems (FedCSIS), Prague, Czech Republic, 3–6 September 2017; pp. 1065–1068. [Google Scholar] [CrossRef] [Green Version]
- Moya Rueda, F.; Fink, G.A. Learning attribute representation for human activity recognition. In Proceedings of the 2018 24th International Conference on Pattern Recognition (ICPR), Beijing, China, 20–24 August 2018; pp. 523–528. [Google Scholar]
- Ronao, C.A.; Cho, S.B. Deep convolutional neural networks for human activity recognition with smartphone sensors. In Conference on Neural Information Processing; Springer: Cham, Switzerland, 2015; pp. 46–53. [Google Scholar]
- Yang, J.; Nguyen, M.N.; San, P.P.; Li, X.; Krishnaswamy, S. Deep Convolutional Neural Networks on Multichannel Time Series for Human Activity Recognition. In Proceedings of the Twenty-Fourth International Joint Conference on Artificial Intelligence, Buenos Aires, Argentina, 25–31 July 2015; pp. 3995–4001. [Google Scholar]
- Debache, I.; Jeantet, L.; Chevallier, D.; Bergouignan, A.; Sueur, C. A Lean and Performant Hierarchical Model for Human Activity Recognition Using Body-Mounted Sensors. Sensors 2020, 20, 3090. [Google Scholar] [CrossRef]
- Münzner, S.; Schmidt, P.; Reiss, A.; Hanselmann, M.; Stiefelhagen, R.; Dürichen, R. CNN-Based Sensor Fusion Techniques for Multimodal Human Activity Recognition. In Proceedings of the 2017 ACM International Symposium on Wearable Computers, Maui, HI, USA, 11–15 September 2017; Association for Computing Machinery: New York, NY, USA, 2017; pp. 158–165. [Google Scholar] [CrossRef]
- Twomey, N.; Diethe, T.; Fafoutis, X.; Elsts, A.; McConville, R.; Flach, P.; Craddock, I. A Comprehensive Study of Activity Recognition Using Accelerometers. Informatics 2018, 5, 27. [Google Scholar] [CrossRef] [Green Version]
- Ordonez, F.J.; Englebienne, G.; De Toledo, P.; Van Kasteren, T.; Sanchis, A.; Krose, B. In-home activity recognition: Bayesian inference for hidden Markov models. IEEE Pervasive Comput. 2014, 13, 67–75. [Google Scholar] [CrossRef]
- Zeng, M.; Nguyen, L.T.; Yu, B.; Ole J., M.; Zhu, J.; Wu, P.; Zhang, J. Convolutional neural networks for human activity recognition using mobile sensors. In Proceedings of the 6th International Conference on Mobile Computing, Applications and Services, Austin, TX, USA, 6–7 November 2014; pp. 197–205. [Google Scholar] [CrossRef] [Green Version]
- Hammerla, N.Y.; Halloran, S.; Ploetz, T. Deep, convolutional, and recurrent models for human activity recognition using wearables. arXiv 2016, arXiv:1604.08880. [Google Scholar]
- ISO/IEC 19510:2013. Available online: https://www.iso.org/cms/render/live/en/sites/isoorg/contents/data/standard/06/26/62652.html (accessed on 26 June 2020).
- Moya Rueda, F.; Lüdtke, S.; Schröder, M.; Yordanova, K.; Kirste, T.; Fink, G.A. Combining Symbolic Reasoning and Deep Learning for Human Activity Recognition. In Proceedings of the 2019 IEEE International Conference on Pervasive Computing and Communications Workshops (PerCom Workshops), Kyoto, Japan, 11–15 March 2019; pp. 22–27. [Google Scholar]
- Dombrowski, U.; Riechel, C.; Schulze, S. Enforcing Employees Participation in the Factory Planning Process. In Proceedings of the 2011 IEEE International Symposium on Assembly and Manufacturing (ISAM), Tampere, Finland, 25–27 May 2011; pp. 1–6. [Google Scholar] [CrossRef]
- Nguyen, M.N.; Do, N.H. Re-Engineering Assembly Line with Lean Techniques. Procedia CIRP 2016, 40, 590–595. [Google Scholar] [CrossRef] [Green Version]
- MbientLab—Wearable Bluetooth 9-Axis IMUs & Environmental Sensors. Available online: https://mbientlab.com/ (accessed on 29 May 2020).
- Coren, S. The Lateral Preference Inventory for Measurement of Handedness, Footedness, Eyedness, and Earedness: Norms for Young Adults. Bull. Psychon. Soc. 1993, 31, 1–3. [Google Scholar] [CrossRef]
- De Kovel, C.G.F.; Carrión-Castillo, A.; Francks, C. A Large-Scale Population Study of Early Life Factors Influencing Left-Handedness. Sci. Rep. 2019, 9, 1–11. [Google Scholar] [CrossRef] [PubMed] [Green Version]
- Maurice, P.; Malaisé, A.; Amiot, C.; Paris, N.; Richard, G.J.; Rochel, O.; Ivaldi, S. Human Movement and Ergonomics: An Industry-Oriented Dataset for Collaborative Robotics. Int. J. Robot. Res. 2019, 38, 1529–1537. [Google Scholar] [CrossRef]
- Reining, C.; Rueda, F.M.; ten Hompel, M.; Fink, G.A. Towards a Framework for Semi-Automated Annotation of Human Order Picking Activities Using Motion Capturing. In Proceedings of the 2018 Federated Conference on Computer Science and Information Systems (FedCSIS), Poznan, Poland, 9–12 September 2018; pp. 817–821. [Google Scholar] [CrossRef] [Green Version]
- Nguyen, L.T.; Zeng, M.; Tague, P.; Zhang, J. I Did Not Smoke 100 Cigarettes Today!: Avoiding False Positives in Real-World Activity Recognition. In Proceedings of the 2015 ACM International Joint Conference on Pervasive and Ubiquitous Computing, ACM, UbiComp: 15, Osaka, Japan, 7–11 September 2015; pp. 1053–1063. [Google Scholar] [CrossRef]
- Perry, J. Gait Analysis: Normal and Pathological Function. J. Pediatr. Orthop. 1992, 12, 815. [Google Scholar] [CrossRef]
- Bokranz, R.; Landau, K. Handbuch Industrial Engineering: Produktivitätsmanagement mit MTM. Band 1: Konzept, 2., überarb. und erw. aufl ed.; OCLC: 820418782; Schäffer-Poeschel: Stuttgart, Germany, 2012. [Google Scholar]
- Whittle, M.W. Gait Analysis: An Introduction, 4th ed.; Butterworth-Heinemann: Oxford, UK, 2007. [Google Scholar]
- Reining, C.; Moya Rueda, F.; Niemann, F.; Fink, G.A.; ten Hompel, M. Annotation Performance for Multi-Channel Time Series HAR Dataset in Logistics. In Proceedings of the IEEE International Conference on Pervasive Computing and Communications (PerCom 2020), Austin, Texas, USA, 23–27 March 2020. in press. [Google Scholar]
- Moya Rueda, F.; Altermann, E. Annotation Tool LARa. 2020. Available online: https://github.com/wilfer9008/Annotation_Tool_LARa (accessed on 9 June 2020).
- Kitchenham, B.; Brereton, P. A systematic review of systematic review process research in software engineering. Inf. Softw. Technol. 2013, 55, 2049–2075. [Google Scholar] [CrossRef]
- Kitchenham, B.; Pearl Brereton, O.; Budgen, D.; Turner, M.; Bailey, J.; Linkman, S. Systematic literature reviews in software engineering—A systematic literature review. Inf. Softw. Technol. 2009, 51, 7–15. [Google Scholar] [CrossRef]
- Kitchenham, B. Procedures for Performing Systematic Reviews; Keele University: Keele, UK, 2004; Volume 33. [Google Scholar]
- Chen, L.; Zhao, X.; Tang, O.; Price, L.; Zhang, S.; Zhu, W. Supply chain collaboration for sustainability: A literature review and future research agenda. Int. J. Prod. Econ. 2017, 194, 73–87. [Google Scholar] [CrossRef]
- Caspersen, C.J.; Powell, K.E.; Christenson, G.M. Physical activity, exercise, and physical fitness: Definitions and distinctions for health-related research. Public Health Rep. 1985, 100, 126–131. [Google Scholar]
- Vanrie, J.; Verfaillie, K. Action Database. Available online: http://ppw.kuleuven.be/english/research/lep/resources/action (accessed on 20 March 2020).
- Theodoridis, T. UCI Machine Learning Repository: Vicon Physical Action Data Set Data Set. Available online: http://archive.ics.uci.edu/ml/datasets/Vicon+Physical+Action+Data+Set (accessed on 20 March 2020).
- Shoaib, M.; Bosch, S.; Incel, O.D.; Scholten, H.; Havinga, P.J.M. Research | Datasets | Pervasive Systems Group|University of Twente. Available online: http://www.utwente.nl/en/eemcs/ps/research/dataset/ (accessed on 20 March 2020).
- Mandery, C.; Terlemez, O.; Do, M.; Vahrenkamp, N.; Asfour, T. KIT Whole-Body Human Motion Database. Available online: http://motion-database.humanoids.kit.edu/ (accessed on 20 March 2020).
- Jafari, R.; Chen, C.; Kehtarnavaz, N. UTD Multimodal Human Action Dataset (UTD-MHAD). Available online: http://personal.utdallas.edu/~kehtar/UTD-MHAD.html (accessed on 20 March 2020).
- Kasebzadeh, P.; Hendeby, G.; Fritsche, C.; Gunnarsson, F.; Gustafsson, F. IMU Dataset for Motion and Device Mode Classification. In Proceedings of the 2017 International Conference on Indoor Positioning and Indoor Navigation (IPIN), Sapporo, Japan, 18–21 September 2017; pp. 1–8. [Google Scholar] [CrossRef] [Green Version]
- Sztyler, T. Human Activity Recognition. Available online: http://sensor.informatik.uni-mannheim.de/#dataset_dailylog (accessed on 20 March 2020).
- Vaizman, Y.; Ellis, K.; Lanckriet, G. The ExtraSensory Dataset. Available online: http://extrasensory.ucsd.edu/ (accessed on 20 March 2020).
- Chen, C.; Lu, C.X.; Markham, A.; Trigoni, N. Dataset and Methods for Deep Inertial Odometry. Available online: http://deepio.cs.ox.ac.uk/ (accessed on 20 March 2020).
- Müller, M.; Röder, T.; Clausen, M.; Krüger, B.; Weber, A.; Eberhardt, B. Motion Database HDM05. Available online: http://resources.mpi-inf.mpg.de/HDM05/ (accessed on 20 March 2020).
- Lustrek, M.; Kaluza, B.; Piltaver, R.; Krivec, J.; Vidulin, V. UCI Machine Learning Repository: Localization Data for Person Activity Data Set. Available online: http://archive.ics.uci.edu/ml/datasets/Localization+Data+for+Person+Activity (accessed on 20 March 2020).
- Ugulino, W.; Cardador, D.; Vega, K.; Velloso, E.; Milidiú, R.; Fuks, H. Human Activity Recognition. Available online: http://groupware.les.inf.puc-rio.br/har#ixzz2PyRdbAfA (accessed on 20 March 2020).
- Ahmed, D.B. DLR—Institut Für Kommunikation Und Navigation—Data Set. Available online: http://www.dlr.de/kn/desktopdefault.aspx/tabid-12705/22182_read-50785/ (accessed on 20 March 2020).
- Reiss, A.; Indlekofer, I.; Schmidt, P.; Van Laerhoven, K. UCI Machine Learning Repository: PPG-DaLiA Data Set. Available online: http://archive.ics.uci.edu/ml/datasets/PPG-DaLiA (accessed on 20 March 2020).
- De la Torre, F.; Hodgins, J.; Montano, J.; Valcarcel, S.; Macey, J.; Forcada, R. Quality of Life Grand Challenge | Kitchen Capture. Available online: http://kitchen.cs.cmu.edu/ (accessed on 20 March 2020).
- Stisen, A.; Blunck, H. UCI Machine Learning Repository: Heterogeneity Activity Recognition Data Set. Available online: http://archive.ics.uci.edu/ml/datasets/heterogeneity+activity+recognition (accessed on 20 March 2020).
- Vilarinho, T.; Bajer, D.G.; Dahl, O.H.; Egge, I.; Hegdal, S.S.; Lønes, A.; Slettevold, J.N.; Weggersen, S.M. SINTEF-SIT/Project_gravity. Available online: http://github.com/SINTEF-SIT/project_gravity (accessed on 20 March 2020).
- Faye, S.; Louveton, N.; Jafarnejad, S.; Kryvchenko, R.; Engel, T. An Open Dataset for Human Activity Analysis. Available online: http://kaggle.com/sasanj/human-activity-smart-devices (accessed on 20 March 2020).
- Sztyler, T. Human Activity Recognition. Available online: http://sensor.informatik.uni-mannheim.de/#dataset_firstvision (accessed on 20 March 2020).
- Mohammed, S.; Gomaa, W. HAD-AW Data-Set Benchmark For Human Activity Recognition Using Apple Watch. Available online: http://www.researchgate.net/publication/324136132_HAD-AW_Data-set_Benchmark_For_Human_Activity_Recognition_Using_Apple_Watch (accessed on 20 March 2020). [CrossRef]
- Mandery, C.; Terlemez, O.; Do, M.; Vahrenkamp, N.; Asfour, T. The KIT Whole-Body Human Motion Database. In Proceedings of the 2015 International Conference on Advanced Robotics (ICAR), Istanbul, Turkey, 27–31 July 2015; pp. 329–336. [Google Scholar] [CrossRef]
- Vakanski, A.; Jun, H.P.; Paul, D.R.; Baker, R.T. UI—PRMD. Available online: http://webpages.uidaho.edu/ui-prmd/ (accessed on 20 March 2020).
- Sztyler, T.; Baur, H. On-Body Localization of Wearable Devices: An Investigation of Position-Aware Activity Recognition. Available online: http://publications.wim.uni-mannheim.de/informatik/lski/Sztyler2016Localization.pdf (accessed on 20 March 2020).
- Vicon—Nexus. Available online: https://docs.vicon.com/display/Nexus26/Full+body+modeling+with+Plug-in+Gait (accessed on 20 March 2020).
- Roggen, D.; Plotnik, M.; Hausdorff, J. UCI Machine Learning Repository: Daphnet Freezing of Gait Data Set. Available online: http://archive.ics.uci.edu/ml/datasets/Daphnet+Freezing+of+Gait (accessed on 20 March 2020).
- Maurice, P.; Malaisé, A.; Ivaldi, S.; Rochel, O.; Amiot, C.; Paris, N.; Richard, G.J.; Fritzsche, L. AndyData-Lab-onePerson. Available online: http://zenodo.org/record/3254403#.XmDpQahKguV (accessed on 20 March 2020). [CrossRef]
- Zhang, W.; Liu, Z.; Zhou, L.; Leung, H.; Chan, A.B. Martial Arts, Dancing and Sports Dataset | VISAL. Available online: http://visal.cs.cityu.edu.hk/research/mads/ (accessed on 20 March 2020).
- Trumble, M.; Gilbert, A.; Malleson, C.; Hilton, A.; Collomosse, J. Total Capture: 3D Human Pose Estimation Fusing Video and Inertial Sensors. Available online: http://cvssp.org/data/totalcapture/ (accessed on 20 March 2020).
- ANVIL: The Video Annotation Research Tool. Available online: http://www.anvil-software.org/ (accessed on 26 March 2020).
- Bulling, A.; Blanke, U.; Schiele, B. Andreas-Bulling/ActRecTut. Available online: http://github.com/andreas-bulling/ActRecTut (accessed on 20 March 2020).
- Sztyler, T. Human Activity Recognition. Available online: http://sensor.informatik.uni-mannheim.de/#dataset_realworld (accessed on 20 March 2020).
- Zhang, M.; Sawchuk, A.A. Human Activities Dataset. Available online: http://sipi.usc.edu/had/ (accessed on 20 March 2020).
- Figshare. Available online: https://figshare.com/ (accessed on 26 March 2020).
- UCI Machine Learning Repository. Available online: https://archive.ics.uci.edu/ml/index.php (accessed on 26 March 2020).
- Zenodo. Available online: https://zenodo.org/ (accessed on 26 March 2020).
- GitHub. Available online: https://github.com (accessed on 26 March 2020).
- Dropbox. Available online: https://www.dropbox.com/ (accessed on 26 March 2020).
- ResearchGate. Available online: https://www.researchgate.net/ (accessed on 26 March 2020).
- Roggen, D.; Zappi, P. Wiki:Dataset [Human Activity/Context Recognition Datasets]. Available online: http://har-dataset.org/doku.php?id=wiki:dataset (accessed on 20 March 2020).
- Carnegie Mellon University—CMU Graphics Lab - Motion Capture Library. Available online: http://mocap.cs.cmu.edu/ (accessed on 20 March 2020).
- Vanrie, J.; Verfaillie, K. Perception of Biological Motion: A Stimulus Set of Human Point-Light Actions. Behav. Res. Methods Instrum. Comput. 2004, 36, 625–629. [Google Scholar] [CrossRef] [Green Version]
- Müller, M.; Röder, T.; Clausen, M.; Eberhardt, B.; Krüger, B.; Weber, A.G. Documentation Mocap Database HDM05. Available online: https://www.researchgate.net/publication/231521391_Documentation_Mocap_database_HDM05 (accessed on 20 March 2020).
- Yang, A.Y.; Giani, A.; Giannatonio, R.; Gilani, K.; Iyengar, S.; Kuryloski, P.; Seto, E.; Seppa, V.P.; Wang, C.; Shia, V.; et al. D-WAR: Distributed Wearable Action Recognition. Available online: http://people.eecs.berkeley.edu/~yang/software/WAR/ (accessed on 20 March 2020).
- Yang, A.Y.; Iyengar, S.; Kuryloski, P.; Jafari, R. Distributed Segmentation and Classification of Human Actions Using a Wearable Motion Sensor Network. In Proceedings of the 2008 IEEE Computer Society Conference on Computer Vision and Pattern Recognition Workshops, Anchorage, AK, USA, 23–28 June 2008; pp. 1–8. [Google Scholar] [CrossRef] [Green Version]
- Forster, K.; Roggen, D.; Troster, G. Unsupervised Classifier Self-Calibration through Repeated Context Occurences: Is There Robustness against Sensor Displacement to Gain? In Proceedings of the 2009 International Symposium on Wearable Computers, Linz, Austria, 4–7 September 2009; pp. 77–84. [Google Scholar] [CrossRef]
- Spriggs, E.; De La Torre, F.; Hebert, M. Temporal Segmentation and Activity Classification from First-Person Sensing. In Proceedings of the 2009 IEEE Computer Society Conference on Computer Vision and Pattern Recognition Workshops, Miami, FL, USA, 20–25 June 2009; pp. 17–24. [Google Scholar] [CrossRef] [Green Version]
- Sigal, L.; Balan, A.O.; Black, M.J. HumanEva Dataset. Available online: http://humaneva.is.tue.mpg.de/datasets_human_1 (accessed on 20 March 2020).
- Sigal, L.; Balan, A.O.; Black, M.J. HumanEva: Synchronized Video and Motion Capture Dataset and Baseline Algorithm for Evaluation of Articulated Human Motion. Int. J. Comput. Vis. 2010, 87, 4–27. [Google Scholar] [CrossRef]
- Sigal, L.; Balan, A.O.; Black, M.J. HumanEva Dataset. Available online: http://humaneva.is.tue.mpg.de/datasets_human_2 (accessed on 20 March 2020).
- Kaluža, B.; Mirchevska, V.; Dovgan, E.; Luštrek, M.; Gams, M. An Agent-Based Approach to Care in Independent Living. In Ambient Intelligence; de Ruyter, B., Wichert, R., Keyson, D.V., Markopoulos, P., Streitz, N., Divitini, M., Georgantas, N., Mana Gomez, A., Eds.; Springer: Berlin/Heidelberg, Germany, 2010; Volume 6439, pp. 177–186. [Google Scholar] [CrossRef] [Green Version]
- Essid, S.; Lin, X.; Gowing, M.; Kordelas, G.; Aksay, A.; Kelly, P.; Fillon, T.; Zhang, Q.; Dielmann, A.; Kitanovski, V.; et al. 3DLife ACM MM Grand Challenge 2011—Realistic Interaction in Online Virtual Environments. Available online: http://perso.telecom-paristech.fr/essid/3dlife-gc-11/ (accessed on 20 March 2020).
- Essid, S.; Lin, X.; Gowing, M.; Kordelas, G.; Aksay, A.; Kelly, P.; Fillon, T.; Zhang, Q.; Dielmann, A.; Kitanovski, V.; et al. A Multi-Modal Dance Corpus for Research into Interaction between Humans in Virtual Environments. J. Multimodal User Interfaces 2013, 7, 157–170. [Google Scholar] [CrossRef] [Green Version]
- McCall, C.; Reddy, K.; Shah, M. CRCV | Center for Research in Computer Vision at the University of Central Florida. Available online: http://www.crcv.ucf.edu/data/UCF-iPhone.php (accessed on 20 March 2020).
- McCall, C.; Reddy, K.; Shah, M. Macro-Class Selection for Hierarchical k-Nn Classification of Inertial Sensor Data. Available online: https://www.crcv.ucf.edu/papers/PECCS_2012.pdf (accessed on 20 March 2020).
- Theodoridis, T.; Hu, H. Action Classification of 3D Human Models Using Dynamic ANNs for Mobile Robot Surveillance. In Proceedings of the 2007 IEEE International Conference on Robotics and Biomimetics (ROBIO), Sanya, China, 15–18 December 2007; pp. 371–376. [Google Scholar] [CrossRef]
- Lockhart, J.W.; Weiss, G.M.; Xue, J.C.; Gallagher, S.T.; Grosner, A.B.; Pulickal, T.T. WISDM Lab: Dataset. Available online: http://www.cis.fordham.edu/wisdm/dataset.php (accessed on 20 March 2020).
- Kwapisz, J.R.; Weiss, G.M.; Moore, S.A. Activity Recognition Using Cell Phone Accelerometers. ACM SigKDD Explor. Newsl. 2011, 12, 74. [Google Scholar] [CrossRef]
- Reyes-Ortiz, J.L.; Anguita, D.; Ghio, A.; Oneto, L.; Parra, X. UCI Machine Learning Repository: Human Activity Recognition Using Smartphones Data Set. Available online: http://archive.ics.uci.edu/ml/datasets/human+activity+recognition+using+smartphones (accessed on 20 March 2020).
- Anguita, D.; Oneto, L.; Parra, X.; Reyes-Ortiz, J.L. A Public Domain Dataset for Human Activity Recognition Using Smartphones. Available online: https://www.elen.ucl.ac.be/Proceedings/esann/esannpdf/es2013-84.pdf (accessed on 20 March 2020).
- Roggen, D.; Calatroni, A.; Rossi, M.; Holleczek, T.; Forster, K.; Troster, G.; Lukowicz, P.; Bannach, D.; Pirkl, G.; Ferscha, A.; et al. Collecting Complex Activity Datasets in Highly Rich Networked Sensor Environments. In Proceedings of the 2010 Seventh International Conference on Networked Sensing Systems (INSS), Kassel, Germany, 15–18 June 2010; pp. 233–240. [Google Scholar] [CrossRef] [Green Version]
- Reiss, A.; Stricker, D. Introducing a New Benchmarked Dataset for Activity Monitoring. In Proceedings of the 2012 16th International Symposium on Wearable Computers, Newcastle, UK, 18–22 June 2012; pp. 108–109. [Google Scholar] [CrossRef]
- Zhang, M.; Sawchuk, A.A. USC-HAD: A Daily Activity Dataset for Ubiquitous Activity Recognition Using Wearable Sensors. In Proceedings of the 2012 ACM Conference on Ubiquitous Computing, Pittsburgh, PA, USA, 5–8 September 2012; p. 1036. [Google Scholar] [CrossRef]
- Kwapisz, J.R.; Weiss, G.M.; Moore, S.A. WISDM Lab: Dataset. Available online: http://www.cis.fordham.edu/wisdm/dataset.php (accessed on 20 March 2020).
- Lockhart, J.W.; Weiss, G.M.; Xue, J.C.; Gallagher, S.T.; Grosner, A.B.; Pulickal, T.T. Design Considerations for the WISDM Smart Phone-Based Sensor Mining Architecture. In Proceedings of the Fifth International Workshop on Knowledge Discovery from Sensor Data, San Diego, CA, USA, 21 August 2011; pp. 25–33. [Google Scholar] [CrossRef] [Green Version]
- Barshan, B. UCI Machine Learning Repository: Daily and Sports Activities Data Set. Available online: http://archive.ics.uci.edu/ml/datasets/Daily+and+Sports+Activities (accessed on 20 March 2020).
- Barshan, B.; Yuksek, M.C. Recognizing Daily and Sports Activities in Two Open Source Machine Learning Environments Using Body-Worn Sensor Units. Comput. J. 2014, 57, 1649–1667. [Google Scholar] [CrossRef]
- Bachlin, M.; Plotnik, M.; Roggen, D.; Maidan, I.; Hausdorff, J.; Giladi, N.; Troster, G. Wearable Assistant for Parkinson’s Disease Patients With the Freezing of Gait Symptom. IEEE Trans. Inf. Technol. Biomed. 2009, 14, 436–446. [Google Scholar] [CrossRef]
- Shoaib, M.; Scholten, H.; Havinga, P. Towards Physical Activity Recognition Using Smartphone Sensors. In Proceedings of the 2013 IEEE 10th International Conference on Ubiquitous Intelligence and Computing and 2013 IEEE 10th International Conference on Autonomic and Trusted Computing, Vietri sul Mere, Italy, 18–21 December 2013; pp. 80–87. [Google Scholar] [CrossRef] [Green Version]
- Medrano, C.; Igual, R.; Plaza, I.; Castro, M. Fall ADL Data | EduQTech. Available online: http://eduqtech.unizar.es/en/fall-adl-data/ (accessed on 20 March 2020).
- Medrano, C.; Igual, R.; Plaza, I.; Castro, M. Detecting Falls as Novelties in Acceleration Patterns Acquired with Smartphones. PLoS ONE 2014, 9, e94811. [Google Scholar] [CrossRef] [PubMed] [Green Version]
- Ugulino, W.; Cardador, D.; Vega, K.; Velloso, E.; Milidiú, R.; Fuks, H. Wearable Computing: Accelerometers’ Data Classification of Body Postures and Movements. In Advances in Artificial Intelligence—SBIA 2012; Barros, L.N., Finger, M., Pozo, A.T., Gimenénez-Lugo, G.A., Castilho, M., Eds.; Springer: Berlin/Heidelberg, Germany, 2012; Volume 7589, pp. 52–61. [Google Scholar] [CrossRef] [Green Version]
- Casale, P.; Pujol, O.; Radeva, P. UCI Machine Learning Repository: Activity Recognition from Single Chest-Mounted Accelerometer Data Set. Available online: http://archive.ics.uci.edu/ml/datasets/Activity+Recognition+from+Single+Chest-Mounted+Accelerometer (accessed on 20 March 2020).
- Casale, P.; Pujol, O.; Radeva, P. Personalization and User Verification in Wearable Systems Using Biometric Walking Patterns. Pers. Ubiquitous Comput. 2012, 16, 563–580. [Google Scholar] [CrossRef]
- Banos, O.; Toth, M.A.; Amft, O. UCI Machine Learning Repository: REALDISP Activity Recognition Dataset Data Set. Available online: http://archive.ics.uci.edu/ml/datasets/REALDISP+Activity+Recognition+Dataset (accessed on 20 March 2020).
- Banos, O.; Toth, M.; Damas, M.; Pomares, H.; Rojas, I. Dealing with the Effects of Sensor Displacement in Wearable Activity Recognition. Sensors 2014, 14, 9995–10023. [Google Scholar] [CrossRef] [Green Version]
- Shoaib, M.; Bosch, S.; Incel, O.; Scholten, H.; Havinga, P. Fusion of Smartphone Motion Sensors for Physical Activity Recognition. Sensors 2014, 14, 10146–10176. [Google Scholar] [CrossRef]
- Casale, P. UCI Machine Learning Repository: User Identification From Walking Activity Data Set. Available online: http://archive.ics.uci.edu/ml/datasets/User+Identification+From+Walking+Activity (accessed on 20 March 2020).
- Shoaib, M.; Bosch, S.; Incel, O.; Scholten, H.; Havinga, P. Complex Human Activity Recognition Using Smartphone and Wrist-Worn Motion Sensors. Sensors 2016, 16, 426. [Google Scholar] [CrossRef]
- Stisen, A.; Blunck, H.; Bhattacharya, S.; Prentow, T.S.; Kjærgaard, M.B.; Dey, A.; Sonne, T.; Jensen, M.M. Smart Devices Are Different: Assessing and MitigatingMobile Sensing Heterogeneities for Activity Recognition. In Proceedings of the 13th ACM Conference on Embedded Networked Sensor Systems, Seoul, Korea, 1–4 November 2015; pp. 127–140. [Google Scholar] [CrossRef]
- Ahmed, D.B.; Frank, K.; Heirich, O. Recognition of Professional Activities with Displaceable Sensors. In Proceedings of the 2015 IEEE 82nd Vehicular Technology Conference (VTC2015-Fall), Boston, MA, USA, 6–9 September 2015; pp. 1–5. [Google Scholar] [CrossRef]
- Wojtusch, J.; von Stryk, O. HuMoD Database Human Motion Dynamics on Actuation Level. Available online: https://www.sim.informatik.tu-darmstadt.de/res/ds/humod/ (accessed on 20 March 2020).
- Wojtusch, J.; von Stryk, O. HuMoD—A Versatile and Open Database for the Investigation, Modeling and Simulation of Human Motion Dynamics on Actuation Level. In Proceedings of the 2015 IEEE-RAS 15th International Conference on Humanoid Robots (Humanoids), Seoul, Korea, 3–5 November 2015; pp. 74–79. [Google Scholar] [CrossRef]
- Vilarinho, T.; Farshchian, B.; Bajer, D.G.; Dahl, O.H.; Egge, I.; Hegdal, S.S.; Lones, A.; Slettevold, J.N.; Weggersen, S.M. A Combined Smartphone and Smartwatch Fall Detection System. In Proceedings of the 2015 IEEE International Conference on Computer and Information Technology; Ubiquitous Computing and Communications; Dependable, Autonomic and Secure Computing; Pervasive Intelligence and Computing, Liverpool, UK, 26–28 October 2015; pp. 1443–1448. [Google Scholar] [CrossRef]
- Zappi, P.; Lombriser, C.; Stiefmeier, T.; Farella, E.; Roggen, D.; Benini, L.; Tröster, G. Activity Recognition from On-Body Sensors: Accuracy-Power Trade-Off by Dynamic Sensor Selection. In Wireless Sensor Networks; Verdone, R., Ed.; Springer: Berlin/Heidelberg, Germany, 2008; Volume 4913, pp. 17–33. [Google Scholar] [CrossRef]
- Reyes-Ortiz, J.L.; Oneto, L.; Monsonís, A.S.; Parra, X. UCI Machine Learning Repository: Smartphone-Based Recognition of Human Activities and Postural Transitions Data Set. Available online: http://archive.ics.uci.edu/ml/datasets/Smartphone-Based+Recognition+of+Human+Activities+and+Postural+Transitions (accessed on 20 March 2020).
- Reyes-Ortiz, J.L.; Oneto, L.; Samà, A.; Parra, X.; Anguita, D. Transition-Aware Human Activity Recognition Using Smartphones. Neurocomputing 2016, 171, 754–767. [Google Scholar] [CrossRef] [Green Version]
- Chen, C.; Jafari, R.; Kehtarnavaz, N. UTD-MHAD: A Multimodal Dataset for Human Action Recognition Utilizing a Depth Camera and a Wearable Inertial Sensor. In Proceedings of the 2015 IEEE International Conference on Image Processing (ICIP), Quebec City, QC, Canada, 27–30 September 2015; pp. 168–172. [Google Scholar] [CrossRef]
- Palumbo, F.; Gallicchio, C.; Pucci, R.; Micheli, A. UCI Machine Learning Repository: Activity Recognition System Based on Multisensor Data Fusion (AReM) Data Set. Available online: http://archive.ics.uci.edu/ml/datasets/Activity+Recognition+system+based+on+Multisensor+data+fusion+%28AReM%29 (accessed on 20 March 2020).
- Palumbo, F.; Gallicchio, C.; Pucci, R.; Micheli, A. Human Activity Recognition Using Multisensor Data Fusion Based on Reservoir Computing. J. Ambient Intell. Smart Environ. 2016, 8, 87–107. [Google Scholar] [CrossRef]
- Sztyler, T.; Carmona, J.; Völker, J.; Stuckenschmidt, H. Self-Tracking Reloaded: Applying Process Mining to Personalized Health Care from Labeled Sensor Data. In Transactions on Petri Nets and Other Models of Concurrency XI; Koutny, M., Desel, J., Kleijn, J., Eds.; Springer: Berlin/Heidelberg, Germany, 2016; Volume 9930, pp. 160–180. [Google Scholar] [CrossRef] [Green Version]
- Vaizman, Y.; Ellis, K.; Lanckriet, G. Recognizing Detailed Human Context in the Wild from Smartphones and Smartwatches. IEEE Pervasive Comput. 2017, 16, 62–74. [Google Scholar] [CrossRef] [Green Version]
- Vögele, A.; Krüger, B. HDM12 Dance - Documentation on a Data Base of Tango Motion Capture. Available online: http://cg.cs.uni-bonn.de/en/publications/paper-details/voegele-2016-HDM12/ (accessed on 20 March 2020).
- Davis, K.A.; Owusu, E.B. UCI Machine Learning Repository: Smartphone Dataset for Human Activity Recognition (HAR) in Ambient Assisted Living (AAL) Data Set. Available online: http://archive.ics.uci.edu/ml/datasets/Smartphone+Dataset+for+Human+Activity+Recognition+%28HAR%29+in+Ambient+Assisted+Living+%28AAL%29 (accessed on 20 March 2020).
- Casilari, E.; A.Santoyo-Ramón, J. UMAFall: Fall Detection Dataset (Universidad de Malaga). Available online: http://figshare.com/articles/UMA_ADL_FALL_Dataset_zip/4214283 (accessed on 20 March 2020).
- Casilari, E.; Santoyo-Ramón, J.A.; Cano-García, J.M. UMAFall: A Multisensor Dataset for the Research on Automatic Fall Detection. Procedia Comput. Sci. 2017, 110, 32–39. [Google Scholar] [CrossRef]
- Faye, S.; Louveton, N.; Jafarnejad, S.; Kryvchenko, R.; Engel, T. An Open Dataset for Human Activity Analysis Using Smart Devices. Available online: https://hal.archives-ouvertes.fr/hal-01586802 (accessed on 20 March 2020).
- Kasebzadeh, P.; Hendeby, G.; Fritsche, C.; Gunnarsson, F.; Gustafsson, F. Parinaz Kasebzadeh: Research. Available online: http://users.isy.liu.se/rt/parka23/research.html (accessed on 20 March 2020).
- Zhang, W.; Liu, Z.; Zhou, L.; Leung, H.; Chan, A.B. Martial Arts, Dancing and Sports Dataset: A Challenging Stereo and Multi-View Dataset for 3D Human Pose Estimation. Image Vis. Comput. 2017, 61, 22–39. [Google Scholar] [CrossRef]
- Vakanski, A.; Jun, H.p.; Paul, D.; Baker, R. A Data Set of Human Body Movements for Physical Rehabilitation Exercises. Data 2018, 3, 2. [Google Scholar] [CrossRef] [Green Version]
- Sucerquia, A.; López, J.D.; Vargas-Bonilla, J.F. SisFall | SISTEMIC. Available online: http://sistemic.udea.edu.co/en/investigacion/proyectos/english-falls/ (accessed on 20 March 2020).
- Sucerquia, A.; López, J.; Vargas-Bonilla, J. SisFall: A Fall and Movement Dataset. Sensors 2017, 17, 198. [Google Scholar] [CrossRef]
- Trumble, M.; Gilbert, A.; Malleson, C.; Hilton, A.; Collomosse, J. Total Capture: 3D Human Pose Estimation Fusing Video and Inertial Sensors. Br. Mach. Vis. Assoc. 2017. [Google Scholar] [CrossRef] [Green Version]
- Micucci, D.; Mobilio, M.; Napoletano, P. UniMiB SHAR. Available online: http://www.sal.disco.unimib.it/technologies/unimib-shar/ (accessed on 20 March 2020).
- Micucci, D.; Mobilio, M.; Napoletano, P. UniMiB SHAR: A Dataset for Human Activity Recognition Using Acceleration Data from Smartphones. Appl. Sci. 2017, 7, 1101. [Google Scholar] [CrossRef] [Green Version]
- Martinez-Villaseñor, L.; Ponce, H.; Brieva, J.; Moya-Albor, E.; Núñez Martínez, J.; Peñafort Asturiano, C. HAR-UP. Available online: http://sites.google.com/up.edu.mx/har-up/ (accessed on 20 March 2020).
- Martínez-Villaseñor, L.; Ponce, H.; Brieva, J.; Moya-Albor, E.; Núñez Martínez, J.; Peñafort Asturiano, C. UP-Fall Detection Dataset: A Multimodal Approach. Sensors 2019, 19, 1988. [Google Scholar] [CrossRef] [Green Version]
- Ashry, S.; Elbasiony, R.; Gomaa, W. An LSTM-Based Descriptor for Human Activities Recognition Using IMU Sensors; SCITEPRESS—Science and Technology Publications: Setubal, Portugal, 2018; pp. 494–501. [Google Scholar] [CrossRef]
- Chereshnev, R.; Kertész-Farkas, A. Romanchereshnev/HuGaDB. Available online: http://github.com/romanchereshnev/HuGaDB (accessed on 20 March 2020).
- Chereshnev, R.; Kertész-Farkas, A. HuGaDB: Human Gait Database for Activity Recognition from Wearable Inertial Sensor Networks. In Analysis of Images, Social Networks and Texts; van der Aalst, W.M., Ignatov, D.I., Khachay, M., Kuznetsov, S.O., Lempitsky, V., Lomazova, I.A., Loukachevitch, N., Napoli, A., Panchenko, A., Pardalos, P.M., et al., Eds.; Springer: Cham, Switzerland, 2018; Volume 10716, pp. 131–141. [Google Scholar] [CrossRef] [Green Version]
- Chen, C.; Zhao, P.; Lu, C.X.; Wang, W.; Markham, A.; Trigoni, N. OxIOD: The Dataset for Deep Inertial Odometry. Available online: https://www.researchgate.net/publication/327789960_OxIOD_The_Dataset_for_Deep_Inertial_Odometry (accessed on 20 March 2020).
- Turan, A.; Barshan, B. UCI Machine Learning Repository: Simulated Falls and Daily Living Activities Data Set Data Set. Available online: http://archive.ics.uci.edu/ml/datasets/Simulated+Falls+and+Daily+Living+Activities+Data+Set (accessed on 20 March 2020).
- Özdemir, A.; Barshan, B. Detecting Falls with Wearable Sensors Using Machine Learning Techniques. Sensors 2014, 14, 10691–10708. [Google Scholar] [CrossRef]
- Tits, M.; Laraba, S.; Caulier, E.; Tilmanne, J.; Dutoit, T. UMONS-TAICHI. Available online: http://github.com/numediart/UMONS-TAICHI (accessed on 20 March 2020).
- Tits, M.; Laraba, S.; Caulier, E.; Tilmanne, J.; Dutoit, T. UMONS-TAICHI: A Multimodal Motion Capture Dataset of Expertise in Taijiquan Gestures. Data Brief 2018, 19, 1214–1221. [Google Scholar] [CrossRef] [PubMed]
- Reiss, A.; Indlekofer, I.; Schmidt, P.; Van Laerhoven, K. Deep PPG: Large-Scale Heart Rate Estimation with Convolutional Neural Networks. Sensors 2019, 19, 3079. [Google Scholar] [CrossRef] [PubMed] [Green Version]
- Niemann, F.; Reining, C.; Moya Rueda, F.; Nair, N.R.; Steffens, J.A.; Fink, G.A.; ten Hompel, M. Logistic Activity Recognition Challenge (LARa)—A Motion Capture and Inertial Measurement Dataset. 2020. Available online: https://0-doi-org.brum.beds.ac.uk/10.5281/zenodo.3862782 (accessed on 1 June 2020).


| ID | Sex | Age | Weight | Height | Handedness | OMoCap | IMU-set | Scenario 1 | Scenario 2 | Scenario 3 | ||
|---|---|---|---|---|---|---|---|---|---|---|---|---|
| [F/M] | [year] | [kg] | [cm] | [L/R] | [1] | [2] | [3] | [Number of Two-Minute Recordings] | ||||
| S01 | M | 28 | 78 | 175 | L | x | x | 29 | 0 | 0 | ||
| S02 | F | 24 | 62 | 163 | L | x | x | 30 | 0 | 0 | ||
| S03 | M | 59 | 71 | 171 | R | x | x | 27 | 0 | 0 | ||
| S04 | F | 53 | 64 | 165 | L | x | x | 29 | 0 | 0 | ||
| S05 | M | 28 | 79 | 185 | R | x | x | 26 | 0 | 0 | ||
| S06 | F | 22 | 52 | 163 | R | x | x | 30 | 0 | 0 | ||
| S07 | M | 23 | 65 | 177 | R | x | x | x | 2 | 13 | 14 | |
| S08 | F | 51 | 68 | 168 | R | x | x | x | 2 | 13 | 14 | |
| S09 | M | 35 | 100 | 172 | R | x | x | x | 2 | 14 | 13 | |
| S10 | M | 49 | 97 | 181 | R | x | x | x | 2 | 13 | 12 | |
| S11 | F | 47 | 66 | 175 | R | x | x | x | 2 | 12 | 0 | |
| S12 | F | 23 | 48 | 163 | R | x | x | x | 0 | 6 | 14 | |
| S13 | F | 25 | 54 | 163 | R | x | x | x | 2 | 14 | 14 | |
| S14 | M | 54 | 90 | 177 | R | x | x | x | 2 | 14 | 14 | |
| Min. | 22 | 48 | 163 | |||||||||
| Avg. | 37 | 71 | 171 | |||||||||
| Max. | 59 | 100 | 185 | |||||||||
| Sum | 185 | 99 | 95 | |||||||||
| Activity Class | Description | |
|---|---|---|
| Standing | The subject is standing still on the ground or performs smaller steps. The subject can hold something in hands or stand hands-free. | |
| Walking | The subject performs a gait cycle [35] (pp. 3–7) while carrying something or the subject is walking hands-free. The only exception is made in regards to a cart (see below). | |
| Cart | The subject is walking (gait cycle) with the cart to a new position. This class does not include the handling of items on the cart like putting boxes or retrieving items. Likewise, the handling of the cart, e.g., turning it to better reach its handles, is not included. | |
| Handling (upwards) | At least one hand reaches the height of the shoulder height (80% of a person’s total height [36] (p. 146)) or is lifted beyond that during the handling activity. | |
| Handling (centred) | Handling is possible without bending over, kneeling, or lifting arms to shoulder joint height. | |
| Handling (downwards) | The hands are below the height of the knees (lower than 30% of a person’s total height [36] (p. 146)). The subject’s spine is horizontal or they are kneeling. | |
| Synchronization | Waving Motion where both hands are above the subject’s head by the beginning of each recording. | |
| None | Excerpts that shall not be taken into account, because the class is not recognisable. Reasons are errors or gaps in the recording or a sudden cut by the end of a recording unit. | |
| Attribute | Description | |
|---|---|---|
| I - Legs | ||
| A | Gait Cycle | The subject performs a gait cycle [35] (pp. 3–7). |
| B | Step | A single step where the feet leave the ground without a foot swing [35] (pp. 3–7). This can also refer to a step forward, followed by a step backwards using the same foot. |
| C | Standing Still | Both feet stay on the ground. |
| II - Upper Body | ||
| A | Upwards | At least one hand reaches the height of the shoulder height (80% of a person’s total height [36] (p. 146)) or is lifted beyond that during the handling activity. |
| B | Centred | Handling is possible without bending over, kneeling or lifting arms to shoulder joint height. |
| C | Downwards | The hands are below the height of the knees (lower than 30% of a person’s total height [36] (p. 146)). The subject’s spine is horizontal or they are kneeling. |
| D | No Intentional Motion | Default value when no intentional motion is performed, e.g., when standing without doing anything, carrying a box or walking with a cart. This is because there is no intentional motion when performing these activities, only a steady stance. |
| E | Torso Rotation | Rotation in the transverse plane [37] (pp. 2–3). Either a rotating motion, e.g., when taking something from the cart and turning towards the shelf or a fixed position when handling something while the torso is rotated. |
| III - Handedness | ||
| A | Right Hand | The subject handles or holds something using the right hand. |
| B | Left Hand | The subject handles or holds something using the left hand. |
| C | No Hand | Hands are not used, neither for holding nor for handling something. |
| IV - Item Pose | ||
| A | Bulky Unit | Items that the subject cannot put the hands around, e.g., boxes. |
| B | Handy Unit | Items that can be carried with a single hand or that the subjects can put their hands around, e.g., small articles, plastic bags. |
| C | Utility Auxiliary | Use of equipment, e.g., scissors, knives, bubble wrap, stamps, labels, scanners, packaging tape dispenser, adhesives etc. |
| D | Cart | Either bringing the the cart into proper position before taking it to a different location (Handling) or walking with the cart to a new location (No Intentional Motion). |
| E | Computer | Using mouse and keyboard. |
| F | No Item | Activities that do not include any item, e.g., when the subject fumbles for something when on the search for a specific item. |
| V - None | ||
| A | None | Equivalent to the None class. |
| Attribute Representation | ||||||||||||||||||||
|---|---|---|---|---|---|---|---|---|---|---|---|---|---|---|---|---|---|---|---|---|
| I Legs | II Upper Body | III Hand. | IV Item Pose | |||||||||||||||||
| Gait Cycle | Step | Standing Still | Upwards | Centered | Downwards | No Intentional Motion | Torso Rotation | Right Hand | Left Hand | No Hand | Bulky Unit | Handy Unit | Utility/Auxiliary | Cart | Computer | No Item | ||||
| Process Step | Act. | Class | A | B | C | A | B | C | D | E | A | B | C | A | B | C | D | E | F | |
| 1 | Bring cart to | 1 | Standing | 0 | 0 | 1 | 0 | 0 | 0 | 1 | 0 | 0 | 0 | 1 | 0 | 0 | 0 | 0 | 0 | 1 |
| retrieval | 2 | Walking | 1 | 0 | 0 | 0 | 0 | 0 | 1 | 0 | 0 | 0 | 1 | 0 | 0 | 0 | 0 | 0 | 1 | |
| location | 3 | Hand. (cen.) | 0 | 1 | 0 | 0 | 1 | 0 | 0 | 0 | 1 | 1 | 0 | 0 | 0 | 0 | 1 | 0 | 0 | |
| 4 | Cart | 1 | 0 | 0 | 0 | 0 | 0 | 1 | 0 | 1 | 0 | 0 | 0 | 0 | 0 | 1 | 0 | 0 | ||
| 2 | Scan Barcode | 5 | Standing | 0 | 0 | 1 | 0 | 0 | 0 | 1 | 0 | 1 | 0 | 0 | 0 | 0 | 0 | 1 | 0 | 0 |
| 6 | Hand. (cen.) | 0 | 1 | 0 | 0 | 1 | 0 | 0 | 0 | 0 | 1 | 0 | 0 | 1 | 0 | 0 | 0 | 0 | ||
| 7 | Hand. (cen.) | 0 | 0 | 1 | 0 | 1 | 0 | 0 | 0 | 0 | 1 | 0 | 0 | 1 | 0 | 0 | 0 | 0 | ||
| 8 | Hand. (upw.) | 0 | 0 | 1 | 1 | 0 | 0 | 0 | 1 | 0 | 1 | 0 | 0 | 0 | 1 | 0 | 0 | 0 | ||
| 9 | Hand. (cen.) | 0 | 1 | 0 | 0 | 1 | 0 | 0 | 0 | 0 | 1 | 0 | 0 | 1 | 0 | 0 | 0 | 0 | ||
| 3 | Retrieve item | 10 | Hand. (upw.) | 0 | 1 | 0 | 1 | 0 | 0 | 0 | 0 | 1 | 0 | 0 | 0 | 1 | 0 | 0 | 0 | 0 |
| and put in | 11 | Hand. (upw.) | 0 | 0 | 1 | 1 | 0 | 0 | 0 | 0 | 1 | 0 | 0 | 0 | 1 | 0 | 0 | 0 | 0 | |
| box | 12 | Hand. (upw.) | 0 | 1 | 0 | 1 | 0 | 0 | 0 | 0 | 1 | 0 | 0 | 0 | 1 | 0 | 0 | 0 | 0 | |
| 13 | Hand. (down.) | 0 | 1 | 0 | 0 | 0 | 1 | 0 | 0 | 1 | 1 | 0 | 0 | 1 | 0 | 0 | 0 | 0 | ||
| 14 | Hand. (down.) | 0 | 0 | 1 | 0 | 0 | 1 | 0 | 0 | 1 | 1 | 0 | 0 | 1 | 0 | 0 | 0 | 0 | ||
| 4 | Confirm pick | 15 | Hand. (down) | 0 | 0 | 1 | 0 | 0 | 1 | 0 | 0 | 1 | 0 | 0 | 0 | 0 | 1 | 0 | 0 | 0 |
| ID | Total Time | No of Rec. | Time per Rec. |
|---|---|---|---|
| [hh:mm:ss] | [hh:mm:ss] | ||
| A01 | 55:12:19 | 52 | 01:14:02 |
| A02 | 73:22:04 | 45 | 01:55:21 |
| A03 | 56:30:39 | 54 | 01:14:13 |
| A04 | 34:39:08 | 26 | 01:28:00 |
| A05 | 84:18:37 | 30 | 02:48:37 |
| A06 | 39:24:16 | 64 | 00:39:46 |
| A07 | 28:40:57 | 25 | 01:10:35 |
| A08 | 32:56:40 | 27 | 01:15:24 |
| A09 | 33:28:45 | 27 | 01:14:24 |
| A10 | 10:14:21 | 12 | 00:51:12 |
| A11 | 23:03:16 | 14 | 01:38:48 |
| A12 | 02:16:00 | 3 | 01:45:03 |
| Min. | 00:39:46 | ||
| Max. | 02:48:37 | ||
| Sum | 474:07:02 | 379 |
| ID | Total Time | No of Rec. | Time per Rec. |
|---|---|---|---|
| [hh:mm:ss] | [hh:mm:ss] | ||
| Re01 | 13:44:00 | 88 | 00:09:22 |
| Re02 | 39:18:00 | 97 | 00:24:19 |
| Re03 | 28:37:00 | 91 | 00:18:52 |
| Re04 | 61:19:00 | 103 | 00:35:43 |
| Min. | 00:09:22 | ||
| Max. | 00:35:43 | ||
| Sum | 142:58:00 | 379 |
| Stand. | Walk. | Cart | Handling (upwards) | Handling (centred) | Handling (downwards) | Synchron. | None | |
|---|---|---|---|---|---|---|---|---|
| Samples | 974,611 | 994,880 | 1,185,788 | 754,807 | 3,901,899 | 673,655 | 158,655 | 403,737 |
| Avg. Time/Occ. [s] | 1.71 | 3.72 | 6.46 | 2.72 | 4.39 | 2.74 | 2.16 | 7.10 |
| Proportion [%] | 10.77 | 11.00 | 13.11 | 8.34 | 43.12 | 7.45 | 1.75 | 4.46 |
| [M] number of Attr. representations | 28 | 7 | 3 | 45 | 72 | 47 | 1 | 1 |
| Folder | Folder Size [MiB] | File Format | Recording Rate |
|---|---|---|---|
| OMoCap data | 33,774 | csv | 200 fps |
| IMU data - MbientLab | 1355.77 | csv | 100 Hz |
| RGB videos | 17,974.82 | mp4 | 30 fps |
| recording protocol | 2.58 | - | |
| annotation and revision tool | 2899.99 | py | - |
| class_network | 1449.55 | pt | - |
| attrib_network | 1449.55 | pt | - |
| Output | Metric | Performance | ||||||
|---|---|---|---|---|---|---|---|---|
| Stand. | Walk. | Cart | Hand. (up.) | Hand. (cent.) | Hand. (down.) | Sync. | ||
| Softmax | Recall[%] | 3.11 | 71.96 | 71.34 | 61.39 | 87.40 | 65.30 | 0.0 |
| Precision[%] | 73.00 | 45.29 | 81.35 | 57.10 | 70.85 | 80.72 | 0.0 | |
| Attributes | Recall[%] | 55.86. | 54.31. | 76.12 | 69.16 | 80.99 | 74.36 | 69.84 |
| Precision[%] | 24.22 | 60.59 | 92.13 | 79.08 | 82.94 | 74.63 | 89.31 | |
| Metric | Perform. | |
|---|---|---|
| Softmax | Attributes | |
| Acc[%] | 68.88 | 75.15 |
| wF1[%] | 64.43 | 73.62 |
| Activities | Confusion Matrix | ||||||
|---|---|---|---|---|---|---|---|
| Stand. | Walk. | Cart | Hand. (up.) | Hand. (cent.) | Hand. (down.) | Sync. | |
| Stand. | 311 | 1807 | 211 | 134 | 7446 | 86 | 0 |
| Walk. | 42 | 3776 | 461 | 35 | 918 | 15 | 0 |
| Cart | 1 | 928 | 9005 | 4 | 2684 | 1 | 0 |
| Hand. (up.) | 0 | 92 | 152 | 4188 | 2389 | 1 | 0 |
| Hand. (cent.) | 72 | 1681 | 1233 | 1717 | 36,587 | 572 | 0 |
| Hand. (down.) | 0 | 51 | 2 | 12 | 1437 | 2826 | 0 |
| Sync. | 0 | 2 | 6 | 1245 | 178 | 0 | 0 |
| Activities | Confusion Matrix | ||||||
|---|---|---|---|---|---|---|---|
| Stand. | Walk. | Cart | Hand. (up.) | Hand. (cent.) | Hand. (down.) | Sync. | |
| Stand. | 2421 | 1492 | 506 | 268 | 4668 | 219 | 421 |
| Walk. | 633 | 3179 | 691 | 47 | 649 | 41 | 7 |
| Cart | 44 | 298 | 11,630 | 20 | 629 | 2 | 0 |
| Hand. (up.) | 71 | 44 | 32 | 5395 | 1218 | 20 | 42 |
| Hand. (cent.) | 1085 | 825 | 2403 | 1919 | 34,719 | 832 | 79 |
| Hand. (down.) | 73 | 15 | 16 | 9 | 982 | 3230 | 3 |
| Sync. | 7 | 0 | 0 | 143 | 3 | 0 | 1278 |
| Metric | Attributes | ||||||||||||||||||
|---|---|---|---|---|---|---|---|---|---|---|---|---|---|---|---|---|---|---|---|
| Accuracy | 89.3 | 76.9 | 84.5 | 93.9 | 81.7 | 96.4 | 82.5 | 96.9 | 92.0 | 79.1 | 90.3 | 76.2 | 71.7 | 85.2 | 91.3 | 98.3 | 90.2 | 100 | 100 |
| Precision | 79.0 | 82.8 | 83.4 | 80.4 | 85.6 | 76.7 | 86.3 | 0.0 | 92.8 | 81.6 | 91.9 | 48.7 | 60.4 | 74.3 | 88.8 | 98.8 | 95.4 | 0.0 | 0.0 |
| Recall | 82.1 | 70.3 | 92.0 | 73.1 | 83.9 | 68.7 | 72.0 | 0.0 | 98.5 | 92.4 | 36.2 | 37.2 | 63.0 | 26.8 | 74.2 | 49.5 | 41.0 | 0.0 | 0.0 |
© 2020 by the authors. Licensee MDPI, Basel, Switzerland. This article is an open access article distributed under the terms and conditions of the Creative Commons Attribution (CC BY) license (http://creativecommons.org/licenses/by/4.0/).
Share and Cite
Niemann, F.; Reining, C.; Moya Rueda, F.; Nair, N.R.; Steffens, J.A.; Fink, G.A.; ten Hompel, M. LARa: Creating a Dataset for Human Activity Recognition in Logistics Using Semantic Attributes. Sensors 2020, 20, 4083. https://0-doi-org.brum.beds.ac.uk/10.3390/s20154083
Niemann F, Reining C, Moya Rueda F, Nair NR, Steffens JA, Fink GA, ten Hompel M. LARa: Creating a Dataset for Human Activity Recognition in Logistics Using Semantic Attributes. Sensors. 2020; 20(15):4083. https://0-doi-org.brum.beds.ac.uk/10.3390/s20154083
Chicago/Turabian StyleNiemann, Friedrich, Christopher Reining, Fernando Moya Rueda, Nilah Ravi Nair, Janine Anika Steffens, Gernot A. Fink, and Michael ten Hompel. 2020. "LARa: Creating a Dataset for Human Activity Recognition in Logistics Using Semantic Attributes" Sensors 20, no. 15: 4083. https://0-doi-org.brum.beds.ac.uk/10.3390/s20154083