Open-Ended Coaxial Probe Measurements of Complex Dielectric Permittivity in Diesel-Contaminated Soil during Bioremediation

 ,
,  ,
, 
 ,
,  and
and
Abstract
:1. Introduction
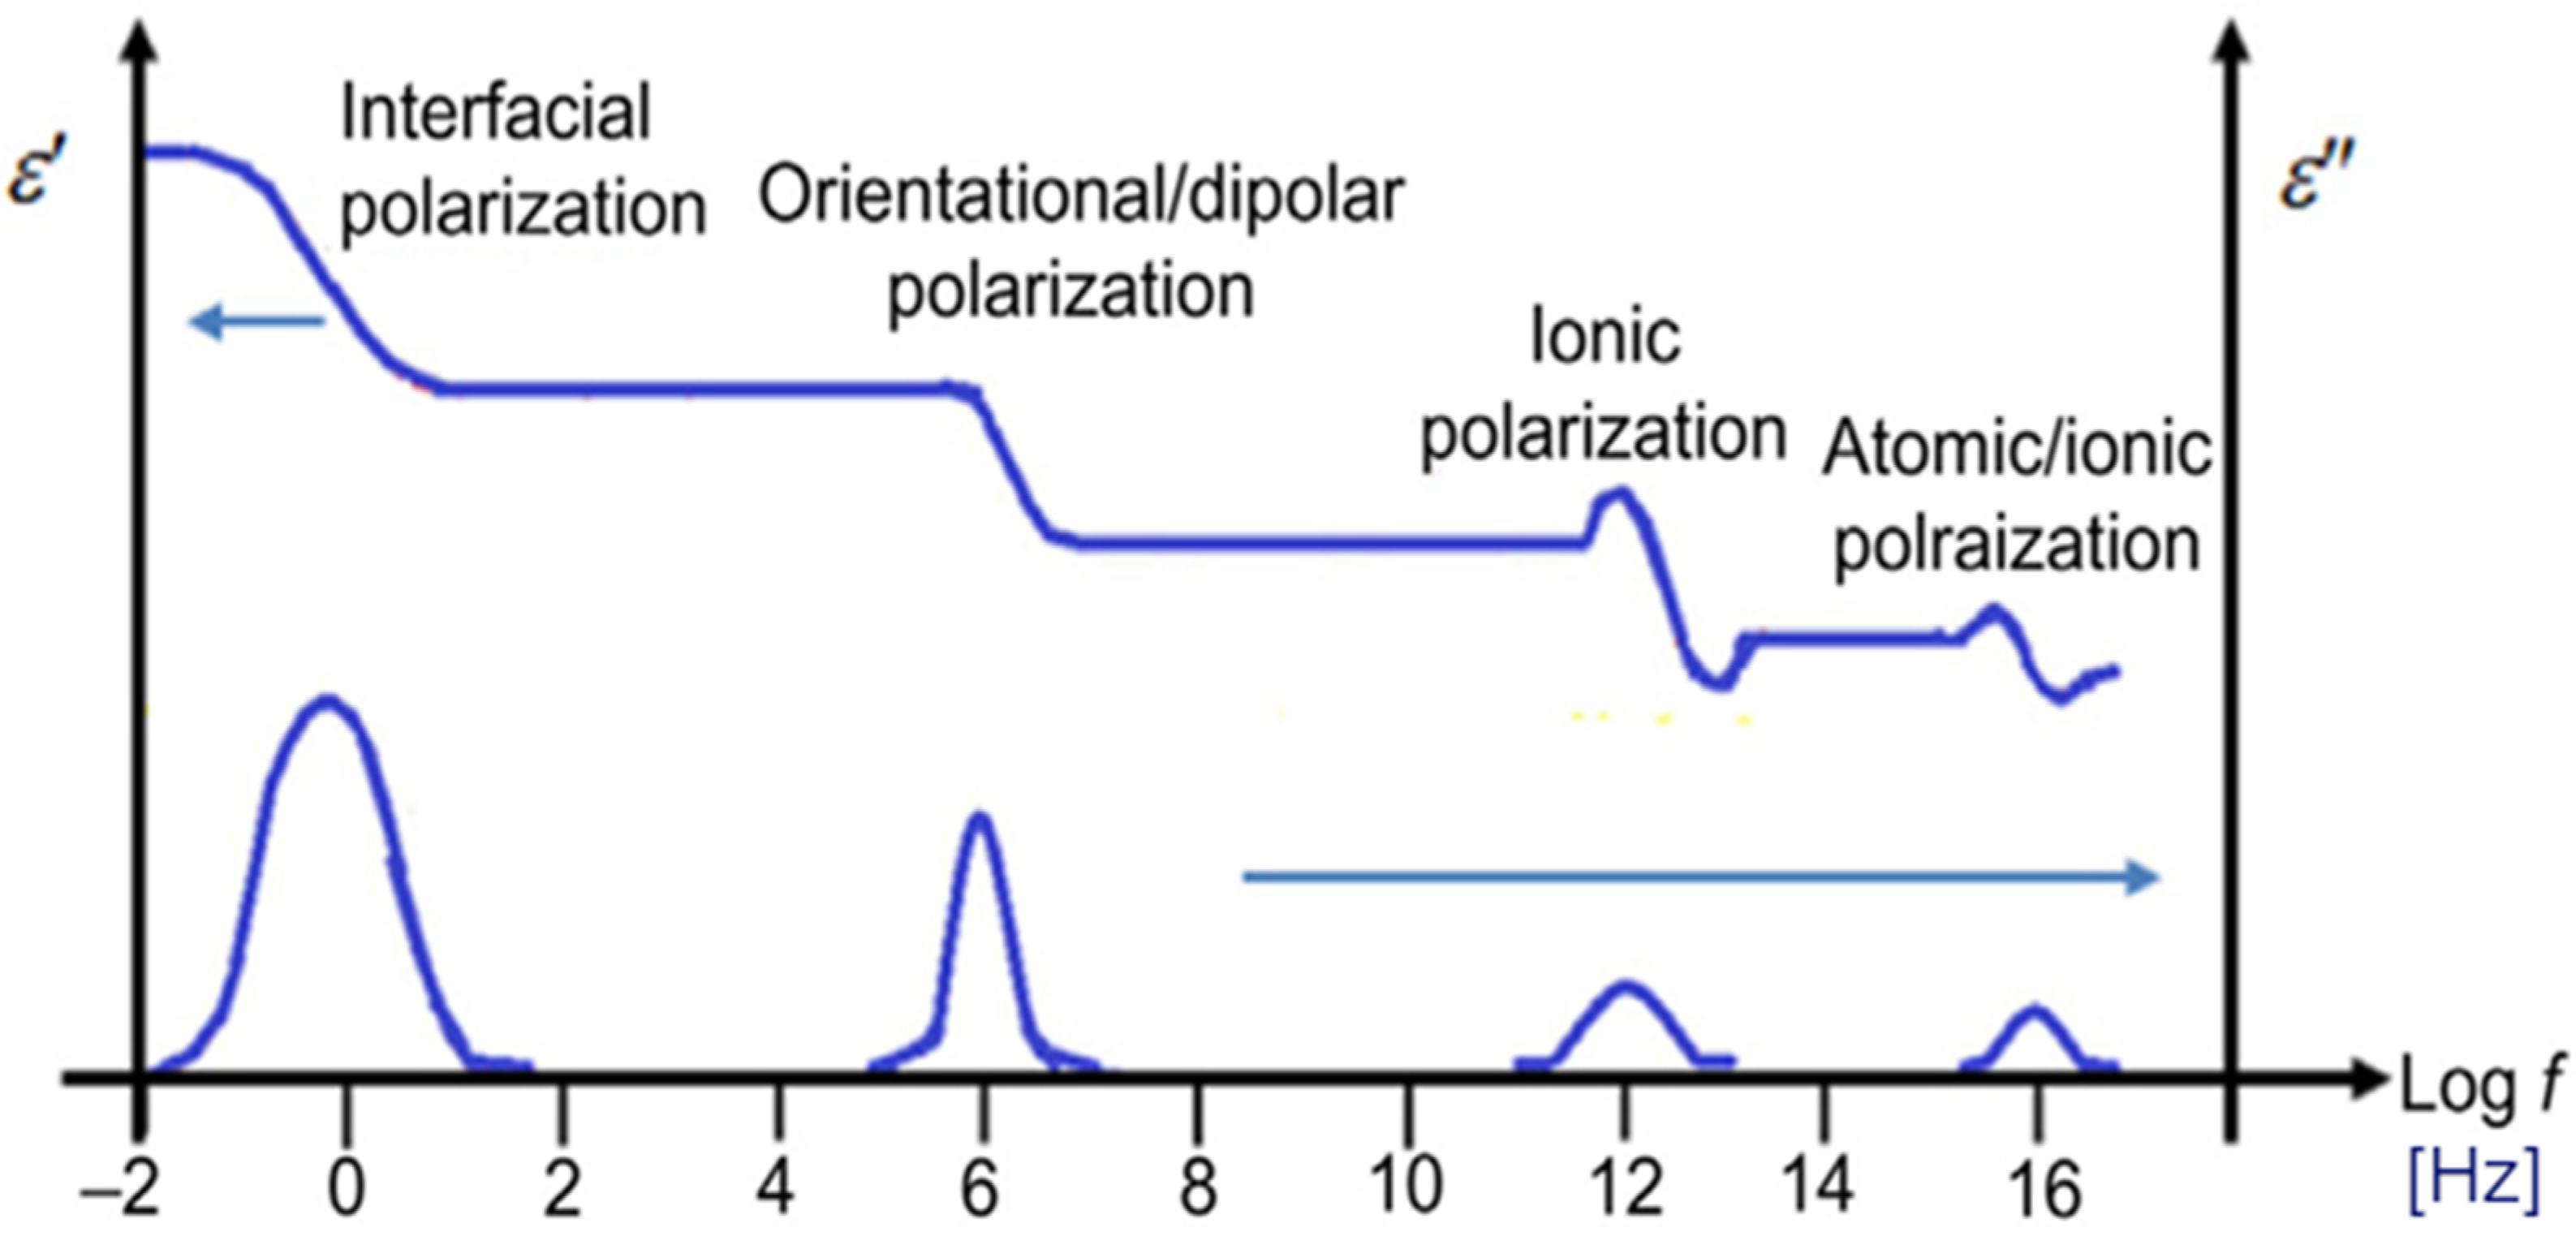
2. Theoretical Background
3. Materials and Methods
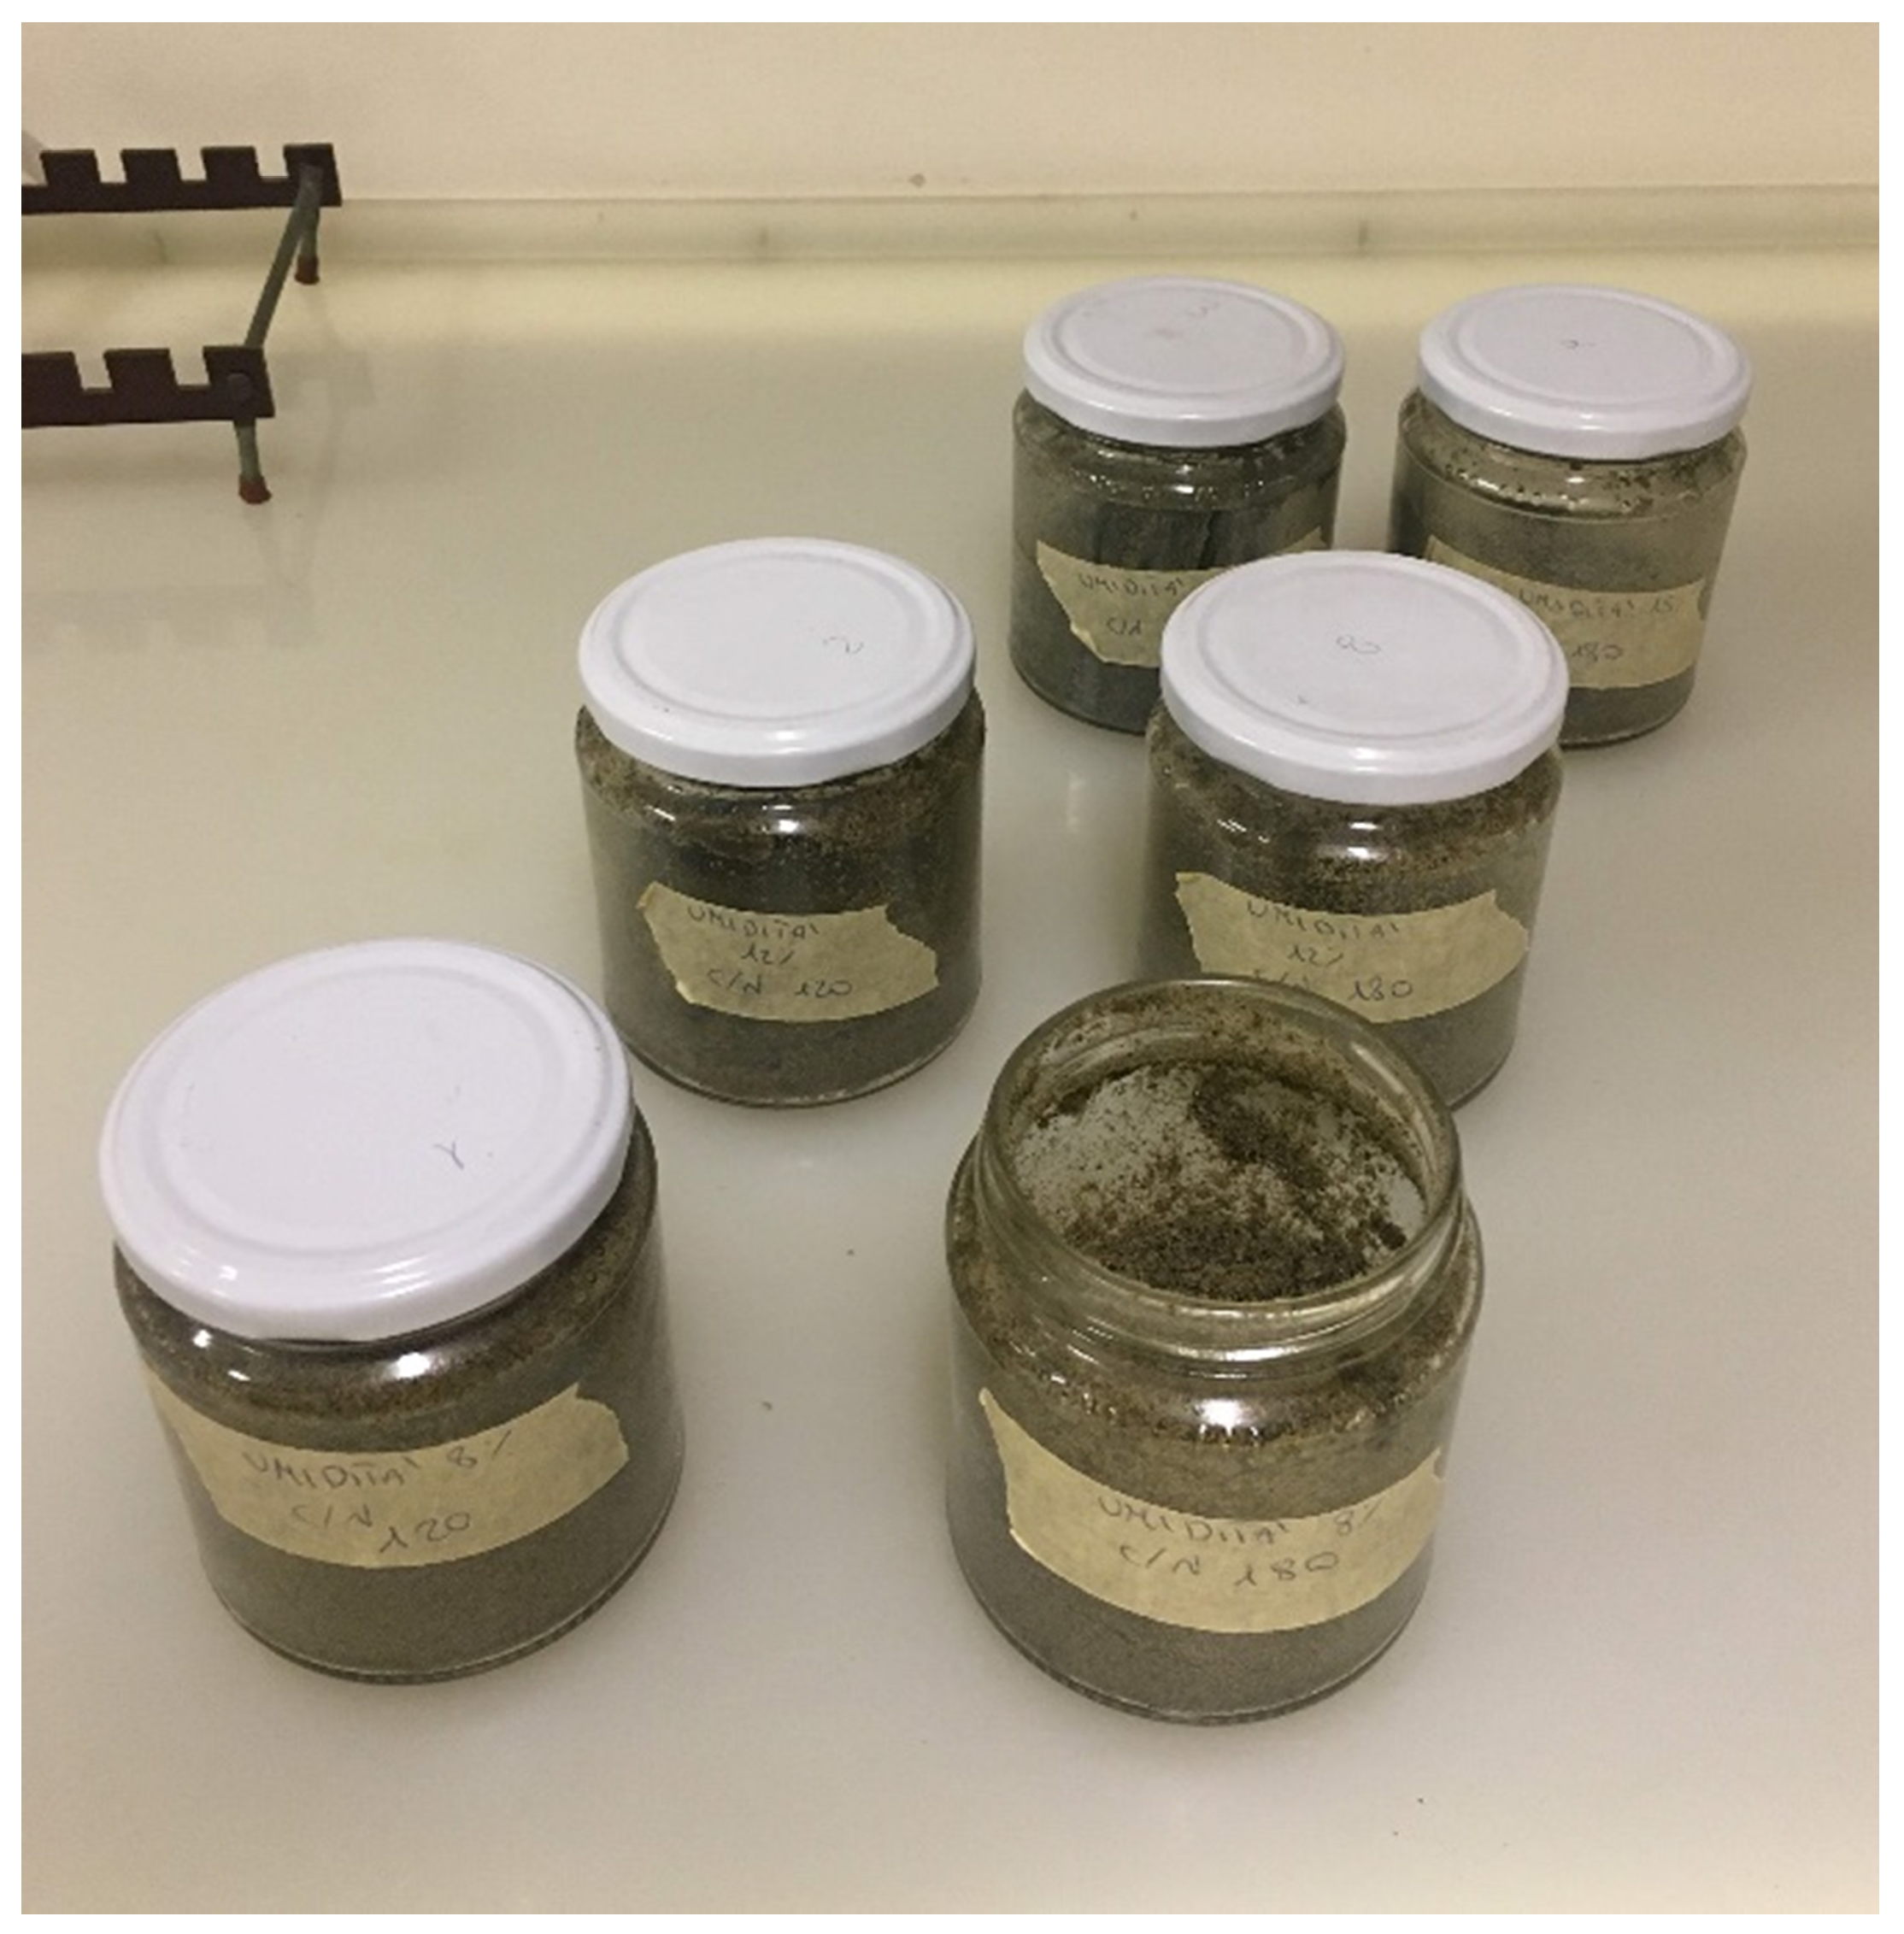
3.1. Set-Up of Microcosms
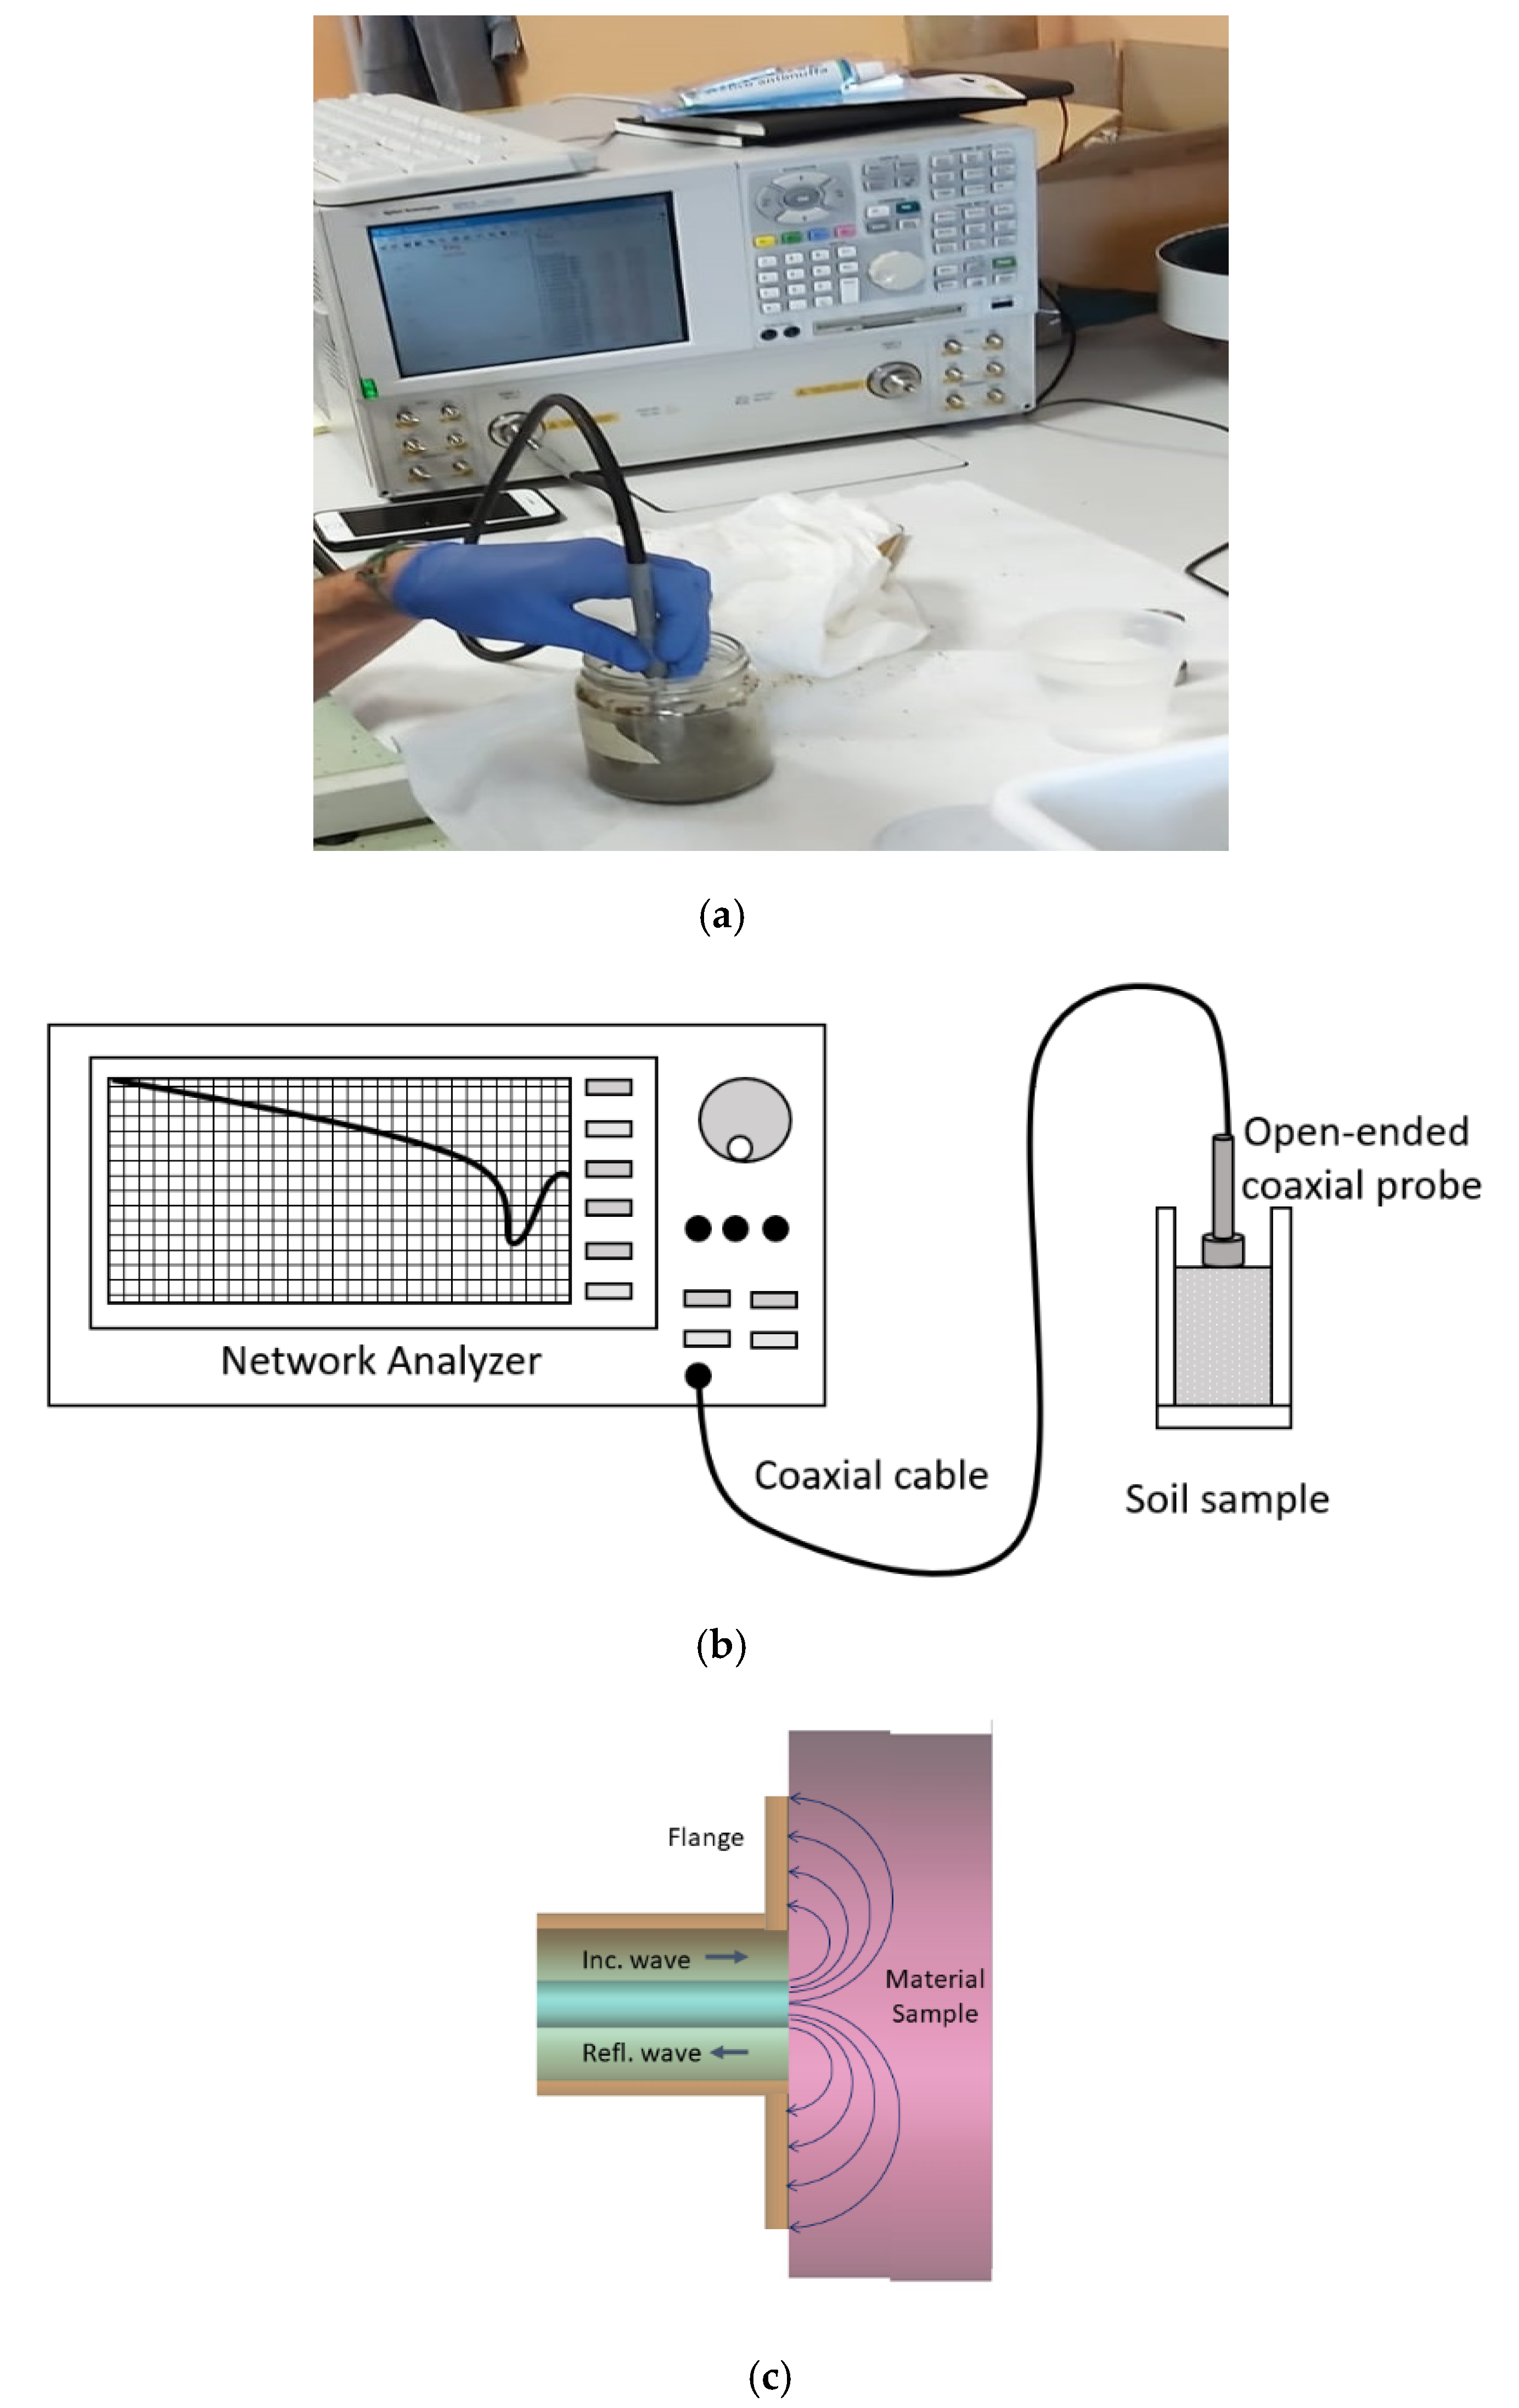
3.2. Open-Ended Coaxial Probe
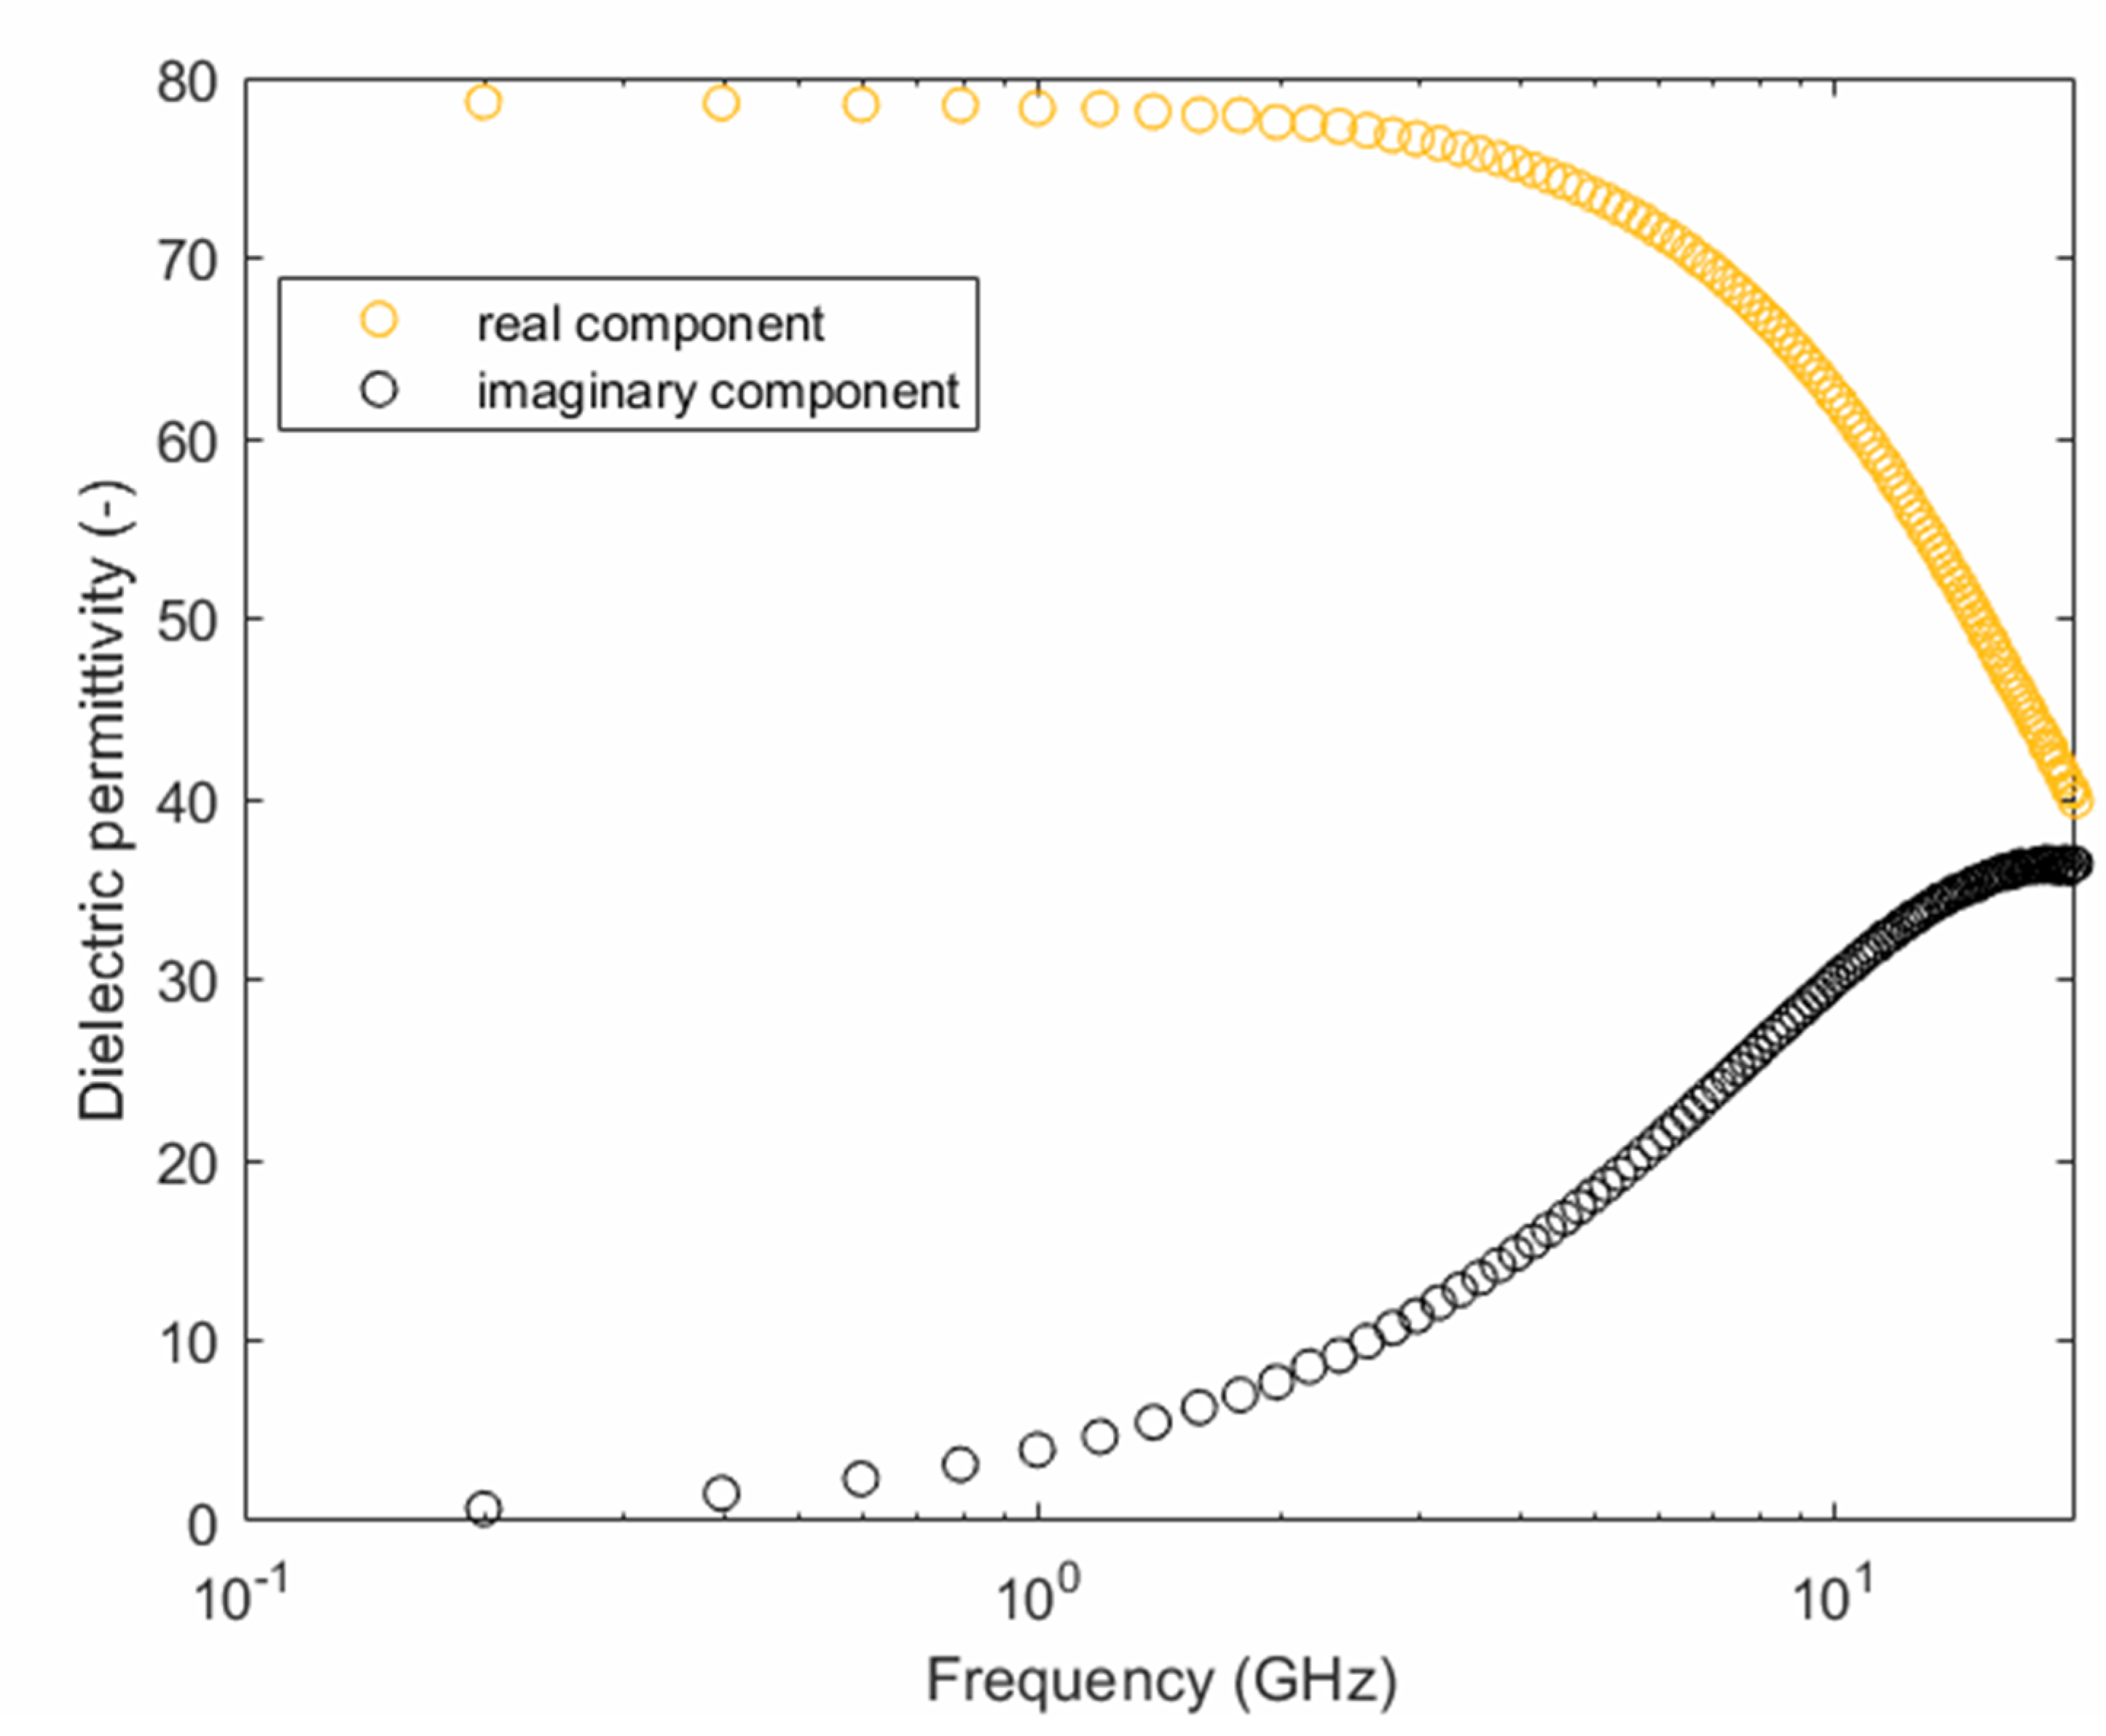
4. Results
5. Discussion
5.1. Preliminary Calibration and Accuracy
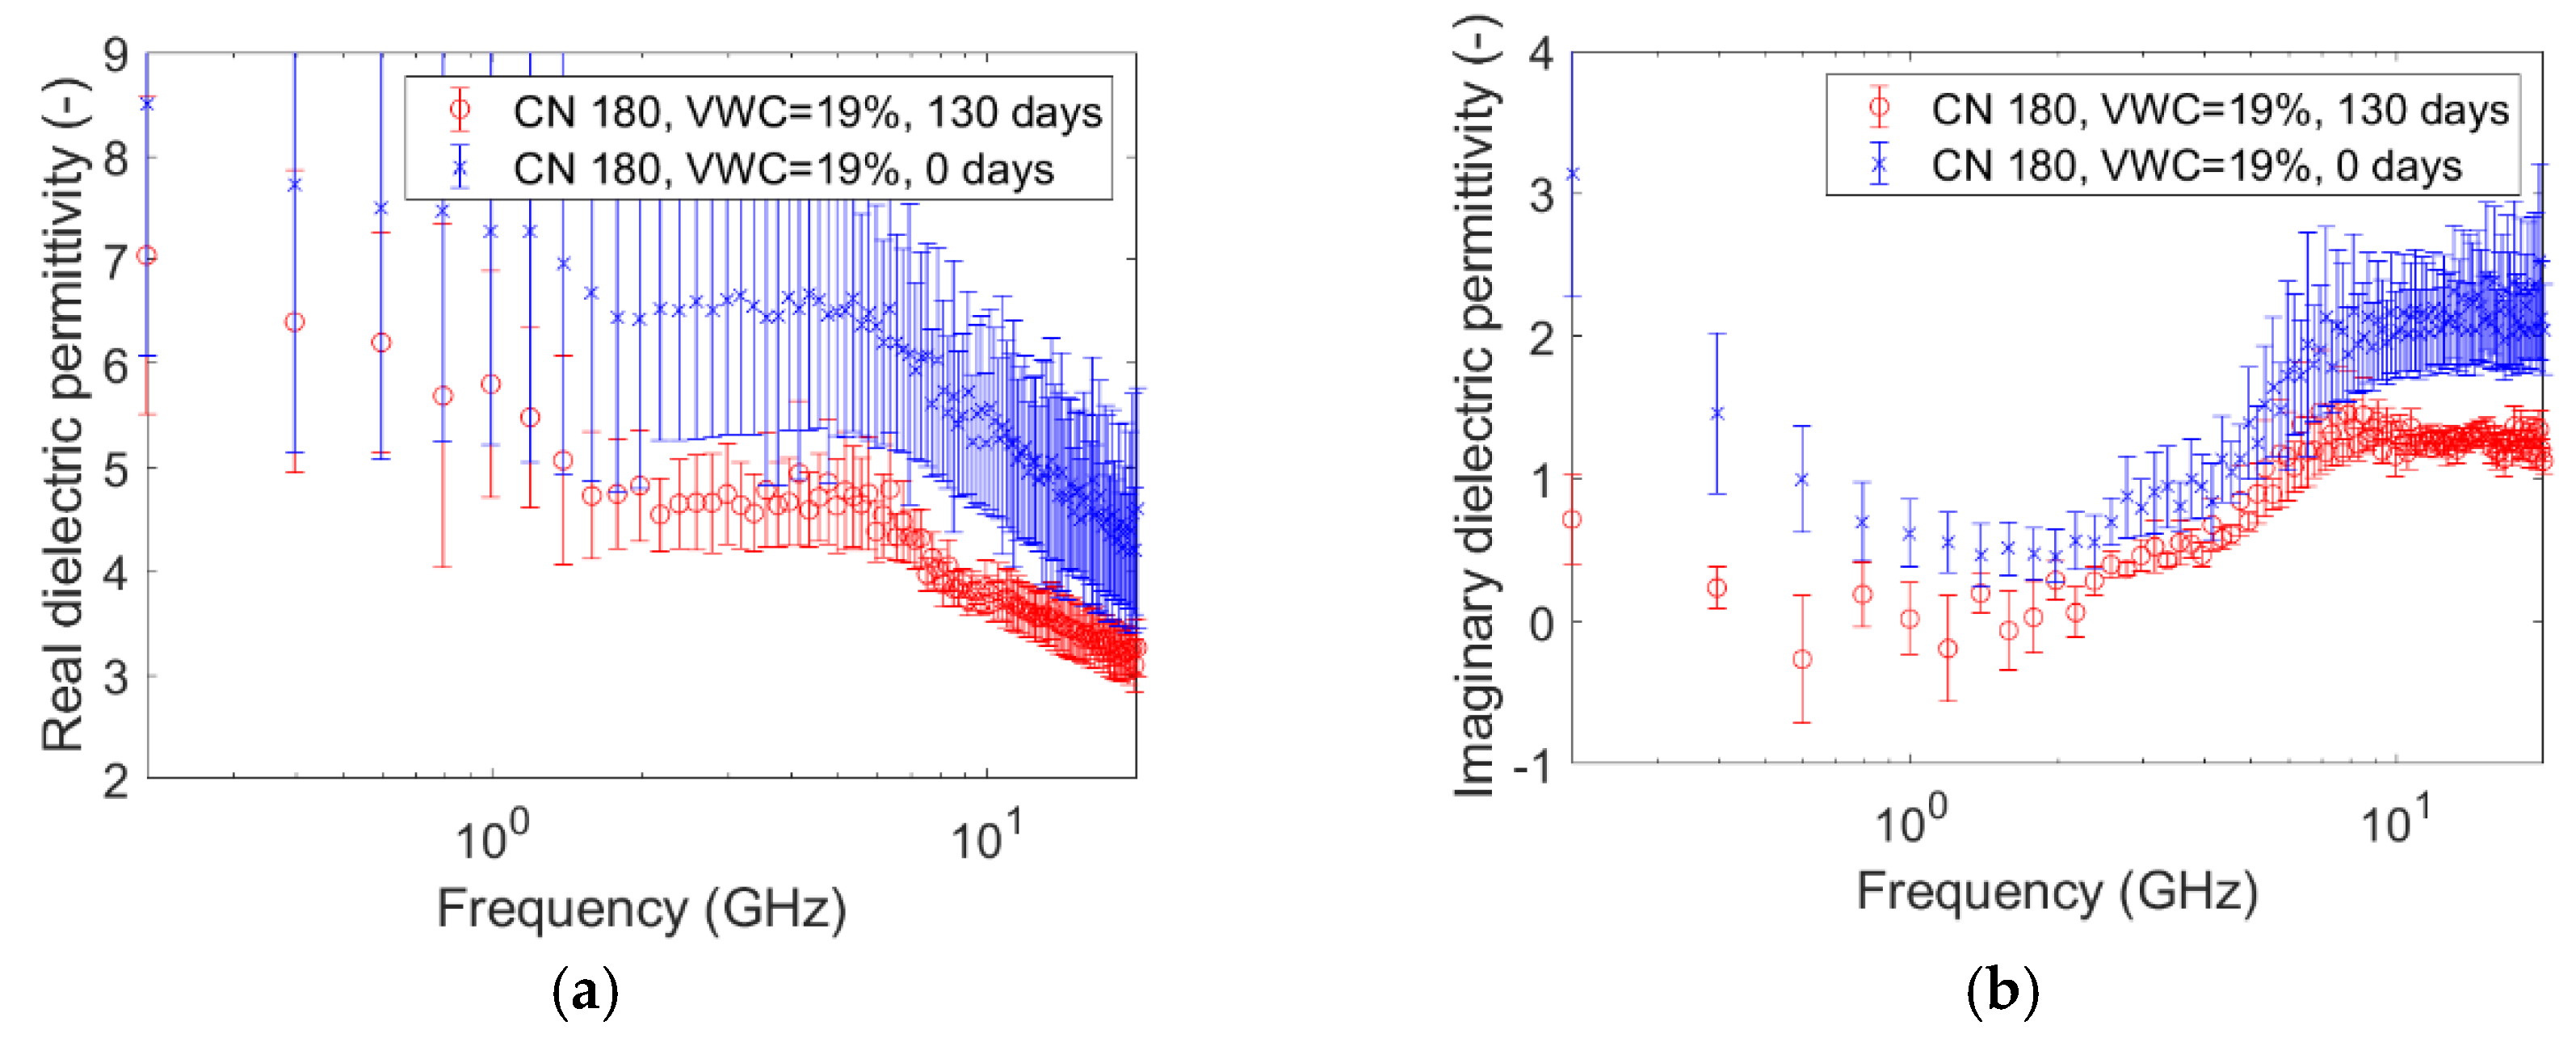
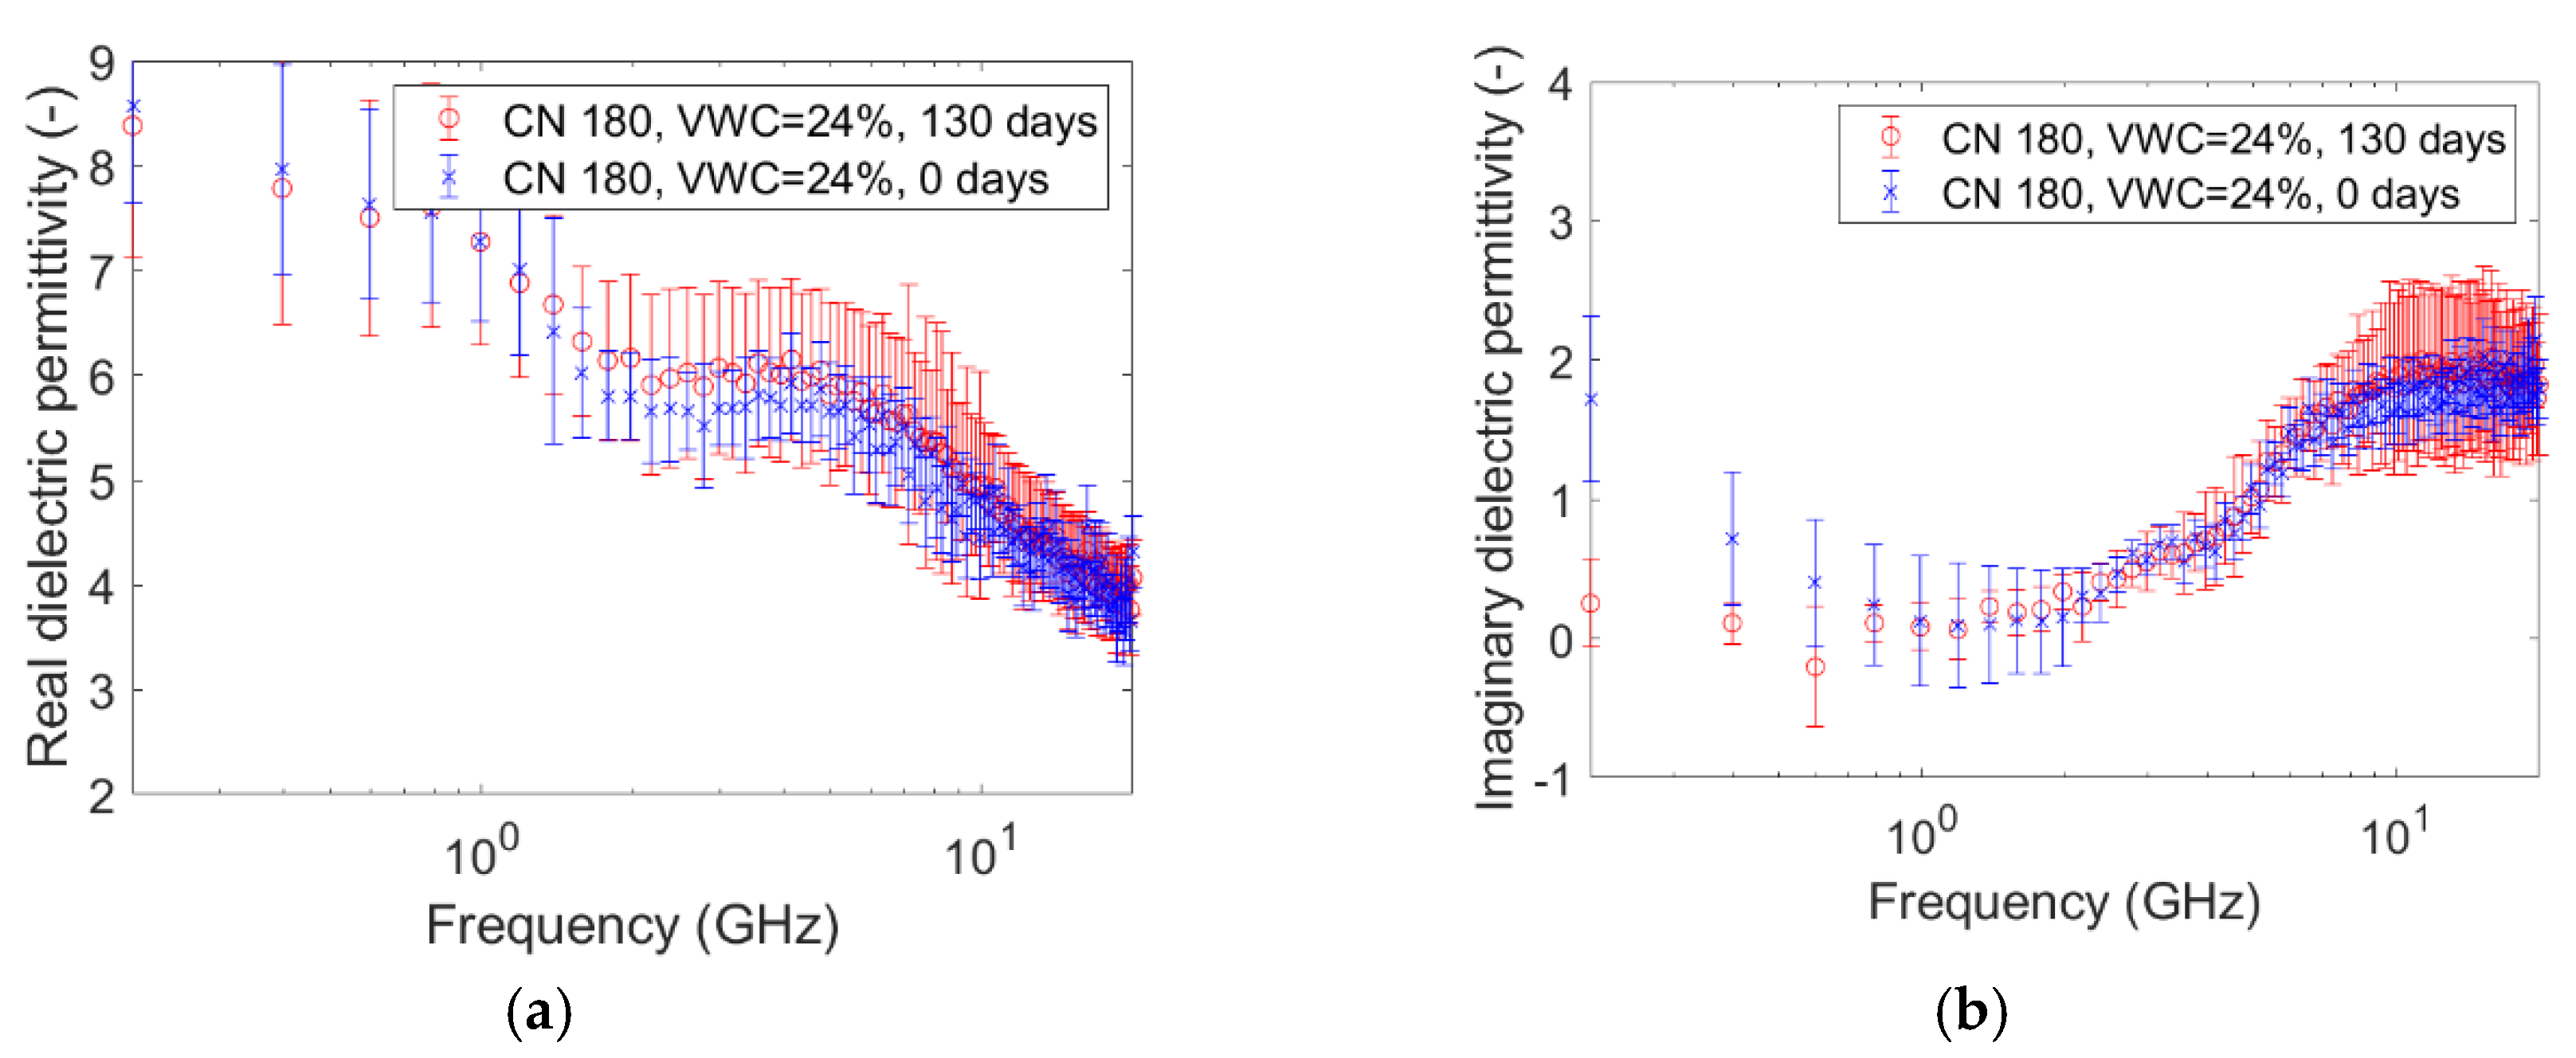
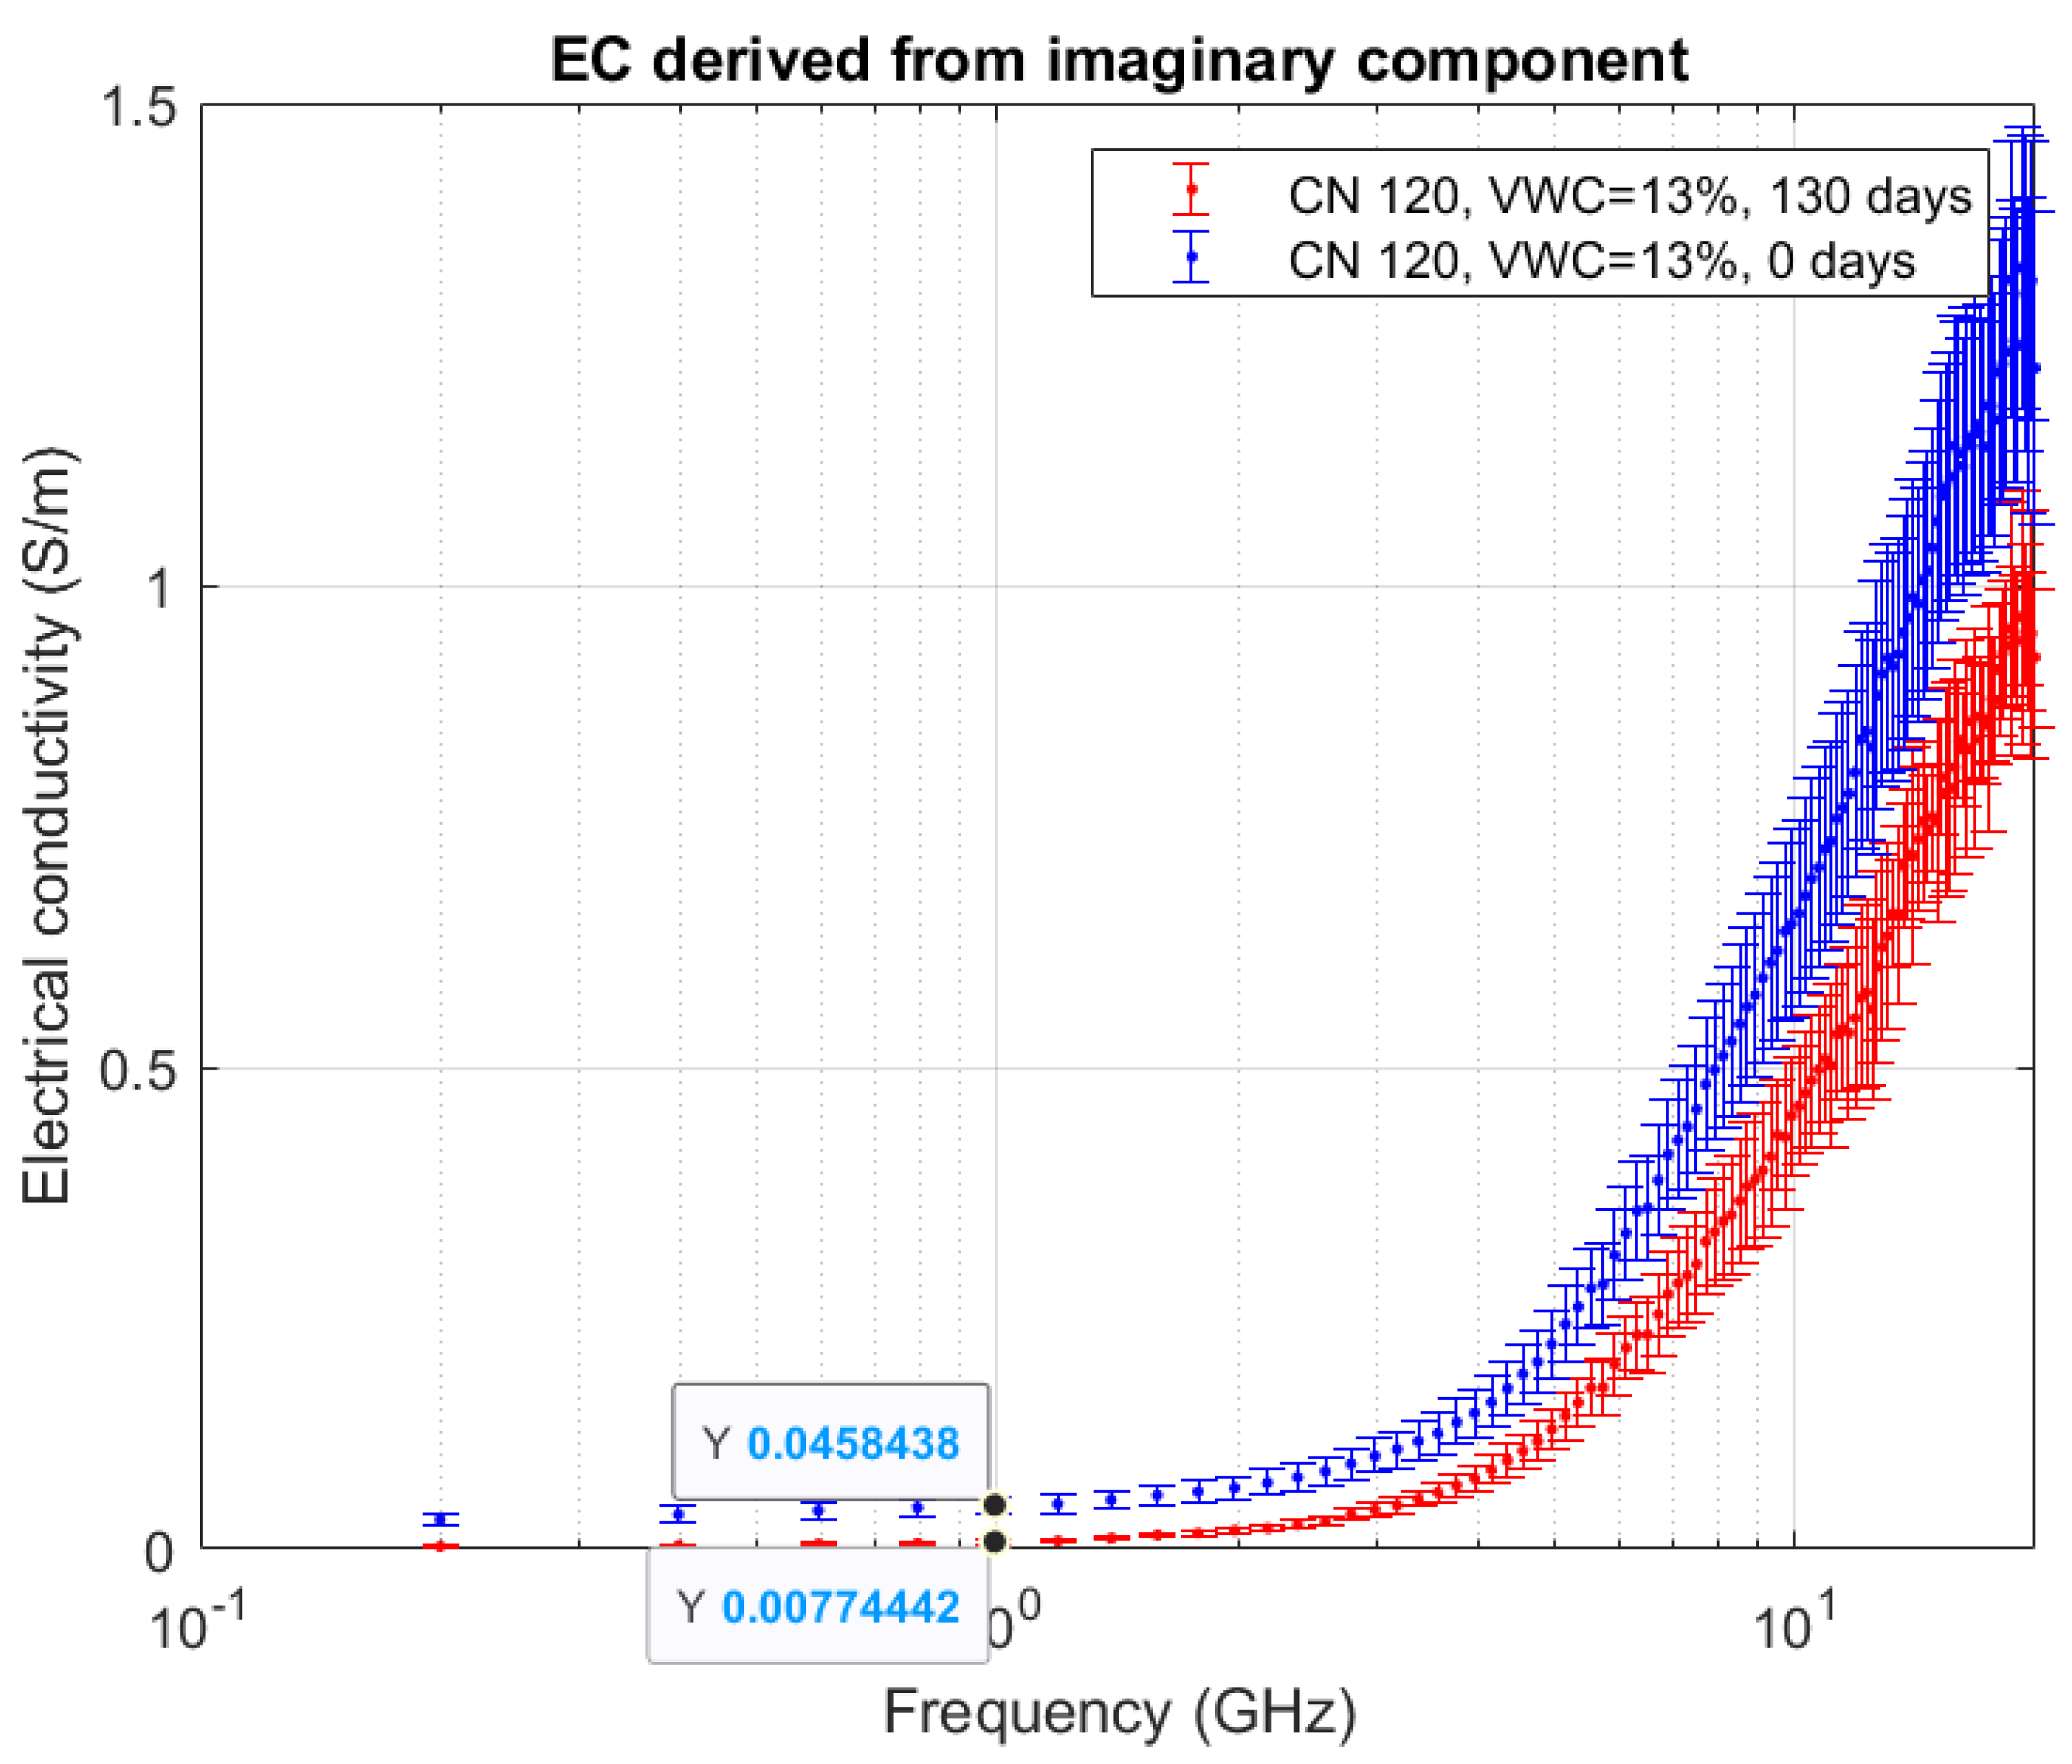
5.2. Analysis of Experimental Results
5.3. Limitations
6. Conclusions
Supplementary Materials
Author Contributions
Funding
Conflicts of Interest
References
- Comegna, A.; Coppola, A.; Dragonetti, G.; Sommella, A. Dielectric Response of a Variable Saturated Soil Contaminated by Non-Aqueous Phase Liquids (NAPLs). Procedia Environ. Sci. 2013, 19, 701–710. [Google Scholar] [CrossRef] [Green Version]
- Hiebert, F.K.; Bennett, P.C. Microbial Control of Silicate Weathering in Organic-Rich Ground Water. Science 1992, 258, 278–281. [Google Scholar] [CrossRef] [PubMed]
- Davis, C.A.; Pyrak-Nolte, L.J.; Atekwana, E.A.; Werkema, D.D.; Haugen, M.E. Acoustic and electrical property changes due to microbial growth and biofilm formation in porous media. J. Geophys. Res. 2010, 115, G00G06. [Google Scholar] [CrossRef] [Green Version]
- Mori, Y.; Suetsugu, A.; Matsumoto, Y.; Fujihara, A.; Suyama, K. Enhancing bioremediation of oil-contaminated soils by controlling nutrient dispersion using dual characteristics of soil pore structure. Ecol. Eng. 2013, 51, 237–243. [Google Scholar] [CrossRef]
- Masy, T.; Caterina, D.; Tromme, O.; Lavigne, B.; Thonart, P.; Hiligsmann, S.; Nguyen, F. Electrical resistivity tomography to monitor enhanced biodegradation of hydrocarbons with Rhodococcus erythropolis T902.1 at a pilot scale. J. Contam. Hydrol. 2016, 184, 1–13. [Google Scholar] [CrossRef] [PubMed]
- Arato, A.; Wehrer, M.; Biró, B.; Godio, A. Integration of geophysical, geochemical and microbiological data for a comprehensive small-scale characterization of an aged LNAPL-contaminated site. Environ. Sci. Pollut. Res. 2014, 21, 8948–8963. [Google Scholar] [CrossRef] [PubMed]
- Atekwana, E.A.; Slater, L.D. Biogeophysics: A new frontier in Earth science research. Rev. Geophys. 2009, 47. [Google Scholar] [CrossRef]
- Godio, A.; Naldi, M. Two-dimensional electrical imaging for detection of hydrocarbon contaminants. Near Surf. Geophys. 2003, 1, 131–137. [Google Scholar] [CrossRef]
- Godio, A.; Naldi, M. Integration of Electrical and Electromagnetic Investigation for Contaminated Site. Am. J. Environ. Sci. 2009, 5, 562–569. [Google Scholar] [CrossRef]
- Godio, A.; Arato, A.; Stocco, S. Geophysical characterization of a nonaqueous-phase liquid–contaminated site. Environ. Geosci. 2010, 17, 141–161. [Google Scholar] [CrossRef]
- Koroma, S.; Arato, A.; Godio, A. Analyzing geophysical signature of a hydrocarbon-contaminated soil using geoelectrical surveys. Environ. Earth Sci. 2015, 74, 2937–2948. [Google Scholar] [CrossRef]
- LaBrecque, D.J.; Ramirez, A.L.; Daily, W.D.; Binley, A.M.; Schima, S.A. ERT monitoring of environmental remediation processes. Meas. Sci. Technol. 1996, 7, 375–383. [Google Scholar] [CrossRef]
- Osella, A.; de la Vega, M.; Lascano, E. Characterization of a Contaminant Plume Due to a Hydrocarbon Spill Using Geoelectrical Methods. J. Environ. Eng. Geophys. 2002, 7, 78–87. [Google Scholar] [CrossRef]
- Cassiani, G.; Binley, A.; Kemna, A.; Wehrer, M.; Orozco, A.F.; Deiana, R.; Boaga, J.; Rossi, M.; Dietrich, P.; Werban, U.; et al. Noninvasive characterization of the Trecate (Italy) crude-oil contaminated site: Links between contamination and geophysical signals. Environ. Sci. Pollut. Res. 2014, 21, 8914–8931. [Google Scholar] [CrossRef] [PubMed]
- Bosco, F.; Casale, A.; Mazzarino, I.; Godio, A.; Ruffino, B.; Mollea, C.; Chiampo, F. Microcosm evaluation of bioaugmentation and biostimulation efficacy on diesel-contaminated soil. J. Chem. Technol. Biotechnol. 2019, jctb.5966. [Google Scholar] [CrossRef]
- Fiore, S.; Zanetti, M.C. Evaluation of Hydrogen/Oxygen Release Compounds for the Remediation of VOCs. Am. J. Environ. Sci. 2011, 7, 468–476. [Google Scholar] [CrossRef] [Green Version]
- Kraszewski, A.W.; Nelson, S.O. Resonant Cavity Perturbation̵Some New Applications of an Old Measuring Technique. J. Microw. Power Electromagn. Energy 1996, 31, 178–187. [Google Scholar] [CrossRef]
- Costa, F.; Borgese, M.; Degiorgi, M.; Monorchio, A. Electromagnetic Characterisation of Materials by Using Transmission/Reflection (T/R) Devices. Electronics 2017, 6, 95. [Google Scholar] [CrossRef] [Green Version]
- La Gioia, A.; Porter, E.; Merunka, I.; Shahzad, A.; Salahuddin, S.; Jones, M.; O’Halloran, M. Open-Ended Coaxial Probe Technique for Dielectric Measurement of Biological Tissues: Challenges and Common Practices. Diagnostics 2018, 8, 40. [Google Scholar] [CrossRef] [Green Version]
- Bobowski, J.S.; Johnson, T. Permittivity Measurements of Biological Samples by an Open-Ended Coaxial Line. Progress In Electromagn. Res. 2012, 40, 159–183. [Google Scholar] [CrossRef] [Green Version]
- Gioia, A.L.; OrHalloran, M.; Porter, E. Modelling of Tissue Dielectric Contribution Within the Sensing Radius of a Coaxial Probe. In Proceedings of the 2018 EMF-Med 1st World Conference on Biomedical Applications of Electromagnetic Fields (EMF-Med), Split, Croatia, 10–13 September 2018; pp. 1–2. [Google Scholar]
- Sheen, N.I.; Woodhead, I.M. An Open-ended Coaxial Probe for Broad-band Permittivity Measurement of Agricultural Products. J. Agric. Eng. Res. 1999, 74, 193–202. [Google Scholar] [CrossRef]
- Marsland, T.P.; Evans, S. Dielectric measurements with an open-ended coaxial probe. IEE Proc. H Microw. Antennas Propag. UK 1987, 134, 341. [Google Scholar] [CrossRef]
- Godio, A. Open ended-coaxial Cable Measurements of Saturated Sandy Soils. Am. J. Environ. Sci. 2007, 3, 175–182. [Google Scholar] [CrossRef]
- Gadani, D.; Rana, V.A.; Vyas, A.D.; Bhatnagar, S.P. Effect of saline water on emissivity of soil. Indian J. Radio Space Phys. 2011, 40, 218–226. [Google Scholar]
- Wharton, R.P.; Rau, R.N.; Best, D.L. Electromagnetic Propagation Logging: Advances In Technique And Interpretation; Society of Petroleum Engineers: Richardson, TX, USA, 1980. [Google Scholar]
- Vergnano, A.; Godio, A.; Raffa, C.M.; Chiampo, F.; Bosco, F.; Ruffino, B. Time-Domain Reflectometry (TDR) Monitoring at a Lab Scale of Aerobic Biological Processes in a Soil Contaminated by Diesel Oil. Appl. Sci. 2019, 9, 5487. [Google Scholar] [CrossRef] [Green Version]
- Skierucha, W.; Walczak, R.; Wilczek, A. Comparison of Open-Ended Coax and TDR sensors for the measurement of soil dielectric permittivity in microwave frequencies. Int. Agrophys. 2008, 18, 355–362. [Google Scholar]
- Raffa, C.M.; Chiampo, F.; Godio, A.; Vergnano, A.; Bosco, F.; Ruffino, B. Kinetics and Optimization by Response Surface Methodology of Aerobic Bioremediation. Geoelectrical Parameter Monitoring. Appl. Sci. 2020, 10, 405. [Google Scholar] [CrossRef] [Green Version]
- Kaatze, U.; Uhlendorf, V. The Dielectric Properties of Water at Microwave Frequencies. Zeitschrift für Physikalische Chemie 1981, 126, 151–165. [Google Scholar] [CrossRef]
- Keysight Basics of Measuring the Dielectric Properties of Materials. Available online: https://www.keysight.com/it/en/assets/7018-01284/application-notes/5989-2589.pdf (accessed on 11 March 2020).
- Psarras, G.C. Fundamentals of Dielectric Theories. In Dielectric Polymer Materials for High-Density Energy Storage; Elsevier: Amsterdam, The Netherlands, 2018; pp. 11–57. ISBN 978-0-12-813215-9. [Google Scholar]
- Archie, G.E. The Electrical Resistivity Log as an Aid in Determining Some Reservoir Characteristics. Trans. AIME 1942, 146, 54–62. [Google Scholar] [CrossRef]
- Komarov, S.A.; Komarov, A.S.; Barber, D.G.; Lemes, M.J.L.; Rysgaard, S. Open-Ended Coaxial Probe Technique for Dielectric Spectroscopy of Artificially Grown Sea Ice. IEEE Trans. Geosci. Remote Sens. 2016, 54, 4941–4951. [Google Scholar] [CrossRef]
- Blackham, D.V.; Pollard, R.D. An improved technique for permittivity measurements using a coaxial probe. IEEE Trans. Instrum. Meas. 1997, 46, 1093–1099. [Google Scholar] [CrossRef]
- Marcuvitz, N. Waveguide Handbook; IEE electromagnetic waves series; P. Peregrinus on behalf of the Institution of Electrical Engineers: London, UK, 1986; ISBN 978-0-86341-058-1. [Google Scholar]
- Deschamps, G. Impedance of an antenna in a conducting medium. IRE Trans. Antennas Propag. 1962, 10, 648–650. [Google Scholar] [CrossRef]
- Pournaropoulos, C.L.; Misra, D. A study on the coaxial aperture electromagnetic sensor and its application in material characterization. IEEE Trans. Instrum. Meas. 1994, 43, 111–115. [Google Scholar] [CrossRef]
- Misra, D.; Chabbra, M.; Epstein, B.R.; Microtznik, M.; Foster, K.R. Noninvasive electrical characterization of materials at microwave frequencies using an open-ended coaxial line: Test of an improved calibration technique. IEEE Trans. Microw. Theory Techn. 1990, 38, 8–14. [Google Scholar] [CrossRef] [Green Version]
- 85070D High-Temperature Dielectric Probe Kit [Obsolete] | Keysight. Available online: https://www.keysight.com/en/pd-1000004359%3Aepsg%3Apro-pn-85070D/high-temperature-dielectric-probe-kit?cc=IT&lc=ita (accessed on 12 March 2020).
- Mavrovic, A.; Roy, A.; Royer, A.; Filali, B.; Boone, F.; Pappas, C.; Sonnentag, O. Dielectric characterization of vegetation at L band using an open-ended coaxial probe. Geosci. Instrum. Methods Data Syst. 2018, 7, 195–208. [Google Scholar] [CrossRef] [Green Version]
- Artemov, V.G.; Volkov, A.A. Water and Ice Dielectric Spectra Scaling at 0 °C. Ferroelectrics 2014, 466, 158–165. [Google Scholar] [CrossRef]
- Atekwana, E.A.; Atekwana, E.; Legall, F.D.; Krishnamurthy, R.V. Field evidence for geophysical detection of subsurface zones of enhanced microbial activity. Geophys. Res. Lett. 2004, 31. [Google Scholar] [CrossRef]
- Seyfried, M.S.; Murdock, M.D. Response of a New Soil Water Sensor to Variable Soil, Water Content, and Temperature. Soil Sci. Soc. Am. J. 2001, 65, 28–34. [Google Scholar] [CrossRef] [Green Version]
- Filali, B.; Boone, F.; Rhazi, J.; Ballivy, G. Design and Calibration of a Large Open-Ended Coaxial Probe for the Measurement of the Dielectric Properties of Concrete. IEEE Trans. Microw. Theory Tech. 2008, 56, 2322–2328. [Google Scholar] [CrossRef]


| Parameter (UM) | Value |
|---|---|
| Soil (kg) | 0.2 |
| Diameter of glass jars (cm) | 7 |
| Height of soil (cm) | ~3 |
| Total volume (l) | 0.115 |
| Porosity | 0.4 |
| Real density of soil (kg/m3) | 2700 |
| Apparent density of soil (kg/m3) | 1620 |
| Diesel oil (g) | 13 |
| Volumetric diesel oil content (loil/ltotal volume) | 13.5% |
| Particle size distribution (mm) | 0.15–2 |
| Volumetric water content (lw/ltotal volume) | 13% to 19%–24% |
| Carbon/Nitrogen ratio (g/g) | 120–180 |
| Electrical conductivity of solution (S/m) | 1.80 (C/N = 120)–1.21 (C/N = 180) |
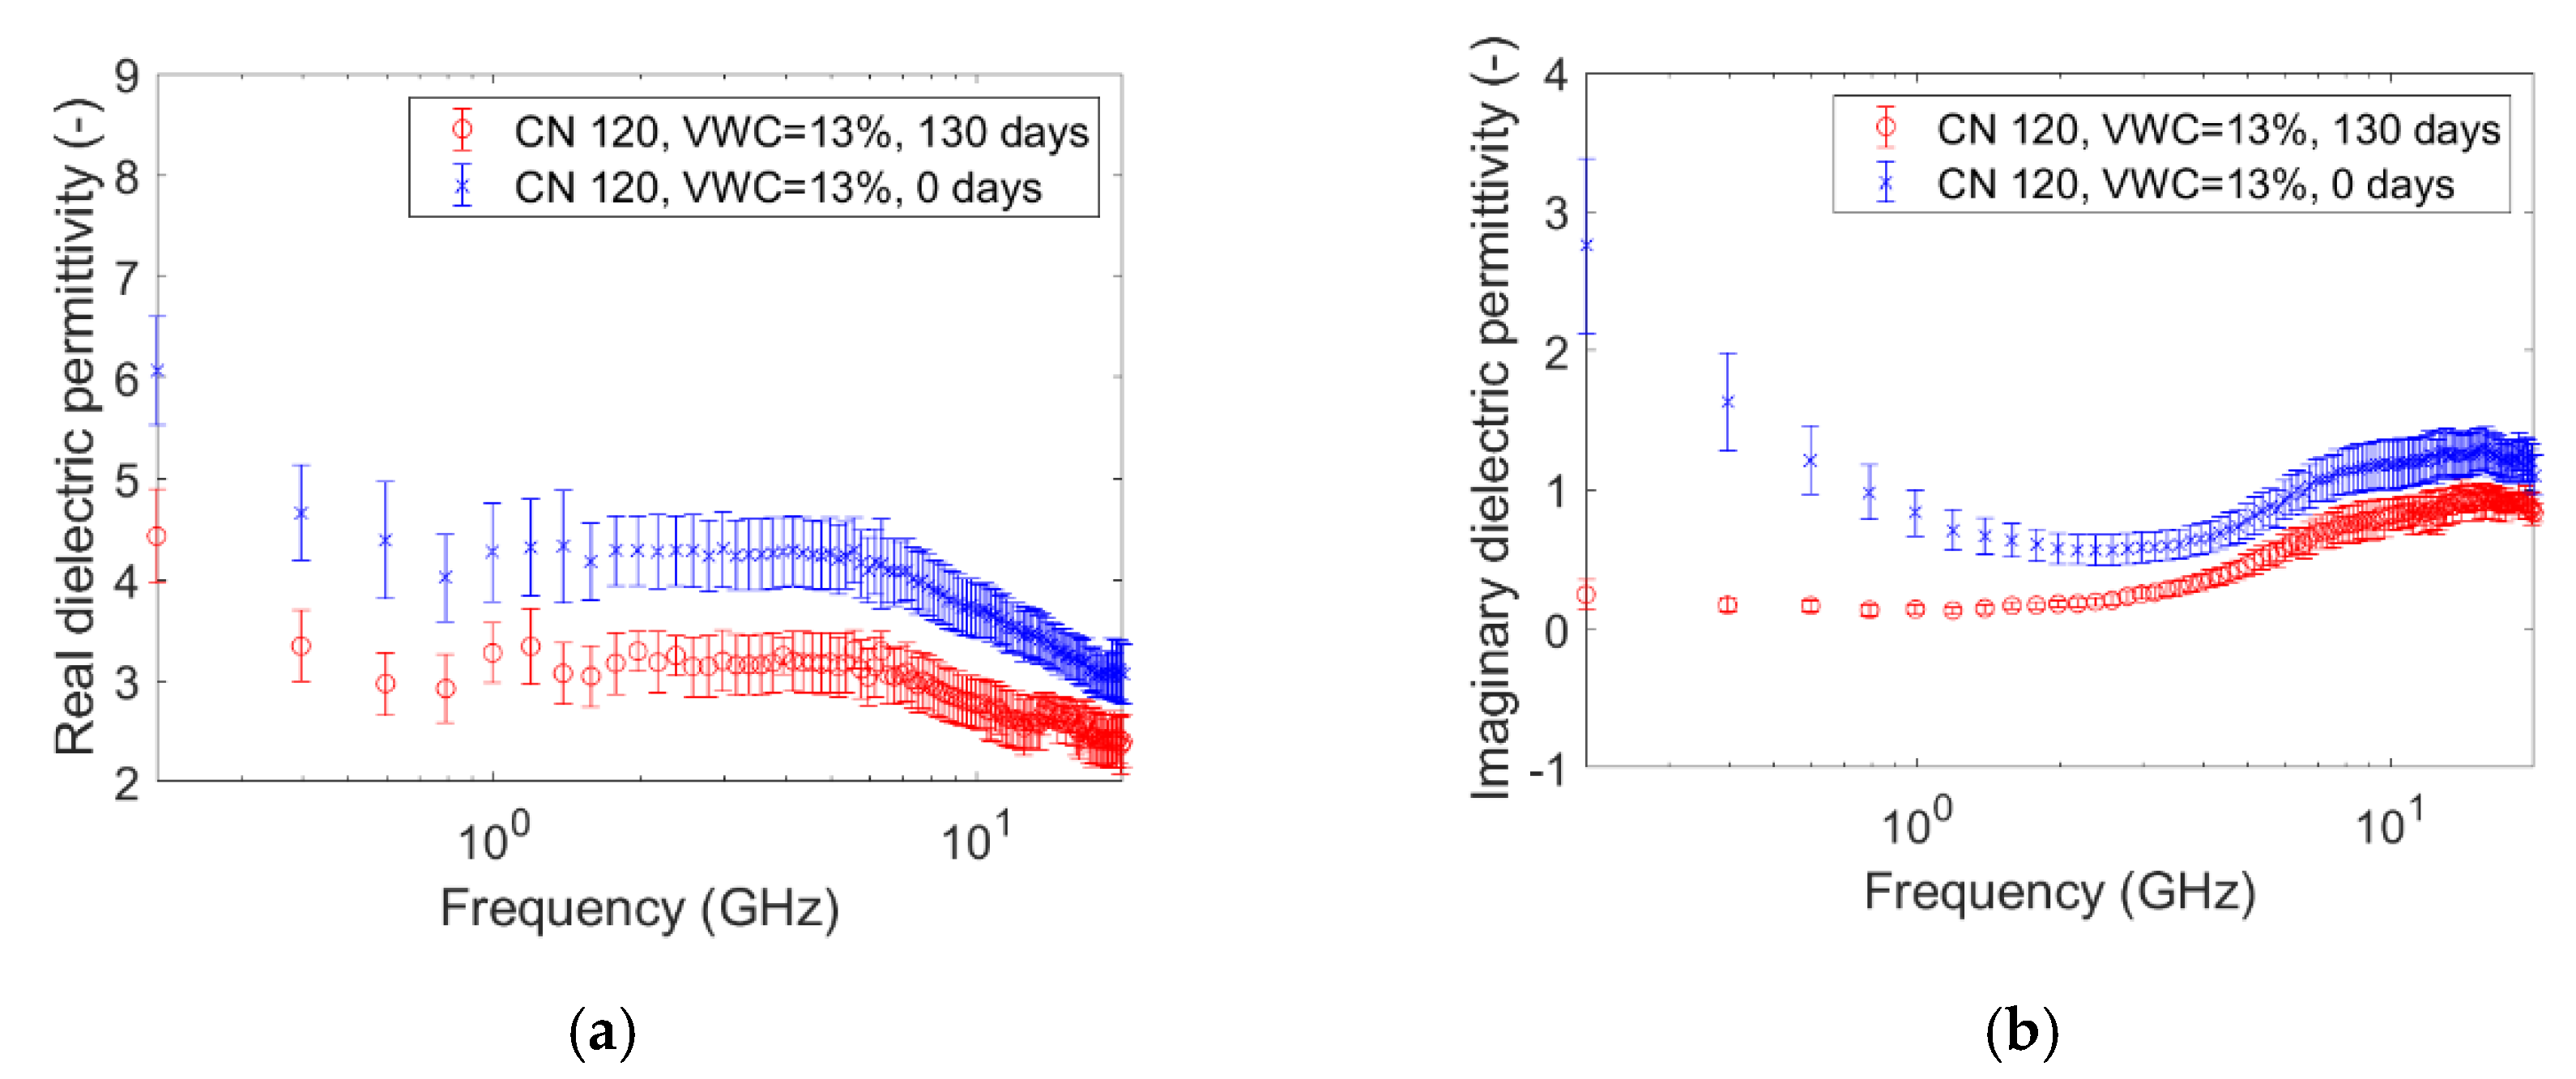
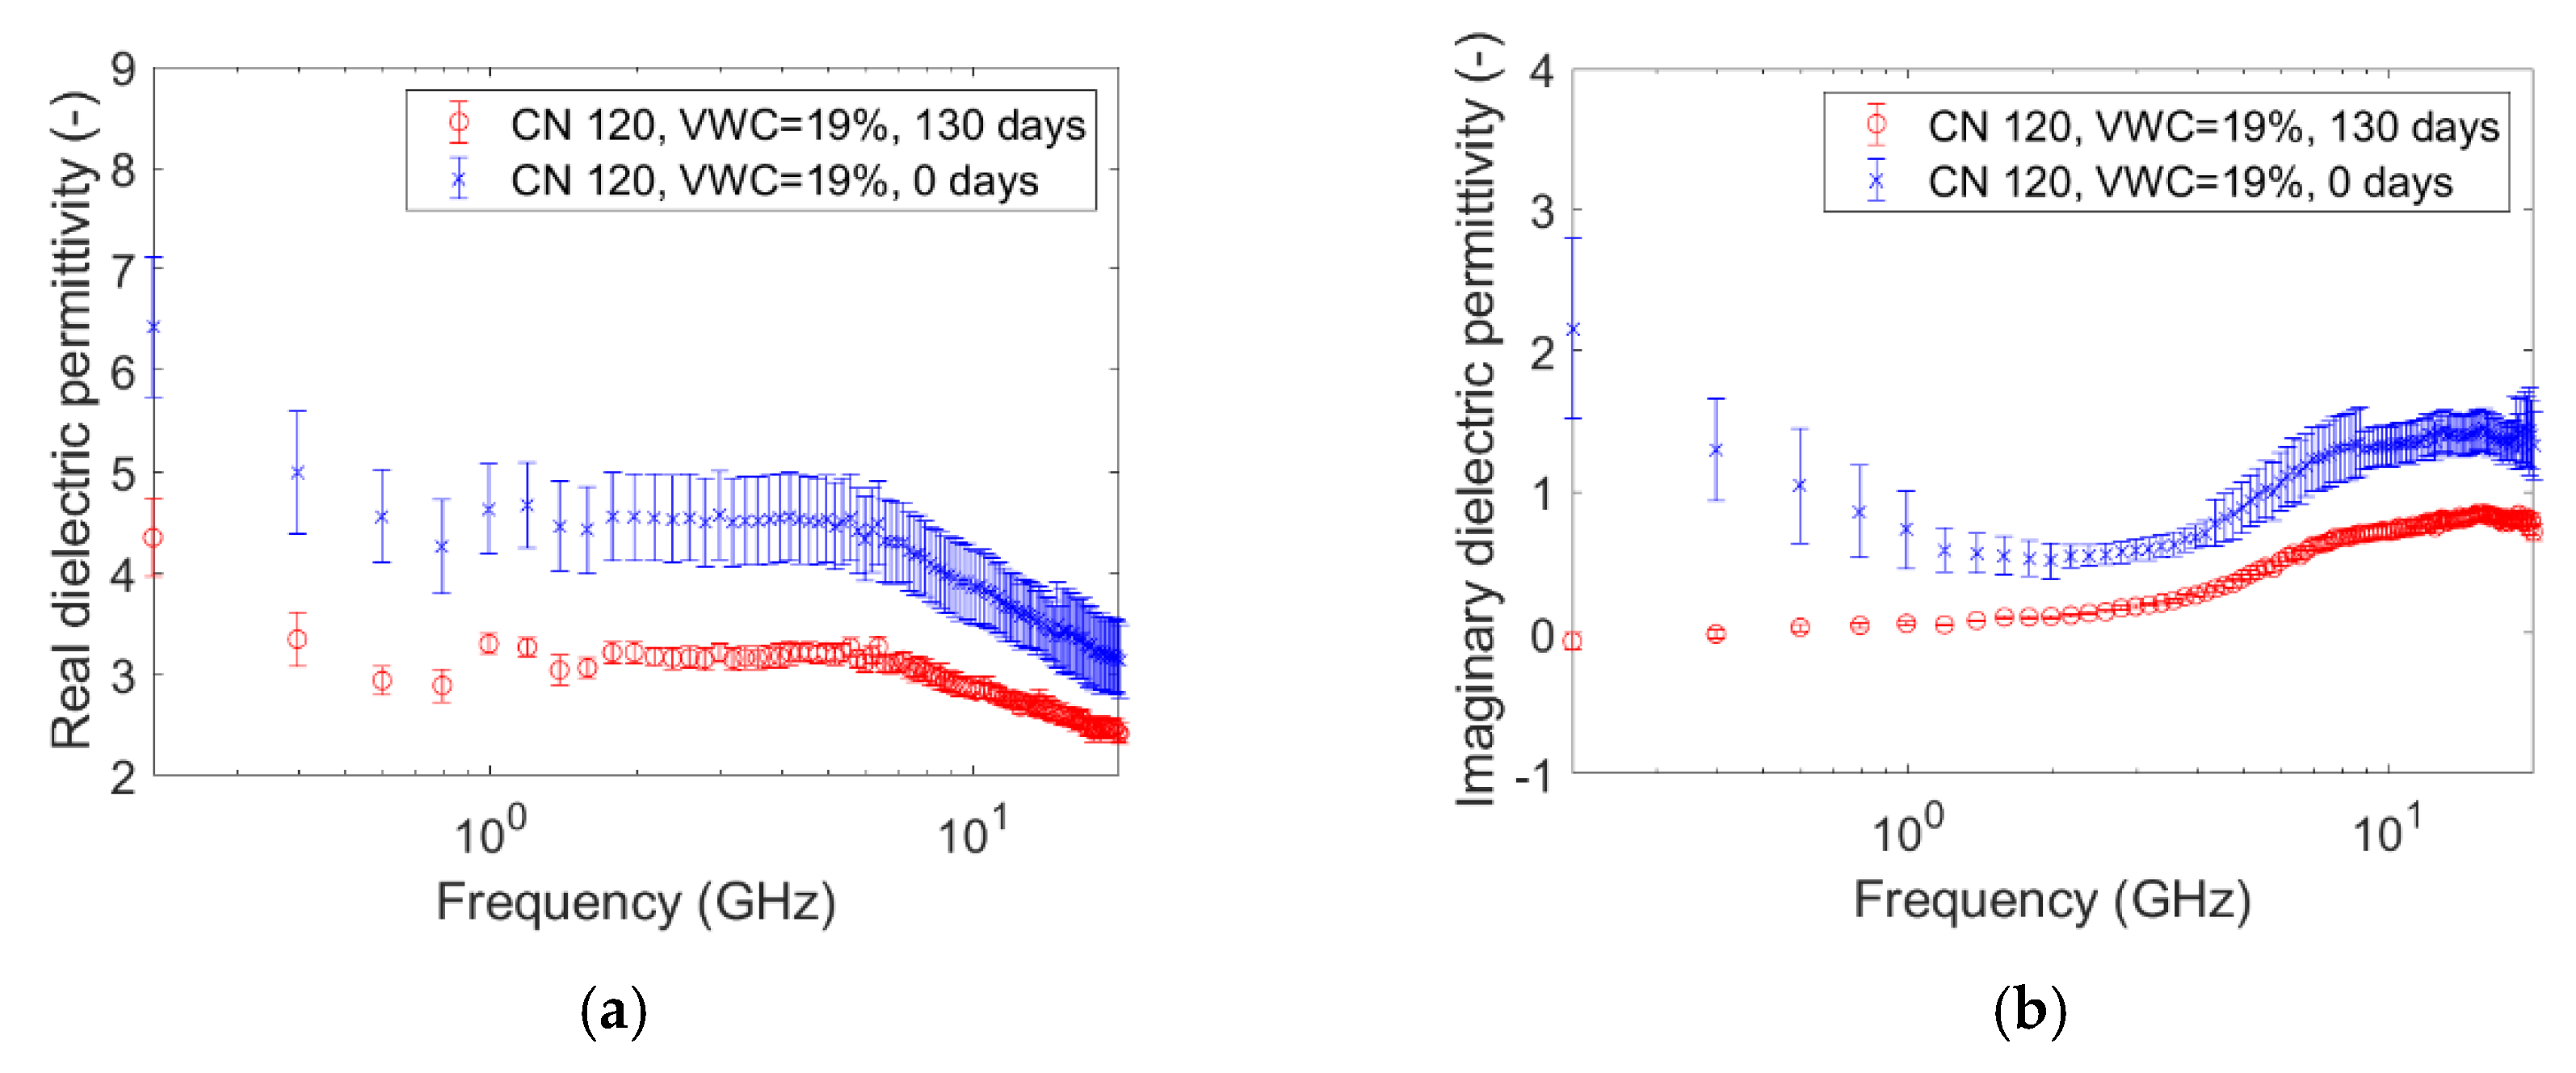
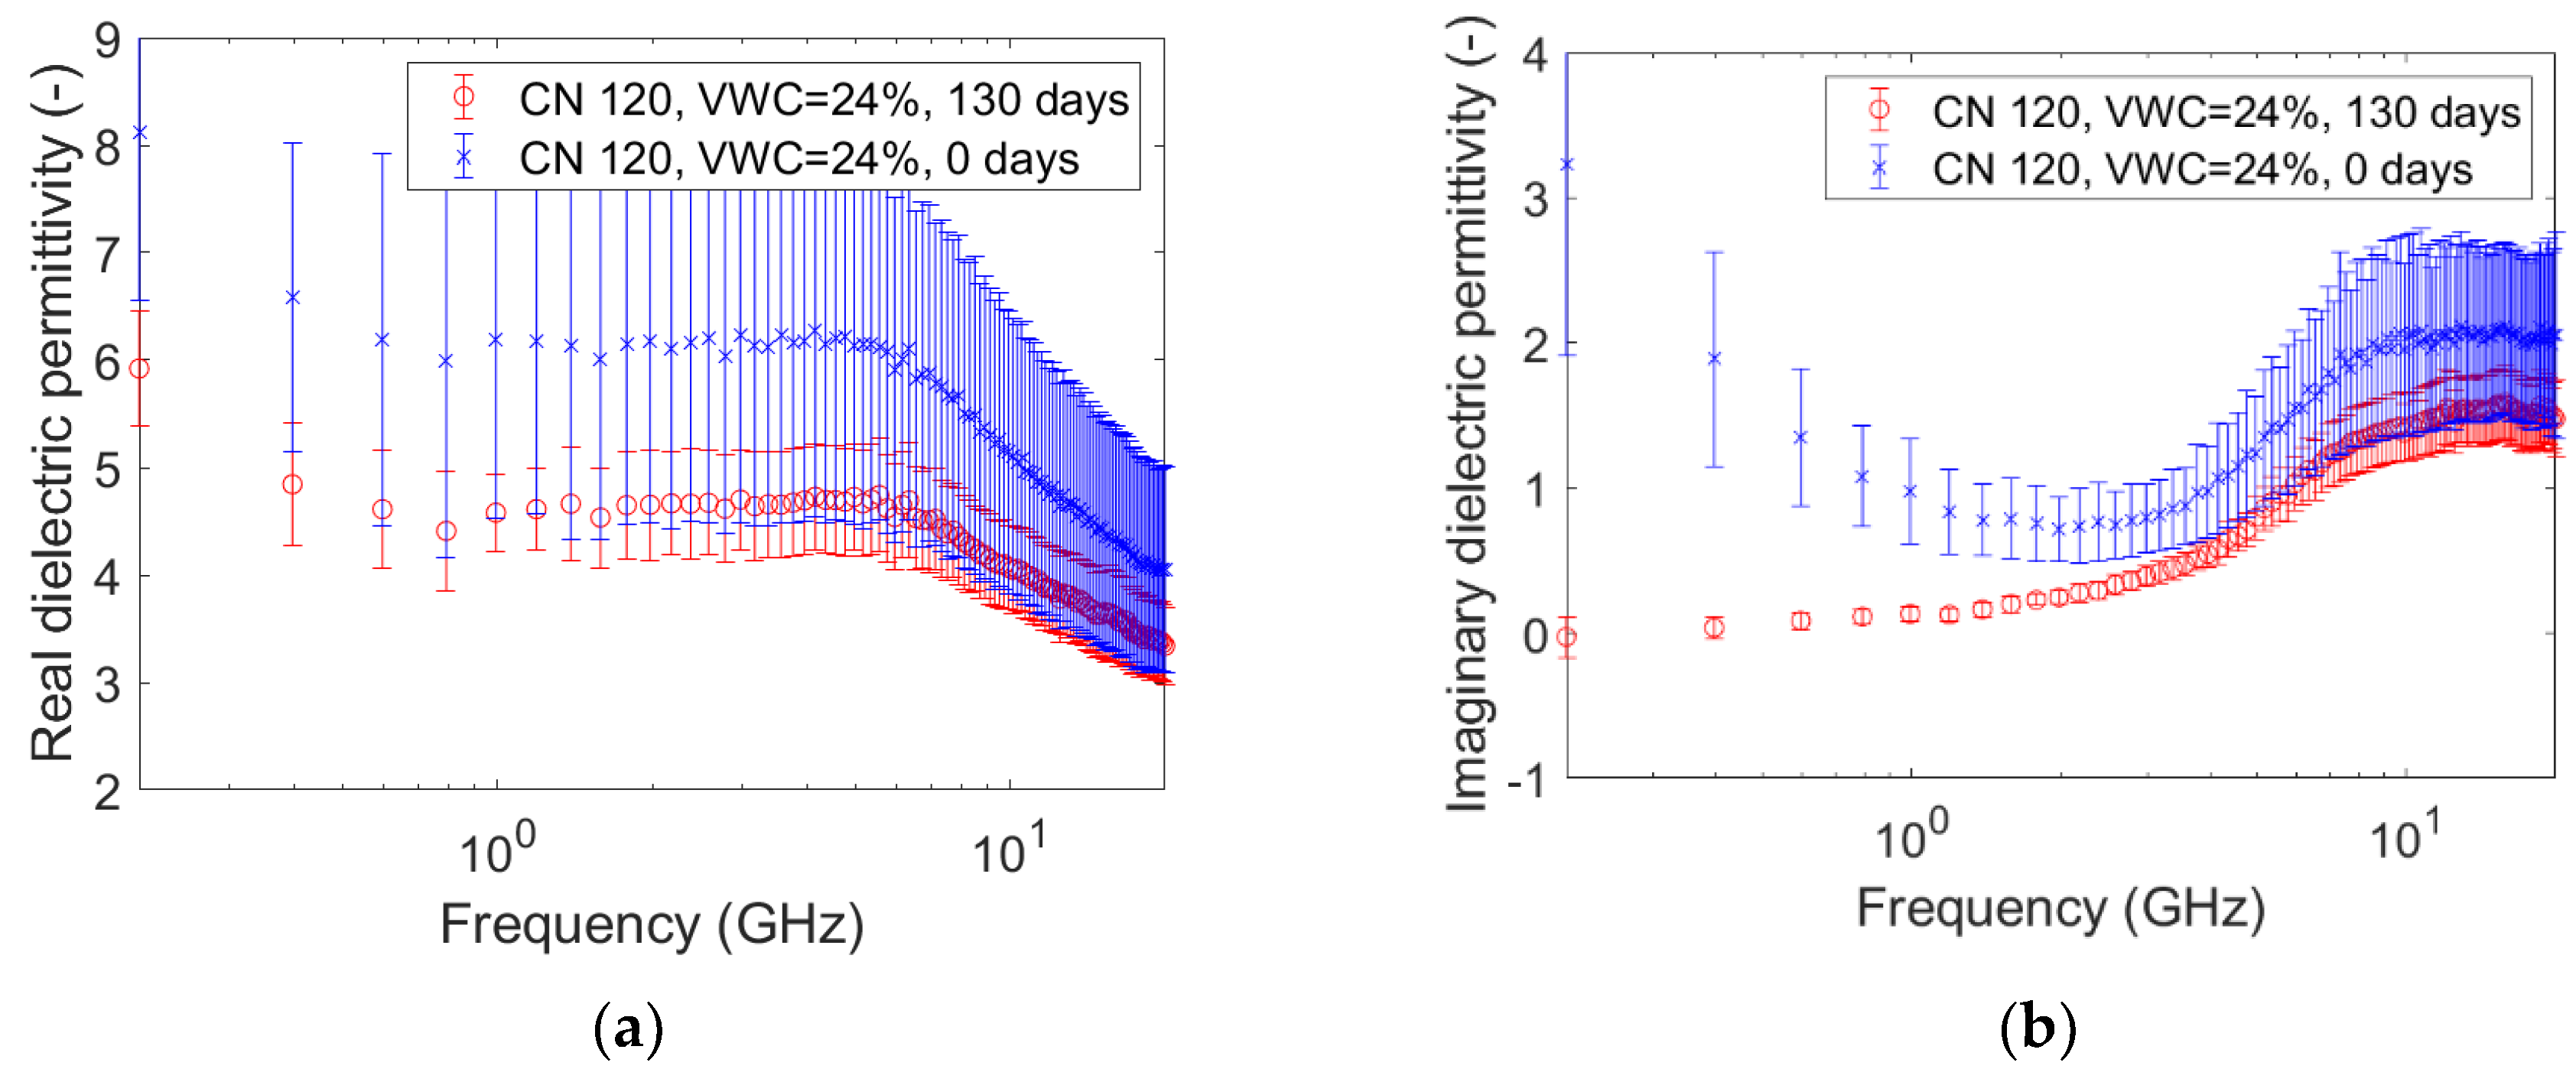
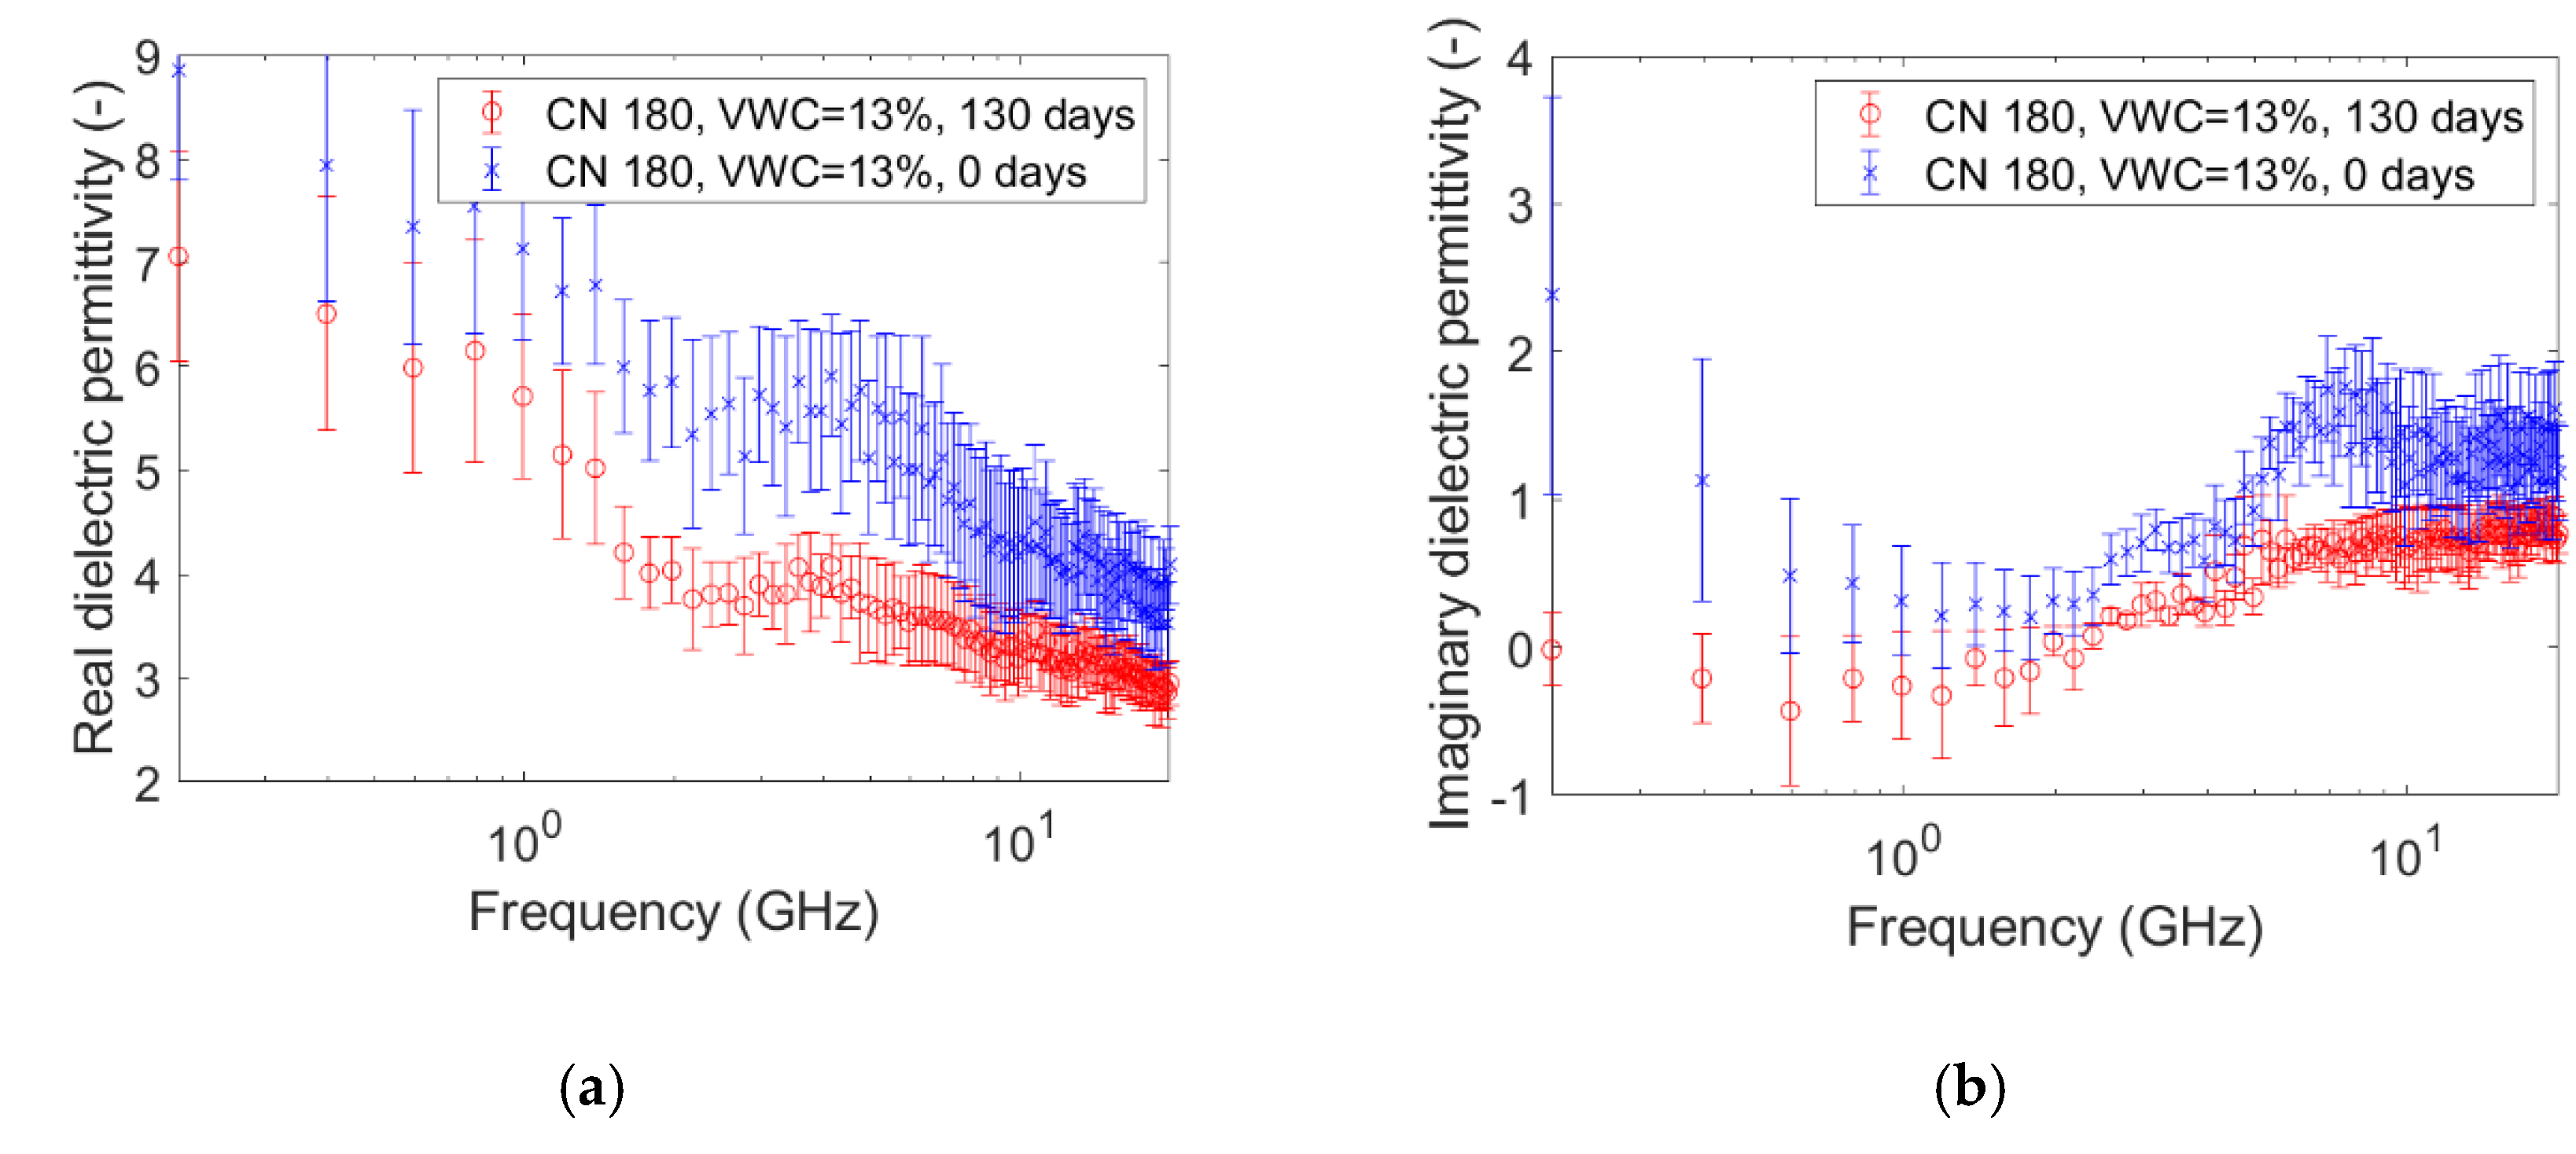
| Microcosm: | C/N = 120, VWC = 13% | C/N = 120, VWC = 19% | C/N = 120, VWC = 24% | C/N = 180, VWC = 13% | C/N = 180, VWC = 19% | C/N = 180, VWC = 24% |
|---|---|---|---|---|---|---|
| Real part, t = 0, 1 GHz | 4.3 | 4.7 | 6.2 | 7.8 | 7.3 | 7.2 |
| Real part, t = 130, 1 GHz | 3.3 | 3.4 | 4.7 | 5.7 | 5.8 | 7.2 |
| Imag. Part, t = 0, 200 MHz | 2.8 | 2.2 | 3.3 | 2.4 | 3.1 | 1.7 |
| Imag. part, t = 130, 200 MHz | 0.2 | 0 | 0 | 0 | 0.8 | 0.3 |
Publisher’s Note: MDPI stays neutral with regard to jurisdictional claims in published maps and institutional affiliations. |
© 2020 by the authors. Licensee MDPI, Basel, Switzerland. This article is an open access article distributed under the terms and conditions of the Creative Commons Attribution (CC BY) license (http://creativecommons.org/licenses/by/4.0/).
Share and Cite
Vergnano, A.; Godio, A.; Raffa, C.M.; Chiampo, F.; Tobon Vasquez, J.A.; Vipiana, F. Open-Ended Coaxial Probe Measurements of Complex Dielectric Permittivity in Diesel-Contaminated Soil during Bioremediation. Sensors 2020, 20, 6677. https://0-doi-org.brum.beds.ac.uk/10.3390/s20226677
Vergnano A, Godio A, Raffa CM, Chiampo F, Tobon Vasquez JA, Vipiana F. Open-Ended Coaxial Probe Measurements of Complex Dielectric Permittivity in Diesel-Contaminated Soil during Bioremediation. Sensors. 2020; 20(22):6677. https://0-doi-org.brum.beds.ac.uk/10.3390/s20226677
Chicago/Turabian StyleVergnano, Andrea, Alberto Godio, Carla Maria Raffa, Fulvia Chiampo, Jorge A. Tobon Vasquez, and Francesca Vipiana. 2020. "Open-Ended Coaxial Probe Measurements of Complex Dielectric Permittivity in Diesel-Contaminated Soil during Bioremediation" Sensors 20, no. 22: 6677. https://0-doi-org.brum.beds.ac.uk/10.3390/s20226677