Article

Entropy of Real-World Gait in Parkinson’s Disease Determined from Wearable Sensors as a Digital Marker of Altered Ambulatory Behavior

1
School of Mathematics, Statistics and Physics, Newcastle University, Newcastle upon Tyne NE1 7RU, UK
2
Translational and Clinical Research Unit, Clinical Ageing Research Unit, Newcastle University, Newcastle upon Tyne NE4 5PL, UK
3
Newcastle upon Tyne Hospitals NHS Foundation Trust, Newcastle upon Tyne NE7 7DN, UK
*
Author to whom correspondence should be addressed.
Submission received: 2 April 2020 / Revised: 29 April 2020 / Accepted: 2 May 2020 / Published: 5 May 2020
(This article belongs to the Collection Sensors in Biomechanics)

Abstract

:
Parkinson’s disease (PD) is a common age-related neurodegenerative disease. Gait impairment is frequent in the later stages of PD contributing to reduced mobility and quality of life. Digital biomarkers such as gait velocity and step length are predictors of motor and cognitive decline in PD. Additional gait parameters may describe different aspects of gait and motor control in PD. Sample entropy (SampEnt), a measure of signal predictability, is a nonlinear approach that quantifies regularity of a signal. This study investigated SampEnt as a potential biomarker for PD and disease duration. Real-world gait data over a seven-day period were collected using an accelerometer (Axivity AX3, York, UK) placed on the low back and gait metrics extracted. SampEnt was determined for the stride time, with vector length and threshold parameters optimized. People with PD had higher stride time SampEnt compared to older adults, indicating reduced gait regularity. The range of SampEnt increased over 36 months for the PD group, although the mean value did not change. SampEnt was associated with dopaminergic medication dose but not with clinical motor scores. In conclusion, this pilot study indicates that SampEnt from real-world data may be a useful parameter reflecting clinical status although further research is needed involving larger populations.

1. Introduction

Advances in medicine and public health preventive strategies contribute to the increased life expectancy of an expanding world population. However, a consequence of greater longevity is increased morbidity, resulting in the loss of independent living, frailty, and mortality [1]. There are substantial health and social costs linked to the loss of independence as well as the impact on quality of life of the individual and careers. A common age-related neurodegenerative disease is Parkinson’s disease (PD), with a UK incidence of 84 per 100,000 in adults over 50 years [2]. In PD, deep brain structures controlling movement degenerate and there is progressive loss of motor function. Symptoms of PD include gait impairment, associated with an increased risk of falling, which is a major health concern and economic burden [3]. The quantitative analysis of gait may provide biomarkers of disease progression and offer insight into motor control strategies. Wearable technology, such as accelerometers, allow for monitoring of ambulatory activity in both controlled and real-world environments [4]. Therefore, data can be collected over an extended period of time when the participant is walking in familiar surroundings, which provides a more accurate representation of gait compared to walking in a gait laboratory [5]. Additionally, analyzing gait through accelerometers offers an inexpensive and portable solution compared to costly clinical laboratory based measurements [6]. Real-world gait recordings, however, present several challenges. Firstly, the environment is unconstrained, unlike a clinical gait laboratory. The terrain will vary, unanticipated obstacles may appear such as vehicles when crossing the road and frequently the person will perform additional tasks, all of which will modify gait patterns. However, if the purpose of real-world gait analysis is to capture the individuals’ gait patterns, this cannot be adequately assessed within the context of an artificial framework but must incorporate the richness of the environment with which the individual engages.
An essential element when processing large data sets is selecting appropriate features that encapsulate gait information over extended time-periods. A real-world recording from the triaxial AX3 accelerometer (Axivity, York, UK) set at 10 bits resolution, sampling at 100 Hz, generates up to 250 MB of raw binary data over seven days. Digital outcomes from real-world recordings include macro gait measures of walking activity or micro gait measures of specific gait parameters such as gait velocity, stride time, or step length [7]. Stride time is a measure of rhythmicity and by inference automaticity of movement [8], which has been extensively examined in people with PD. Rhythmicity or regularity of stride time can be quantified by linear measures of variability such as the coefficient of variation (CV). Studies have reported that stride time CV is greater for people with PD compared to healthy older adults [9], and for freezers compared to nonfreezers [10]. Stride time CV decreases following dopaminergic medication and is lower in nonfallers compared to fallers [11]. Stride time CV in healthy adults has also been correlated with cortical activity (supplementary motor area, precentral gyrus) [12]. Therefore, the variability of stride time would appear as a good indicator of PD and a risk factor for falls. However, CV and other linear measures of variability are limited as processing involves averaging values over the recording duration, which does not reflect the natural fluctuations in metrics over time. This intrinsic signal variability may relate to underlying motor regulation systems. Nonlinear methods such as entropy, maximum Lyapunov exponent, autocorrelation or recurrence fluctuation analysis provide a measure of temporal variability and may indicate the integrity of the underlying motor control system. Two studies on nonlinear variability of stride time, using detrended fluctuation analysis and long range autocorrelation (LRA), reported more random variability for stride time in people with PD compared to healthy controls [13,14]. By contrast, Kamath (2015) reported that the regularity of stride time, assessed with sample entropy (SampEnt), was greater in people with PD compared to older adults (HOA) [15]. Warlop et al. (2016) reported that a lower Hurst exponent and α-exponent derived from LRA, indicating more random gait, was associated with a greater disease level of PD [16].
The application of entropy algorithms to biomedical signals and gait is a common method of nonlinear analysis [17,18,19,20,21]. Entropy measures the probability that a similar pattern in a signal is repeated and will be followed by additional similar patterns thus, indicating regularity of the time series [22]. A low value of entropy is indicative of greater regularity whereas a high value suggests a time series that is to an extent random. Approximate entropy [23] and SampEnt [24] are two types of entropy measurements. However, approximate entropy has greater bias towards regularity, more sensitivity to parameter choices, and less relative consistency compared to SampEnt. SampEnt is a robust to low-level noise, and finite for both stochastic and deterministic processes [22]. Therefore, SampEnt of gait may be a potential biomarker of PD in addition to indicating disease progression of a disease. The aims of this pilot study were to: (i) Evaluate the feasibility of evaluating SampEnt on real-world accelerometry data; (ii) compare real-world SampEnt in PD with respect to HOA; and (iii) investigate longitudinal changes of SampEnt over 36 months. The hypotheses were that regularity would be lower (greater SampEnt) in people with PD compared to HOA and that it would decrease over three years with increasing neurodegeneration.

2. Materials and Methods

2.1. Participants

A subset of participants from the Incidence of Cognitive Impairment in Cohorts with Longitudinal Evaluation-Gait (ICICLE-GAIT) study [25], which commenced in June 2009, was identified. Ten participants were selected: Five with PD and five HOAs. Participants were excluded if they had any neurological (other than PD), orthopedic, or cardiothoracic conditions that may affect their walking or safety during the testing. Participants with PD were diagnosed with an idiopathic PD according to the UK Parkinson’s Disease Brain Bank criteria [26].

2.2. Ethics and Consent

The study was approved by the Newcastle and North Tyneside research ethics committee (ICICLE-GAIT 09/H0906/82) and conducted according to the declaration of Helsinki. All participants signed an informed consent form prior to testing.

2.3. Demographic and Clinical Measures

At each assessment time-point, participants attended the Clinical Ageing Research Unit, Newcastle University where demographic information was collected, and clinical testing was performed. Demographic measures included height, weight, gender, and age of the participant. A trained clinical examiner rated the severity of PD on the Motor Section (III) of the Movement Disorders Society-Unified Parkinson’s Disease Rating Scale (MDS-UPDRS-III), approximately 1 h after dopaminergic medication intake, when the medication generally has its peak clinical effect. The levodopa equivalent daily dose (LEDD) was also recorded [27], which is a measure of the most commonly prescribed medication for PD.

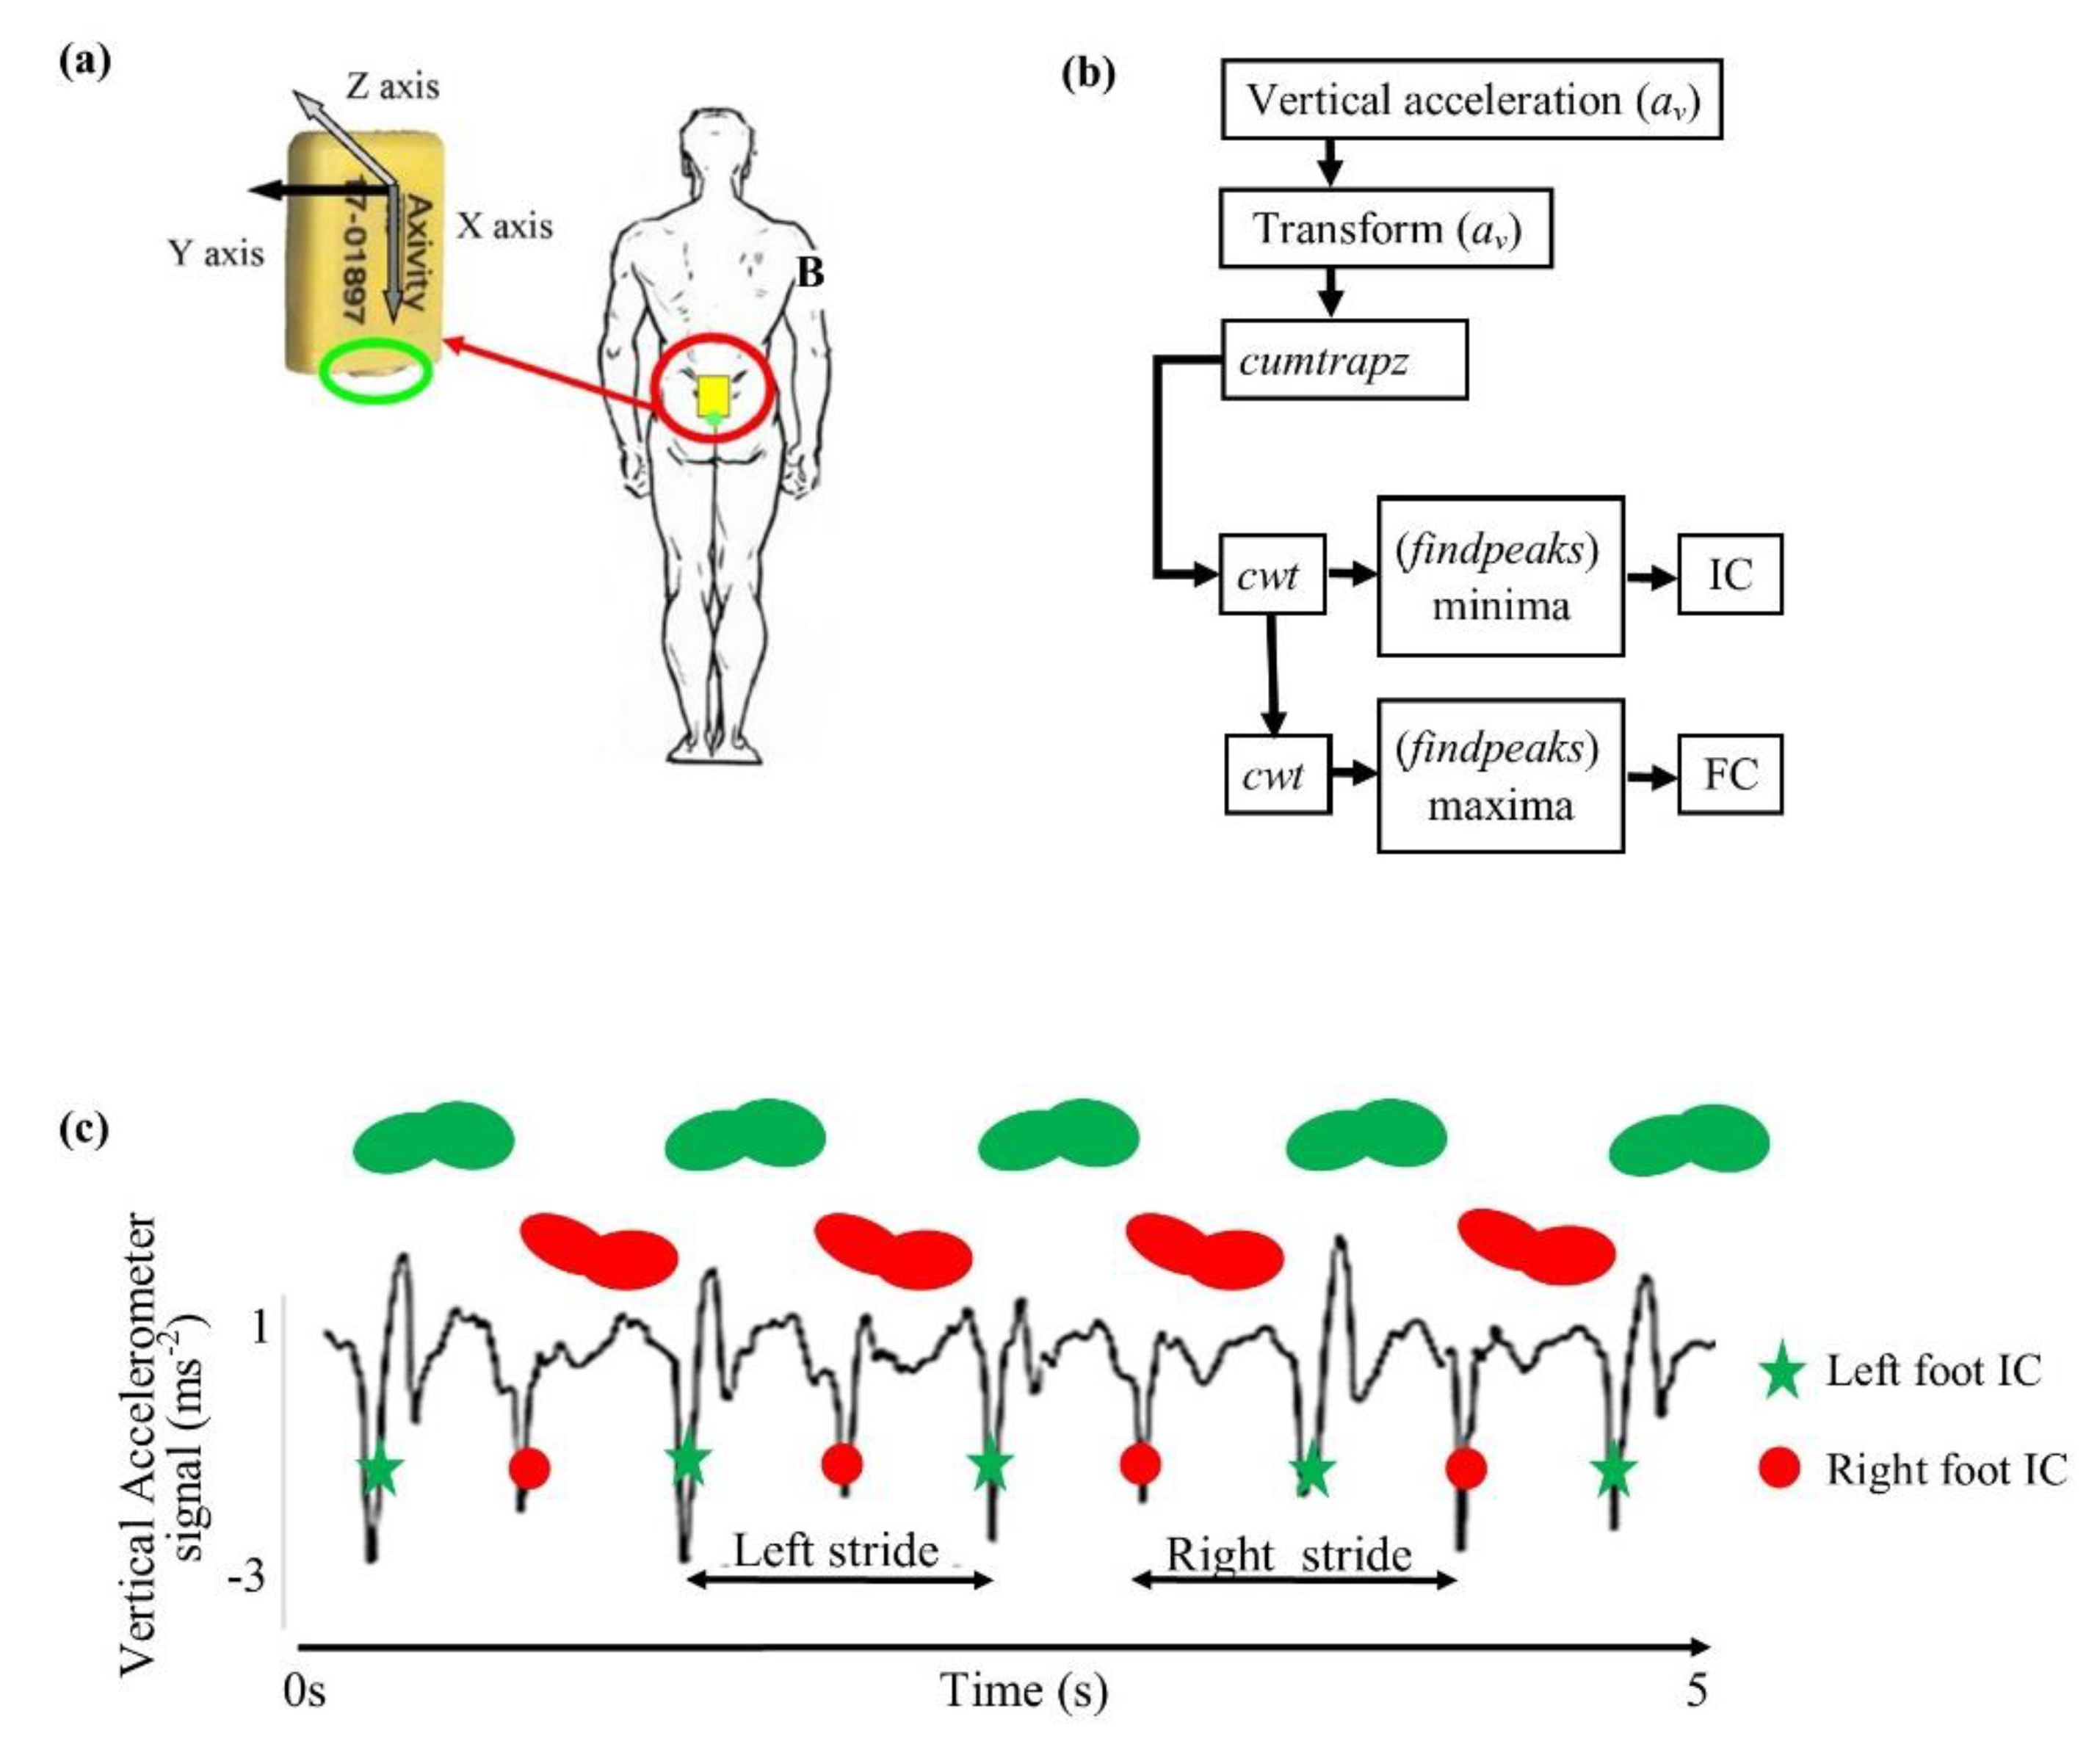
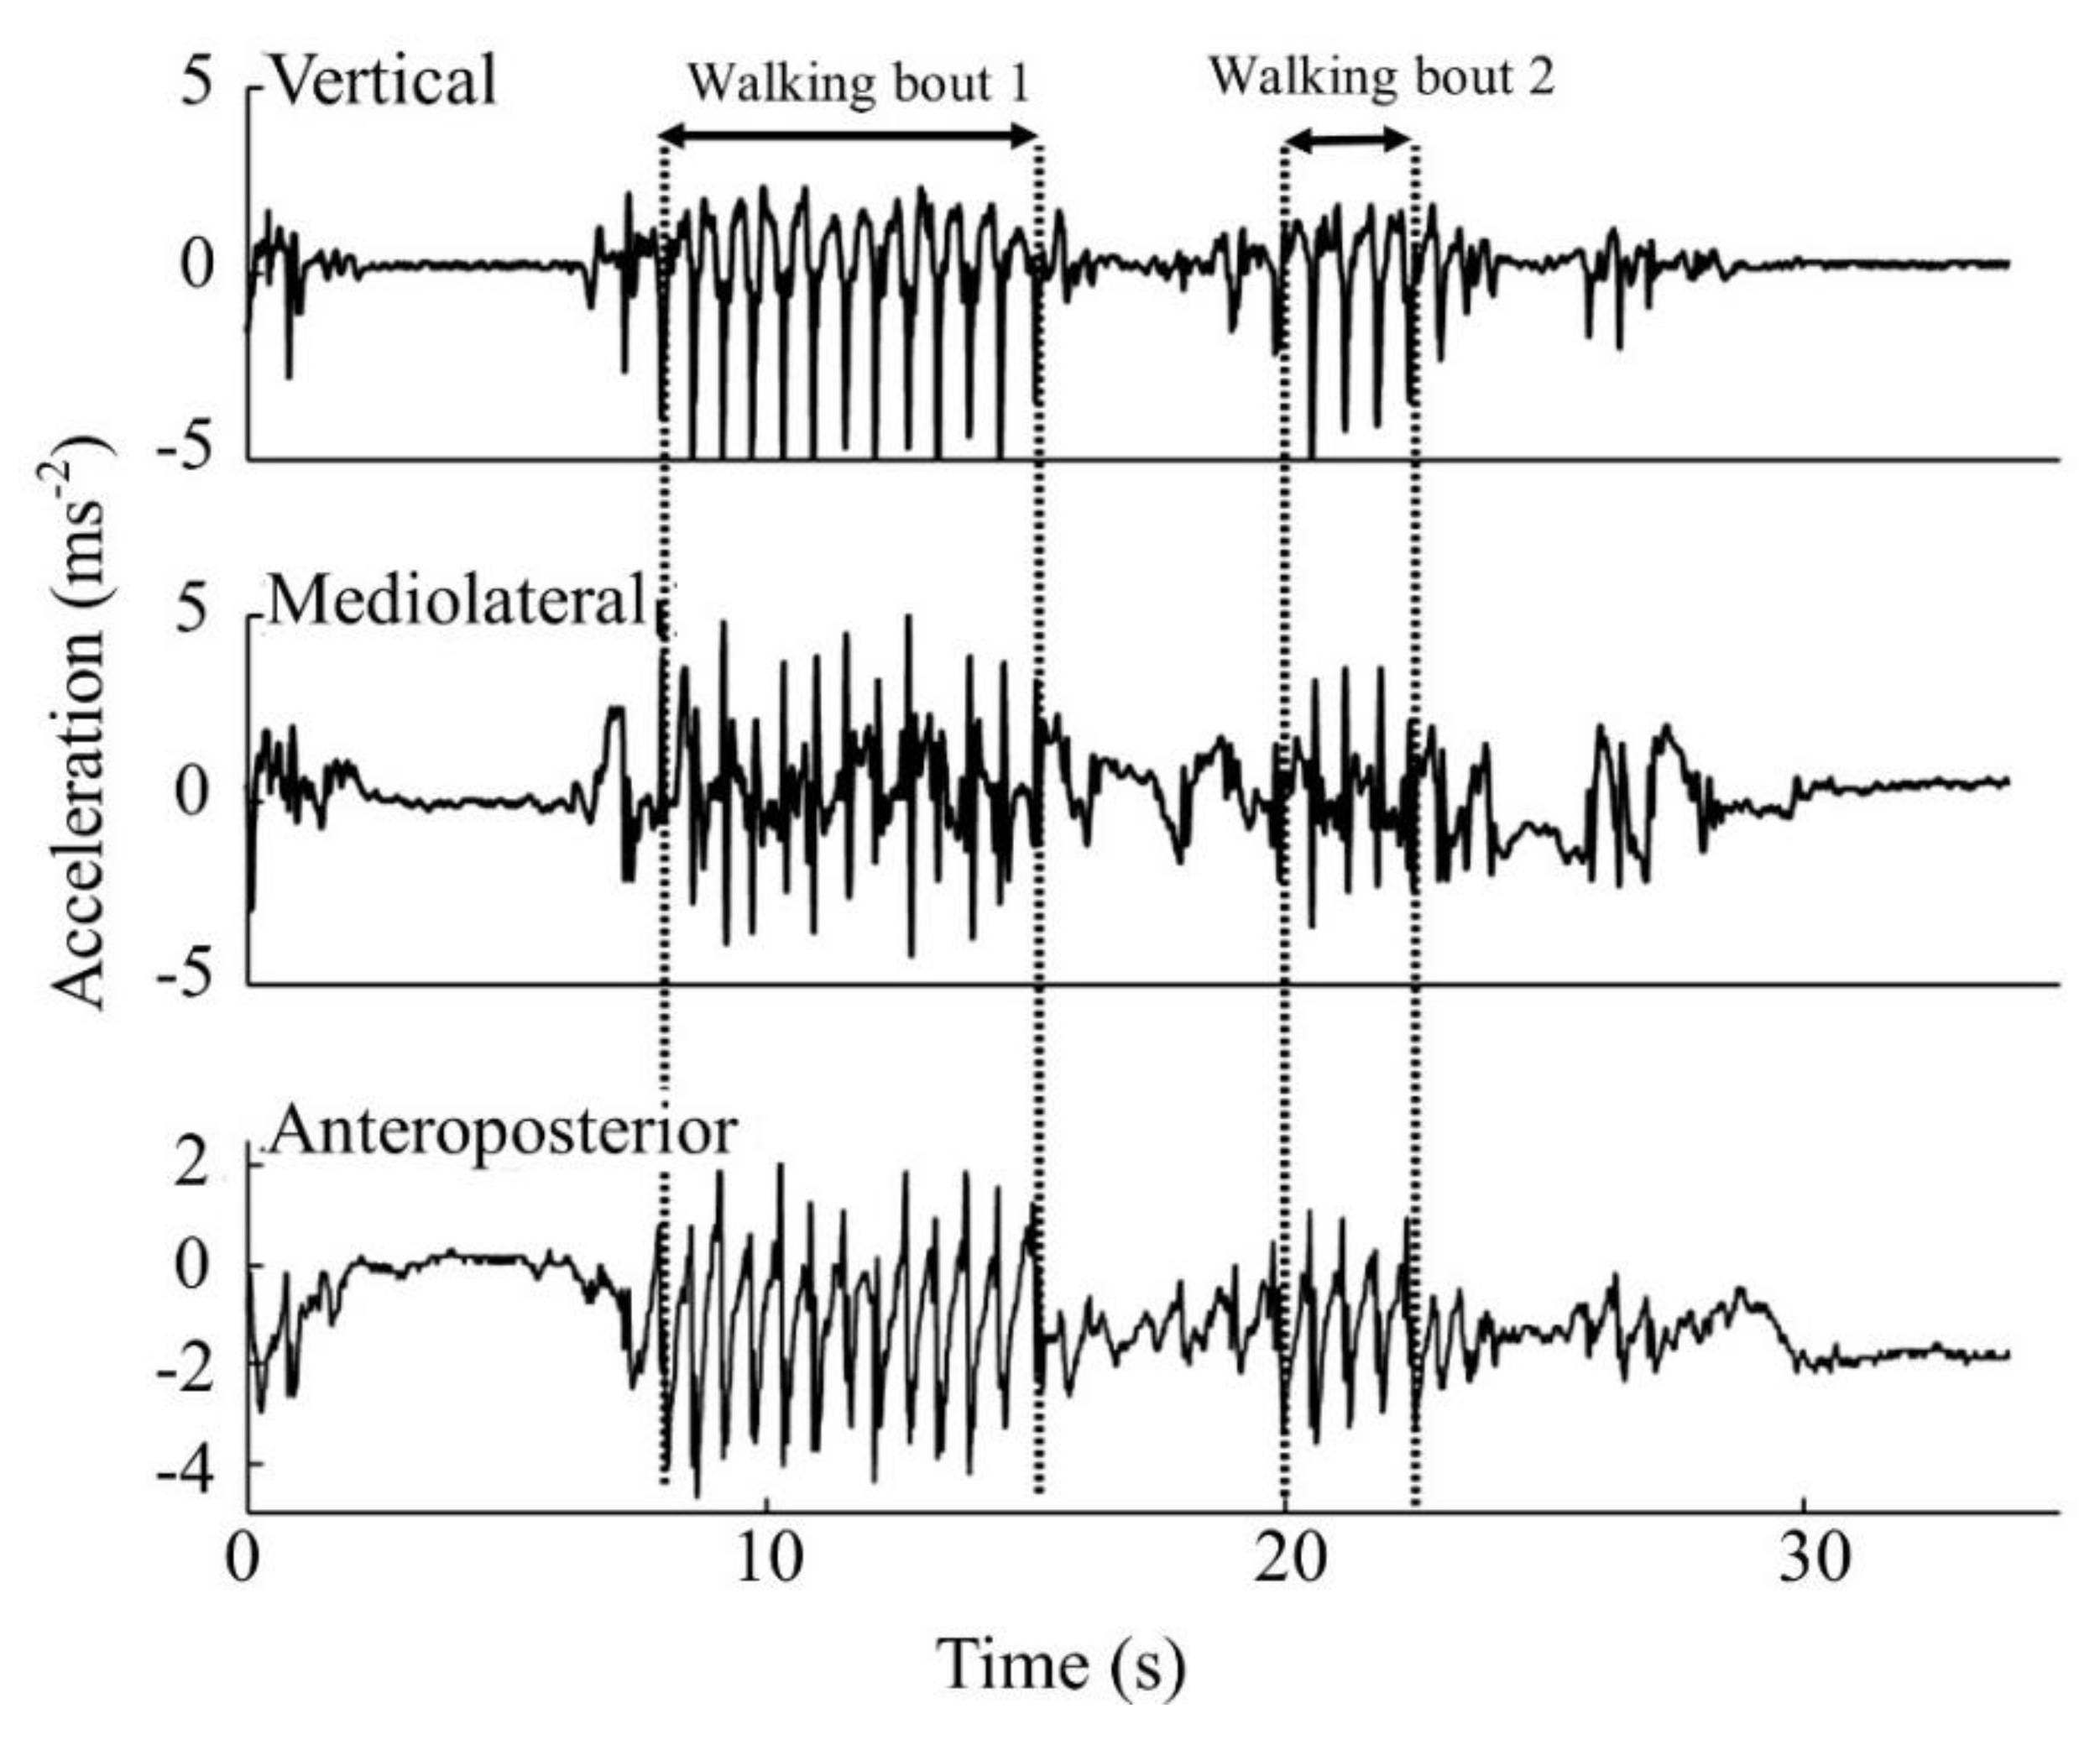
2.4. Real-World Data: Equipment and Procedure

Real-world gait data were collected using a single tri-axial accelerometer-based body worn monitor (BWM) (Axivity AX3, York, UK; dimensions: 23.0 mm × 32.5 mm × 7.6 mm; weight: 11 g; accuracy: 20 parts per million) (Figure 1). This device has previously been validated for recording a high resolution human movement [28]. The BWM was positioned on the skin overlying the fifth lumbar vertebra with a hydrogel adhesive and covered with a Hypafix (BSN Medical Limited, Hull, UK) (Figure 1). The sampling frequency was 100 Hz and the range ± 8 g. The BWM recorded ambulatory activity continuously for seven days. Seven-day accelerometry data were collected at three time-points 18 months apart (time-points TP1, TP2 = TP1 + 18 months, TP3 = TP2 + 18 months). TP1 was approximately 36 months after initial diagnosis of PD for the PD group. Participants were asked to carry out their daily activities as usual and not to alter any routines. On completion of the seven days, participants returned the device by post to the researchers [7].

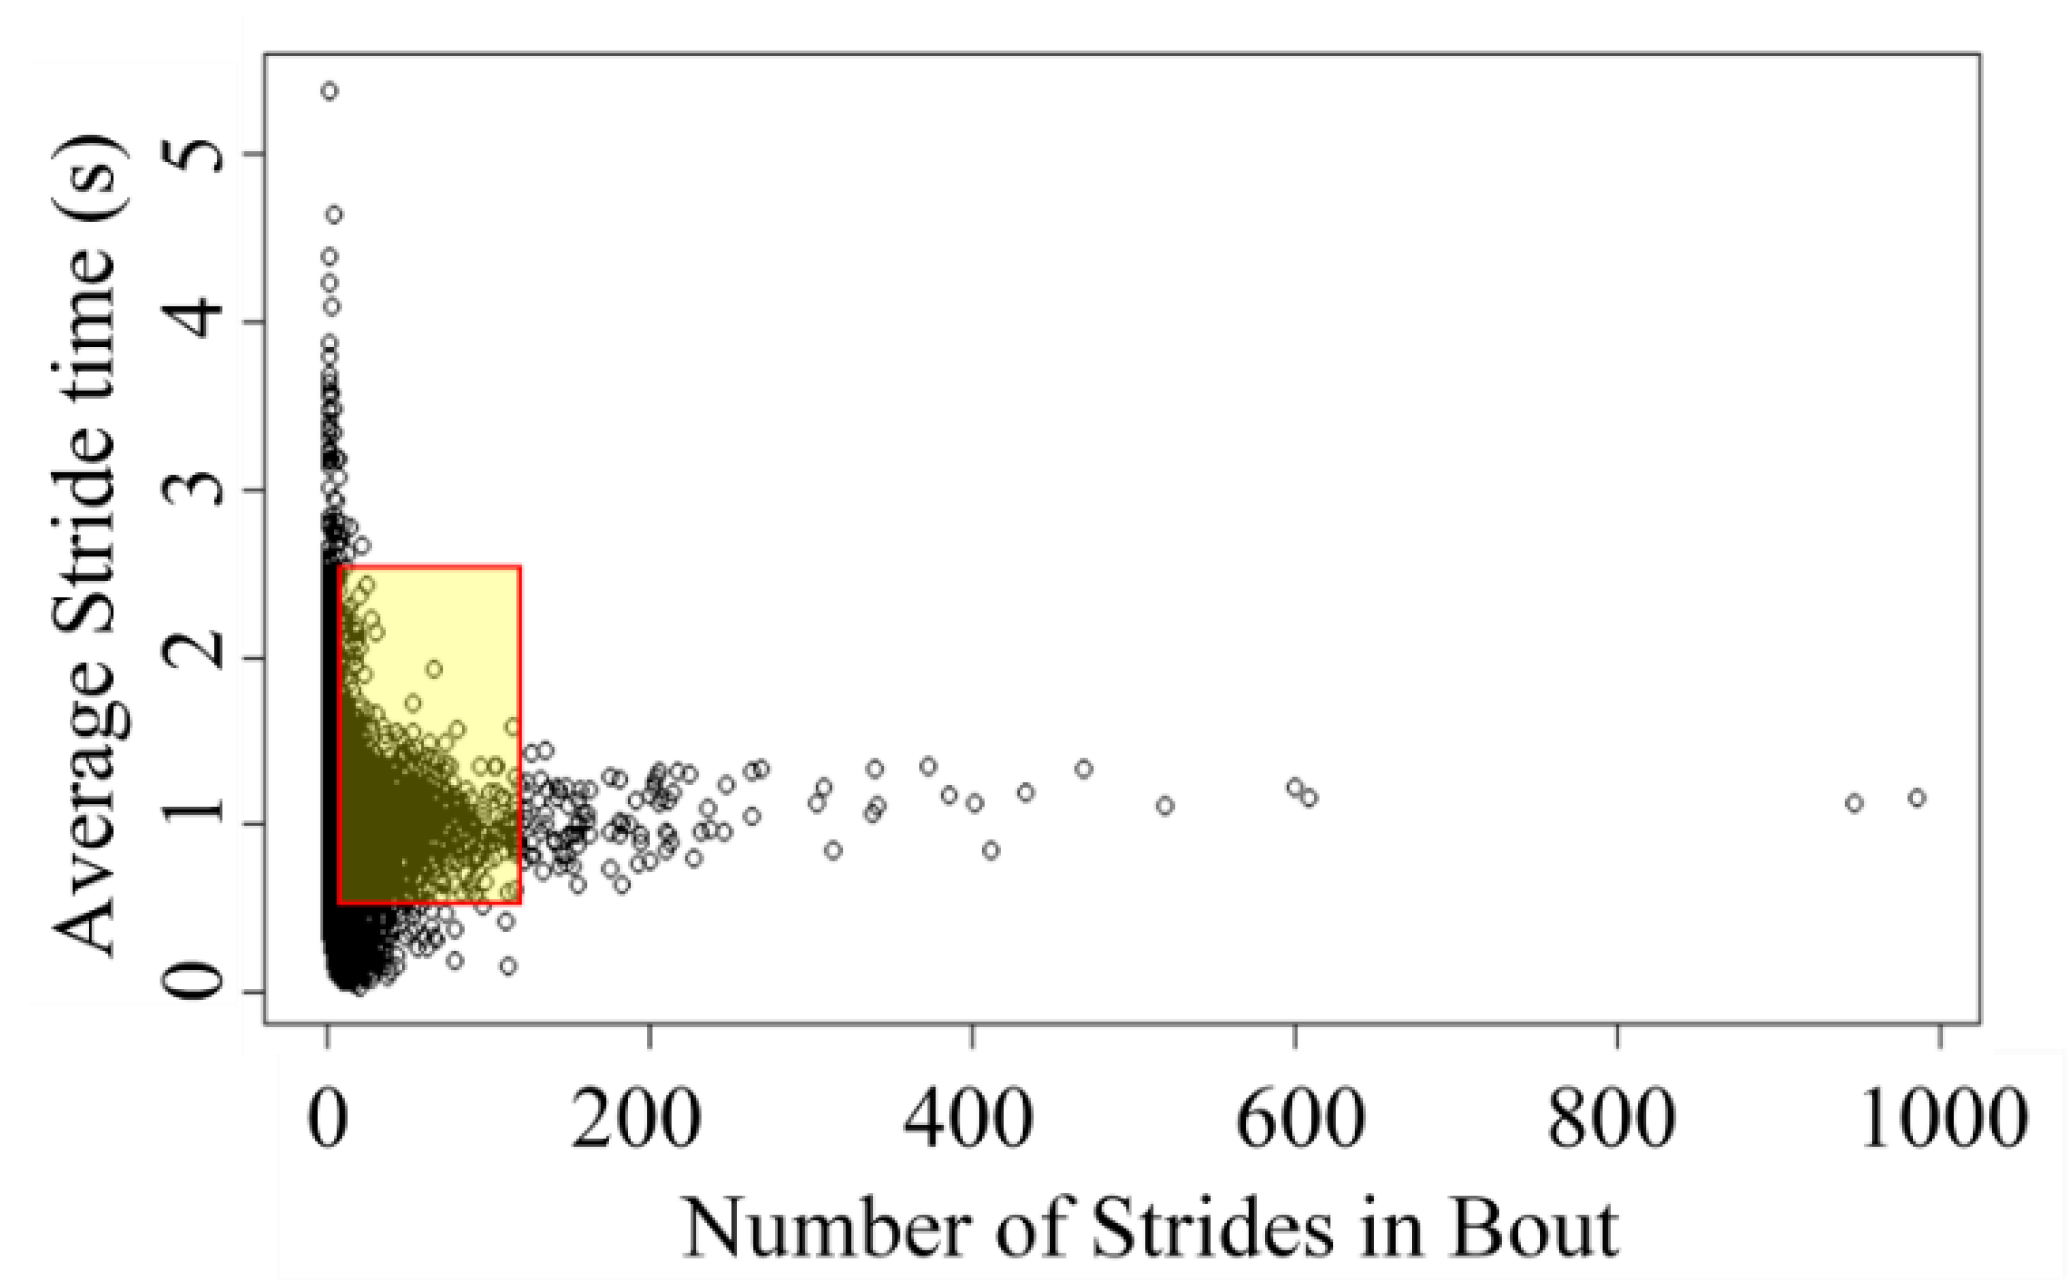
2.5. Data Processing and Analysis

The data from the BWM were downloaded and analyzed with a custom-written MATLAB program, which has previously been validated [4,29]. The data contained all activity recorded during the seven days including sitting, climbing stairs, gardening, and walking. In brief, data were segmented by calendar day and axes transformed to orthogonal gravitational vertical, antero-posterior, and medio lateral axes [30]. Individual ambulatory bouts were identified [31,32,33,34,35,36] and further processed. This method has been validated by comparing gait parameters derived from accelerometry data with parameters calculated from a pressure sensitive mat and wearable body-mounted camera [4,29,32]. Figure 2 shows a segment of BWM output from a real-world data recording.
Thresholds for activity bout length and stride time were applied to all participants‘ data-sets. Shorter activity bouts have a greater stride time variability than longer bouts, although their respective means are similar, centered at approximately 1.2 s (Figure 3). Only bouts of activity between 30 and 60 s were included in the analysis. An inclusion range of 0.5–2.5 s (walking bouts of 12–120 strides) was applied to the parameter stride time [37] as strides outside these times are atypical.

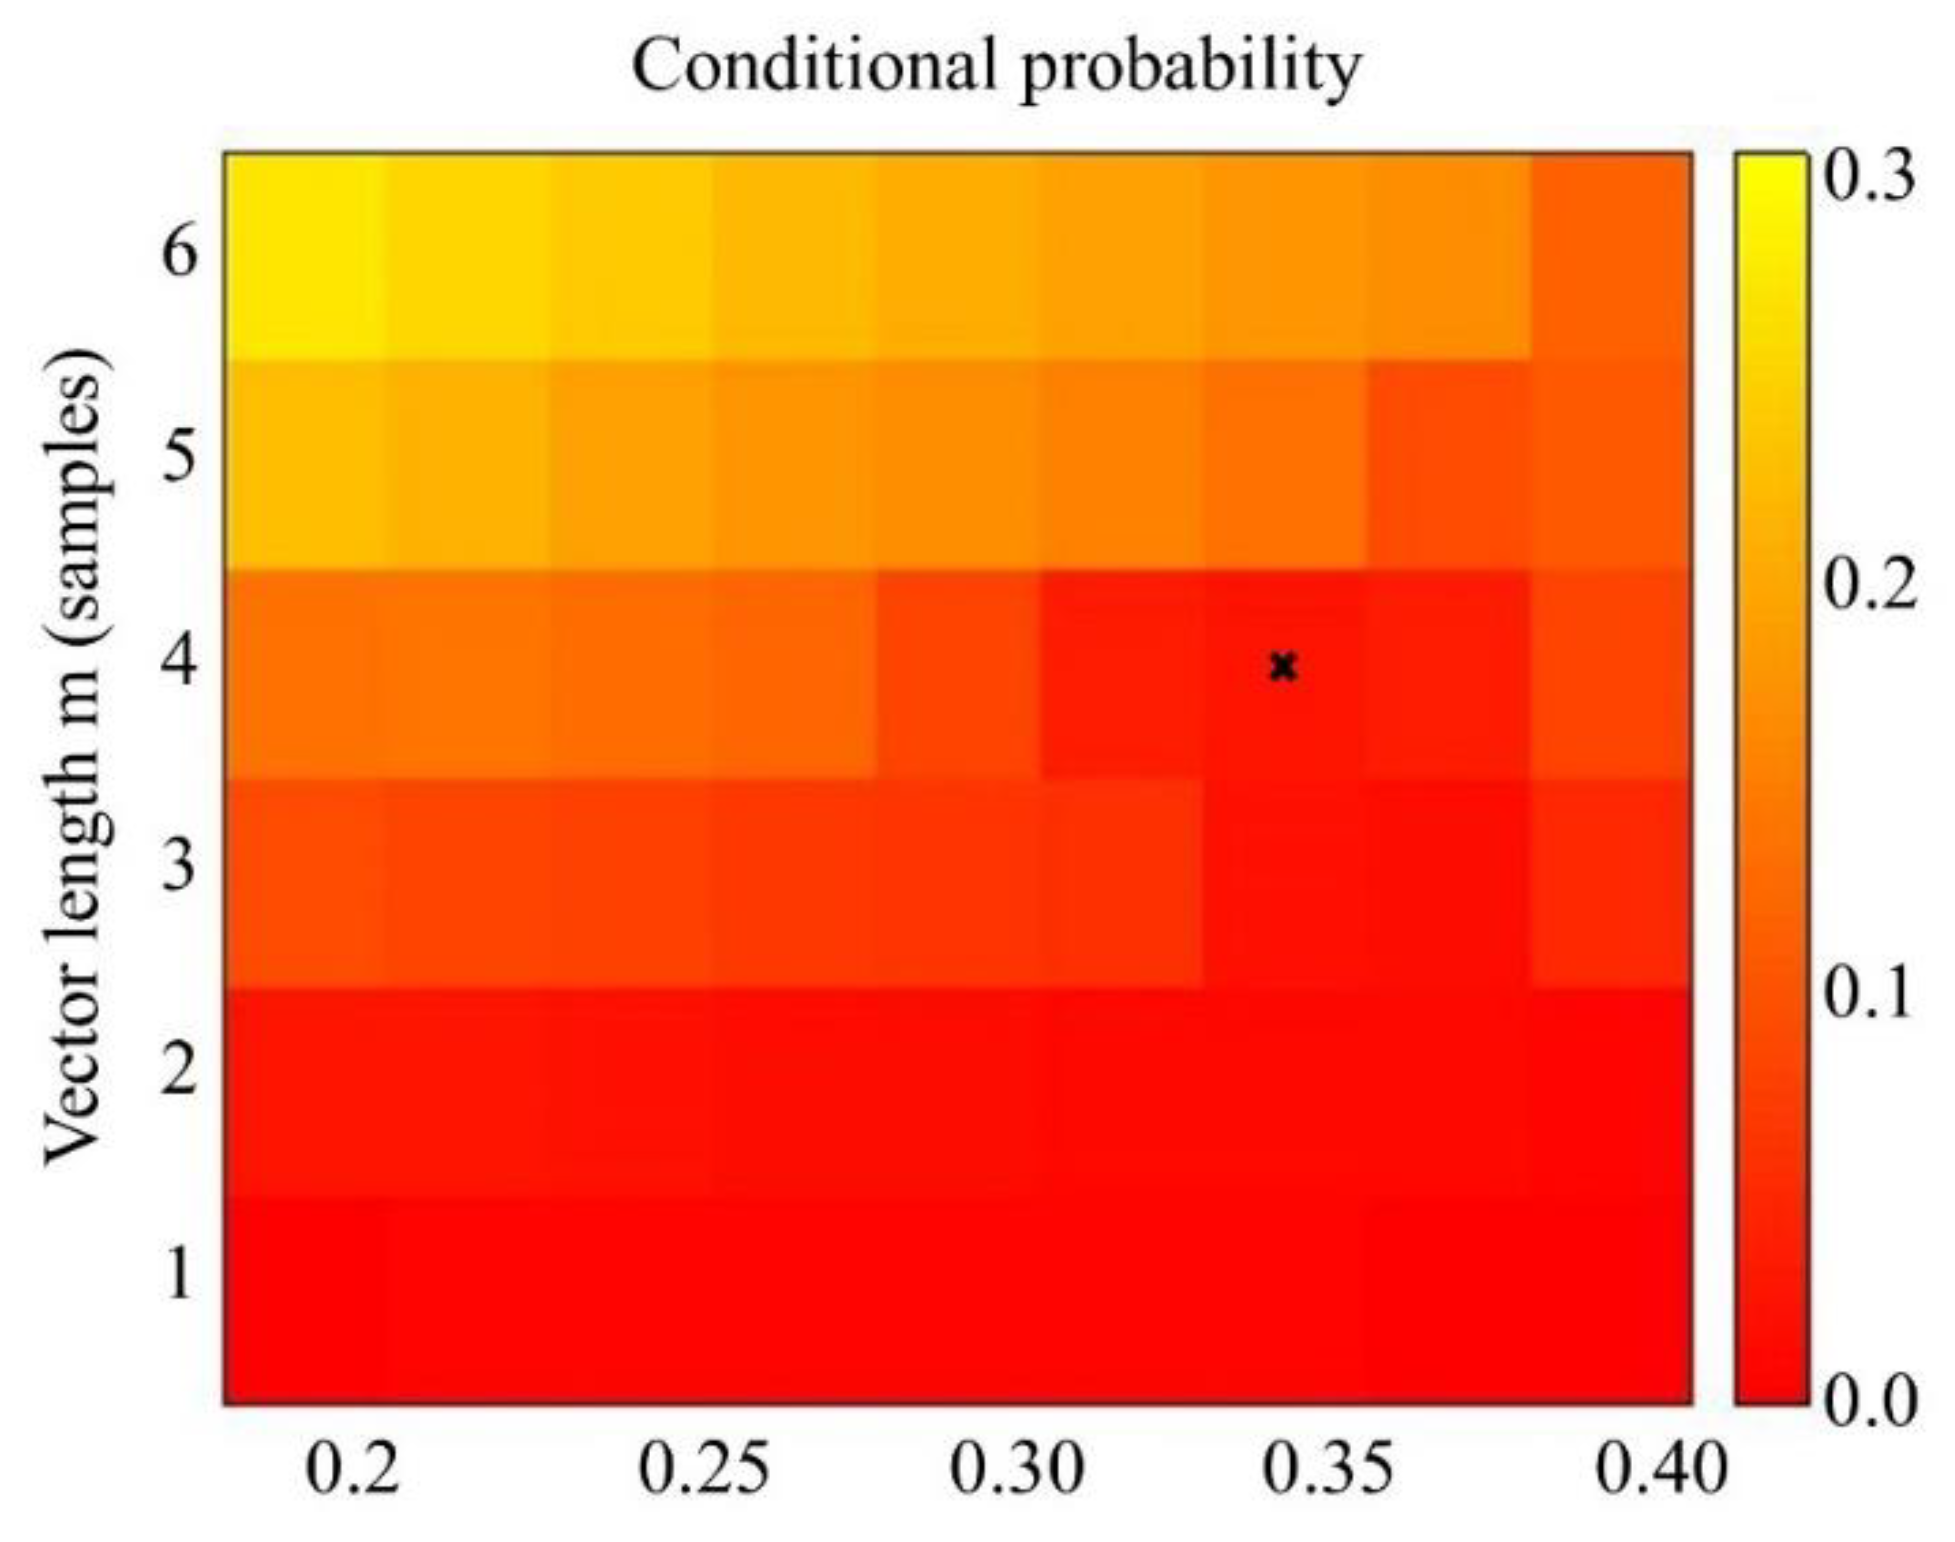
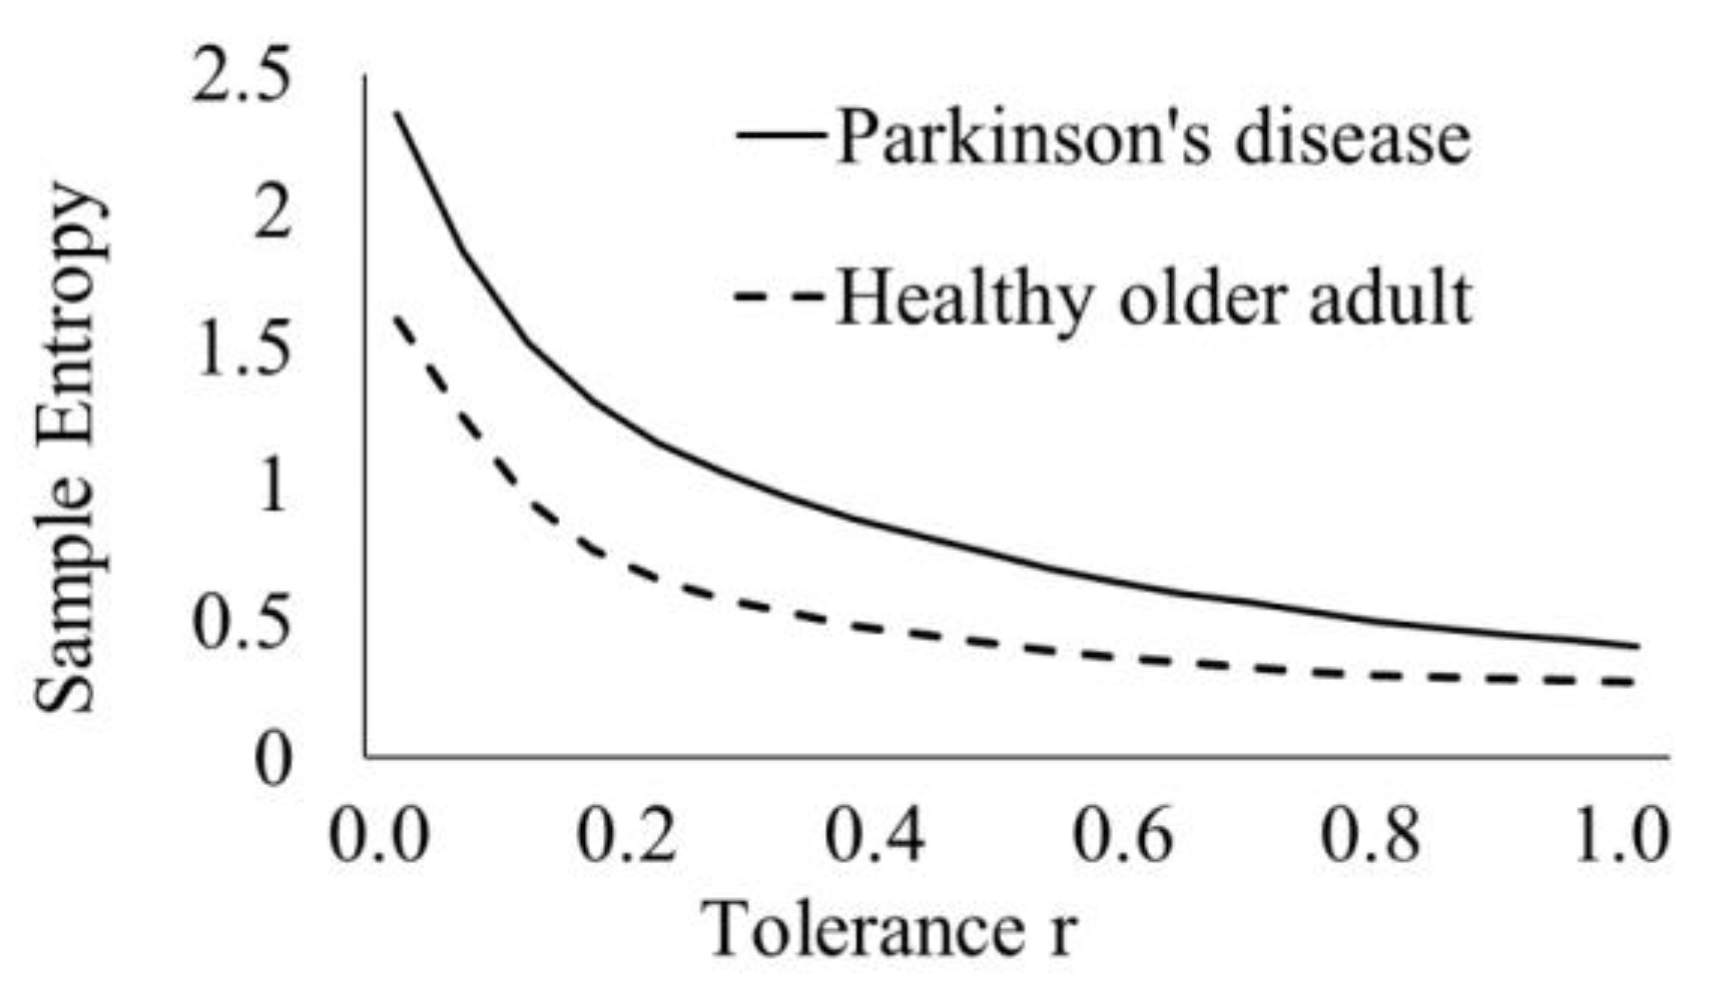
2.6. Calculation of Sample Entropy

Given a time series of N points, SampEnt is defined as the negative natural logarithm of the conditional probability that vectors of length m and m + 1 are repeated, with tolerance, r, and no self-matches [11]. The distance between these repeated vectors, denoted as d[ym(j), ym(k)], is the maximum of the absolute distance between corresponding scalar components [38]. Let B be the number of vector pairs that satisfy:
d [ y m ( j ) , y m ( k ) ] r
where 1 ≤ jN − m and 0 ≤ km − 1. The number of vectors,   B m , which are significantly different are calculated and normalized as:
B m = B N m 1
Repeating the process for vectors of length m + 1, denoting the corresponding value as Bm+1, SampEnt is then calculated by:
S a m p E n t ( m , r , N ) = l n B m + 1 B m
The size of the time series, N, will affect the value of SampEnt with interactions between tolerance r and vector length m reported [39]. Yentes et al. (2013) observed that a minimum of 200 step parameter data points are needed for SampEnt to stabilize [40]. However, too large values of N may affect the calculation of entropy by increasing drift or nonstationarities in the data [41].
SampEnt is dependent on values m and r (Figure 4), therefore, optimal selection is essential. Values of SampEnt, based on our experimental data, decreases with increasing r, in agreement with previous studies [40]. In theory, the accuracy of the entropy estimate relies upon the confidence of the conditional probability and thus, by definition improves with an increased number of matches [41]. Although a short template, m, and wide tolerance r would optimize the number of matches, the entropy estimate is defined in the limit as m tends to infinity and r tends to zero [42], therefore, a suitable compromise must be made. A short template length of, for example m = 1, results in a loss of information as patterns involving longer lengths may not be detected. As the tolerance r increases, there are increased matches and sample entropy tends to zero, however, features may be missed. One method of determining m is to fit an autoregressive (AR) model to the data, whereby the optimal order of the model provides a lower bound for m. If the data came from an autoregressive model of order p, AR(p), then mp [42]. The tolerance, r, is here defined as the multiple of the standard deviation of the data [38]. One method for identifying considers the length of the confidence interval of the conditional probability estimate. The conditional probability, CP, is an estimate of the probability of a match of length m + 1 given there is a match of length m, i.e., Bm+1/Bm. If the matches Bm were independent and fixed, the random variable Bm+1 could be modeled by a binomial distribution and the variance of the conditional probability, CP(1-CP)/Bm. Lake et al. (2002) [42] has shown that the estimate of the variance is:
σ C P 2 = C P ( 1 C P ) B m + K B m + 1 K B m ( C P ) 2 B m 2
where K B m is the number of pairs of matching templates of length m that overlap and K B m + 1 with vectors of length m + 1, respectively [38]. The standard error for sample entropy can then be estimated by σCP /CP, equivalent to the relative error of the conditional probability [38]. For large m and small r, the sample entropy estimate is assumed to be normally distributed and thus, the 95% confidence intervals are defined as:
log ( C P ) ± 1.96 σ C P C P
The optimal value for r is identified by minimizing the quantity:
m a x { σ C P C P ,     σ C P log ( C P ) C P }
which is the maximum of the relative error of sample entropy and conditional probability (CP) estimate, respectively [42].

2.7. Determining Nonlinearity

Establishing the presence of nonlinearity a priori is essential for the application of nonlinear tools. The surrogate method offers a statistical approach for identifying nonlinearity with the null hypothesis testing that the original time series is a linear Gaussian stochastic process [43]. The surrogate data was generated using the iterated amplitude-adjusted Fourier transform (IAAFT) algorithm [44], which preserves the amplitude distribution and power spectrum of the original time series. To test at the 1% significance level, 99 surrogates were generated, and the Mann–Whitney rank sum test was applied.

2.8. Statistical Analysis

Nonparametric statistical tests were applied, given the small number of participants in each group (n = 5). Mann–Whitney rank sum tests were used to assess the nonlinearity of data. The difference between sample entropy of the HOA and PD group was tested with the Wilcoxon signed rank test. The Kendall rank correlation was used to examine associations between SampEnt and clinical features. The statistical significance was set at p < 0.05.

3. Results

3.1. Demographics

All ten participants were male, aged 67.8 ± 9.8 and 73.4 ± 8.1 years, for the PD and HOA participants, respectively (Table 1). The UPDRS-III, a measure of motor function, ranged from 19 to 41 (Table 1) indicating mild to moderate motor dysfunction [45]. Table 2 lists the number of strides and the mean stride times for the three time-points.
Figure 5 shows a heatmap of the maximum relative error of either SampEnt or the conditional probability for our data, calculated for a range of values of m and r. The scale represents the efficiency of the entropy estimate. The maximum value of the efficiency metric is when m ≤ 4. Selecting the maximum value of m = 4 [42], optimum values for r lie between 0.325 and 0.375. Values m = 4 and r = 0.35 were chosen with a conditional probability ≤ 0.05.

3.2. Surrogate Analysis
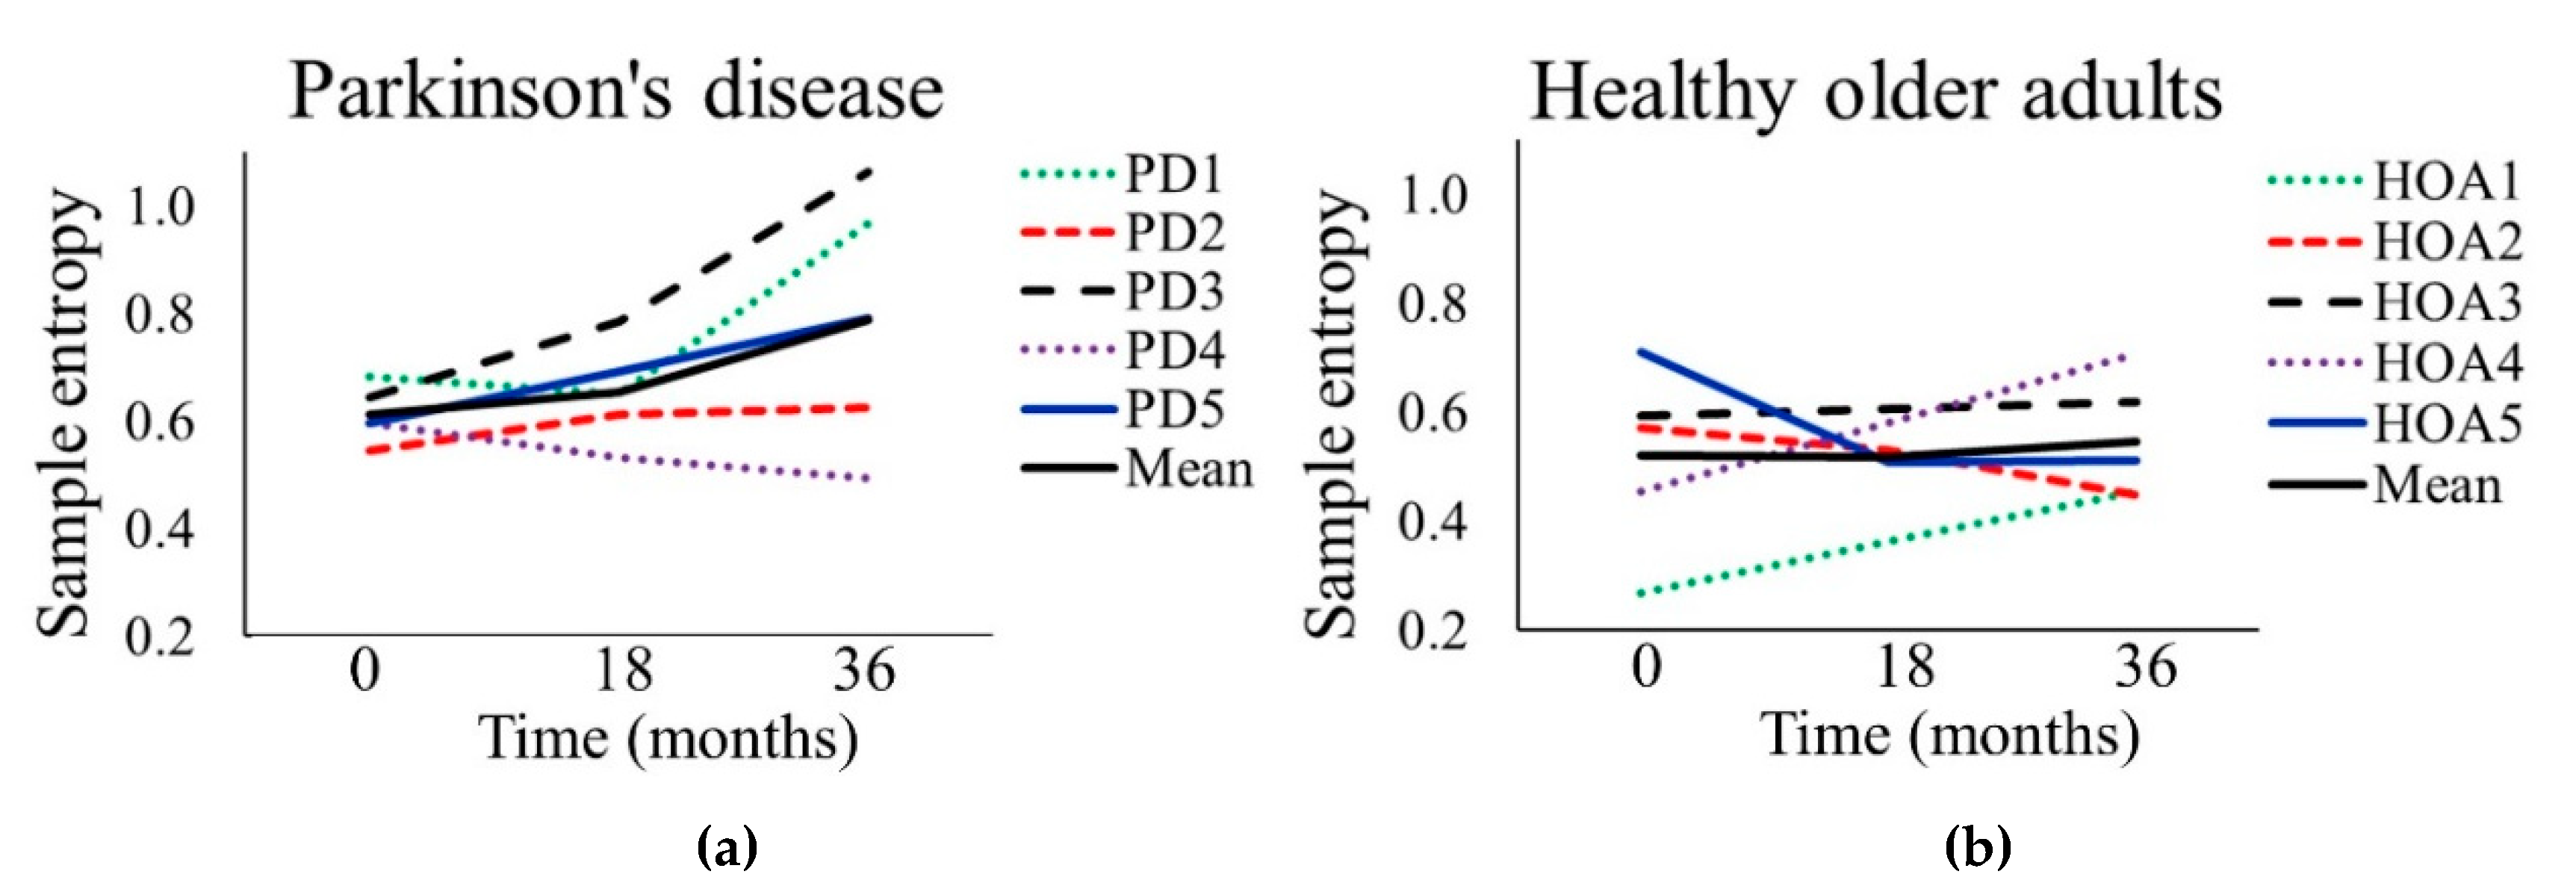
The surrogate data sets for PD and HOA exhibited significantly higher SampEnt values (p < 0.05) than the actual data sets (Table 3), indicating nonlinearity of the stance time real-world data for both groups.

3.3. Sample Entropy

The PD participants had significantly higher SampEnt values (p = 0.008) across the three time-points compared to the HOA group (Table 3). There was no significant change in SampEnt between time-points for either the PD or HOA group. There was a greater range in SampEnt for the PD group at TP3 (0.57) compared to TP1 (0.14) (Figure 6, Table 4).

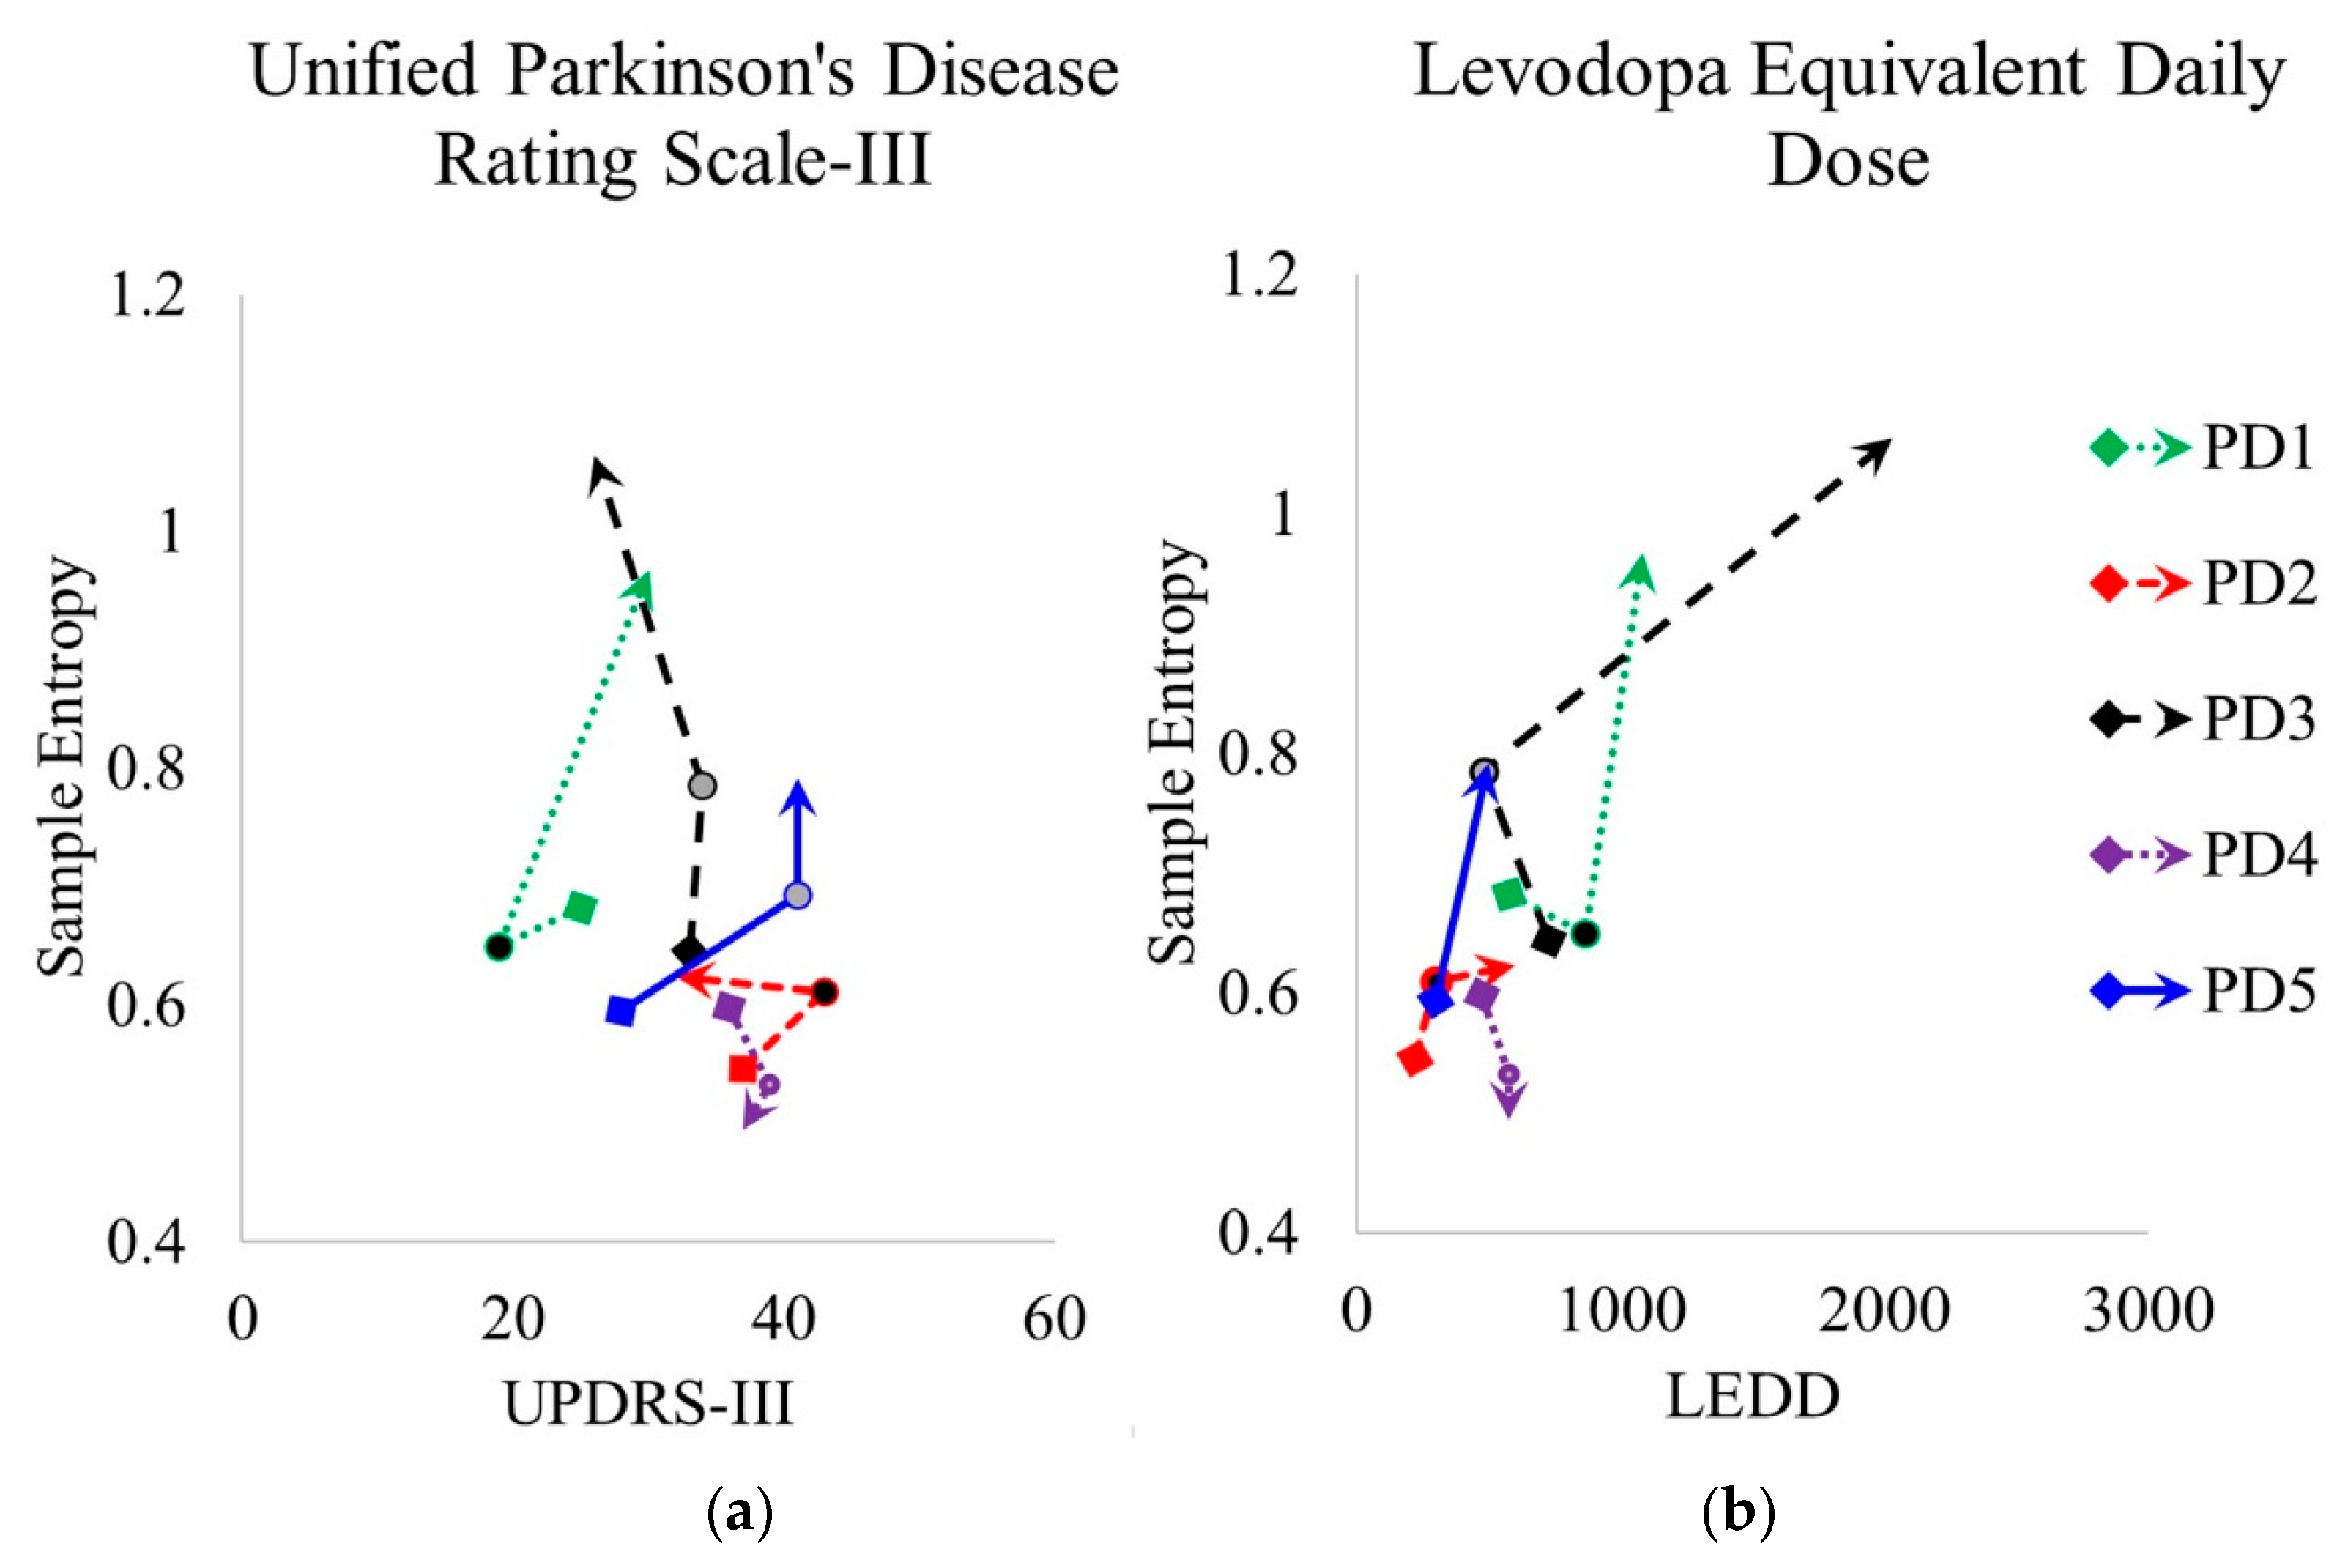
3.4. Clinical Features and Sample Entropy

People with PD displayed different changes in progression of the clinical measure of PD motor severity, UPDRS-III, with two people decreasing their score from time-point 1 to time-point 3, one person displaying little change and two people increasing their scores (Figure 7a). The dopaminergic medication level, LEDD, increased for all five participants from time-point 1 to time-point 3 (Figure 7b). There was no significant association between SampEnt and UPDRS-III (Kendall’s τ = −0.221, p = 0.127). However, a significant correlation was found between SampEnt and LEDD (Kendall’s τ = 0.394, p = 0.021).

4. Discussion

This is the first application to our knowledge of nonlinear methods to real-world gait data of people with PD over an extended time period. The purpose of this study was to examine the feasibility of applying nonlinear analyses to real-world gait data to identify differences between PD and HOA groups. Additionally, we aimed to investigate if nonlinear gait metrics could detect changes over a 36-month period. We hypothesized that regularity would be lower in the PD group and would decrease over 36 months. Supporting our first hypothesis, people with PD had significantly greater SampEnt, indicating lower regularity than the HOA group (Table 3) although it did not increase over time, contrary to our second hypothesis. However, we did observe that there was a positive association between SampEnt and dopaminergic medication levels, which increased over 36 months for all five people with PD.
The lower gait regularity we observed in the PD group may be explained by the greater number of adjustments needed to overcome the increasing instability resulting from impaired sensorimotor integration [46]. Our results are in agreement with two previous studies, which applied recurrence fluctuation analysis and LRA to determine nonlinear variability [14]. This suggests more random gait dynamics in people with PD. However, Kamath (2015) reported that SampEnt of stride time was lower in people with PD (1.27 ± 0.12) compared to healthy adults (1.71 ± 0.13) [15]. This conflicting result may be explained by their parameter selections (vector length m = 3, threshold r = 0.15, number of strides N = 400), younger control group (39.5 ± 18.5 years), and different walking paradigm [15]. Additionally, Kamath reported a shorter stride time and lower standard deviation for the PD group (1.11 ± 0.05 s) and control group (1.07 ± 0.02 s), reflecting the different types of walking data.
Although SampEnt was greater for the PD group, we did not observe any increase over 36 months, contrary to our hypothesized decrease in regularity over time there was, however, an increase in range from TP1 to TP3 in the PD group whereas the range of SampEnt for the HOA group decreased. The absence of change in SampEnt may be related to the varying stages of motor dysfunction, indicated by the MDS-UPDRS-III motor score ranging from 19–43 and different patterns of progression of movement disorder, with no consistent increase or decrease in the PD cohort. A study investigating dynamic postural SampEnt similarly observed increased variability in PD compared to HOA but no change over three years [17]. A further consideration is that the dopaminergic medication will modify gait parameters. A positive correlation between SampEnt and the dosage of dopaminergic medication, which increased over thirty-six months, was observed. One interpretation of this association is that LEDD is an indicator of the severity of the disease, therefore, greater SampEnt is associated with greater disease severity. A different interpretation is causal and is that the effect of dopaminergic medication is to increase stride time variability. However, previous studies have reported reduced stride time variability [47] and greater regularity of ankle joint kinematics [48] when in the ON medication state. Interpretation of LEDD is difficult as a recent study reported that people who had a greater motor response to a levodopa challenge test were prescribed higher levels of LEDD and exhibited reduced deterioration in motor function, quantified by the UPDRS-III score, in the eighteen months prior to the levodopa challenge test [49]. A final factor, which may affect gait due to dopaminergic medication is levodopa induced dyskinesia, abnormal movement patterns that develop directly as a result of dopaminergic medication [50]. However, we thresholded the strides for duration, which is likely to minimize inclusion of gait associated with dyskinesias. One major issue, when considering the association between SampEnt and dopaminergic medication is that there was no constraint in medication levels during recording as gait recordings were collected during the entire day when participants would have been in both the ON and OFF states.
There are several limitations to this study. As this was a feasibility study, data from only a small number of PD and HOA were processed, which reduces the statistical power. The number of strides analyzed, N, differed between participants. Although we did not find a correlation between N and SampEnt, we did not investigate the interactions between m and r. However, given that the minimum number of strides examined for each participant was over 4600, SampEnt is expected to have stabilized and not to change with the increasing N. Future work will include extracting nonlinear parameters from other gait metrics and domains from a larger number of participants. Additional nonlinear measures will be determined such as local dynamic stability or the correlation dimension.

5. Conclusions

Analysis of 262,735 strides during real-world walking over a 36-month period indicated significantly lower regularity of stride time in people with Parkinson’s compared to healthy age-matched older adults. The novelty of this study is that we analyzed real-world gait, recorded over seven days, during a 36-month period. The importance of real-world gait data is that not only are changes in internal gait timing systems monitored but also responses to external perturbations assessed as individuals undertake complex walking tasks such as crossing roads, turning corners, talking, and adjusting speed. Additionally, real-world data recorded over several days incorporate circadian variations, different levels of dopaminergic medication reflecting both the ON and OFF states, day to day fluctuations in mood, and variations in daily activities, which may modify gait. The lower regularity of stride time in people with PD may reflect not only deterioration of dopaminergic neurons within the basal ganglia but also changes in other subcomponents such as the postulated spinal central pattern generator circuits controlling gait and the response to external environmental perturbations. Although some variability of gait parameters is desirable, indicating flexibility and ability to adjust to perturbations, too high a variability implies an unstable control system and instability leading to falls. We did not observe an increase in sample entropy with disease duration, which may be due to the small sample size and heterogeneity of the individual participants in addition to the effect of medication. However, we did observe a positive correlation between SampEnt and LEDD, the dopaminergic medication daily dose. Further investigation is needed to determine underlying causes for this association. In summary, applying sample entropy algorithms to real-world data shows potential as a method to differentiate people with PD from HOA. However, it is essential that appropriate vector lengths and thresholds are established, and signals are tested for nonlinearity. Further analyses are essential, involving greater numbers of participants, applying different methods of nonlinear analysis, investigating different gait parameters, and relating the nonlinear measures to functional measures.

Author Contributions

Conceptualization, L.C., J.S., and A.P.; methodology, L.C., J.S., S.D.D., and A.P.; software, L.C. and A.P.; validation, L.C. and A.P.; formal analysis, L.C.; investigation, L.C., J.S., and A.P.; data curation, L.C.; writing—original draft preparation, L.C., J.S., and A.P.; writing—review and editing, L.C, J.C., L.R., S.D.D., and A.P.; visualization, L.C. and A.P.; supervision, J.S. and A.P.; project administration, J.S. and A.P.; funding acquisition, L.R. All authors have read and agreed to the published version of the manuscript.

Funding

The ICICLE-PD GAIT study was supported by Parkinson’s UK (J-0802, G-1301) and by the NIHR Newcastle Biomedical Research Centre. Additional support was provided by the NIHR/Welcome Trust Clinical Research Facility (CRF) infrastructure at Newcastle upon Tyne Hospitals NHS Foundation Trust and Newcastle University.

Acknowledgments

The authors would like to thank Gordon Duncan, Alison Yarnall, Dadirayi Mhiripiri, Rosie Morris, Philip Brown, and Lisa Alcock for their assistance in recruitment and data collection.

Conflicts of Interest

The authors declare no conflict of interest.

Abbreviations

The following abbreviations are used in this manuscript:
BWMBody worn monitor
CVCoefficient of variation
HOAHealthy older adults
LRALong range autocorrelation
MDS-UPDRSMovement Disorder Society-Unified Parkinson’s Disease Rating Scale
PDParkinson’s disease
SampEntSample entropy
TP1Time-point 1 (36 months after initial diagnosis for people with Parkinson’s)
TP2Time-point 2 = TP1 + 18 months
TP3Time-point 2 = TP2 + 18 months

References

  1. Lunenfeld, B.; Stratton, P. The clinical consequences of an ageing world and preventive strategies. Best Pr. Res. Clin. Obs. Gynaecol. 2013, 27, 643–659. [Google Scholar] [CrossRef] [PubMed] [Green Version]
  2. Horsfall, L.; Petersen, I.; Walters, K.; Schrag, A. Time trends in incidence of Parkinson’s disease diagnosis in UK primary care. J. Neurol. 2013, 260, 1351–1357. [Google Scholar] [CrossRef] [PubMed]
  3. Lord, S.; Galna, B.; Yarnall, A.J.; Morris, R.; Coleman, S.; Burn, D.; Rochester, L. Natural history of falls in an incident cohort of Parkinson’s disease: Early evolution, risk and protective features. J. Neurol. 2017, 264, 2268–2276. [Google Scholar] [CrossRef] [PubMed] [Green Version]
  4. Del Din, S.; Godfrey, A.; Galna, B.; Lord, S.; Rochester, L. Free-living gait characteristics in ageing and Parkinson’s disease: Impact of environment and ambulatory bout length. J. Neuroeng. Rehabil. 2016, 13, 46. [Google Scholar] [CrossRef] [Green Version]
  5. Robles-Garcia, V.; Corral-Bergantinos, Y.; Espinosa, N.; Jacome, M.A.; Garcia-Sancho, C.; Cudeiro, J.; Arias, P. Spatiotemporal Gait Patterns During Overt and Covert Evaluation in Patients With Parkinson s Disease and Healthy Subjects: Is There a Hawthorne Effect? J. Appl. Biomech. 2015, 31, 189–194. [Google Scholar] [CrossRef]
  6. Del Din, S.; Hickey, A.; Hurwitz, N.; Mathers, J.C.; Rochester, L.; Godfrey, A. Measuring gait with an accelerometer-based wearable: Influence of device location, testing protocol and age. Physiol. Meas. 2016, 37, 1785–1797. [Google Scholar] [CrossRef]
  7. Del Din, S.; Hickey, A.; Woodman, S.; Hiden, H.; Morris, R.; Watson, P.; Nazarpour, K.; Catt, M.; Rochester, L.; Godfrey, A. Accelerometer based gait assessment: Pragmatic deployment on an international scale. In Proceedings of the 2016 IEEE Statistical Signal Processing Workshop (SSP), Palma de Mallorca, Spain, 26–29 June 2016. [Google Scholar]
  8. Baker, K.; Rochester, L.; Nieuwboer, A. The effect of cues on gait variability—Reducing the attentional cost of walking in people with Parkinson’s disease. Parkinsonism Relat. Disord. 2008, 14, 314–320. [Google Scholar] [CrossRef]
  9. Frenkel-Toledo, S.; Giladi, N.; Peretz, C.; Herman, T.; Gruendlinger, L.; Hausdorff, J.M. Effect of gait speed on gait rhythmicity in Parkinson’s disease: Variability of stride time and swing time respond differently. J. Neuroeng. Rehabil. 2005, 2, 23. [Google Scholar] [CrossRef] [Green Version]
  10. Hausdorff, J.M.; Schaafsma, J.D.; Balash, Y.; Bartels, A.L.; Gurevich, T.; Giladi, N. Impaired regulation of stride variability in Parkinson’s disease subjects with freezing of gait. Exp. Brain Res. 2003, 149, 187–194. [Google Scholar] [CrossRef]
  11. Schaafsma, J.D.; Giladi, N.; Balash, Y.; Bartels, A.L.; Gurevich, T.; Hausdorff, J.M. Gait dynamics in Parkinson’s disease: Relationship to Parkinsonian features, falls and response to levodopa. J. Neurol. Sci. 2003, 212, 47–53. [Google Scholar] [CrossRef]
  12. Kurz, M.J.; Wilson, T.W.; Arpin, D.J. Stride-time variability and sensorimotor cortical activation during walking. Neuroimage 2012, 59, 1602–1607. [Google Scholar] [CrossRef] [PubMed]
  13. Warlop, T.; Detrembleur, C.; Buxes Lopez, M.; Stoquart, G.; Lejeune, T.; Jeanjean, A. Does Nordic Walking restore the temporal organization of gait variability in Parkinson’s disease? J. Neuroeng. Rehabil. 2017, 14, 17. [Google Scholar] [CrossRef] [PubMed] [Green Version]
  14. Hausdorff, J.M. Gait dynamics in Parkinson’s disease: Common and distinct behavior among stride length, gait variability, and fractal-like scaling. Chaos 2009, 19, 026113. [Google Scholar] [CrossRef] [PubMed] [Green Version]
  15. Kamath, C. A novel perspective to assessment of neurodegenerative disorder gait. Sci. Postprint 2015, 1, e00051. [Google Scholar] [CrossRef]
  16. Warlop, T.; Detrembleur, C.; Bollens, B.; Stoquart, G.; Crevecoeur, F.; Jeanjean, A.; Lejeune, T.M. Temporal organization of stride duration variability as a marker of gait instability in Parkinson’s disease. J. Rehabil. Med. 2016, 48, 865–871. [Google Scholar] [CrossRef] [PubMed] [Green Version]
  17. Pantall, A.; Del Din, S.; Rochester, L. Longitudinal changes over thirty-six months in postural control dynamics and cognitive function in people with Parkinson’s disease. Gait Posture 2018, 62, 468–474. [Google Scholar] [CrossRef] [PubMed] [Green Version]
  18. Ihlen, E.A.F.; van Schooten, K.S.; Bruijn, S.M.; van Dieen, J.H.; Vereijken, B.; Helbostad, J.L.; Pijnappels, M. Improved Prediction of Falls in Community-Dwelling Older Adults Through Phase-Dependent Entropy of Daily-Life Walking. Front. Aging Neurosci. 2018, 10, 44. [Google Scholar] [CrossRef] [Green Version]
  19. Ihlen, E.A.F.; Weiss, A.; Bourke, A.; Helbostad, J.L.; Hausdorff, J.M. The complexity of daily life walking in older adult community-dwelling fallers and non-fallers. J. Biomech. 2016, 49, 1420–1428. [Google Scholar] [CrossRef]
  20. Alcaraz, R.; Abasolo, D.; Hornero, R.; Rieta, J.J. Optimal parameters study for sample entropy-based atrial fibrillation organization analysis. Comput. Methods Programs Biomed. 2010, 99, 124–132. [Google Scholar] [CrossRef] [Green Version]
  21. Shi, L.; Duan, F.; Yang, Y.; Sun, Z. The Effect of Treadmill Walking on Gait and Upper Trunk through Linear and Nonlinear Analysis Methods. Sensors 2019, 19, 2204. [Google Scholar] [CrossRef] [Green Version]
  22. Sokunbi, M.O. Sample entropy reveals high discriminative power between young and elderly adults in short fMRI data sets. Front. Neuroinform. 2014, 8, 69. [Google Scholar] [CrossRef] [PubMed]
  23. Pincus, S.M. Approximate entropy as a measure of system complexity. Proc. Natl. Acad. Sci. USA 1991, 88, 2297–2301. [Google Scholar] [CrossRef] [PubMed] [Green Version]
  24. Richman, J.S.; Moorman, J.R. Physiological time-series analysis using approximate entropy and sample entropy. Am. J. Physiol. Heart Circ. Physiol. 2000, 278, H2039–H2049. [Google Scholar] [CrossRef] [PubMed] [Green Version]
  25. Khoo, T.K.; Yarnall, A.J.; Duncan, G.W.; Coleman, S.; O’Brien, J.T.; Brooks, D.J.; Barker, R.A.; Burn, D.J. The spectrum of nonmotor symptoms in early Parkinson disease. Neurology 2013, 80, 276–281. [Google Scholar] [CrossRef] [PubMed] [Green Version]
  26. Hughes, A.J.; Daniel, S.E.; Kilford, L.; Lees, A.J. Accuracy of clinical diagnosis of idiopathic Parkinson’s disease: A clinico-pathological study of 100 cases. J. Neurol. Neurosurg. Psychiatry 1992, 55, 181–184. [Google Scholar] [CrossRef] [PubMed] [Green Version]
  27. Tomlinson, C.L.; Stowe, R.; Patel, S.; Rick, C.; Gray, R.; Clarke, C.E. Systematic review of levodopa dose equivalency reporting in Parkinson’s disease. Mov. Disord. 2010, 25, 2649–2653. [Google Scholar] [CrossRef]
  28. Ladha, C.; Ladha, K.; Jackson, D.; Olivier, P. Shaker table validation of OpenMovement AX3 accelerometer. In Proceedings of the 3rd International Conference on Ambulatory Monitoring of Physical Activity and Movement, Ahmerst, MA, USA, 17–19 June 2013; pp. 69–70. [Google Scholar]
  29. Hickey, A.; Del Din, S.; Rochester, L.; Godfrey, A. Detecting free-living steps and walking bouts: Validating an algorithm for macro gait analysis. Physiol. Meas. 2017, 38, N1–N15. [Google Scholar] [CrossRef]
  30. Moe-Nilssen, R. A new method for evaluating motor control in gait under real-life environmental conditions. Part 1: The instrument. Clin. Biomech. (Bristolavon) 1998, 13, 320–327. [Google Scholar] [CrossRef]
  31. Lyons, G.M.; Culhane, K.M.; Hilton, D.; Grace, P.A.; Lyons, D. A description of an accelerometer-based mobility monitoring technique. Med. Eng. Phys. 2005, 27, 497–504. [Google Scholar] [CrossRef]
  32. Del Din, S.; Godfrey, A.; Rochester, L. Validation of an accelerometer to quantify a comprehensive battery of gait characteristics in healthy older adults and Parkinson’s disease: Toward clinical and at home use. IEEE J. Biomed. Health Inform. 2016, 20, 838–847. [Google Scholar] [CrossRef]
  33. Godfrey, A.; Del Din, S.; Barry, G.; Mathers, J.C.; Rochester, L. Instrumenting gait with an accelerometer: A system and algorithm examination. Med. Eng. Phys. 2015, 37, 400–407. [Google Scholar] [CrossRef] [PubMed]
  34. Godfrey, A.; Lord, S.; Galna, B.; Mathers, J.C.; Burn, D.J.; Rochester, L. The association between retirement and age on physical activity in older adults. Age Ageing 2014, 43, 386–393. [Google Scholar] [CrossRef] [PubMed] [Green Version]
  35. Lord, S.; Galna, B.; Verghese, J.; Coleman, S.; Burn, D.; Rochester, L. Independent domains of gait in older adults and associated motor and nonmotor attributes: Validation of a factor analysis approach. J. Gerontol. A Biol. Sci. Med. Sci. 2013, 68, 820–827. [Google Scholar] [CrossRef] [PubMed] [Green Version]
  36. Zijlstra, W.; Hof, A.L. Assessment of spatio-temporal gait parameters from trunk accelerations during human walking. Gait Posture 2003, 18, 1–10. [Google Scholar] [CrossRef] [Green Version]
  37. Najafi, B.; Aminian, K.; Paraschiv-Ionescu, A.; Loew, F.; Bula, C.J.; Robert, P. Ambulatory system for human motion analysis using a kinematic sensor: Monitoring of daily physical activity in the elderly. IEEE Trans. Biomed. Eng. 2003, 50, 711–723. [Google Scholar] [CrossRef]
  38. Richman, J.S.; Lake, D.E.; Moorman, J.R. Sample entropy. Methods Enzym. 2004, 384, 172–184. [Google Scholar]
  39. Yentes, J.M.; Denton, W.; McCamley, J.; Raffalt, P.C.; Schmid, K.K. Effect of parameter selection on entropy calculation for long walking trials. Gait Posture 2018, 60, 128–134. [Google Scholar] [CrossRef] [Green Version]
  40. Yentes, J.M.; Hunt, N.; Schmid, K.K.; Kaipust, J.P.; McGrath, D.; Stergiou, N. The appropriate use of approximate entropy and sample entropy with short data sets. Ann. Biomed. Eng. 2013, 41, 349–365. [Google Scholar] [CrossRef]
  41. Costa, M.; Goldberger, A.L.; Peng, C.K. Multiscale entropy analysis of biological signals. Phys. Rev. E Stat. Nonlin Soft Matter Phys. 2005, 71, 021906. [Google Scholar] [CrossRef] [Green Version]
  42. Lake, D.E.; Richman, J.S.; Griffin, M.P.; Moorman, J.R. Sample entropy analysis of neonatal heart rate variability. Am. J. Physiol. Regul. Integr. Comp. Physiol. 2002, 283, R789–R797. [Google Scholar] [CrossRef] [Green Version]
  43. Stergiou, N. Nonlinear Analysis for Human Movement Variability; CRC Press: Boca Raton, FL, USA, 2016; p. xiii. 394p. [Google Scholar]
  44. Schreiber, T.; Schmitz, A. Improved Surrogate Data for Nonlinearity Tests. Phys. Rev. Lett. 1996, 77, 635–638. [Google Scholar] [CrossRef] [PubMed] [Green Version]
  45. Martinez-Martin, P.; Rodriguez-Blazquez, C.; Mario, A.; Arakaki, T.; Arillo, V.C.; Chana, P.; Fernandez, W.; Garretto, N.; Martinez-Castrillo, J.C.; Rodriguez-Violante, M.; et al. Parkinson’s disease severity levels and MDS-Unified Parkinson’s Disease Rating Scale. Parkinsonism Relat. Disord. 2015, 21, 50–54. [Google Scholar] [CrossRef] [PubMed] [Green Version]
  46. Dingwell, J.B.; Cusumano, J.P. Nonlinear time series analysis of normal and pathological human walking. Chaos 2000, 10, 848–863. [Google Scholar] [CrossRef] [PubMed]
  47. Bryant, M.S.; Rintala, D.H.; Hou, J.G.; Collins, R.L.; Protas, E.J. Gait variability in Parkinson’s disease: Levodopa and walking direction. Acta Neurol. Scand. 2016, 134, 83–86. [Google Scholar] [CrossRef]
  48. Kurz, M.J.; Hou, J.G. Levodopa influences the regularity of the ankle joint kinematics in individuals with Parkinson’s disease. J. Comput. Neurosci. 2010, 28, 131–136. [Google Scholar] [CrossRef]
  49. Malek, N.; Kanavou, S.; Lawton, M.A.; Pitz, V.; Grosset, K.A.; Bajaj, N.; Barker, R.A.; Ben-Shlomo, Y.; Burn, D.J.; Foltynie, T.; et al. L-dopa responsiveness in early Parkinson’s disease is associated with the rate of motor progression. Parkinsonism Relat. Disord. 2019, 65, 55–61. [Google Scholar] [CrossRef]
  50. Thanvi, B.; Lo, N.; Robinson, T. Levodopa-induced dyskinesia in Parkinson’s disease: Clinical features, pathogenesis, prevention and treatment. Postgrad Med. J. 2007, 83, 384–388. [Google Scholar] [CrossRef]
Figure 1. (a) Experimental setup: The site of attachment and orientation of the tri-axial accelerometer device on the lower back (L5). In dark grey x (vertical) axis, in black y (mediolateral) axis, and in light grey z (anteroposterior) axis. (b) Flowchart of analysis to determine gait events using MATLAB functions cumtrapz, cwt, and findpeaks. IC: Initial contact; FC: Final contact. (c) Vertical component of accelerometer signal with gait events and stride cycles indicated.
Sensors 20 02631 g001
Figure 2. Output data of a body worn monitor for one participant showing vertical, mediolateral, and anteroposterior acceleration. A longer walking bout 1 and shorter walking bout 2 are indicated.
Sensors 20 02631 g002
Figure 3. Mean stride time for walking bouts of length 1–1000 for a Parkinson’s disease participant, indicating dependence of stride time on the duration of walking bout. Shaded area indicates included bouts.
Sensors 20 02631 g003
Figure 4. Sample entropy of stride time as a function of tolerance r for averaged m = 1,2,3,4 for a participant with Parkinson’s disease (PD1) (solid line) and a healthy older adult (HOA1) (dashed line).
Sensors 20 02631 g004
Figure 5. Maximum relative error of the sample entropy or conditional probability, as a function of m and r. Optimal parameters m = 4, r = 0.35.
Sensors 20 02631 g005
Figure 6. Sample entropy of stride time over a 36-month period for (a) five people with Parkinson’s disease (PD1–PD5) and (b) five healthy older adults (HOA1–HOA5).
Sensors 20 02631 g006
Figure 7. Sample entropy of stride time for time-point 1 (0 months), time-point 2 (18 months), and time-point 3 (36 months) for five people with Parkinson’s (PD1–PD5) plotted against (a) Unified Parkinson’s Disease Rating Motor Scale (UPDRS-III) and (b) levodopa equivalent daily dose (LEDD).—values at 0 months;—values at 18 months;—values at 36 months.
Sensors 20 02631 g007
Table 1. Participant characteristics and clinical motor scores for a group with Parkinson’s disease.
IDAgeHeightMassBMIMDS-UPDRS-III LEDD
(yrs)(m)(kg)(kg/m2)TP1TP2TP3TP1TP2TP3
PD157.61.7881.825.82519305808651081
PD261.31.7372.824.3374332220300600
PD365.21.76112.436.33334267304832031
PD480.11.7268.623.2363937475575575
PD576.51.7489.829.7284141300400500
Mean (SD)68.1 (9.7)1.74 (0.02)85.1 (17.3)27.9 (5.3)32(5)35 (10)33 (6)461 (207)525 (216)957.4 (643)
HOA177.01.7576.424.9------
HOA261.61.7583.427.2------
HOA373.81.84110.632.7------
HOA469.61.7680.627.9------
HOA584.01.7482.027.1------
Mean (SD)73.2(8.3)1.77(0.04)86.6(13.7)28.0(2.9)------
BMI: Body mass index; MDS-UPDRS-III: Movement Disorders Society-Unified Parkinson’s Disease Rating Scale Part III; TP1: Time-point 1 = 0 months; TP2: Time-point 2 = 18 months; TP3: Time-point 3 = 18 months; LEDD: Levodopa equivalent daily dose; PD: People with Parkinson’s disease; HOA: Healthy older adults.
Table 2. Average number of strides analyzed, average strides per bout, and average stride time at time-points 0, 18, and 36 months.
GroupTime (Months)Total StridesStrides Per BoutStride Time (S)
PD0724429.7 ± 7.81.31 ± 0.21
PD18850230.7 ± 6.91.27 ± 0.17
PD36947331.7 ± 7.81.26 ± 0.17
HOA0756323.3 ± 5.20.93 ± 0.11
HOA181038629.9 ± 7.21.28 ± 0.16
HOA36937929.0 ± 7.11.31 ± 0.18
PD: People with Parkinson’s disease; HOA: Healthy older adults.
Table 3. Sample entropy of original and surrogate time series for people with Parkinson’s disease and healthy older adults.
GroupTime Seriesp-Value *Surrogate Time Seriesp-Value **
PD0.65 ± 0.090.0081.31 ± 0.065.95 × 10−5
HOA0.55 ± 0.111.27 ± 0.095.95 × 10−5
PD: Person with Parkinson’s disease; HOA: Healthy older adults; * One-tailed Wilcoxon signed-rank test p-value for PD and HOA SampEnt; ** Mann–Whitney rank sum test p-value.
Table 4. Sample entropy for five participants with Parkinson’s disease and five older adults at TP1, TP2, and TP3.
IDTP1TP2TP3
NSampEntNSampEntNSampEnt
PD156180.6811,6470.6510,7210.97
PD268440.5546910.6178780.62
PD368000.6568600.7967611.06
PD479880.6096680.5312,9990.50
PD589700.6096460.6990070.79
Mean± SD7244± 12780.61± 0.058502± 27290.65± 0.099473.2± 24550.79± 0.24
HOA175740.27133660.36120940.46
HOA265450.5780880.5372040.45
HOA387160.5995270.61100810.62
HOA481790.4691560.5872080.71
HOA568050.71117920.51103080.51
Mean± SD7564 ± 9110.52 ± 0.1710386± 21440.52 ± 0.109379 ± 21310.55 ± 0.11
PD: People with Parkinson’s disease; HOA: Healthy older adults; TP1: Time-point 1; TP2: Time-point 2 = TP1 + 18 months; TP3: Time-point 3 = TP2 + 18 months. N: Number of stride cycles analyzed.

