
Confidence Score: The Forgotten Dimension of Object Detection Performance Evaluation


1
Marduk Technologies OÜ, 12618 Tallinn, Estonia
2
National Center for Robotics and Internet of Things Technology, Communication and Information Technologies Research Institute, King Abdulaziz City for Science and Technology—KACST, Riyadh 11442, Saudi Arabia
*
Author to whom correspondence should be addressed.
Sensors 2021, 21(13), 4350; https://0-doi-org.brum.beds.ac.uk/10.3390/s21134350
Submission received: 29 April 2021
/
Revised: 10 June 2021
/
Accepted: 19 June 2021
/
Published: 25 June 2021
(This article belongs to the Special Issue Sensors for Object Detection, Classification and Tracking)
Abstract
:When deploying a model for object detection, a confidence score threshold is chosen to filter out false positives and ensure that a predicted bounding box has a certain minimum score. To achieve state-of-the-art performance on benchmark datasets, most neural networks use a rather low threshold as a high number of false positives is not penalized by standard evaluation metrics. However, in scenarios of Artificial Intelligence (AI) applications that require high confidence scores (e.g., due to legal requirements or consequences of incorrect detections are severe) or a certain level of model robustness is required, it is unclear which base model to use since they were mainly optimized for benchmark scores. In this paper, we propose a method to find the optimum performance point of a model as a basis for fairer comparison and deeper insights into the trade-offs caused by selecting a confidence score threshold.
1. Introduction
Object detection is still a hot topic in academia and industry. The term “object detection” yields ca. 33,400 search results on Google Scholar (excluding patents and citations) and arXiv.org lists 410 papers uploaded (title and abstract searched) for 2020. Considering that many new deployment scenarios of robots become feasible beyond tech/lab demos, the importance of reliable and robust object detection will increase further. Applications in e.g., medical sciences or maintenance identification of e.g., aircraft parts impose similarly high requirements for reliable and robust object detection.
Furthermore, in remote sensing applications reliability and robustness are increasingly critical as deploying object detection on-board satellites is becoming a necessity. Having an updated mosaic of the Earth’s surface with a frequency of once per hour and ground sample distance (GSD) of 5m would require over 1000 petabytes of data per day [1]. Transmitting this to ground-stations over telemetry is simply infeasible [2]. Thus, it is required to have only metadata updates of object detection, pattern recognition and anomalies instead of full-scale raw data transmission. Sensor development has led the way to ground structures detection [3] and analysis from remote sensing satellite imagery data. One example of this is bridge dislocation analysis, where a high degree of displacement detection precision is achieved [4,5]. This gives promise for remote sensing maintenance analysis for power grid and oil/gas pipelines as well. However, these applications have minimum requirements with respect to model robustness while maintaining deployability on edge devices. Instance segmentation is generally preferred in high-aspect-ratio object detection, which is often prevalent in these applications; however, in some circumstances, where computational power requirements are limited (e.g., on-board processing) or there is a lack of datasets classical object detection must do be sufficient enough.
On the research side, there is a clear focus on new model architectures, loss metrics (e.g., [6,7]) and loss functions (e.g., [8,9,10,11]). These are proposed and published constantly. However, benchmark datasets used in publications are not growing despite a growing number of datasets covering the task of 2D (e.g., [12,13,14,15,16]) and 3D object detection (e.g., [17,18,19,20,21,22,23]). Object detection models are primarily evaluated on very few datasets [24]; foremost they are evaluated on Pascal VOC [25] and COCO (Common Objects in Context) [26]. The former seems to be used for some form of legacy compliance whereas the latter seems to be used as the main evaluation baseline. Other datasets for e.g., remote sensing or autonomous driving are often not used in any ablation study—the KITTI dataset [27] might be an exception here but is mainly used for semantic segmentation.
At some point the research is evaluated for usage in industry. In practice, selecting a new model for further, application-specific evaluation is usually based on one or a combination of multiple of these considerations:
- (benchmark) performance metrics (e.g., COCO evaluation results),
- object size or class-specific performance metrics,
- inference speed (e.g., FPS as a function of batch size),
- computational cost/power consumption (e.g., for edge devices),
- source code license.
This often boils down to the usage of provided example scripts and pre-trained weights to either evaluate a model for scenarios with similar data to what it was trained on or retraining it for different datasets/tasks. When visualizing a model’s output, it becomes apparent that a model might actually either produce many false positives or misses a large number of objects (false negatives). Karol Majek provides a plethora of model performance examples on a 30 min recording of a drive through Warsaw, Poland (https://www.youtube.com/c/KarolMajek/videos, accessed on 6 February 2021).
Among other causes, the number of false positives/negatives is highly dependent on the confidence score threshold chosen. Frequently, the reference confidence score threshold used is not provided in the paper accompanying a model but must be inferred from the source code. Unfortunately, these confidence score thresholds are ridiculously low (<5%; <25% not uncommon) when comparing them to best practices in other fields of data science and machine learning. We may argue that the confidence score does not represent a model’s certainty in a strict probabilistic sense but many people, especially third-party users without expert knowledge, understand it this way.
In the fields of robotics or in medical applications, the consequences of an unreliable model for object detection are likely to be significantly more severe than e.g., in a deployment scenario that involves object detection for an online retail store [28,29,30]. Similarly, when considering on-board processing on satellites or other edge devices, consequences of large amounts of false positives and false negatives may render a product or an application pointless. Therefore, the number of false positives should be as low as possible—ideally approaching zero, and the number of false negatives should be zero as an object missed in e.g., several frames in a row might cause severe damage. Given an open-world deployment scenario, the trade-off between false positives and false negatives is not only about mitigation using constant retraining of a models deployed, but about finding a suitable confidence score threshold to mitigate adverse behavior in deployment scenarios.
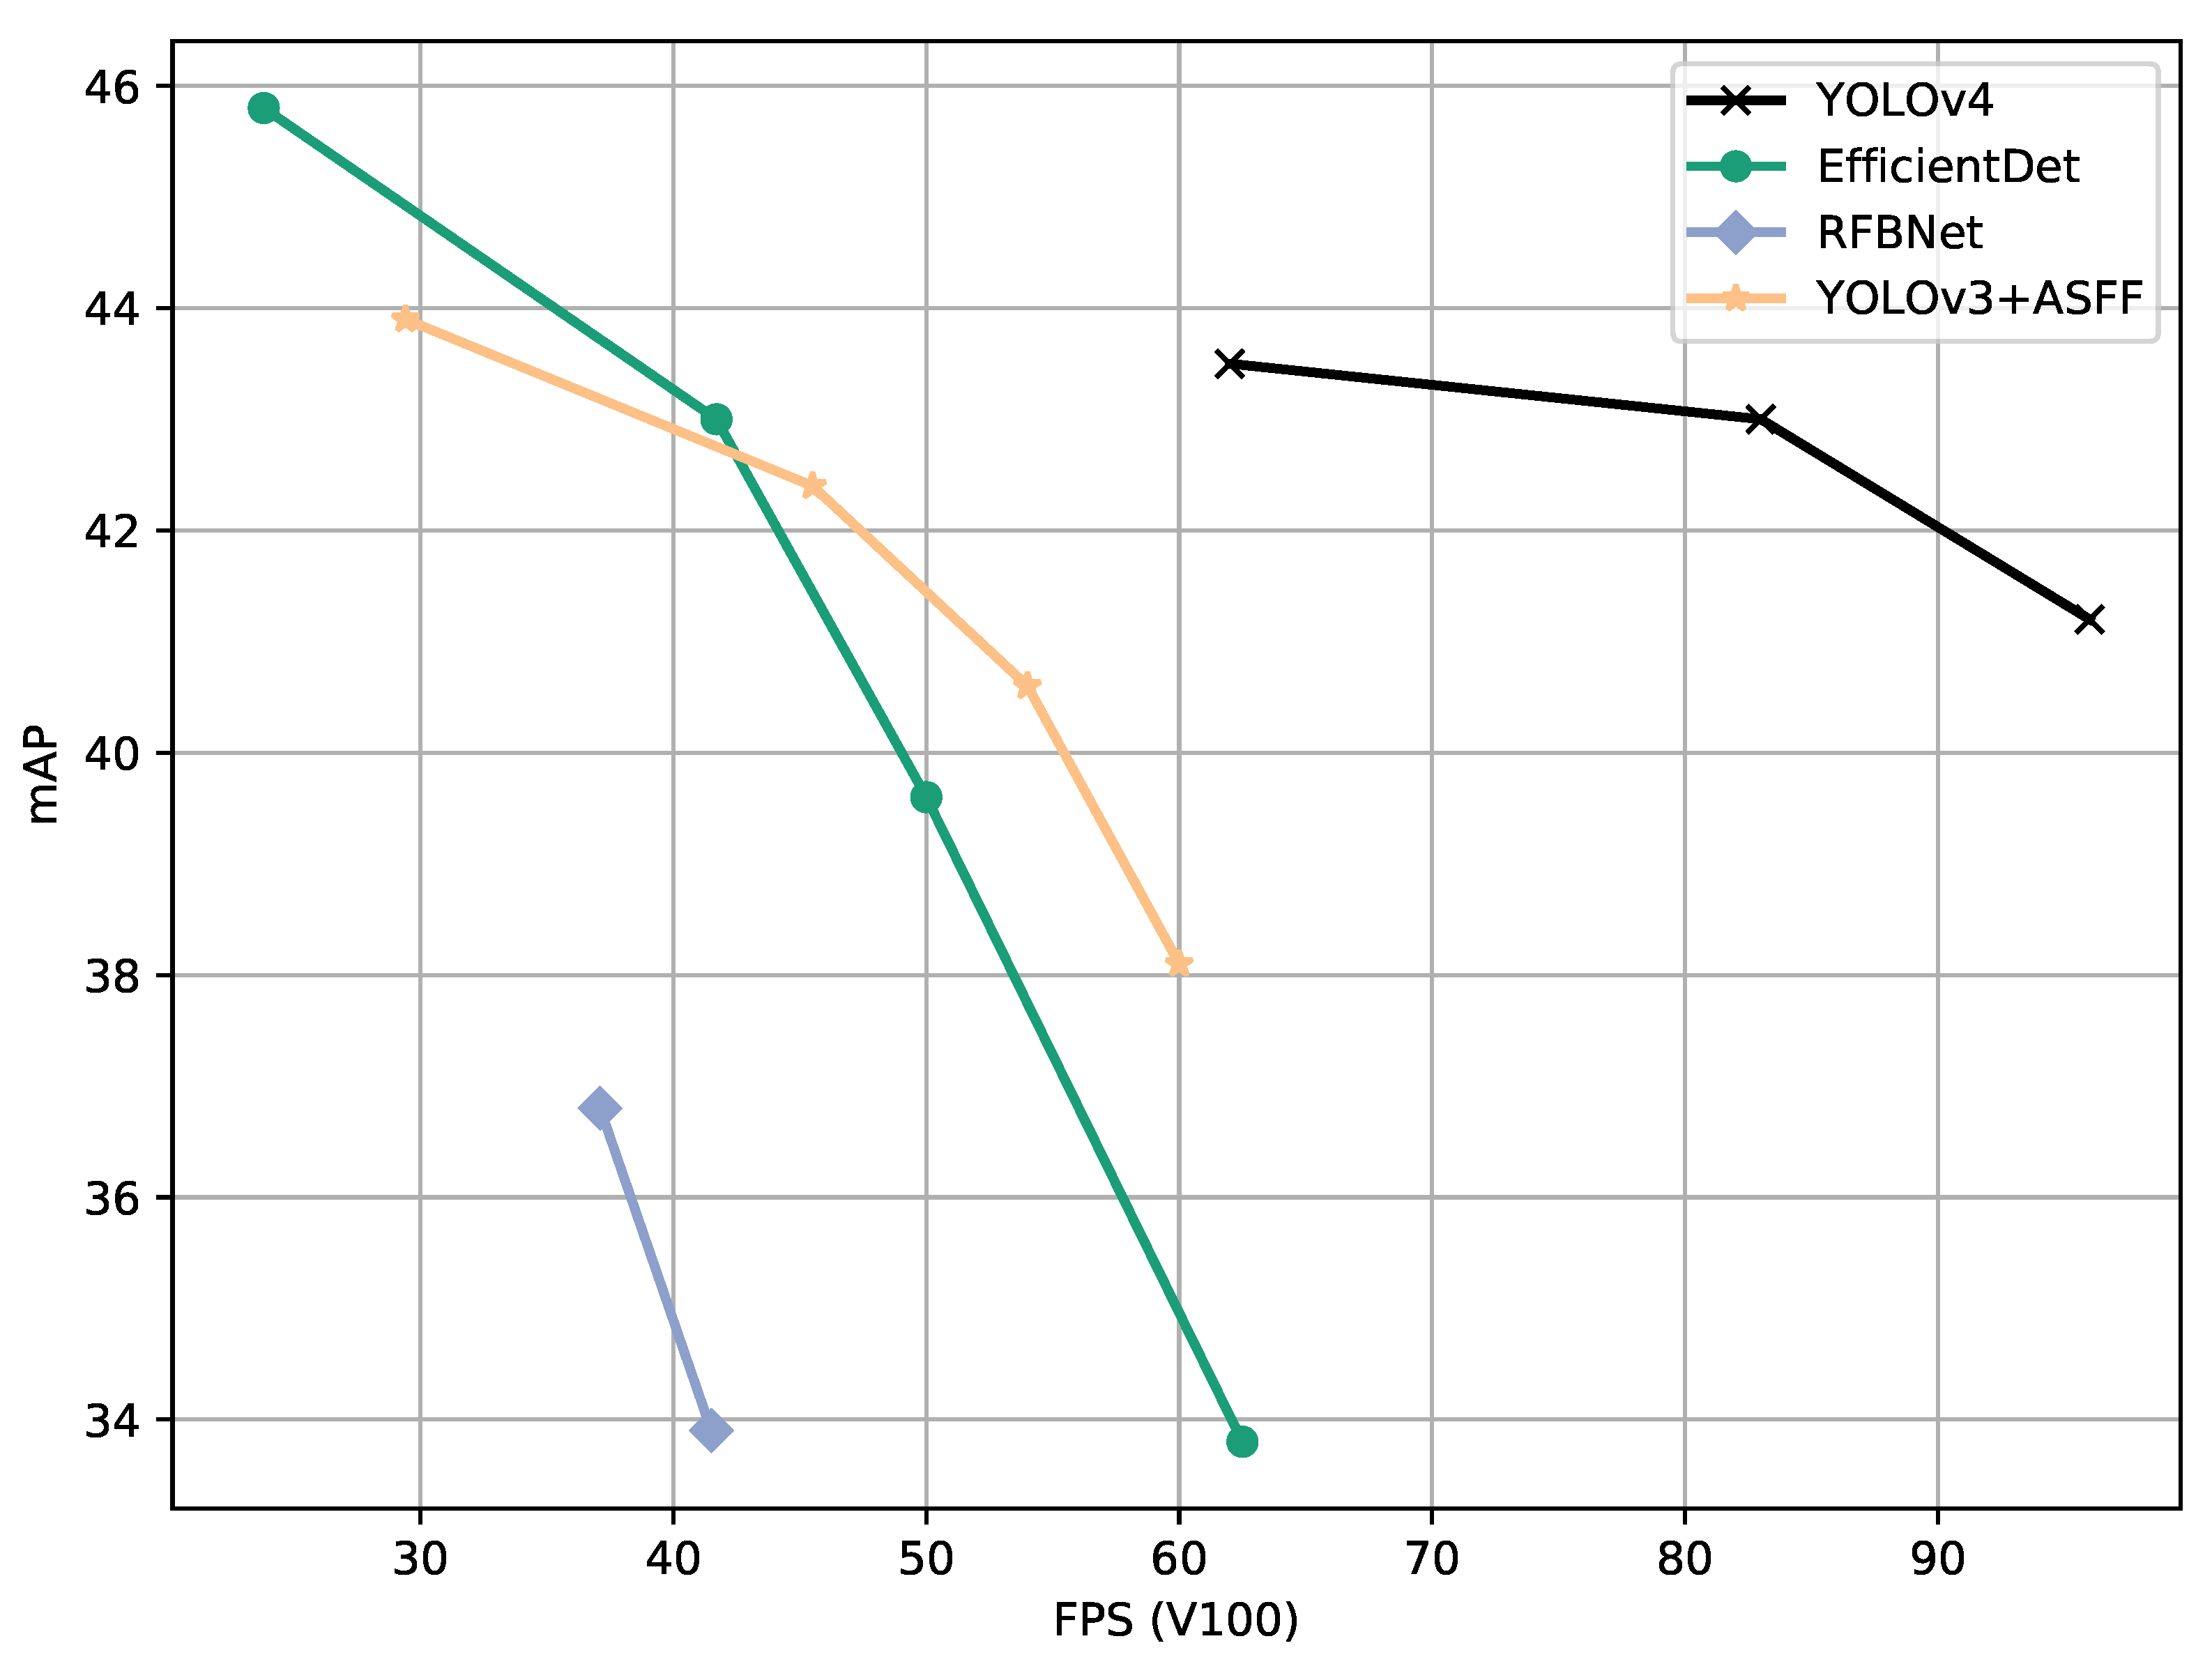
Therefore, we evaluate a large subset of state-of-the-art models performance at different confidence score thresholds, using the standard COCO metrics as well as Probability-based Detection Quality (PDQ) [30], and propose a method for finding the optimal confidence score for a model as a basis for a fairer model comparison than what is commonly used (Figure 1). In other words, we propose a method to find the optimal operating point of a model that could be used to decide what model to choose and what to expect if the threshold is lowered or increased.
2. Experimental Setup
2.1. Dataset Selection
The selection of evaluation metrics (Section 2.3) requires that a dataset provides data suitable for instance segmentation and not just (horizontal) bounding boxes as this is required by the PDQ.
The COCO dataset is one of the most used and evaluated datasets for object classification DNN architecture and hyperparameter tuning benchmarks. Previous research indicates that the COCO dataset is well-suited for model robustness and efficiency analysis [32]. Since the COCO dataset could be considered to be the reference dataset for object detection and provides annotations for instance segmentation as well, we consider it necessary to use it as a basis. Moreover, almost all model architectures are provided with pre-trained weights on this dataset. This allows for a large selection of models to investigate the impact of the selection of the confidence score thresholds.
Although there is an abundance of image datasets of objects in forward looking setups (e.g., the COCO dataset), there is scarcity of over-head datasets usable for specific real-life and real-time applications on satellites, aircraft and UAV-s. The subset of datasets which provide annotations for instance segmentation as required by the PDQ metric. Therefore, the second dataset selected is the TTPLA (Transmission Towers and Power Lines Areal images) [13] dataset. This dataset contains aerial images captured from an UAV showing transmission towers and power lines. Therefore, it can be seen as a proxy for multi-purpose object detection on aerial images. With respect to UAV navigation and control it can be seen as a dataset for robust detection of obstacles to prevent damage caused by an UAV. Similarly, it can be seen as an example for inspection work carried out by UAVs. Furthermore, power lines have a high aspect ratio making this particularly challenging for object detection.
2.2. Model Selection
2.2.1. COCO
Models are selected differently for both datasets. Models used for evaluation on the COCO dataset are selected to evaluate a good assortment of state-of-the-art models whereas TTPLA comes with a few reference models only.
Most object detection models are available pre-trained on the COCO dataset. Therefore, we choose the COCO val2017 subset as our evaluation basis. These pre-trained models are likely to be trained on the validation set. However, reported performance differences between val2017 and test2017 seem to be rather small, and therefore we can use this as a proxy. We selected a subset of state-of-the-art object detection models based on the following criteria:
- state-of-the-art results promised in accompanying publications
- deployed commonly in industry and academia
- small models suitable for deployment on edge device
- large models with highest scores despite high hardware requirements
These selection criteria lead to a list of selected models covering a broad range of different model architectures, approaches and deployment purposes (Table 1). Some models may use NMS (Non-Maximum Suppression) or SoftNMS [33] to output only the most suitable boxes whereas others do not. Some models, e.g., ones using SSD (Single Shot Detector) [34] are limiting their detections per image to 100 bounding boxes by default and therefore are matching the max. number of bounding boxes considered by the COCO API for evaluation.
2.2.2. Models for Selected for Evaluation on TTPLA
We use the reference models provided by the TTPLA publication for resolutions of 550 × 550 and 700 × 700 pixels as our evaluation baseline. These reference models use YOLACT [45] with ResNet backbones [46]. Moreover, NanoDet and five models with different backbones for Faster R-CNN heads are trained for 150 epochs on TTPLA (resolution 700 × 700 px) for a better comparison. We used default settings provided by NanoDet and Faster R-CNN models available via detectron2. No mitigation of class imbalances and additional image augmentation during training was implemented.
2.3. Evaluation Metrics
Two metrics are used to evaluate each model’s performance on the COCO dataset. This includes the standard COCO evaluation metric as well as the PDQ. On the TTPLA dataset only the more relevant PDQ metric is used.
With respect to the COCO evaluation metric, we would like to point out a few important things. The most important thing is that the evaluation function sorts detections per class by confidence score and considers only the 100 best (highest confidence score) bounding boxes per image for evaluation. Therefore, it is clear already that if a model outputs a rather large number of bounding boxes with low confidence scores, then this is not penalized by the evaluation function.
Due to the nature of the calculation of the mean average precision (mAP) it includes the recall as well. Since the mean average precision is calculated based on an 11-point interpolated precision-recall curve, which is generated using different thresholds for confidence score, the confidence score is somewhat integrated in the metric. However, the model output evaluated still depends on what the user selects or uses as the default confidence score threshold. Combining this with the limited number of bounding boxes used in evaluation (max. is 100), the incentive to minimize the false positives is low when using this limit. Furthermore, multiple predicted bounding boxes per ground-truth bounding are not punished as false positives as long as their IoU score satisfied the IoU threshold used for evaluation. This is a change compared to the Pascal VOC mAP calculation in which these bounding boxes are penalized.
In this paper, we consider only the mAP which is averaged with IoU thresholds between 0.5 and 0.95 at steps of. 0.05. The procedure would be the same if e.g., the mean average precision of small objects (mAPsmall) would be of interest for selecting a model.
In contrast, the (PDQ Probability-based Detection Quality), introduced by Hall et al. [30], focuses on a probabilistic evaluation what an object detected is and where it is. The main reason for choosing this metric is that the PDQ explicitly penalizes false positives and false negatives and penalizes low confidences scores. Furthermore, it assesses and includes an average label quality and an average spatial quality and therefore the PDQ explicitly evaluates whether a model is better at locating or classifying an object.
Similar to the Pascal VOC mAP, the PDQ is calculated as the best match between the ground-truth labels and the detections. Bounding boxes that are not considered a best match are counted as false positives.
The label quality is assessed based on a categorical distribution over all class labels. The spatial quality is measured as a probability distribution of individual pixels against the ground-truth annotation mask and not the ground-truth bounding box. Therefore, predicted bounding boxes are not evaluated against ground-truth bounding using the standard IoU metric. Considering an object of non-rectangular shape parts of this object are likely to be occupy more space inside a bounding box than other parts. If a detection is centered more around this part, it will be scored higher than if the detection covers other parts of the bounding box with a smaller amount for foreground (=object) pixels.
For our purposes we use the PDQ as a proxy as the standard computer vision models for object detection do not output the required input for PDQ evaluation, namely quantifying spatial and label uncertainty of a bounding box. We converted the standard COCO-style predictions to a format suitable for computing the PDQ (https://github.com/david2611/pdq_evaluation, accessed on 26 February 2021, to convert coco results and compute the PDQ).
An in-depth analysis of more common object detection model performance evaluation metrics can be found in Padilla et al. [47].
2.4. Evaluation Process
All models are evaluated on their respective dataset without filtering the model output by a minimum confidence score if applicable. The output is evaluated using the standard COCO metrics and the PDQ with minimum confidence score thresholds ranging from 0.0 to 0.95 in steps of 0.05. If a model uses non-maximum suppression, the default IoU threshold of a model was used and not changed.
3. Results
3.1. COCO Dataset
Evaluating the models selected using the COCO evaluation API for different confidence score thresholds leads to similar results for all models (Figure 2 and Figure 3). The mAP of a model decreases monotonically with increasing threshold values. The gradient of mAP drops varies from model to model and with confidence score threshold ranges. At some threshold value, a more significant drop is observable. Other COCO metrics (mAPsmall, mAPmedium, mAPlarge, etc.) show similar results though individual models are ranked differently than in the mAP comparison.
Although most models mAP score drop to (close to) zero mAP at a confidence score threshold of 0.95, there are a few exceptions. Most notably DETR and models using Faster R-CNN. These models, especially DETR, show a more constant mAP curve with much lower gradients from low to high confidence score thresholds.
With lower confidence thresholds, a model outputs a lot more false positives than if a higher threshold is used. This indicates that the COCO evaluation score seems to not penalize false positives that much.
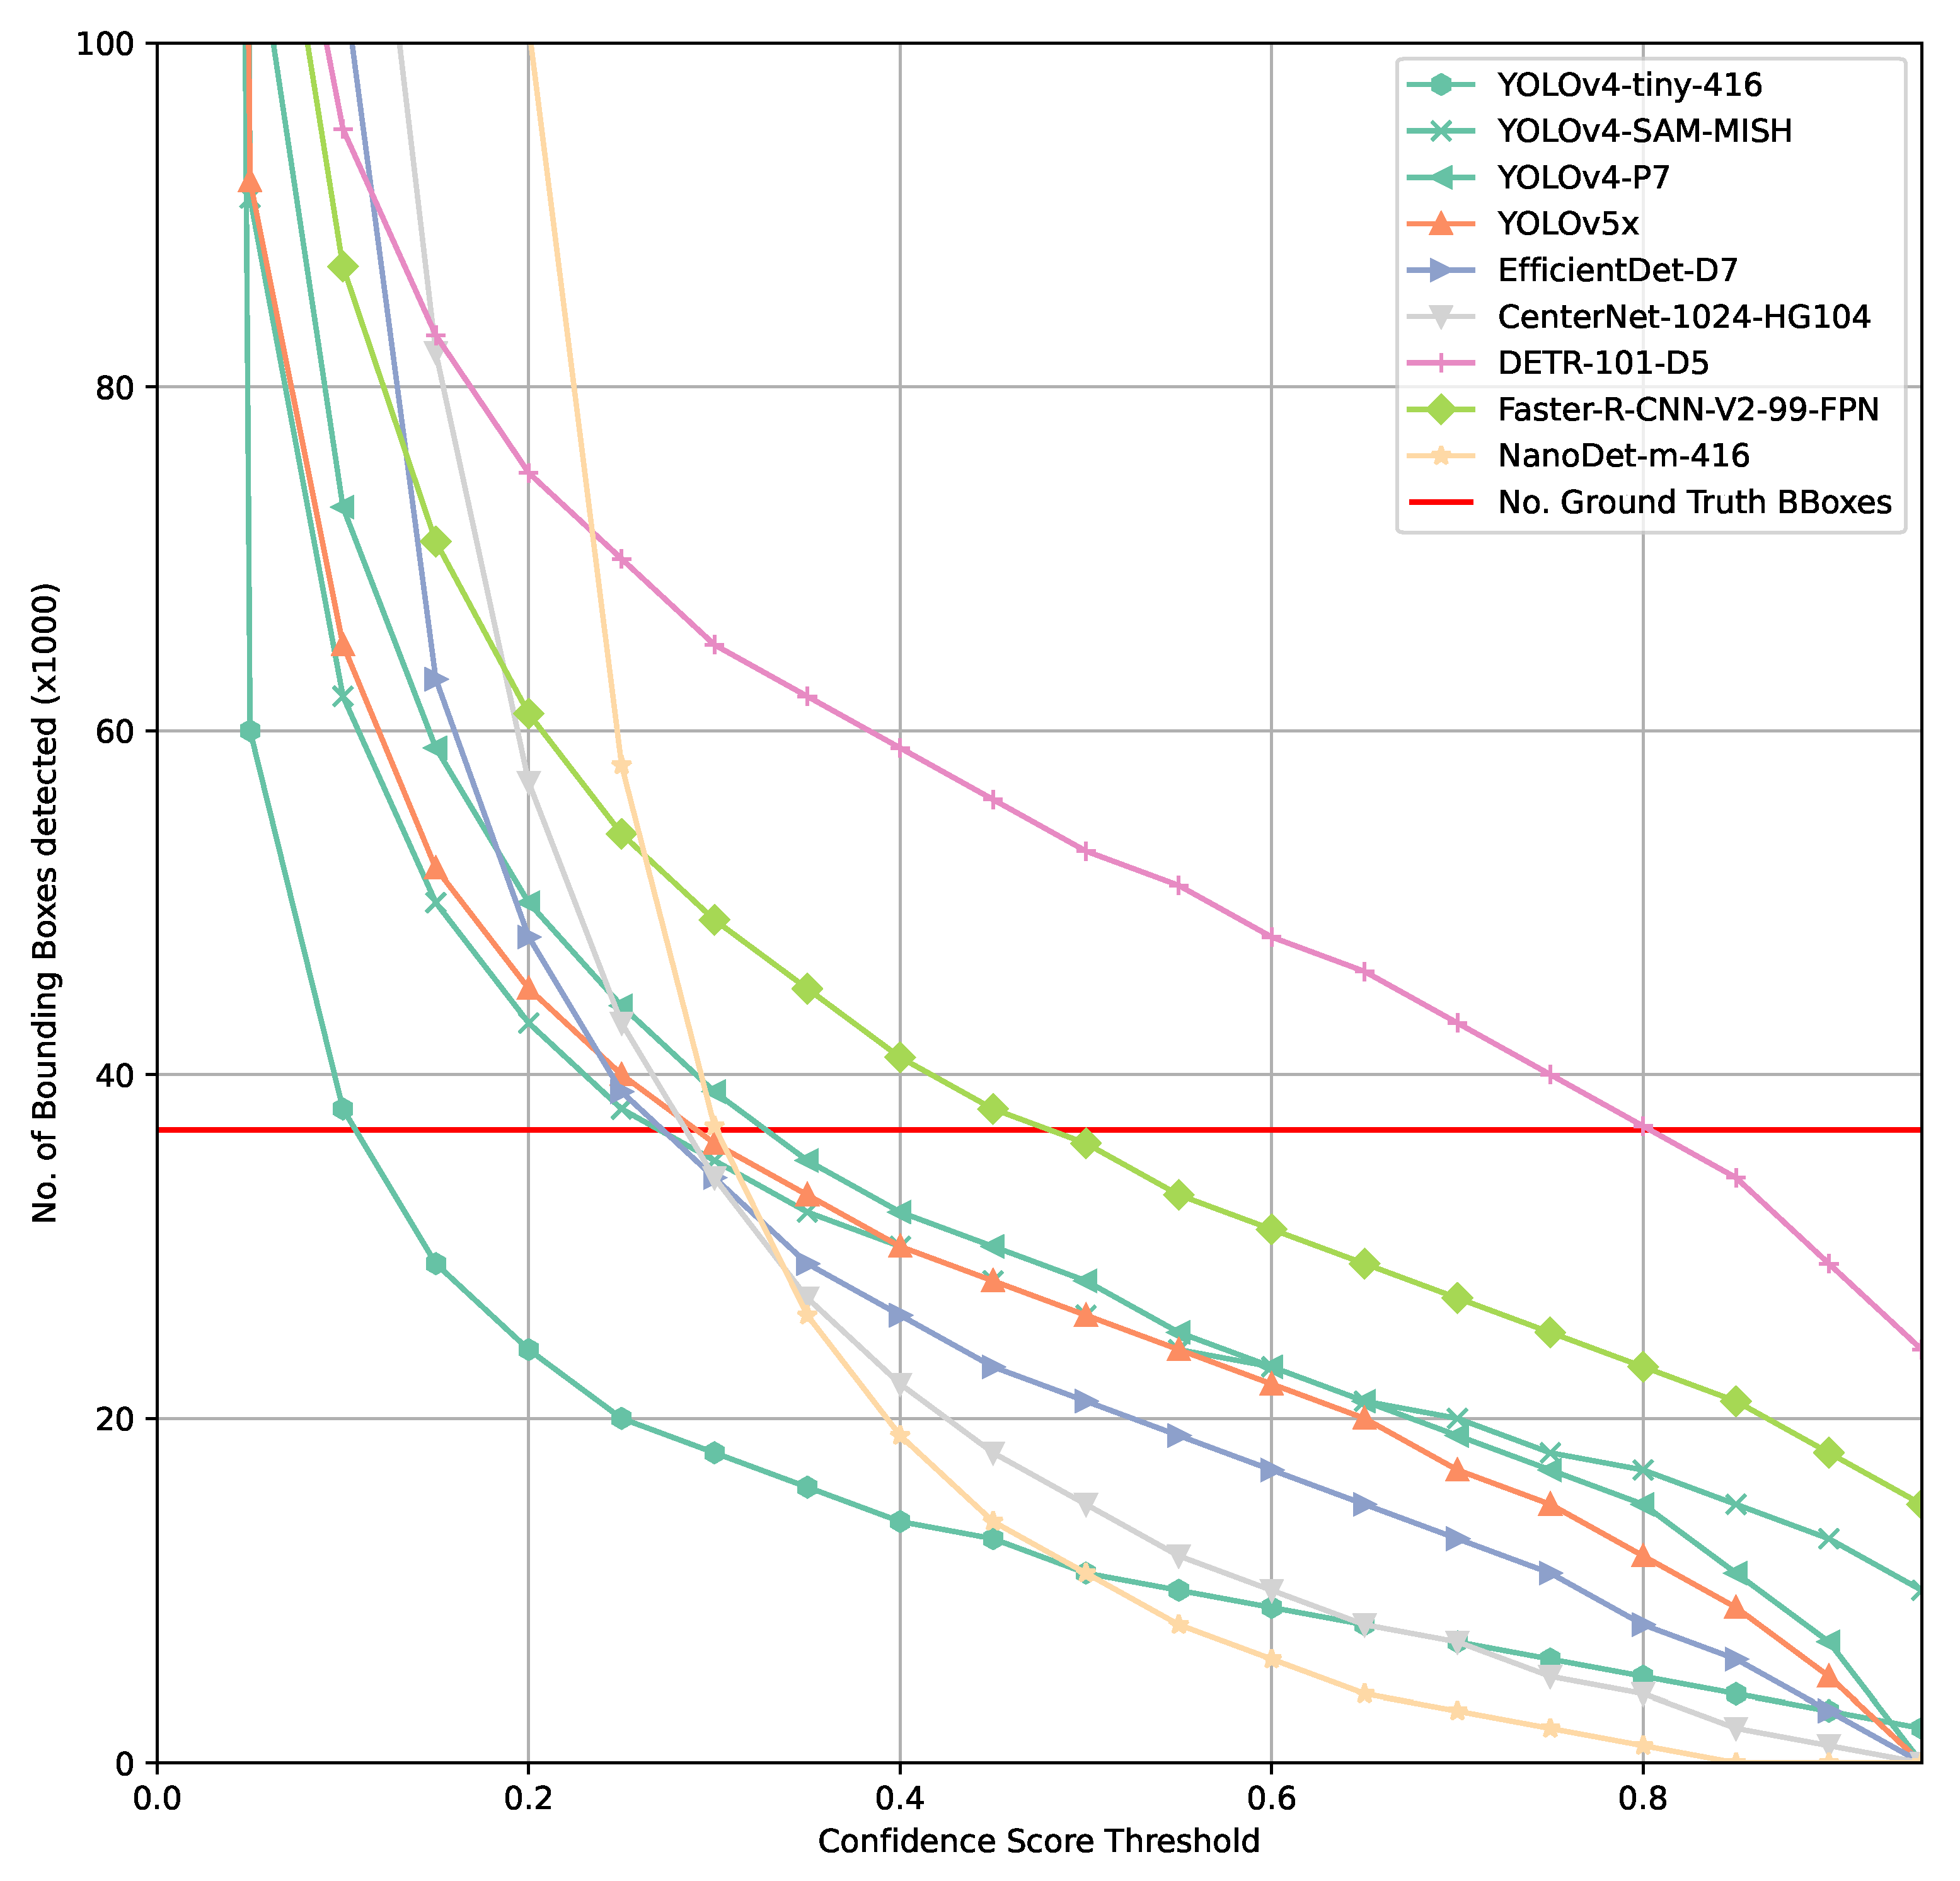
This becomes apparent when considering the total number of bounding boxes detected by a model on the COCO val2017 subset. Figure 4 already indicates fundamental challenges with finding an optimal confidence score threshold as well as evaluating a model’s performance. Most models show a rather steep gradient approaching the intersection between number of ground-truth bounding boxes across all classes in the COCO val2017 set and the number of predicted bounding boxes across all classes.
Assuming a perfect model, this intersection would be at a high confidence threshold and no false positives or false negatives would be found. In such a case, a very simplified approach to understand an optimal confidence score threshold would be based on the assumption that every lower confidence score threshold chosen would result in false positives whereas and higher threshold would result in false negatives.
Comparing Figure 2, Figure 3 and Figure 4 shows that there is a higher tolerance for false positives produced by a model than for false negatives. This clearly indicates that the model architectures and training processes involved are optimized for the COCO evaluation function as it penalizes false positives only marginally. In practice, a high and persistent false positives count can result in similarly poor performance than if a model is not able to detect objects of interest. A simple example for such a case would be an autonomous robot not able to perform its task since it might drop into to a safety state constantly because too many obstacles/objects that should not be harmed might be detected constantly. A similar adverse scenario might be some form of intrusion detection, either on premises or in orbit that either detects nothing or triggers so many false alarms that the human responsible to act on this alarm will simply ignore it.
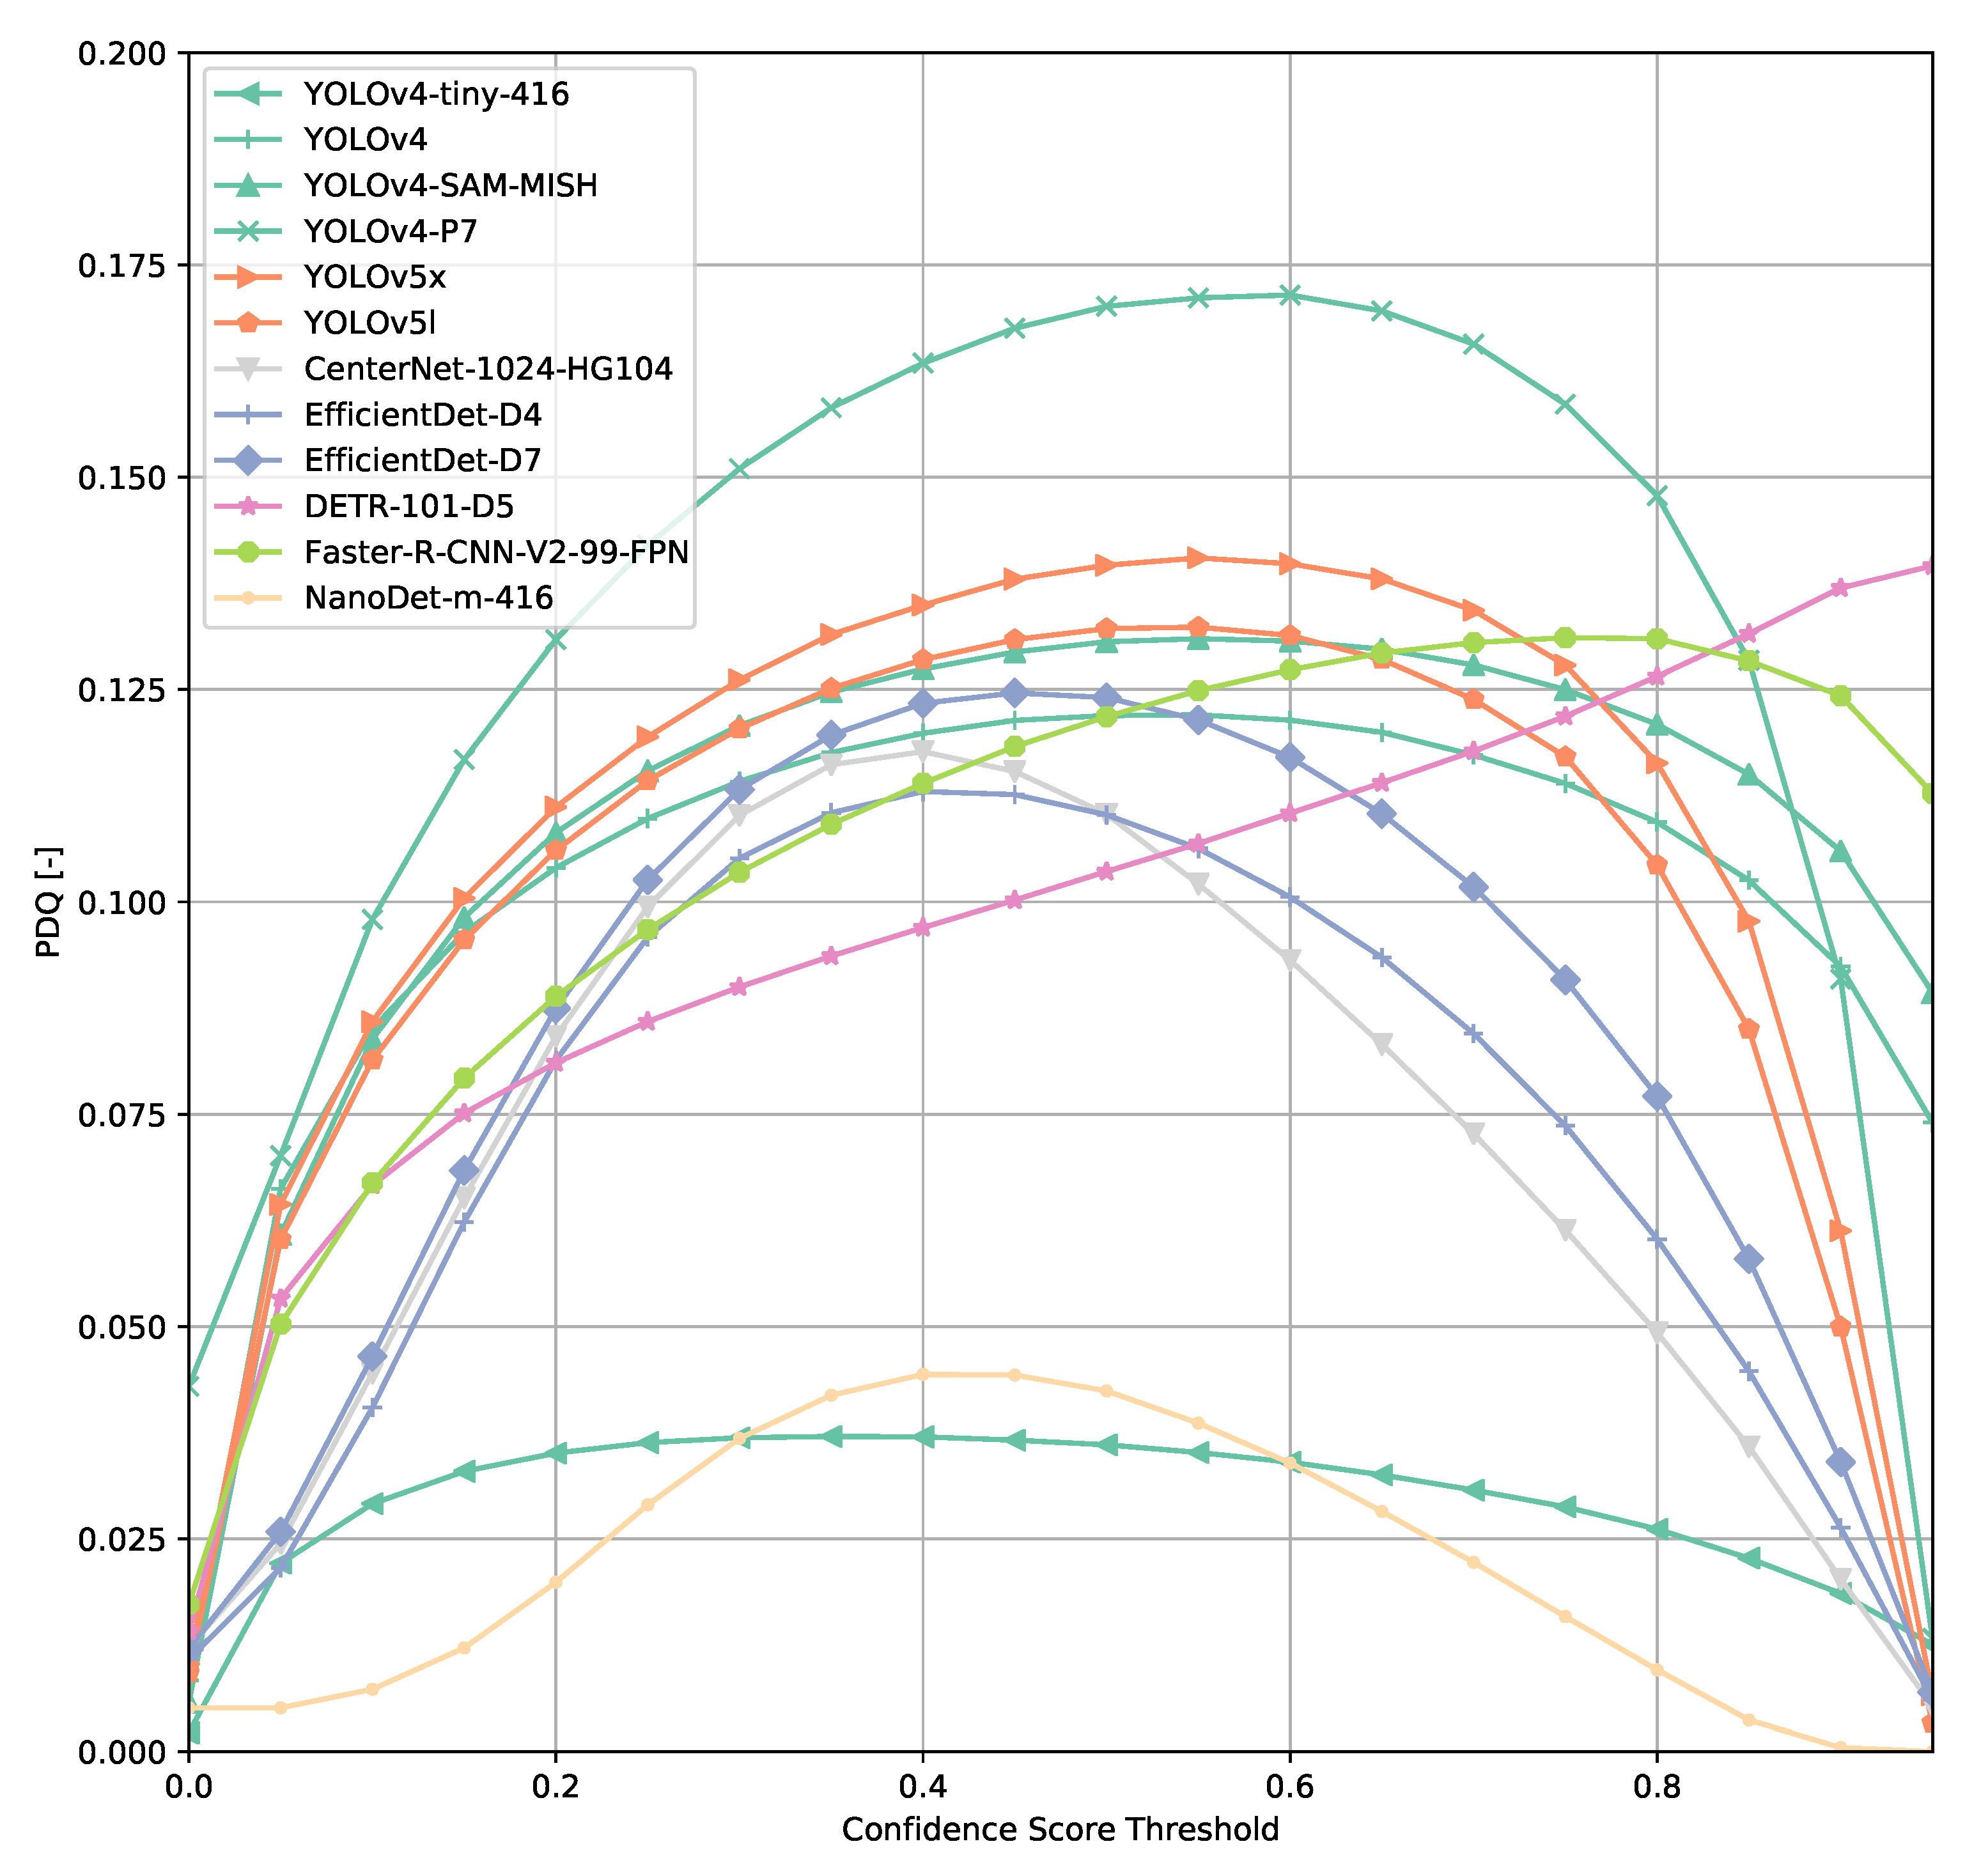
Computing the PDQ as a function of confidence score threshold leads to a different kind of curve than the COCO metrics (Figure 5). Using such a PDQ curve, we are ending up with a confidence score threshold that could be understood as the optimal operating point of a model. Since the PDQ penalizes false positives and false negatives and incentivizes higher confidence scores attached to a prediction, the curve could be understood as follows. If a confidence score threshold lower than for PDQmax is used, false positives are predominantly penalized, whereas choosing a higher threshold leads to significant penalization of a model’s performance due to an increasing number of false negatives.
Across all models (Figure 6, Figure 7, Figure 8, Figure 9, Figure 10, Figure 11, Figure 12, Figure 13 and Figure 14), PDQ curves seem to peak at a slightly higher confidence score threshold than at the respective number of bounding box intersection curves. This implies that the false negatives count is higher than the false positives count when selecting a model at PDQmax.
An exception to the general trend of (a)symmetric hill-shaped PDQ curves are the DETR models (Figure 7). These models output a large number of bounding boxes even at threshold of 0.8 and therefore, the trade-off between false positives and false negatives is still rather low when using a high confidence score threshold. Faster R-CNN-based models also show higher confidence thresholds than most other models evaluated.
The PDQ allows the gaining of more insights into a model’s performance than the COCO evaluation score. A significant observation is that most models have a high average label quality, often above 80%, whereas the average label quality is a lot lower (Table 2). The highest average spatial quality observed at PDQmax is still below 25%. Therefore, we can conclude that the models evaluated are a lot more suited to tell what an object is and are less suited to tell us where exactly it is. We must point out that partially these low scores might also originate from the format conversion to evaluate COCO-style bounding boxes using the PDQ. However, no model evaluated in the original PDQ publication exceeds an average spatial score of 45% [30].
3.2. TTPLA Dataset
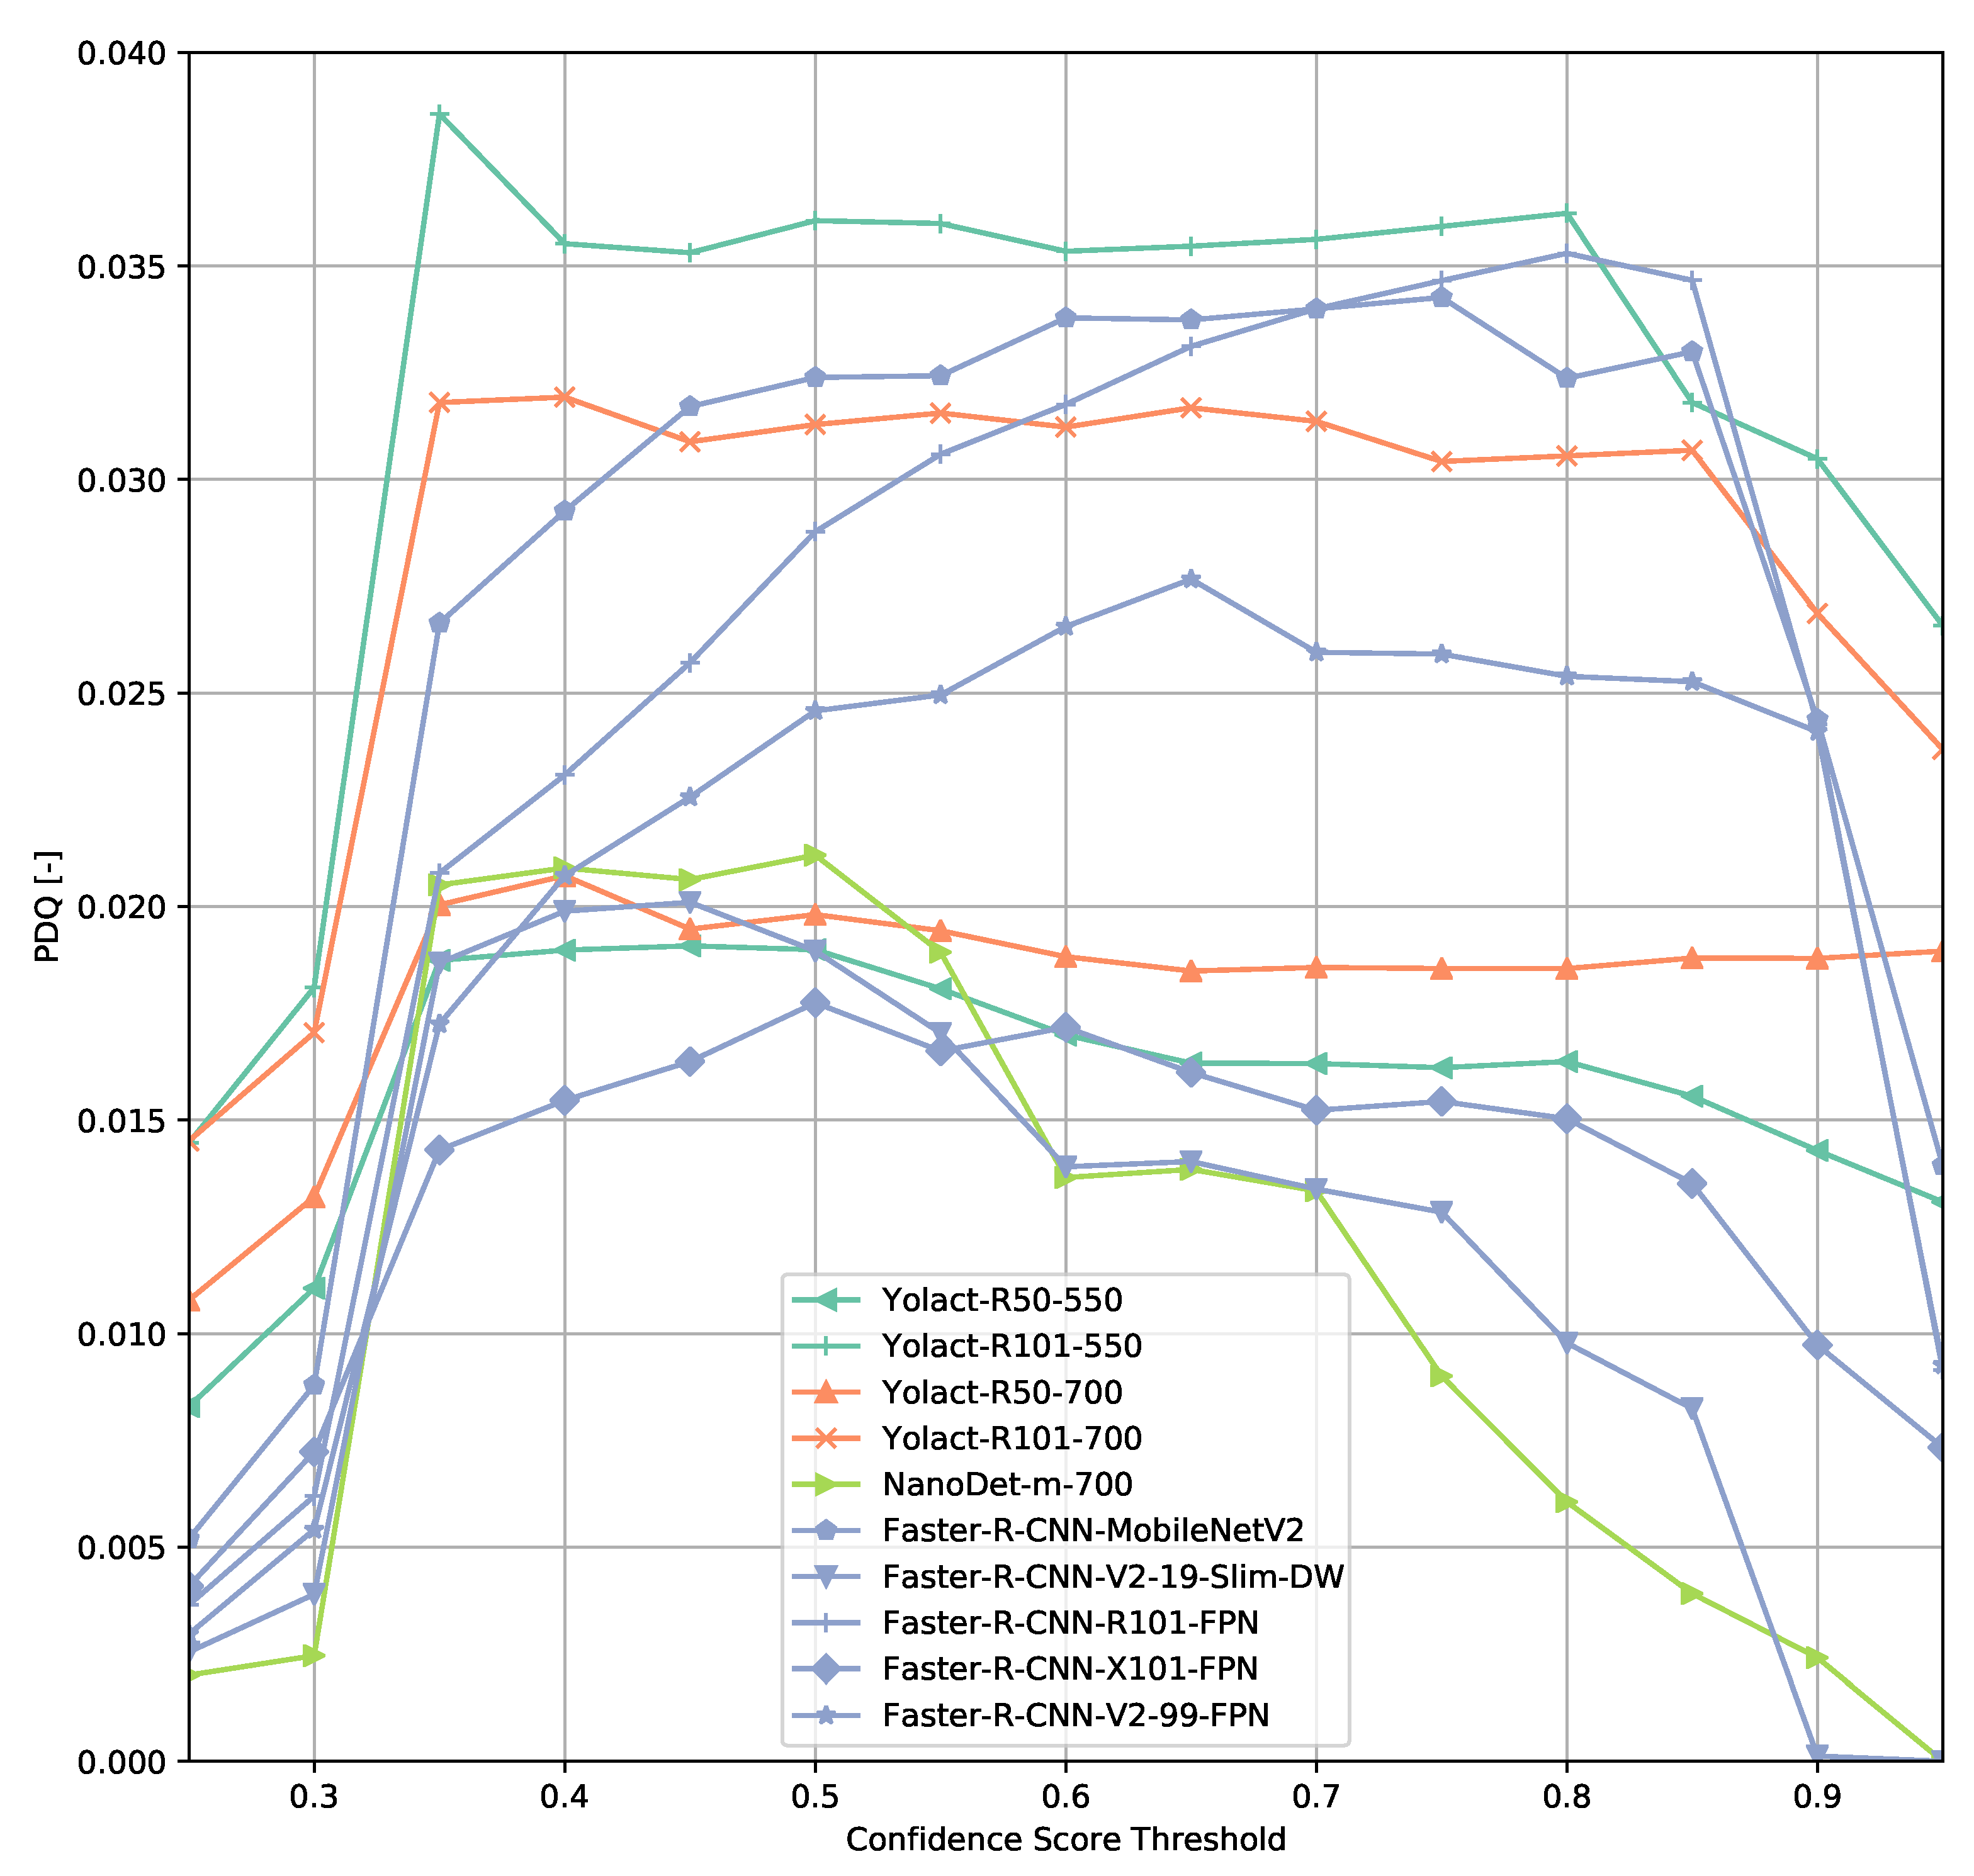
The results on the TTPLA dataset are similar to the results on the COCO validation set (Figure 15 and Figure 16). Since TTPLA contains power lines which are objects of with a high aspect ratio, the object detection task is more challenging than on the COCO dataset. This is reflected in the PDQ scores which are a lot lower compared to the ones obtained on the COCO dataset. The shape of the PDQ curves seem to be similar when looking at the Faster R-CNN-based models whereas e.g., NanoDet shows a peak shifted to lower confidence score thresholds.
However, excluding the power line predictions from evaluation indicates that Faster R-CNN-based models seem to generalize a lot better on this dataset than e.g., the ResNet-based YOLACT reference models as the PDQ values change less though finding the optimal confidence score threshold seems to be trickier depending on the model architecture used. This could be caused by filtering out power line detections from evaluation and not retraining a model without power line objects as the transmission towers are easier objects to detect.
4. Discussion
The results indicate that there is at least one better way to evaluate a model’s performance than using the COCO evaluation metrics. Furthermore, we propose a PDQ-backed method to select a suitable confidence score threshold to find a model’s optimal performance.
However, such an optimal setting still comes with trade-offs. Except for the smaller models and a few larger models, we end up with a TP/FN ratio ranging from 0.8 to 1.4 for most models at PDQmax. Therefore, we must acknowledge that the number of correctly detected models and the total amount of missed objects is approximately of the same order of magnitude. Depending on the deployment case for a particular model, this might have severe consequences and implications when selecting a model for deployment.
In this paper, we did not compare model performance at PDQmax against FPS explicitly. However, as a rule of thumb, smaller and faster models perform significantly worse than larger models. Depending on application-specific requirements when engineering a “tiny” model for edge device deployment, our findings should be taken into consideration.
In a more general setting, the method proposed solves only a subset of challenges involved with training and comparing models for object detection. False positives and missed detections might highly fluctuate based on small changes between consecutive frames. This might be primarily caused by the issue that most neural network architectures overfit to texture [48] and are susceptible to small pixel shifts [49]. To some extend this texture bias can be used for adversarial attacks as well [50,51,52].
In this paper, we focus on model performance on the COCO and TTPLA datasets. On different datasets, model performance may vary lot as most of the models evaluated were developed and designed with the COCO metric as the main design goal. The ranking of models implied by Figure 5 may change depending on what another dataset a model is trained on and how it is trained on a certain dataset. Since we used pre-trained models provided by reference implementations, we cannot estimate the impact of training method variations on the results presented in this paper.
Other data driven approaches to estimate model performance or verify a model’s performance, e.g., a test scenario based on real data or simulated might profit from a more rigorous metric and model selection process as well.
It might be of further interest to investigate the effects of using different datasets with significantly less classes but larger variability of objects per class as we would expect for e.g., an autonomous robot. As most models published are designed for a few benchmark datasets, it is of interest how the confidence score threshold for PDQmax may change on other datasets. Furthermore, it would be of interest to investigate how to achieve a better average spatial score and how a potential integration of the method propose into a model’s design and training process would lead to more robust models.
5. Related Work
To the best of our knowledge, this is the first paper evaluating the impact of selecting confidence score thresholds rigorously using standard models for object detection. In a less rigorous way, this approach was used to find the optimal performance of a single model [53] for a PDQ-related computer vision competition.
Using f1-scores (e.g., [54]) or similar metrics as a function of confidence score is not helpful either as these approaches depend on selecting IoU thresholds for evaluation as well. Any f1 score will depend on selecting IoU thresholds and selecting confidence scores.
Furthermore, using f1 scores with the FP, FN, and TP counts as provided by the PDQ will lead to confidence score thresholds shifted towards lower thresholds as it only takes FPs, FNs, and TPs into consideration. Higher confident scores of predictions are not incentivized.
6. Conclusions
In this paper, we introduce a simple approach to find the optimal confidence score threshold for fairer model performance comparison. We evaluated a subset of state-of-the-art models using this approach. At this proposed operating point the trade-offs between counts of true positives, false positives negatives, and the overall confidence in bounding boxes detected are minimized. Furthermore, we would like to point out that many models show a high average label quality but a poor average spatial quality. Therefore, there is a lot of room for developing better models that can use latest advancements in sensor technology to provide useful products and services to customers. With respect to edge devices (e.g., UAV-based, static cameras or orbital sensors), these deployment scenarios are only feasible if models deployed output predictions with sufficiently good spatial and label qualities. Deploying models with non-optimal settings renders such applications pointless as the trade-offs between false negatives, false positives and true positives are too high.
Author Contributions
Conceptualization, S.W. and K.A.; methodology, S.W. and K.A.; experiments, S.W., S.A., K.A., and T.L.; writing—original draft preparation, S.W., K.A., T.L., S.A. and M.S.; writing—review and editing, S.W., M.S. and K.A. All authors have read and agreed to the published version of the manuscript.
Funding
This research was funded by the King Abdulaziz City for Science and Technology (KACST).
Institutional Review Board Statement
Not applicable.
Informed Consent Statement
Not applicable.
Data Availability Statement
Not applicable.
Acknowledgments
This research was supported by the King Abdulaziz City for Science and Technology (KACST).
Conflicts of Interest
The authors declare no conflict of interest.
References
- Lal, B.; de la Rosa Blanco, E.; Behrens, J.R.; Corbin, B.A.; Green, E.K.; Picard, A.J.; Balakrishnan, A. Global Trends in Small Satellites; Analysis P-3-23; The IDA Science and Technology Policy Institute: Washington, DC, USA, 2017. [Google Scholar]
- Kothari, V.; Liberis, E.; Lane, N.D. The final frontier: Deep learning in space. In Proceedings of the 21st International Workshop on Mobile Computing Systems and Applications, Austin, TX, USA, 3 March 2020; pp. 45–49. [Google Scholar]
- You, Y.; Wang, S.; Ma, Y.; Chen, G.; Wang, B.; Shen, M.; Liu, W. Building Detection from VHR Remote SensingImagery Based on the Morphological Building Index. Remote Sens. 2018, 10, 1287. [Google Scholar] [CrossRef] [Green Version]
- Ahlborn, T.M.; Shuchman, R.A.; Sutter, L.L.; Harris, D.K.; Brooks, C.N.; Burns, J.W. Bridge Condition Assessment Using Remote Sensors; Final Report DT0S59-10-H-00001, USDOT/RITA; Michigan Technological University: Houghton, MI, USA, 2013. [Google Scholar]
- Liu, W.; Chen, S.-E.; Hauser, E. Remote sensing for bridge health monitoring. Proc. SPIE Int. Soc. Opt. Eng. 2009. [Google Scholar] [CrossRef]
- Rezatofighi, H.; Tsoi, N.; Gwak, J.; Sadeghian, A.; Reid, I.; Savarese, S. Generalized Intersection over Union. In Proceedings of the IEEE Conference on Computer Vision and Pattern Recognition (CVPR), Long Beach, CA, USA, 16–17 June 2019; pp. 658–666. [Google Scholar]
- Zheng, Z.; Wang, P.; Liu, W.; Li, J.; Ye, R.; Ren, D. Distance-IoU Loss: Faster and Better Learning for Bounding Box Regression. In Proceedings of the The AAAI Conference on Artificial Intelligence (AAAI), New York, NY, USA, 7–8 February 2020. [Google Scholar]
- Welleck, S.; Yao, Z.; Gai, Y.; Mao, J.; Zhang, Z.; Cho, K. Loss Functions for Multiset Prediction. In Advances in Neural Information Processing Systems; Bengio, S., Wallach, H., Larochelle, H., Grauman, K., Cesa-Bianchi, N., Garnett, R., Eds.; Associates, Inc.: Red Hook, NY, USA, 2018; Volume 31. [Google Scholar]
- Walder, C.; Nock, R. All your loss are belong to Bayes. In Advances in Neural Information Processing Systems; Larochelle, H., Ranzato, M., Hadsell, R., Balcan, M.F., Lin, H., Eds.; Curran Associates, Inc.: Red Hook, NY, USA, 2020; Volume 33, pp. 18505–18517. [Google Scholar]
- Lv, Y.; Gu, Y.; Xinggao, L. The Dilemma of TriHard Loss and an Element-Weighted TriHard Loss for Person Re-Identification. In Advances in Neural Information Processing Systems; Larochelle, H., Ranzato, M., Hadsell, R., Balcan, M.F., Lin, H., Eds.; Curran Associates, Inc.: Red Hook, NY, USA, 2020; Volume 33, pp. 17391–17402. [Google Scholar]
- Li, X.; Wang, W.; Wu, L.; Chen, S.; Hu, X.; Li, J.; Tang, J.; Yang, J. Generalized Focal Loss: Learning Qualified and Distributed Bounding Boxes for Dense Object Detection. In Advances in Neural Information Processing Systems; Larochelle, H., Ranzato, M., Hadsell, R., Balcan, M.F., Lin, H., Eds.; Curran Associates, Inc.: Red Hook, NY, USA, 2020; Volume 33, pp. 21002–21012. [Google Scholar]
- Shao, S.; Li, Z.; Zhang, T.; Peng, C.; Yu, G.; Zhang, X.; Li, J.; Sun, J. Objects365: A large-scale, high-quality dataset for object detection. In Proceedings of the IEEE/CVF International Conference on Computer Vision, Seoul, Korea, 27 October–2 November 2019; pp. 8430–8439. [Google Scholar]
- Abdelfattah, R.; Wang, X.; Wang, S. TTPLA: An Aerial-Image Dataset for Detection and Segmentation of Transmission Towers and Power Lines. In Computer Vision—ACCV 2020; Ishikawa, H., Liu, C.L., Pajdla, T., Shi, J., Eds.; Springer International Publishing: Cham, Swizerland, 2021; pp. 601–618. [Google Scholar] [CrossRef]
- Xia, G.S.; Bai, X.; Ding, J.; Zhu, Z.; Belongie, S.; Luo, J.; Datcu, M.; Pelillo, M.; Zhang, L. DOTA: A large-scale dataset for object detection in aerial images. In Proceedings of the IEEE Conference on Computer Vision and Pattern Recognition, Salt Lake City, UT, USA, 18–23 June 2018; pp. 3974–3983. [Google Scholar]
- Li, K.; Wan, G.; Cheng, G.; Meng, L.; Han, J. Object detection in optical remote sensing images: A survey and a new benchmark. ISPRS J. Photogramm. Remote Sens. 2020, 159, 296–307. [Google Scholar] [CrossRef]
- Waqas Zamir, S.; Arora, A.; Gupta, A.; Khan, S.; Sun, G.; Shahbaz Khan, F.; Zhu, F.; Shao, L.; Xia, G.S.; Bai, X. iSAID: A Large-scale Dataset for Instance Segmentation in Aerial Images. In Proceedings of the IEEE Conference on Computer Vision and Pattern Recognition Workshops, Long Beach, CA, USA, 16–17 June 2019; pp. 28–37. [Google Scholar]
- Caesar, H.; Bankiti, V.; Lang, A.H.; Vora, S.; Liong, V.E.; Xu, Q.; Krishnan, A.; Pan, Y.; Baldan, G.; Beijbom, O. nuscenes: A multimodal dataset for autonomous driving. In Proceedings of the IEEE/CVF Conference on Computer Vision and Pattern Recognition, Seattle, WA, USA, 14–19 June 2020; pp. 11621–11631. [Google Scholar]
- Geyer, J.; Kassahun, Y.; Mahmudi, M.; Ricou, X.; Durgesh, R.; Chung, A.S.; Hauswald, L.; Pham, V.H.; Mühlegg, M.; Dorn, S.; et al. A2d2: Audi autonomous driving dataset. arXiv 2020, arXiv:2004.06320. [Google Scholar]
- Sun, P.; Kretzschmar, H.; Dotiwalla, X.; Chouard, A.; Patnaik, V.; Tsui, P.; Guo, J.; Zhou, Y.; Chai, Y.; Caine, B.; et al. Scalability in perception for autonomous driving: Waymo open dataset. In Proceedings of the IEEE/CVF Conference on Computer Vision and Pattern Recognition, Seattle, WA, USA, 14–19 June 2020; pp. 2446–2454. [Google Scholar]
- Huang, X.; Cheng, X.; Geng, Q.; Cao, B.; Zhou, D.; Wang, P.; Lin, Y.; Yang, R. The apolloscape dataset for autonomous driving. In Proceedings of the IEEE Conference on Computer Vision and Pattern Recognition Workshops, Salt Lake City, UT, USA, 12–18 June 2018; pp. 954–960. [Google Scholar]
- Liu, Z.; Yuan, L.; Weng, L.; Yang, Y. A high resolution optical satellite image dataset for ship recognition and some new baselines. In International Conference on Pattern Recognition Applications and Methods; SCITEPRESS: Porto, Portugal, 2017; Volume 2, pp. 324–331. [Google Scholar]
- Lam, D.; Kuzma, R.; McGee, K.; Dooley, S.; Laielli, M.; Klaric, M.; Bulatov, Y.; McCord, B. Xview: Objects in context in overhead imagery. arXiv 2018, arXiv:1802.07856. [Google Scholar]
- Cheng, G.; Han, J. A survey on object detection in optical remote sensing images. ISPRS J. Photogramm. Remote Sens. 2016, 117, 11–28. [Google Scholar] [CrossRef] [Green Version]
- Liu, L.; Ouyang, W.; Wang, X.; Fieguth, P.; Chen, J.; Liu, X.; Pietikäinen, M. Deep Learning for Generic Object Detection: A Survey. Int. J. Comput. Vis. 2019, 128, 261–318. [Google Scholar] [CrossRef] [Green Version]
- Everingham, M.; Gool, L.V.; Williams, C.K.I.; Winn, J.; Zisserman, A. The Pascal Visual Object Classes (VOC) Challenge. Int. J. Comput. Vis. 2009, 88, 303–338. [Google Scholar] [CrossRef] [Green Version]
- Lin, T.Y.; Maire, M.; Belongie, S.; Hays, J.; Perona, P.; Ramanan, D.; Dollár, P.; Zitnick, C.L. Microsoft COCO: Common Objects in Context. In Computer Vision—ECCV 2014; Fleet, D., Pajdla, T., Schiele, B., Tuytelaars, T., Eds.; Springer International Publishing: Cham, Swizerland, 2014; pp. 740–755. [Google Scholar]
- Geiger, A.; Lenz, P.; Stiller, C.; Urtasun, R. Vision meets robotics: The kitti dataset. Int. J. Robot. Res. 2013, 32, 1231–1237. [Google Scholar] [CrossRef] [Green Version]
- Amodei, D.; Olah, C.; Steinhardt, J.; Christiano, P.; Schulman, J.; Mané, D. Concrete Problems in AI Safety. arXiv 2016, arXiv:1606.06565. [Google Scholar]
- Sünderhauf, N.; Brock, O.; Scheirer, W.; Hadsell, R.; Fox, D.; Leitner, J.; Upcroft, B.; Abbeel, P.; Burgard, W.; Milford, M.; et al. The limits and potentials of deep learning for robotics. Int. J. Robot. Res. 2018, 37, 405–420. [Google Scholar] [CrossRef] [Green Version]
- Hall, D.; Dayoub, F.; Skinner, J.; Zhang, H.; Miller, D.; Corke, P.; Carneiro, G.; Angelova, A.; Sünderhauf, N. Probabilistic Object Detection: Definition and Evaluation. In Proceedings of the 2020 IEEE Winter Conference on Applications of Computer Vision (WACV), Snowmass Village, CO, USA, 1–5 March 2020; pp. 1031–1040. [Google Scholar] [CrossRef]
- Bochkovskiy, A.; Wang, C.Y.; Liao, H.Y.M. YOLOv4: Optimal Speed and Accuracy of Object Detection. arXiv 2020, arXiv:2004.10934. [Google Scholar]
- Shivappriya, S.N.; Priyadarsini, M.J.P.; Stateczny, A.; Puttamadappa, C.; Parameshachari, B.D. Cascade Object Detection and Remote Sensing Object Detection Method Based on Trainable Activation Function. Remote Sens. 2021, 13, 200. [Google Scholar] [CrossRef]
- Bodla, N.; Singh, B.; Chellappa, R.; Davis, L.S. Soft-NMS — Improving Object Detection with One Line of Code. In Proceedings of the 2017 IEEE International Conference on Computer Vision (ICCV), Venice, Italy, 22–29 October 2017; pp. 5562–5570. [Google Scholar] [CrossRef] [Green Version]
- Liu, W.; Anguelov, D.; Erhan, D.; Szegedy, C.; Reed, S.; Fu, C.Y.; Berg, A.C. SSD: Single Shot MultiBox Detector. In Computer Vision – ECCV 2016; Leibe, B., Matas, J., Sebe, N., Welling, M., Eds.; Springer International Publishing: Cham, Swizerland, 2016; pp. 21–37. [Google Scholar]
- Zhou, X.; Wang, D.; Krähenbühl, P. Objects as points. arXiv 2019, arXiv:1904.07850. [Google Scholar]
- Carion, N.; Massa, F.; Synnaeve, G.; Usunier, N.; Kirillov, A.; Zagoruyko, S. End-to-End Object Detection with Transformers. arXiv 2020, arXiv:2005.12872. [Google Scholar]
- Tan, M.; Pang, R.; Le, Q.V. Efficientdet: Scalable and efficient object detection. In Proceedings of the IEEE/CVF Conference on Computer Vision and Pattern Recognition, Seattle, WA, USA, 14–19 June 2020; pp. 10781–10790. [Google Scholar]
- Lee, Y.; Hwang, J.W.; Lee, S.; Bae, Y.; Park, J. An Energy and GPU-Computation Efficient Backbone Network for Real-Time Object Detection. In Proceedings of the IEEE Conference on Computer Vision and Pattern Recognition Workshops, Long Beach, CA, USA, 14–17 June 2019. [Google Scholar]
- Lee, Y.; Park, J. Centermask: Real-time anchor-free instance segmentation. In Proceedings of the IEEE/CVF Conference on Computer Vision and Pattern Recognition, Seattle, WA, USA, 13–19 June 2020; pp. 13906–13915. [Google Scholar]
- Lin, T.Y.; Goyal, P.; Girshick, R.; He, K.; Dollár, P. Focal loss for dense object detection. In Proceedings of the IEEE International Conference on Computer Vision, Venice, Italy, 22–29 October 2017; pp. 2980–2988. [Google Scholar]
- Redmon, J.; Farhadi, A. YOLO9000: Better, faster, stronger. In Proceedings of the IEEE Conference on Computer Vision and Pattern Recognition, Honolulu, HI, USA, 21–26 July 2017; pp. 7263–7271. [Google Scholar]
- Redmon, J.; Farhadi, A. Yolov3: An incremental improvement. arXiv 2018, arXiv:1804.02767. [Google Scholar]
- Wang, C.Y.; Bochkovskiy, A.; Liao, H.Y.M. Scaled-YOLOv4: Scaling Cross Stage Partial Network. arXiv 2020, arXiv:2011.08036. [Google Scholar]
- Jocher, G.; Stoken, A.; Borovec, J.; Changyu, L.; Hogan, A.; Diaconu, L.; Ingham, F.; Poznanski, J.; Fang, J.; Yu, L.; et al. ultralytics/yolov5: v3.1—Bug Fixes and Performance Improvements. Zenodo 2020. [Google Scholar] [CrossRef]
- Bolya, D.; Zhou, C.; Xiao, F.; Lee, Y.J. Yolact: Real-time instance segmentation. In Proceedings of the IEEE/CVF International Conference on Computer Vision, Seoul, Korea, 27 October–2 November 2019; pp. 9157–9166. [Google Scholar]
- He, K.; Zhang, X.; Ren, S.; Sun, J. Deep residual learning for image recognition. In Proceedings of the IEEE Conference on Computer Vision and Pattern Recognition, Las Vegas, NV, USA, 27–30 June 2016; pp. 770–778. [Google Scholar]
- Padilla, R.; Passos, W.L.; Dias, T.L.B.; Netto, S.L.; da Silva, E.A.B. A Comparative Analysis of Object Detection Metrics with a Companion Open-Source Toolkit. Electronics 2021, 10, 279. [Google Scholar] [CrossRef]
- Geirhos, R.; Rubisch, P.; Michaelis, C.; Bethge, M.; Wichmann, F.A.; Brendel, W. ImageNet-trained CNNs are biased towards texture; increasing shape bias improves accuracy and robustness. arXiv 2018, arXiv:1811.12231v1. [Google Scholar]
- Zhang, R. Making Convolutional Networks Shift-Invariant Again. In Proceedings of the 36th International Conference on Machine Learning, Long Beach, CA, USA, 9–15 June 2019; Volume 97, pp. 7324–7334. [Google Scholar]
- Wiyatno, R.R.; Xu, A. Physical adversarial textures that fool visual object tracking. In Proceedings of the IEEE/CVF International Conference on Computer Vision, Seoul, Korea, 27–28 October 2019; pp. 4822–4831. [Google Scholar]
- Yang, C.; Kortylewski, A.; Xie, C.; Cao, Y.; Yuille, A. Patchattack: A black-box texture-based attack with reinforcement learning. In European Conference on Computer Vision; Springer: Berlin/Heidelberg, Germany, 2020; pp. 681–698. [Google Scholar]
- Wu, Z.; Lim, S.N.; Davis, L.S.; Goldstein, T. Making an invisibility cloak: Real world adversarial attacks on object detectors. In European Conference on Computer Vision; Springer: Berlin/Heidelberg, Germany, 2020; pp. 1–17. [Google Scholar]
- Ammirato, P.; Berg, A.C. A Mask-RCNN Baseline for Probabilistic Object Detection. arXiv 2019, arXiv:1908.03621. [Google Scholar]
- Zhang, J.; Xie, Z.; Sun, J.; Zou, X.; Wang, J. A Cascaded R-CNN With Multiscale Attention and Imbalanced Samples for Traffic Sign Detection. IEEE Access 2020, 8, 29742–29754. [Google Scholar] [CrossRef]
Figure 1.
Example of a typical graphical model comparison on the COCO test set (data from Bochkovskiy et al. (2020) [31]).
Figure 1.
Example of a typical graphical model comparison on the COCO test set (data from Bochkovskiy et al. (2020) [31]).

Figure 2.
COCO mAP results of models selected (bigger models).

Figure 3.
COCO mAP results of models selected (smaller models).

Figure 4.
Comparison of number of bounding boxes predicted by selected models.

Figure 5.
PDQ curves of selected subset of models.

Figure 6.
PDQ results of CenterNet on the COCO dataset.

Figure 7.
PDQ results of DETR on the COCO dataset.

Figure 8.
PDQ results of EfficientDet on the COCO dataset.

Figure 9.
PDQ results of Faster R-CNN on the COCO dataset.

Figure 10.
PDQ results of NanoDet on the COCO dataset.

Figure 11.
PDQ results of RetinaNet on the COCO dataset.

Figure 12.
PDQ results of SSD on the COCO dataset.

Figure 13.
PDQ results of YOLOv{2,3} on the COCO dataset.

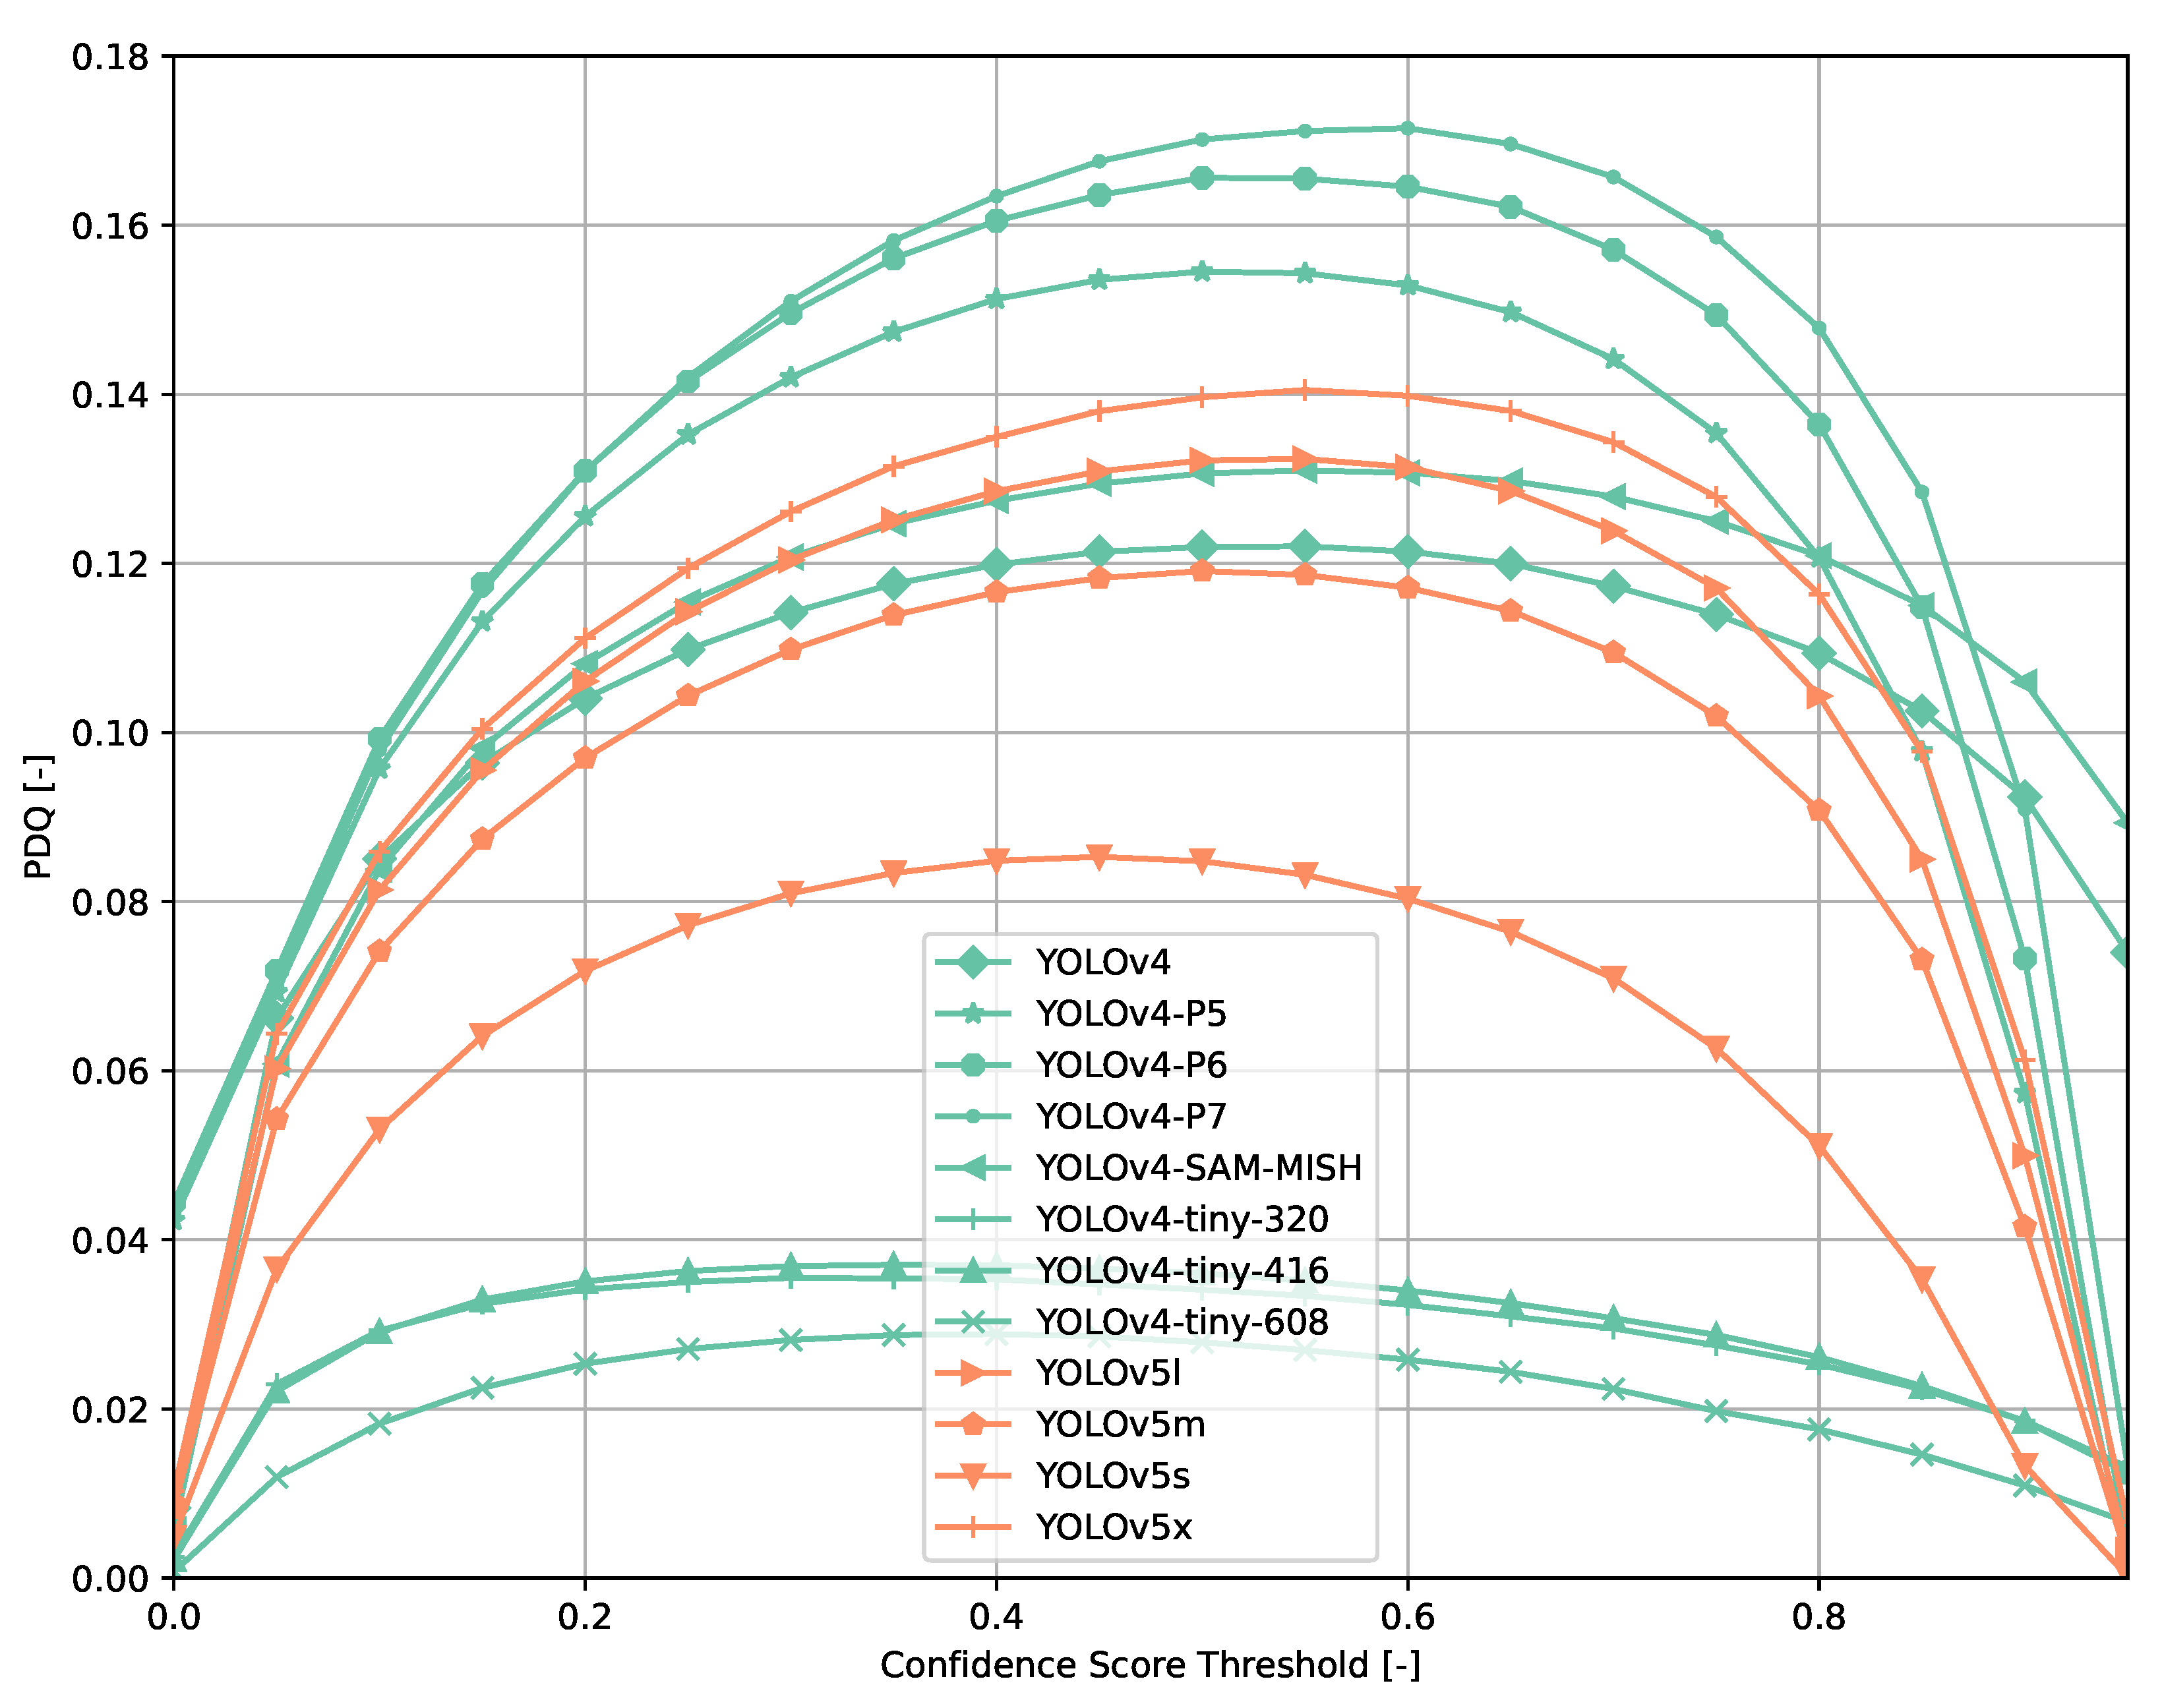
Figure 14.
PDQ results of YOLOv{4, 5} on the COCO dataset.

Figure 15.
PDQ results on TTPLA.

Figure 16.
PDQ results on TTPLA (power lines excluded from evaluation).


Table 1.
Models selected for evaluation.
Table 2.
COCO metrics comparison at PDQmax.
| Model | Confidence | PDQ(max) | Spatial | Label | mAP(max) | mAP | ∆mAP | mAP50 | mAP75 | mAPs | mAPm | mAPl | TP | FP | FN |
|---|---|---|---|---|---|---|---|---|---|---|---|---|---|---|---|
| Threshold | (PDQ) | (PDQ) | |||||||||||||
| [%] | [%] | [%] | [%] | [%] | [%] | [p.p.] | [%] | [%] | [%] | [%] | [%] | ||||
| CenterNet-1024-HG104 | 40 | 11.77 | 21.18 | 64.03 | 44.47 | 34.33 | 10.14 | 44.61 | 38.29 | 19.80 | 36.08 | 44.60 | 17,590. | 4611 | 19,191 |
| CenterNet-512-R101 | 45 | 9.26 | 17.75 | 69.31 | 34.23 | 27.28 | 6.96 | 37.81 | 29.74 | 8.10 | 29.58 | 44.49 | 14,781 | 4169 | 22,000 |
| CenterNet-512-R50v1 | 40 | 7.60 | 14.72 | 62.74 | 31.29 | 25.35 | 5.94 | 36.62 | 27.87 | 8.67 | 27.46 | 40.44 | 15,257 | 6563 | 21,524 |
| CenterNet-512-R50v2 | 40 | 7.11 | 14.64 | 62.84 | 29.53 | 23.94 | 5.60 | 34.39 | 26.17 | 7.10 | 26.07 | 39.46 | 13,840 | 5287 | 22,941 |
| DETR-R101 | 95 | 12.30 | 17.07 | 97.41 | 43.49 | 35.62 | 7.87 | 49.74 | 38.69 | 15.14 | 39.11 | 53.25 | 18,136 | 5194 | 18,645 |
| DETR-R101-DC5 | 95 | 13.96 | 19.54 | 97.58 | 44.90 | 37.01 | 7.89 | 50.81 | 40.13 | 16.52 | 40.74 | 54.52 | 18,791 | 5374 | 17,990 |
| DETR-R50 | 95 | 12.83 | 18.86 | 97.44 | 42.01 | 33.97 | 8.04 | 47.63 | 36.65 | 14.18 | 36.76 | 52.36 | 17,387 | 4553 | 19,394 |
| DETR-R50-DC5 | 95 | 14.07 | 20.50 | 97.34 | 43.27 | 35.01 | 8.27 | 48.59 | 37.92 | 15.61 | 38.65 | 51.38 | 18,179 | 5062 | 18,602 |
| EfficientDet-D0 | 40 | 7.20 | 13.38 | 66.97 | 33.48 | 27.58 | 5.91 | 39.02 | 30.90 | 6.00 | 31.04 | 47.84 | 14,249 | 4567 | 22,532 |
| EfficientDet-D1 | 45 | 8.47 | 15.03 | 70.46 | 39.18 | 30.92 | 8.26 | 41.75 | 34.64 | 8.08 | 35.40 | 50.42 | 14,720 | 3538 | 22,061 |
| EfficientDet-D2 | 45 | 9.54 | 15.92 | 70.31 | 42.52 | 33.51 | 9.01 | 44.65 | 37.20 | 12.71 | 37.71 | 52.97 | 16,034 | 3586 | 20,747 |
| EfficientDet-D3 | 45 | 10.82 | 16.60 | 71.75 | 45.87 | 36.75 | 9.12 | 48.14 | 40.75 | 16.15 | 40.65 | 55.66 | 17,634 | 4065 | 19,147 |
| EfficientDet-D4 | 40 | 11.30 | 16.65 | 68.44 | 49.13 | 40.64 | 8.49 | 53.35 | 45.07 | 20.22 | 45.33 | 58.99 | 19,239 | 4897 | 17,542 |
| EfficientDet-D5 | 45 | 12.01 | 17.56 | 71.36 | 50.45 | 40.47 | 9.99 | 52.52 | 44.76 | 21.42 | 44.67 | 57.60 | 18,921 | 4178 | 17,860 |
| EfficientDet-D6 | 45 | 12.13 | 17.05 | 71.67 | 51.10 | 41.26 | 9.85 | 53.27 | 45.74 | 21.98 | 45.12 | 59.22 | 19,631 | 4415 | 17,150 |
| EfficientDet-D7 | 45 | 12.46 | 17.37 | 72.67 | 53.07 | 43.05 | 10.01 | 55.37 | 47.32 | 23.77 | 47.07 | 60.67 | 19,762 | 4521 | 17,019 |
| Faster-R-CNN-MobileNetV2 | 70 | 8.42 | 12.63 | 89.85 | 33.18 | 25.98 | 7.20 | 39.08 | 28.90 | 11.97 | 27.15 | 36.25 | 16,379 | 6658 | 20,402 |
| Faster-R-CNN-R101-FPN | 75 | 12.36 | 16.67 | 92.84 | 42.42 | 34.86 | 7.55 | 49.06 | 39.04 | 17.06 | 38.59 | 48.15 | 19,174 | 6048 | 17,607 |
| Faster-R-CNN-R50-FPN | 75 | 11.51 | 15.81 | 92.61 | 40.52 | 33.09 | 7.42 | 47.39 | 37.27 | 15.32 | 36.52 | 46.14 | 18,523 | 6168 | 18,258 |
| Faster-R-CNN-V2-19-DW-FPNLite | 75 | 10.01 | 14.14 | 91.95 | 37.08 | 29.10 | 7.98 | 42.89 | 32.73 | 14.71 | 31.54 | 39.32 | 17,233 | 5423 | 19,548 |
| Faster-R-CNN-V2-19-FPN | 75 | 10.53 | 14.30 | 92.20 | 39.20 | 31.32 | 7.88 | 45.60 | 34.98 | 16.34 | 33.77 | 42.13 | 18,209 | 6011 | 18,572 |
| Faster-R-CNN-V2-19-FPNLite | 75 | 10.74 | 14.76 | 92.41 | 39.13 | 31.34 | 7.79 | 45.69 | 34.98 | 16.39 | 33.99 | 42.66 | 18,132 | 5900 | 18,649 |
| Faster-R-CNN-V2-19-Slim-DW | 70 | 8.52 | 12.50 | 89.81 | 32.57 | 25.52 | 7.05 | 39.01 | 28.46 | 11.73 | 26.88 | 35.16 | 16,518 | 6380 | 20,263 |
| Faster-R-CNN-V2-19-Slim-FPNLite | 75 | 9.40 | 13.67 | 91.61 | 35.40 | 27.22 | 8.18 | 40.51 | 30.36 | 13.71 | 28.41 | 37.40 | 16,732 | 5594 | 20,049 |
| Faster-R-CNN-V2-39-FPN | 75 | 12.31 | 16.29 | 93.06 | 43.09 | 35.41 | 7.69 | 50.12 | 39.65 | 18.61 | 38.85 | 47.75 | 19,408 | 5916 | 17,373 |
| Faster-R-CNN-V2-57-FPN | 75 | 12.72 | 16.64 | 93.16 | 43.70 | 35.97 | 7.73 | 50.74 | 40.10 | 18.97 | 39.61 | 49.25 | 19,689 | 6010 | 17,092 |
| Faster-R-CNN-V2-99-FPN | 75 | 13.11 | 17.02 | 93.45 | 44.59 | 36.78 | 7.81 | 51.50 | 41.09 | 18.85 | 39.97 | 50.98 | 19,808 | 5781 | 16,973 |
| Faster-R-CNN-X101-FPN | 80 | 12.91 | 17.20 | 94.55 | 43.58 | 35.78 | 7.80 | 49.87 | 40.13 | 18.26 | 38.89 | 49.07 | 19,171 | 5485 | 17,610 |
| NanoDet-m-320 | 40 | 4.25 | 11.75 | 57.35 | 20.57 | 16.45 | 4.12 | 25.70 | 17.47 | 2.21 | 14.40 | 30.02 | 10,322 | 5150 | 26,459 |
| NanoDet-m-416 | 40 | 4.44 | 10.76 | 57.34 | 21.65 | 17.66 | 3.99 | 28.12 | 18.70 | 4.08 | 17.47 | 28.52 | 11,974 | 7035 | 24,807 |
| NanoDet-m-608 | 45 | 4.25 | 10.60 | 59.03 | 18.75 | 14.29 | 4.47 | 23.72 | 14.79 | 5.32 | 17.00 | 19.42 | 11,542 | 6058 | 25,239 |
| RetinaNet-R101-FPN | 55 | 11.57 | 19.38 | 78.03 | 40.41 | 32.03 | 8.38 | 44.15 | 35.67 | 13.92 | 35.88 | 44.42 | 16,700 | 4287 | 20,081 |
| RetinaNet-R50-FPN | 50 | 10.67 | 17.83 | 75.03 | 38.69 | 31.61 | 7.08 | 44.32 | 35.20 | 14.11 | 34.80 | 44.27 | 17,285 | 5899 | 19,496 |
| SSD-MobileNetV2-320 | 55 | 3.83 | 9.79 | 66.54 | 20.24 | 16.35 | 3.89 | 25.98 | 17.43 | 1.13 | 11.26 | 36.49 | 10,357 | 7059 | 26,424 |
| SSD-MobileNetV2-320-FPN | 40 | 3.90 | 9.55 | 58.11 | 22.25 | 18.49 | 3.76 | 29.07 | 20.22 | 1.39 | 17.91 | 35.03 | 10,793 | 5683 | 25,988 |
| SSD-R101-640 | 45 | 7.50 | 14.61 | 64.01 | 35.60 | 28.28 | 7.32 | 39.60 | 31.83 | 8.28 | 30.93 | 45.02 | 14,440 | 4553 | 22,341 |
| SSD-R152-640 | 45 | 7.40 | 14.39 | 64.11 | 35.40 | 27.99 | 7.42 | 39.10 | 31.36 | 8.16 | 30.22 | 45.63 | 14,302 | 4587 | 22,479 |
| SSD-R50-640 | 45 | 6.94 | 13.82 | 63.35 | 34.19 | 26.79 | 7.40 | 37.92 | 30.25 | 8.22 | 28.63 | 43.29 | 13,961 | 4613 | 22,820 |
| YOLOv2 | 45 | 4.45 | 6.63 | 68.93 | 29.39 | 24.41 | 4.98 | 42.13 | 25.69 | 6.44 | 28.16 | 40.53 | 14,358 | 5053 | 22,423 |
| YOLOv2-tiny-320 | 45 | 0.88 | 2.81 | 67.46 | 9.54 | 6.96 | 2.57 | 15.69 | 5.16 | 0.33 | 4.64 | 15.40 | 5957 | 8631 | 30,824 |
| YOLOv2-tiny-416 | 45 | 0.90 | 2.47 | 66.90 | 10.53 | 7.71 | 2.82 | 17.75 | 5.52 | 0.67 | 6.75 | 15.55 | 6774 | 9287 | 30,007 |
| YOLOv2-tiny-608 | 45 | 0.86 | 2.20 | 64.86 | 9.59 | 6.84 | 2.74 | 16.93 | 4.18 | 1.66 | 9.16 | 10.04 | 7263 | 9127 | 29,518 |
| YOLOv3 | 55 | 7.18 | 9.01 | 88.61 | 38.84 | 30.16 | 8.68 | 48.99 | 33.48 | 16.69 | 33.11 | 42.04 | 17,811 | 6670 | 18,970 |
| YOLOv3-spp | 40 | 8.16 | 10.68 | 78.20 | 42.59 | 33.20 | 9.39 | 49.47 | 38.02 | 16.96 | 34.60 | 48.09 | 18,121 | 5426 | 18,660 |
| YOLOv3-tiny-320 | 30 | 1.21 | 3.85 | 62.36 | 8.56 | 6.23 | 2.33 | 11.27 | 6.46 | 0.02 | 1.98 | 19.19 | 6513 | 6668 | 30,268 |
| YOLOv3-tiny-416 | 30 | 1.26 | 3.57 | 60.18 | 9.65 | 6.68 | 2.97 | 12.35 | 6.49 | 0.04 | 4.75 | 18.52 | 7423 | 7047 | 29,358 |
| YOLOv3-tiny-608 | 30 | 1.27 | 3.59 | 58.37 | 9.46 | 6.20 | 3.26 | 11.95 | 5.67 | 0.24 | 9.48 | 11.93 | 7811 | 7261 | 28,970 |
| YOLOv4 | 55 | 12.20 | 15.72 | 86.27 | 50.50 | 40.13 | 10.38 | 54.63 | 46.24 | 23.10 | 46.01 | 53.27 | 19,103 | 3896 | 17,678 |
| YOLOv4-P5 | 50 | 15.45 | 22.74 | 77.57 | 50.75 | 41.55 | 9.20 | 53.43 | 46.13 | 21.68 | 47.06 | 56.69 | 20,163 | 4926 | 16,618 |
| YOLOv4-P6 | 50 | 16.56 | 23.34 | 78.62 | 53.41 | 44.91 | 8.49 | 57.42 | 49.51 | 25.83 | 50.12 | 60.84 | 21,455 | 5451 | 15,326 |
| YOLOv4-P7 | 60 | 17.15 | 24.58 | 82.58 | 54.63 | 44.25 | 10.38 | 55.55 | 48.65 | 22.50 | 50.34 | 62.37 | 20,053 | 3862 | 16,728 |
| YOLOv4-SAM-MISH | 55 | 13.10 | 15.42 | 88.02 | 55.26 | 45.23 | 10.02 | 61.09 | 52.34 | 29.02 | 51.41 | 59.89 | 20673 | 4097 | 16,108 |
| YOLOv4-tiny-320 | 30 | 3.55 | 7.45 | 68.66 | 20.55 | 16.03 | 4.52 | 27.78 | 16.73 | 2.70 | 17.48 | 28.83 | 10,706 | 5263 | 26,075 |
| YOLOv4-tiny-416 | 35 | 3.70 | 7.10 | 70.73 | 21.97 | 16.53 | 5.44 | 28.64 | 17.23 | 4.80 | 19.91 | 24.84 | 11,366 | 4961 | 25,415 |
| YOLOv4-tiny-608 | 40 | 2.89 | 6.38 | 67.50 | 17.28 | 12.06 | 5.22 | 22.28 | 11.76 | 5.86 | 17.89 | 11.92 | 10,486 | 6737 | 26,295 |
| YOLOv5l | 55 | 13.24 | 20.22 | 78.53 | 47.34 | 38.04 | 9.29 | 49.62 | 42.26 | 18.11 | 44.25 | 52.79 | 18,470 | 4283 | 18,311 |
| YOLOv5m | 50 | 11.91 | 18.51 | 76.45 | 43.88 | 35.66 | 8.22 | 47.87 | 39.45 | 17.07 | 41.59 | 49.02 | 18,166 | 4882 | 18,615 |
| YOLOv5s | 45 | 8.53 | 14.67 | 71.02 | 36.71 | 28.49 | 8.23 | 40.43 | 31.97 | 12.44 | 33.75 | 38.64 | 15,788 | 4614 | 20,993 |
| YOLOv5x | 55 | 14.05 | 20.71 | 79.32 | 48.66 | 40.35 | 8.31 | 52.55 | 44.51 | 20.59 | 46.16 | 56.40 | 19,463 | 4770 | 17,318 |
Publisher’s Note: MDPI stays neutral with regard to jurisdictional claims in published maps and institutional affiliations. |
© 2021 by the authors. Licensee MDPI, Basel, Switzerland. This article is an open access article distributed under the terms and conditions of the Creative Commons Attribution (CC BY) license (https://creativecommons.org/licenses/by/4.0/).
Share and Cite
MDPI and ACS Style
Wenkel, S.; Alhazmi, K.; Liiv, T.; Alrshoud, S.; Simon, M. Confidence Score: The Forgotten Dimension of Object Detection Performance Evaluation. Sensors 2021, 21, 4350. https://0-doi-org.brum.beds.ac.uk/10.3390/s21134350
AMA Style
Wenkel S, Alhazmi K, Liiv T, Alrshoud S, Simon M. Confidence Score: The Forgotten Dimension of Object Detection Performance Evaluation. Sensors. 2021; 21(13):4350. https://0-doi-org.brum.beds.ac.uk/10.3390/s21134350
Chicago/Turabian StyleWenkel, Simon, Khaled Alhazmi, Tanel Liiv, Saud Alrshoud, and Martin Simon. 2021. "Confidence Score: The Forgotten Dimension of Object Detection Performance Evaluation" Sensors 21, no. 13: 4350. https://0-doi-org.brum.beds.ac.uk/10.3390/s21134350
Note that from the first issue of 2016, this journal uses article numbers instead of page numbers. See further details here.